oil & gas market challenges: a trading house perspective€¦ · oil & gas market...
TRANSCRIPT

Unsa
ve
d D
ocu
me
nt
/ 0
1/0
5/2
01
2 /
08
:12
Oil & Gas Market Challenges: A Trading House Perspective
IEA Training Week,
Paris, 7-11 April 2014
Unsa
ve
d D
ocu
me
nt
/ 0
1/0
5/2
01
2 /
08
:12
1
Disclaimer
The information contained in this presentation (the “Presentation”) is being provided by Gunvor Group Ltd (the “Company”) and its subsidiaries (together with the Company, the “Group”). The Presentation is for information purposes only and any information made available orally or in writing at the Presentation is strictly confidential and may not be distributed, published, copied or reproduced (in whole or in part) or disclosed by its recipients to any other person for any purpose, at any time or in any form other than with the prior written consent of the Company.
This Presentation does not constitute or form part of and should not be construed as, any offer or invitation to sell or issue, or any solicitation of any offer to purchase or subscribe for, any securities to any person in any jurisdiction nor shall it (or any part of it), or the fact of its distribution, form the basis of, or be relied on in connection with or act as any recommendation or inducement to enter into, any contract, commitment or investment decision whatsoever relating to any securities. The information contained in this Presentation, unless otherwise specified, is only current as of the date of this Presentation and is subject to further verification and amendment in any way without liability or notice to any person. The information contained in this Presentation has not been independently verified. The Company, all members of the Group and their respective associates or directors, officers, employees, advisers or representatives expressly disclaim any duty, undertaking or obligation to update publicly or release any revisions to any of the information, opinions or forward looking statements contained in this Presentation to reflect any events or circumstances occurring after the date of this Presentation. No undertaking, representation or warranty or other assurance, express or implied, is made or given as to the accuracy, completeness, sufficiency or fairness of the information or opinions contained or expressed in the Presentation or any information made available orally or in writing at the Presentation (or whether any information has been omitted from the Presentation) and, save in the case of fraud, no responsibility or liability is accepted by any person for any loss, cost or damage suffered or incurred as a result of the reliance on such information or opinions or otherwise arising in connection with the Presentation. In addition, no duty of care or otherwise is owed by any person for any loss, cost or damage suffered or incurred as a result of the reliance on such information or opinions or otherwise arising in connection with the Presentation. Recipients of the Presentation should conduct their own investigation, evaluation and analysis of the business, data and property described in the Presentation. This Presentation contains unaudited financial information in relation to the Group.
This presentation includes statements that are, or may be deemed to be, ‘forward-looking statements’. These forward-looking statements can be identified by the use of forward-looking terminology, including the terms ‘targets’, ‘believes’, ‘anticipates’, ‘expects’, ‘estimates’, ‘intends’, ‘plans’, ‘will’, ‘may’, ‘could’ or ‘should’ or similar expressions or by discussions of plans, objectives, goals, strategies, future events or performance and underlying assumptions. These forward-looking statements include matters that are not historical facts or are statements regarding the Company’s intentions, beliefs or current expectations. Forward-looking statements are based on current plans, estimates and projections, and therefore too much reliance should not be placed upon them. Such statements are subject to risks and uncertainties, most of which are difficult to predict and generally beyond the Company's control. If the assumptions underlying any of these statements prove incorrect, the Company’s actual results of operations, financial condition and liquidity and the development of the industry in which the Company operates may materially differ from those made in, or suggested by, the forward-looking statements contained in this Presentation. The Company expressly disclaims any obligation or undertaking publicly to review or confirm analysts expectations or estimates or to release publicly any updates or revisions to any forward-looking statements contained herein to reflect any changes in the Company's expectations with regard thereto or any change in events, conditions or circumstances on which any such statement is based.
This Presentation is not directed to, or intended for distribution to or use by, any person or entity that is a citizen or resident of, or located in, any locality, state, country or other jurisdiction where such distribution or use would be contrary to law or regulation or which would require any registration or licensing within such jurisdiction.

Unsa
ve
d D
ocu
me
nt
/ 0
1/0
5/2
01
2 /
08
:12
2
Oil & Gas Market Challenges: A Trading House Perspective
1. Who are the traders and what do they do?
2. A changing trader business model
3. Dealing with risk & the impact of new regulations
4. New sources & new constraints in oil supply
5. The macro economy & oil demand uncertainty
6. The downstream market dimension
7. Oil price dynamics
8. Evolving gas and coal markets

Unsa
ve
d D
ocu
me
nt
/ 0
1/0
5/2
01
2 /
08
:12
3
A) DEFINING TRADING & THE TRADERS

Unsa
ve
d D
ocu
me
nt
/ 0
1/0
5/2
01
2 /
08
:12
4
Gunvor History
• 1997: Shareholders open new trading company based in Tallinn, Estonia.
• 2000: Gunvor is formalised.
• 2003: Main trading facilities move to Geneva to take advantage of city’s trading talent.
• 2007: Opened Singapore Office
• 2009: Broaden energy portfolio and moved into coal, natural gas, LNG, power and carbon emissions.
• 2011: Began operations at Ust Luga, world’s largest oil transshipment terminal.
• 2012: Bought former Petroplus refineries in Antwerp and Ingolstadt, becoming in the process a 210 kb/d European refiner

Unsa
ve
d D
ocu
me
nt
/ 0
1/0
5/2
01
2 /
08
:12
5
What is commodity trading?
source: KPMG
• Commodity trading involves the optimisation of arbitrage operations using logistics, ensuring the transformation of stock and facilitating storage and transportation towards points of consumption
• Traders deploy their global logistical presence, access to funding and market intelligence to capitalise on market imbalances & arbitrage opportunities

Unsa
ve
d D
ocu
me
nt
/ 0
1/0
5/2
01
2 /
08
:12
6
Arbitrage, not absolute price, is what counts
Geographical
arbitrage
Price differentials for
same product
between different
locations
Deploy global
logistics network to
source commodity in
one place & ship to
another by tanker,
pipe, truck , rail
Commodity
(transformation)
arbitrage
Price differentials
between grades,
types or blends of
commodities
Exploit differentials
by blending,
processing,
substitution or
conversion (refinery,
power plant)
Time arbitrage Differentiated price
between prompt and
forward delivery
Carry trades via
financing and storage

Unsa
ve
d D
ocu
me
nt
/ 0
1/0
5/2
01
2 /
08
:12
7
Pump It Move It Refine It Store It Sell It Move It
Traders provide liquidity across the supply chain
• The commodity trader paradox:
• Exploit episodes of supply chain imbalance & price volatility
• But, by providing streamlined, cost-effective linkage between suppliers and consumers, they help re-establish physical (& price) equilibrium
Unsa
ve
d D
ocu
me
nt
/ 0
1/0
5/2
01
2 /
08
:12
8
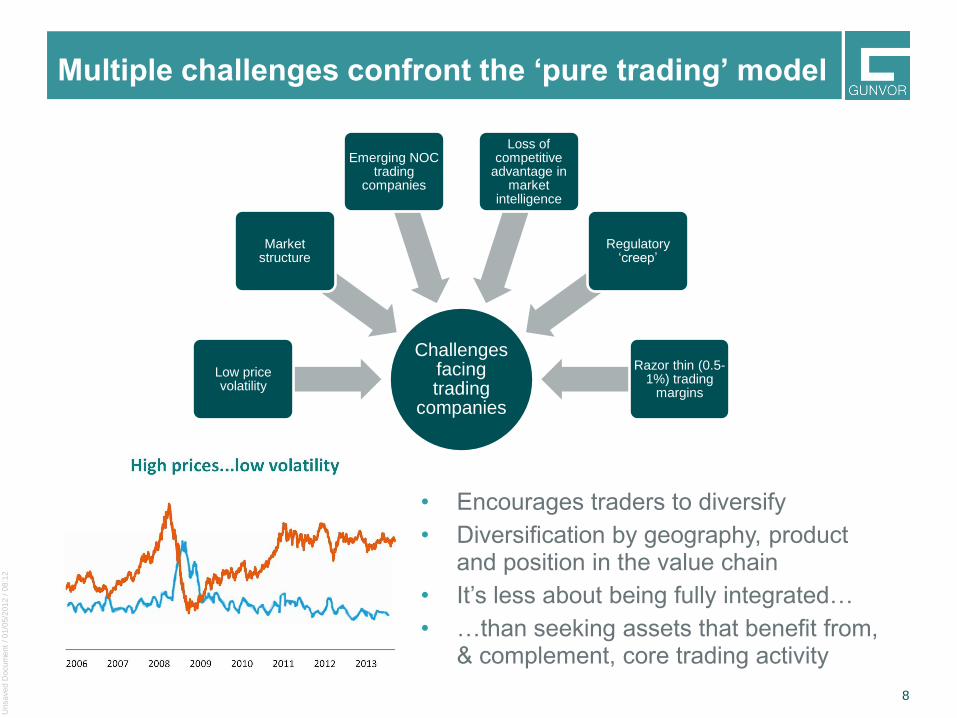
Multiple challenges confront the ‘pure trading’ model
Challenges facing trading
companies
Low price volatility
Market structure
Emerging NOC trading
companies
Loss of competitive
advantage in market
intelligence
Regulatory ‘creep’
Razor thin (0.5-1%) trading
margins
• Encourages traders to diversify
• Diversification by geography, product and position in the value chain
• It’s less about being fully integrated…
• …than seeking assets that benefit from, & complement, core trading activity

Unsa
ve
d D
ocu
me
nt
/ 0
1/0
5/2
01
2 /
08
:12
9
Gunvor: diversifying by product & geography
Asia & Middle East 20%
WesternEurope
North America
Latin America
AfricaAsia & Middle East 30%
Western Europe
North America
Latin America
Africa
2009: USD $50.4 bn 2012: USD $93 bn
Crude Oil
(60%)Fuel Oil
Gasoil
Gasoline
Naphtha
LPG Biofuel
Crude Oil
(30%)
Fuel Oil
Gasoil
NatGas +
LNG
Coal
Gasoline
Naphtha
LPG Biofuel
2009: 110 mn tons 2012: 130 mn tons
Revenue by region
Trading volumes

Unsa
ve
d D
ocu
me
nt
/ 0
1/0
5/2
01
2 /
08
:12
10
Gunvor strategy – integrating along the value chain
• Ust Luga Oil Products Terminal (Russia)
• Ust Luga Crude Pipeline (Russia)
• Karimun Products Terminal JV (Indonesia)
• Novorossiysk Fuel Oil Terminal (Russia)
• Petroterminal de Panama, S.A. (Panama)
• Independent Belgium Refinery BV (Belgium)
• Gunvor Raffinerie Deutschland GmbH (Germany)
• TAL Pipeline (Italy, Austria, Germany)
• Signal Peak (United States)
• LLC Kolmar (Russia)
• Keaton Energy Holdings Ltd (South Africa)
• Lagansky Block (Caspian Sea)
• PA Resources (North Sea, North and West Africa)
Midstream
Downstream
Upstream

Unsa
ve
d D
ocu
me
nt
/ 0
1/0
5/2
01
2 /
08
:12
11
Shift to assets + high prices = rising financing reqs.
• Surge in financing requirements met by either a) public flotation or b) recourse to public debt markets
• Most of the traders have preferred to retain the flexibility, speed of response and risk tolerance afforded by staying private
• But tapping the financial markets has seen trading houses open up to hitherto unprecedented financial and operational scrutiny
Public equity and debt offerings of physical commodity traders, $US billion
Source: First Reserve Corp 2013
?

Unsa
ve
d D
ocu
me
nt
/ 0
1/0
5/2
01
2 /
08
:12
12
Risk management at Gunvor
Commodity Price Risk
• Offset risks on multiple purchase & sale transactions
• 95%+ of physical is hedged
• Already mostly cleared
• VaR traditionally <<1% of equity
Liquidity Risk
• Diversified pool of banks
• Policy of gradually boosting liquidity reserve
Counterparty Risk
• >80% of customers are long-standing
• Conservative credit risk policy
• No material non-payment losses (<0.1% turnover)
Currency Risk
• Trades and borrowings primarily in USD
• Exceptions are gas/LNG, biofuels and operational expenses

Unsa
ve
d D
ocu
me
nt
/ 0
1/0
5/2
01
2 /
08
:12
13
Stretching supply chains and diverse price risks
• Price risk all along the supply chain
• Wellhead to petrol pump for crude & oil products can be anything from 20-90 days
• Risk management tools have to be flexible enough to cover a variety of crude and product qualities…
• …plus transport, storage, processing and blending complexities too
• Does the emerging, post-regulatory slate of risk management & financing tools provide the necessary flexibility?
source: EIG

Unsa
ve
d D
ocu
me
nt
/ 0
1/0
5/2
01
2 /
08
:12
14
Regulatory changes on top of competitive pressures
• The myth of ‘unregulated’ traders (70+ banks, exchanges, natl./intl. regulators)
• Environmental regulations augment existing competitive pressures on EU refining
• Evolving and diverse supply chains require flexible risk hedging tools
• Proposals for position limits, benchmarks/PRAs, swapsclearing, one-size-fits-all disclosure & risk management requirements all pose risks
• Issues: proportionality, recognition of market specifics, international consistency
• Risk of undermining participation, transparency, liquidity, physical market function and, ultimately, raising costs to energy consumers
• Laudable post-2008 G7/G20 policy goals to a) minimise systemic financial risk & b) encourage lower, stable energy prices – but these can sometimes be inconsistent

Unsa
ve
d D
ocu
me
nt
/ 0
1/0
5/2
01
2 /
08
:12
15
Trading houses: are they becoming too big to fail?
• “Commodity trading companies active in multiple markets have used easy access to finance to expand physical
holdings, creating potential ‘systemic’ risk” CEPS/ECMI
• 5 criteria for systemically important entities: large size, financial system interconnections, global reach, complex structure/difficult to unwind, difficult-to-replicate services
FSB consultation document, Jan 2014
• “Traders are less leveraged than banks, have smaller balance sheets, largely short-term liabilities, are not major
providers of credit, and their assets are re-deployable” Pirrong/Trafigura study 2014
• “As highlighted by the collapse of Enron, one of the largest energy trading companies of its time, physical traders are highly unlikely to pose systemic risks - their positions are largely physical, hedged, liquid and short-term. Trading
houses should be allowed to fail and, when they have, there has been little or no disruption to the orderly functioning of
markets or the supply of commodities.” Vitol, 2013
Unsa
ve
d D
ocu
me
nt
/ 0
1/0
5/2
01
2 /
08
:12
16
B) THE OIL & ENERGY MARKET BACKGROUND
Unsa
ve
d D
ocu
me
nt
/ 0
1/0
5/2
01
2 /
08
:12
17
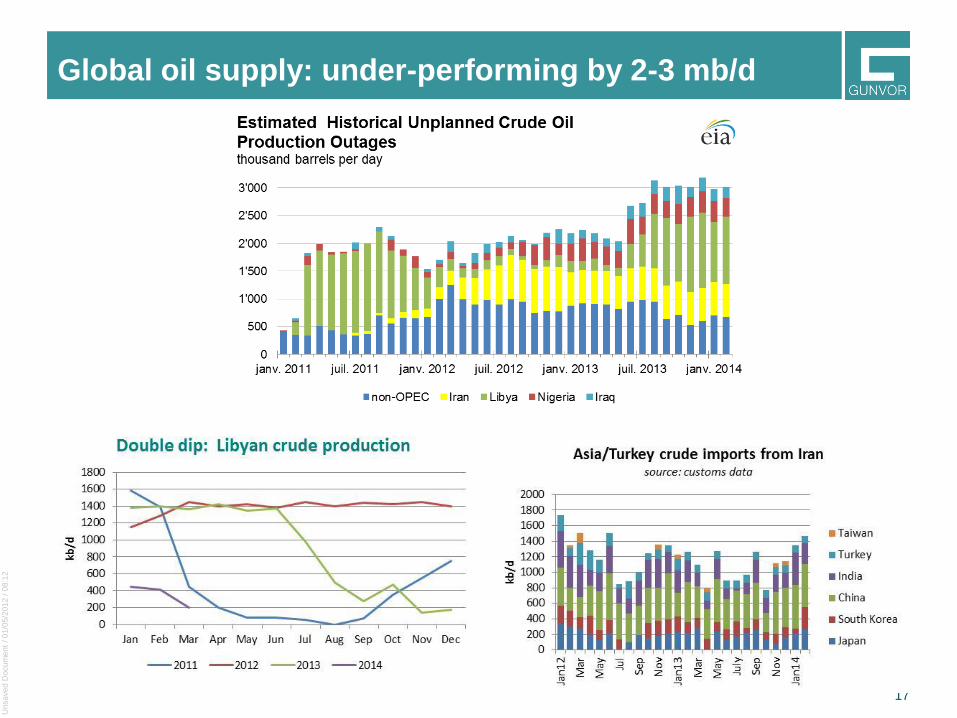
Global oil supply: under-performing by 2-3 mb/d
Unsa
ve
d D
ocu
me
nt
/ 0
1/0
5/2
01
2 /
08
:12
18
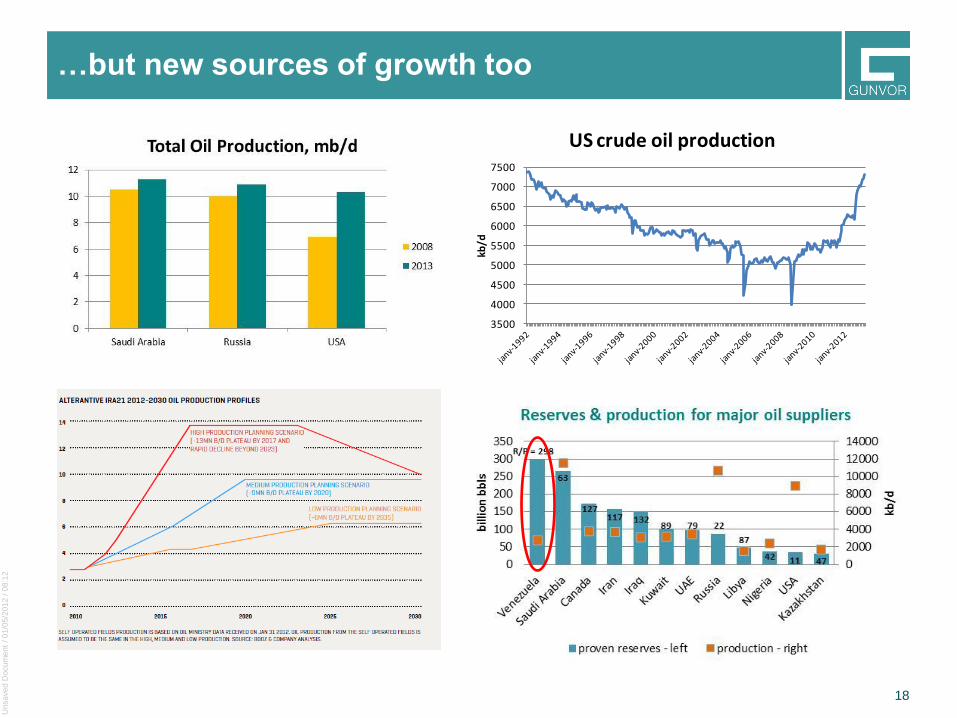
…but new sources of growth too
3500
4000
4500
5000
5500
6000
6500
7000
7500
kb/d
US crude oil production

Unsa
ve
d D
ocu
me
nt
/ 0
1/0
5/2
01
2 /
08
:12
19 19
US shale oil: mixed views on sustainability of growth
Plus points for major growth:
• Resource & reservoir behaviour becoming better understood
• Transport infrastructure is being built-out, belatedly
• High up-front cash flow continues to drive investment if prices stay robust, & there’s scope for cost reduction
• Infill drilling & well spacing improvements
• Technology – pad drilling & longer laterals
Risks:
• Energy security concerns impede decisions on export policy, logistics
• Macro-slow down, oil price risk & refinery tolerance if exports restricted
• Sweet spots targeted first, so yields could fall & costs could also rise
• Sufficient skilled workforce & supply chain resilience?
• Tighter env.reg. – flaring/fracking/rail restrictions, access to Federal lands
• Types of operators & availability of finance – nb rising interest rates
Light tight oil will continue to grow, but more slowly
Unsa
ve
d D
ocu
me
nt
/ 0
1/0
5/2
01
2 /
08
:12
20
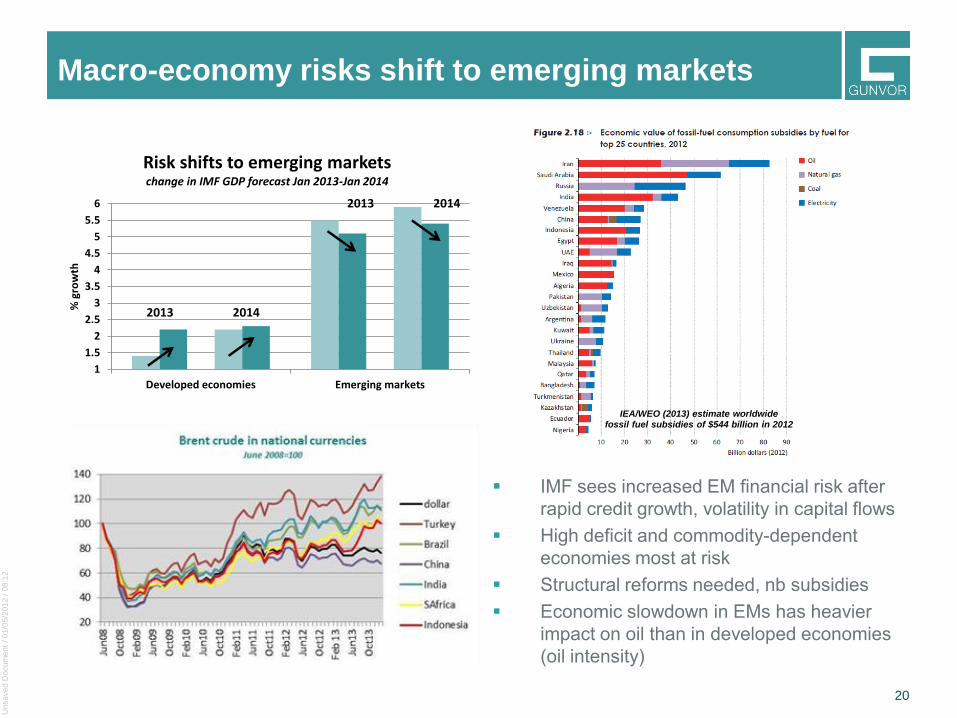
Macro-economy risks shift to emerging markets
1
1.5
2
2.5
3
3.5
4
4.5
5
5.5
6
Developed economies Emerging markets
% g
row
th
Risk shifts to emerging marketschange in IMF GDP forecast Jan 2013-Jan 2014
2013 2014
2013 2014
IEA/WEO (2013) estimate worldwide fossil fuel subsidies of $544 billion in 2012
IMF sees increased EM financial risk after
rapid credit growth, volatility in capital flows
High deficit and commodity-dependent
economies most at risk
Structural reforms needed, nb subsidies
Economic slowdown in EMs has heavier
impact on oil than in developed economies
(oil intensity)
Unsa
ve
d D
ocu
me
nt
/ 0
1/0
5/2
01
2 /
08
:12
21
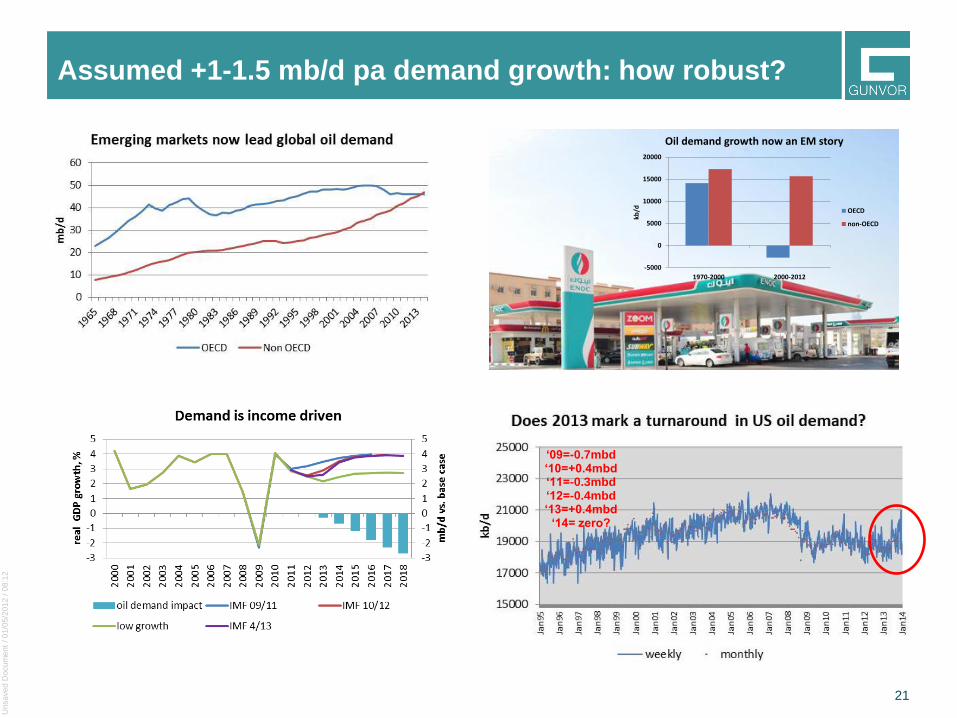
Assumed +1-1.5 mb/d pa demand growth: how robust?
-5000
0
5000
10000
15000
20000
1970-2000 2000-2012
kb/d
Oil demand growth now an EM story
OECD
non-OECD
‘09=-0.7mbd ‘10=+0.4mbd ‘11=-0.3mbd ‘12=-0.4mbd ‘13=+0.4mbd
‘14= zero?

Unsa
ve
d D
ocu
me
nt
/ 0
1/0
5/2
01
2 /
08
:12
22
Challenging refining environment, notably in Europe

Unsa
ve
d D
ocu
me
nt
/ 0
1/0
5/2
01
2 /
08
:12
23
But midstream & downstream opportunity too
• Distressed European refining assets: integrate with trading, and optimise
• New refining hubs (N.America, Mid.East), India & China also emerge as key exporters
• Global products trade growing faster than crude, much of it on new, long haul routes
• Products tanker order book is rising (86% of new orders in 2013)
• Opportunities for refiner-traders: access to flow, flexible operations, diversified arbitrage opportunities, aggressive hedging strategy
Teesside
Grangemouth
(Petrochina)
Stanlow:
Essar -> Shell
Milford Haven
WhitegateCoryton
Gothenburg:
Shell -> St1
Harburg
Heide:
Shell -> Klesch
Wilhelmshaven
Vlissigen (Lukoil)
Gonfreville-l’Orcher
Antwerp: Petroplus -> Vitol; Petroplus GunvorGelsenkirchen (Rosneft)
Dunkirk
Ingolstadt:
Petroplus -> Gunvor
Karlsruhe (Rosneft)
Lavera (Petrochina)
Berre-l’Étang
ReichstettPetite-Couronne
Priloi & Melilli (Lukoil)
Milazzo (Kuwait Petroleum)Saras
(Rosneft)
Rome
Cremona
Cressier
Petroplus -> Vitol
Ballshi
Fieri
Szazhalombatta
(Surgutneftegaz)
Brod (Zarubezneft)
Novi Sad (Gazprom)
Pancevo (Gazprom)
Gibraltar
(IPIC)
Huelva
(IPIC)
Capacity
ReductionTerminal
Closure For Sale
Sale
(Part)Owned Russian/Indian/
Chinese/ Middle Eastern
Burgas (Lukoil)
Mantova

Unsa
ve
d D
ocu
me
nt
/ 0
1/0
5/2
01
2 /
08
:12
24
How long will range-bound prices persist?
• Macro-economic uncertainty and geopolitical risk/supply outages providing price ceiling & floor
• Market ‘colour’ coming from other, sometimes highly specific, policy-related events

Unsa
ve
d D
ocu
me
nt
/ 0
1/0
5/2
01
2 /
08
:12
25
Costs & IOC/state reqs. provide price floor
• US light tight oil, ‘big-ticket’ IOC upstream developments and OPEC budgets all require prices at or above $80/bbl
• Long dated Brent steady in $85-$95/bbl range, leaving front of the curve to oscillate in a $100-$120 range
Saudi Arabia budget break-even prices Source: Credit Suisse

Unsa
ve
d D
ocu
me
nt
/ 0
1/0
5/2
01
2 /
08
:12
26
Gas markets remain regional, globalising slowly
source: IGU, 2014

Unsa
ve
d D
ocu
me
nt
/ 0
1/0
5/2
01
2 /
08
:12
27
Coal challenged, but won’t disappear overnight
Source: IEA World Energy Outlook, 2013
source: ExxonMobil, Energy Outlook 2013
Which sector drives future energy demand growth?

Unsa
ve
d D
ocu
me
nt
/ 0
1/0
5/2
01
2 /
08
:12
29
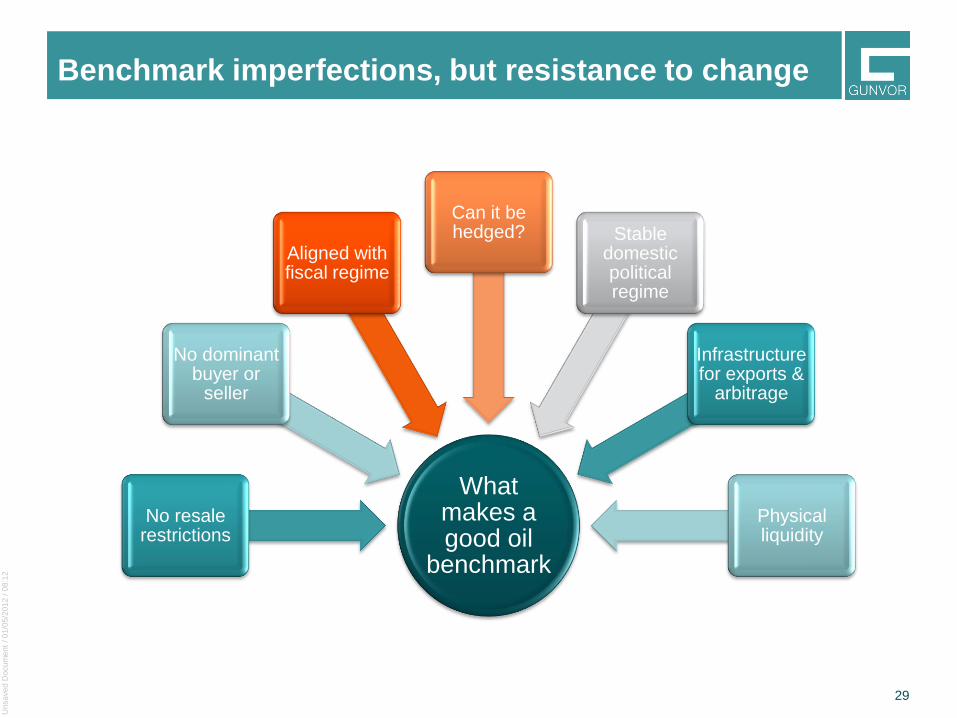
Benchmark imperfections, but resistance to change
What makes a good oil
benchmark
No resale restrictions
No dominant buyer or
seller
Aligned with fiscal regime
Can it be hedged? Stable
domestic political regime
Infrastructure for exports &
arbitrage
Physical liquidity

Unsa
ve
d D
ocu
me
nt
/ 0
1/0
5/2
01
2 /
08
:12
30
Changing oil demand dynamics