oil india limited · 1959 1981 1999 2009 2010 2013 2014 completes fifty years raised offshore fcb...
TRANSCRIPT

Oil India LimitedInvestor Presentation
November, 2016

Table of Contents
1
Company Background
Asset Overview
Strategic Strengths
Operating and Financial Performance
Growth Strategy
Company background

Oil India Ltd.: An Introduction
Rich Heritage
Integrated & fully serviced Oil & Gas Co.
Domestic and Global Presence
Strong Reserve Base
Consistent Growth and Robust Balance Sheet
S Over 5 decades of presence in oil & gas sectorS Owns and operates a fully-automated cross country
crude oil pipeline
S Presence across Oil & Gas Value ChainS Integrated infrastructure and In-house expertise
S Domestic: 39 blocks; 23,722 sq. km S International: 15 blocks; 77,972 sq. km
S 2P reserves: Oil – 80.74 MMT, Gas – 119.45 BCM S Reserve replacement ratio consistently well over 100%
S Q1 FY17 Revenue: Rs.2,461 crore, PAT: Rs.494 crore S FY16 Revenue: Rs.11,141 crore, PAT: Rs.2,330 crore
Strong Parentage with Govt. of India
S Senior management team with strong in-house technical expertise in Company’s core business
Experienced Management Team
S GoI ownership of 67.64%S Awarded ‘Navratna’ status in 2010
2

Participates first time in NELP
Became wholly owned Government of India
enterprise
IPO –RaisedRs.2777 crore.Listed in Stock
Exchanges
Awarded NavratnaStatus
Formed as a JV with Burmah Oil Company
Milestones and Track Record
Acquisition in Rovuma Offshore Block in Mozambique and License 61 Block in Russia
‘Baa2’ Credit Rating by Moody's and BBB-
by Fitch
10% OFS by GoI(Rs.3,145 crore)
1959 1981 1999 2009 2010 2013 2014
Completes fifty yearsRaised offshore
FCB of US$ 1 billion
3
2016
Acquisition in TYNGD and JSC Vankorneft in
Russia
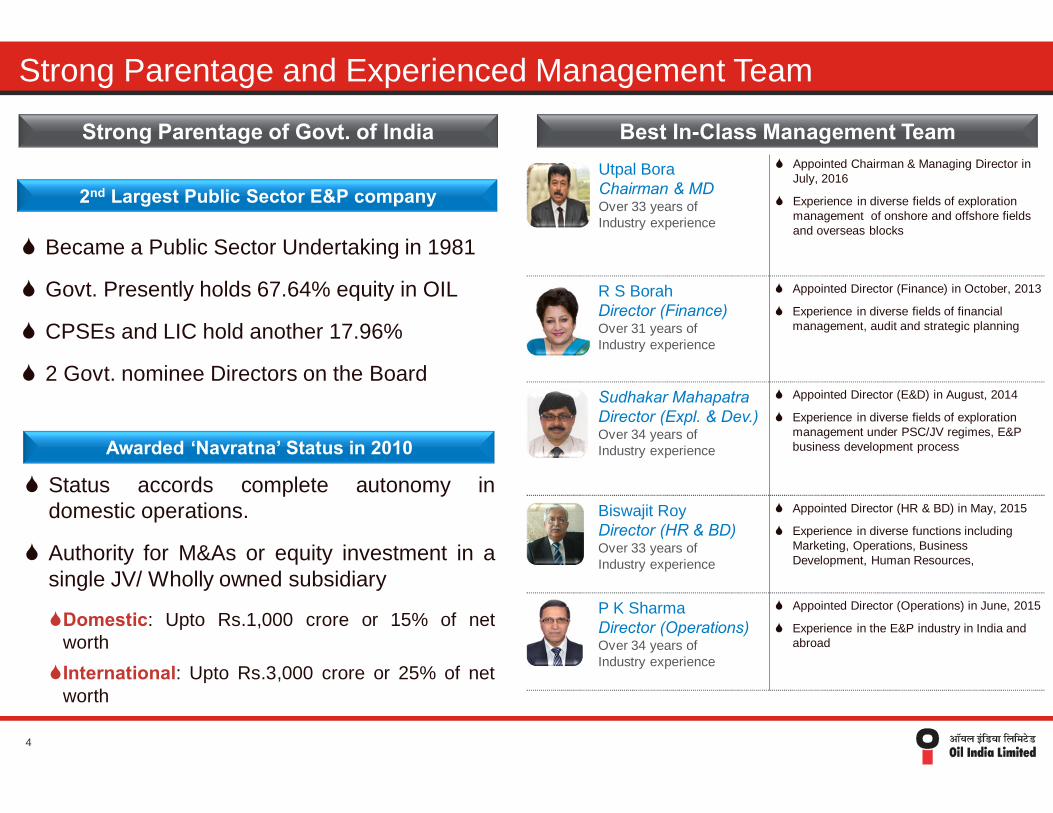
Strong Parentage and Experienced Management Team
S Became a Public Sector Undertaking in 1981
S Govt. Presently holds 67.64% equity in OIL
S CPSEs and LIC hold another 17.96%
S 2 Govt. nominee Directors on the Board
S Status accords complete autonomy indomestic operations.
S Authority for M&As or equity investment in asingle JV/ Wholly owned subsidiary
SDomestic: Upto Rs.1,000 crore or 15% of networthSInternational: Upto Rs.3,000 crore or 25% of net
worth
Best In-Class Management Team
Awarded ‘Navratna’ Status in 2010
2nd Largest Public Sector E&P company
Strong Parentage of Govt. of India
4
Utpal BoraChairman & MDOver 33 years of Industry experience
S Appointed Chairman & Managing Director in July, 2016
S Experience in diverse fields of exploration management of onshore and offshore fields and overseas blocks
R S BorahDirector (Finance)Over 31 years of Industry experience
S Appointed Director (Finance) in October, 2013
S Experience in diverse fields of financial management, audit and strategic planning
Sudhakar MahapatraDirector (Expl. & Dev.)Over 34 years of Industry experience
S Appointed Director (E&D) in August, 2014
S Experience in diverse fields of exploration management under PSC/JV regimes, E&P business development process
Biswajit RoyDirector (HR & BD)Over 33 years of Industry experience
S Appointed Director (HR & BD) in May, 2015
S Experience in diverse functions including Marketing, Operations, Business Development, Human Resources,
P K SharmaDirector (Operations)Over 34 years of Industry experience
S Appointed Director (Operations) in June, 2015
S Experience in the E&P industry in India and abroad
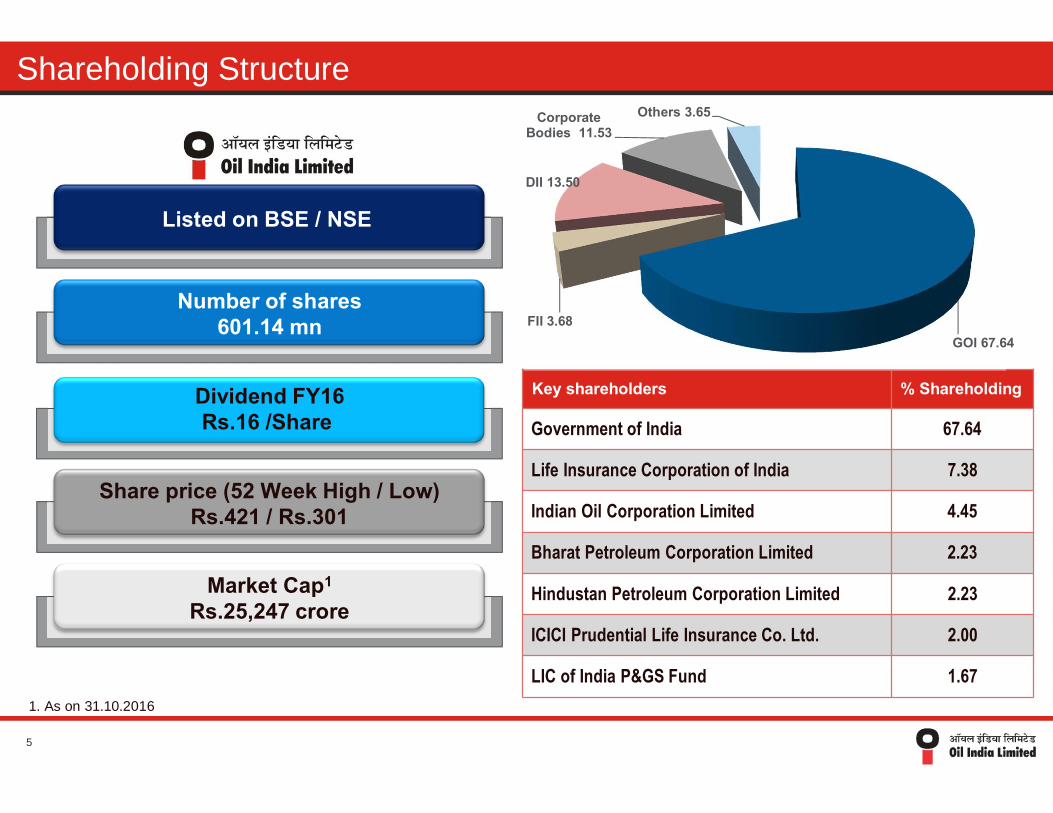
Shareholding Structure
1. As on 31.10.2016
Market Cap1
Rs.25,247 crore
Share price (52 Week High / Low)Rs.421 / Rs.301
Number of shares601.14 mn
Key shareholders % Shareholding
Government of India 67.64
Life Insurance Corporation of India 7.38
Indian Oil Corporation Limited 4.45
Bharat Petroleum Corporation Limited 2.23
Hindustan Petroleum Corporation Limited 2.23
ICICI Prudential Life Insurance Co. Ltd. 2.00
LIC of India P&GS Fund 1.67
Dividend FY16Rs.16 /Share
Listed on BSE / NSE
5
GOI 67.64FII 3.68
DII 13.50
Corporate Bodies 11.53
Others 3.65

6
Share Price Movement of OIL vis-à-vis BSE ‘OIL & GAS’ Index
300
320
340
360
380
400
420
440
8000
8500
9000
9500
10000
10500
11000
11500
12000
12500
13000
Apr-16 May-16 Jun-16 Jul-16 Aug-16 Sep-16 Oct-16
OIL&GAS OIL
Share Price of OIL moving in line with BSE Oil & Gas Index

Integrated and Diversified Oil & Gas Player
Exploration Production Transportation Non Conventional EnergyDownstream
SDomestic: 39 E&P blocksSInternational:
Presence in US, Russia, Venezuela, Mozambique, Gabon, Libya, Bangladesh, Nigeria, Yemen and MyanmarSDiscoveries: 24
discoveries during last four years
SCrude oil S41 installations S1,602 km
pipelines
SNatural gas S29 installationsS730 km
pipelines
SAdvanced Recovery techniques to maximize production
SCrude OilS1,157 km
pipeline; Over 6 MMT capacity
SMulti-productS660 km pipeline;
1.70 MMT capacity
SOverseasS10% stake in
741 km pipeline (Sudan)
SNatural Gas S23% stake in
192km DNPL in North-east
SRefining and marketing petroleum products S26% equity
stake in NRLS5% equity stake
in IOCL
SGas cracker projectS10% equity
stake in BCPL
SWind EnergySCapacity: 121.6
MWS54 MW under
implementation
SSolar PowerSCapacity: 14
MW
SShale Oil / GasS20% stake in
Niobrara Liquid Shale asset, USA
Fully serviced E&P Company and diversifying into non-conventional energy
7

Our vision
Fastest Growing Energy Company with Highest Profitability
Delight Customers with Quality Products and Services at Competitive Prices
Team, Committed to Honesty, Integrity, Transparency and Mutual Trust creating Employee Pride
Fully Committed to Safety, Health and Environment
Learning Organization, Nurturing Initiatives, Innovations and Aspirations with Best Practices
Responsible Corporate Citizen Deeply Committed to Socio-economic Development in its Areas of Operations
“The Fastest Growing Energy Company With a Global Presence Providing Value to Stakeholders”
8

Asset overview
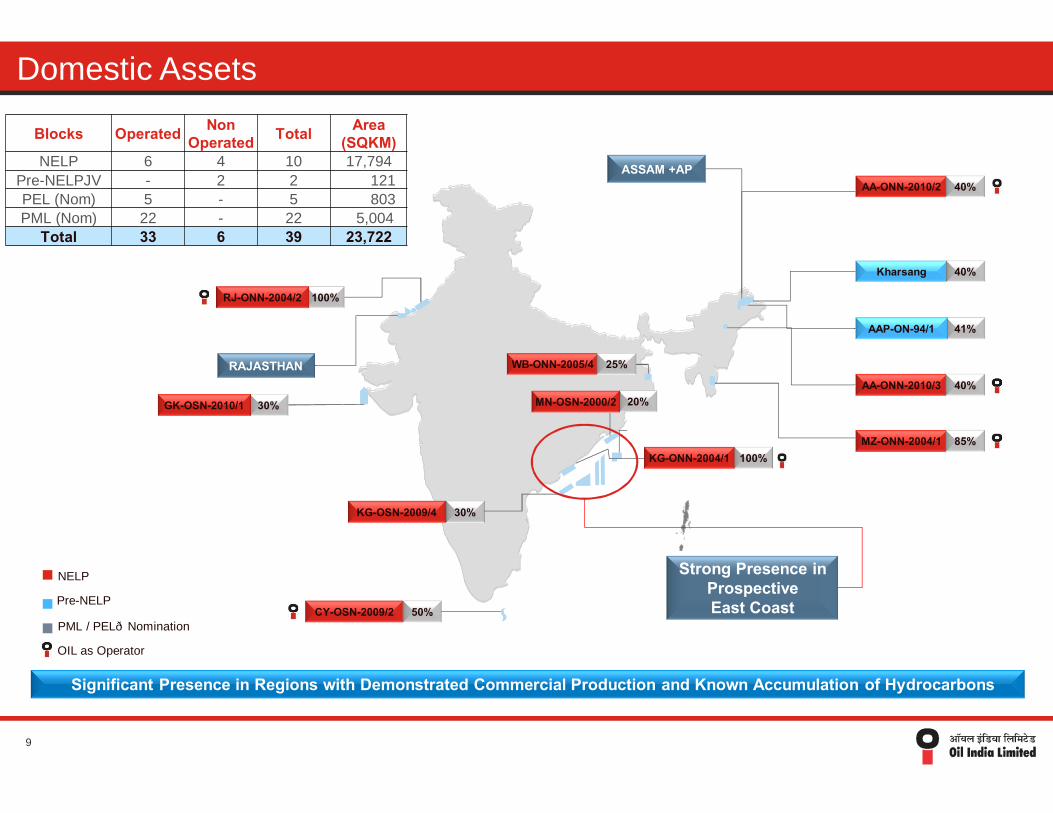
Domestic Assets
ASSAM +AP
KG-OSN-2009/4 30%
30%GK-OSN-2010/1 20%
100%KG-ONN-2004/1
MN-OSN-2000/2
ASSAM +APAA-ONN-2010/2
WB-ONN-2005/4 25%
40%
Kharsang 40%
Strong Presence in ProspectiveEast Coast
100%RJ-ONN-2004/2
CY-OSN-2009/2 50%
MZ-ONN-2004/1 85%
AA-ONN-2010/3 40%
41%AAP-ON-94/1
Significant Presence in Regions with Demonstrated Commercial Production and Known Accumulation of Hydrocarbons
RAJASTHAN
Blocks Operated Non Operated Total Area
(SQKM)NELP 6 4 10 17,794
Pre-NELPJV - 2 2 121 PEL (Nom) 5 - 5 803PML (Nom) 22 - 22 5,004
Total 33 6 39 23,722
NELP
PML / PEL—Nomination
Pre-NELP
OIL as Operator
9

International Asset Overview
Total No of Blocks: 15 Total Area: 77,972 sq.km
20%USColoradoJulesburg Basin
60 sq.km
17.5% (Suntera)
NigeriaOML 205 1,295sq.km
3.5%VenezuelaCarabobo 1 NorthCarabobo 1 Central
203sq.km180sq.km
50%GabonShakti 3,761sq.km
25% (Sonatrach)
LibyaArea 95/96Ghadames Basin
6,629sq.km
10%SudanPipeline 741 km
45%(OVL)
BangladeshSS-04SS-09
7,269sq.km7,026sq.km
12.75% (Medco)
YemenBlock 82 1,853sq.km4%
(Anadarko)MozambiqueRovuma Area-1 9,653sq.km
Operator
OIL’s Participating Interest (%)Area (Sq. km)
Non-Operator
Strong International Footprint with Balanced Presence in Exploration Acreages & Producing Properties
60%MyanmarM-04YEB
10,421sq.km21,380sq.km
10
50%10%8%
RussiaLicense 61TAASJSC Vankor
4,991sq. km1,382sq. km1,869sq.km
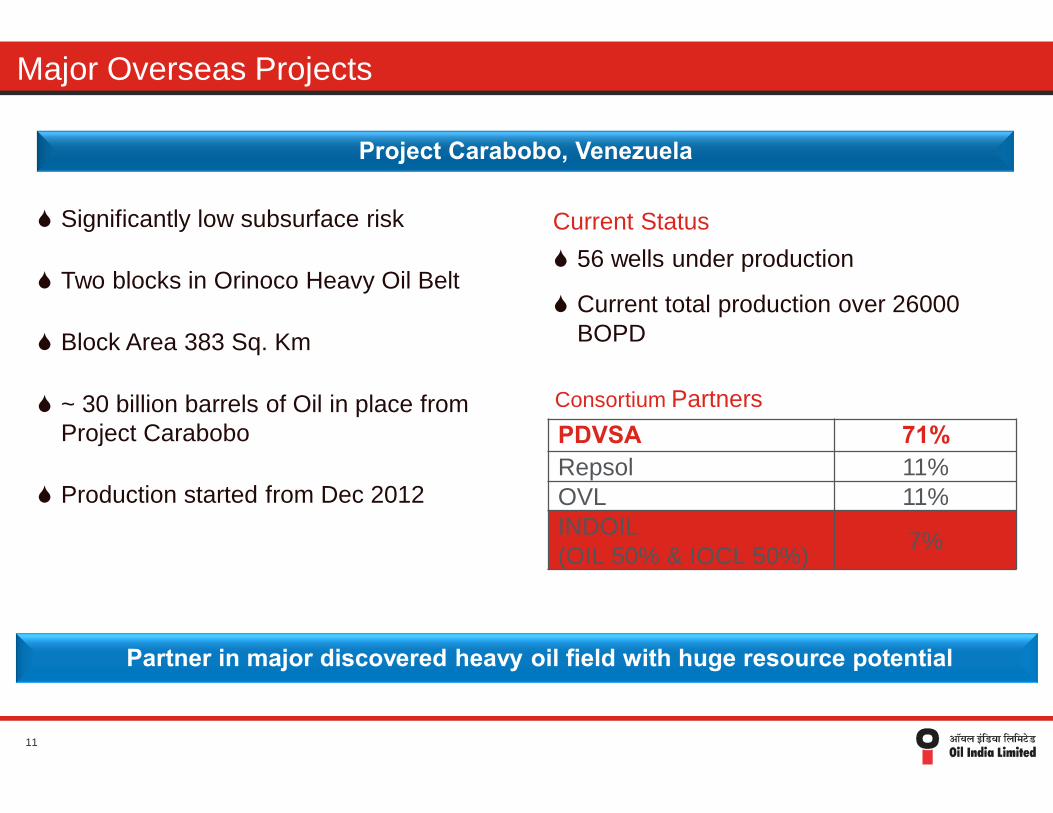
Major Overseas Projects
S Significantly low subsurface risk
S Two blocks in Orinoco Heavy Oil Belt
S Block Area 383 Sq. Km
S ~ 30 billion barrels of Oil in place from Project Carabobo
S Production started from Dec 2012
PDVSA 71%Repsol 11%OVL 11%INDOIL (OIL 50% & IOCL 50%) 7%
Consortium Partners
Project Carabobo, Venezuela
Partner in major discovered heavy oil field with huge resource potential
Current StatusS 56 wells under production
S Current total production over 26000 BOPD
11

Major Overseas Projects (Contd...)
S OIL & OVL acquired 10% stake in Offshore Mozambique Area 1 in Jan. 2014S Acquisition Cost: USD 2,519 million,
(US$ 1,007 million by OIL)S Area : 9653 SQ KM.
S Location : Rovuma tertiary deltaic basin extending from coastal partS Water depth over major gas fields are in
the range of 800–1600 metersS 45-75 tcf recoverable resources
S Resource size supports 50 MMTPA of LNG
S Strategically located to supply LNG to buyers from Asia and Middle.
Anadarko 26.5%Mitsui 20%ENH 15%BPRL 10%BREML (OIL 40% & OVL 60%) 10%OVL 10%PTTEP 8.5%
Consortium Partners
Key Highlights
S More than 2/3rd of the volume of Initial Development Phase will be committed before FID
Area 1 Rovuma, Mozambique
Discovered asset with high reserve base in a world class gas basin with significant future upside potential
12
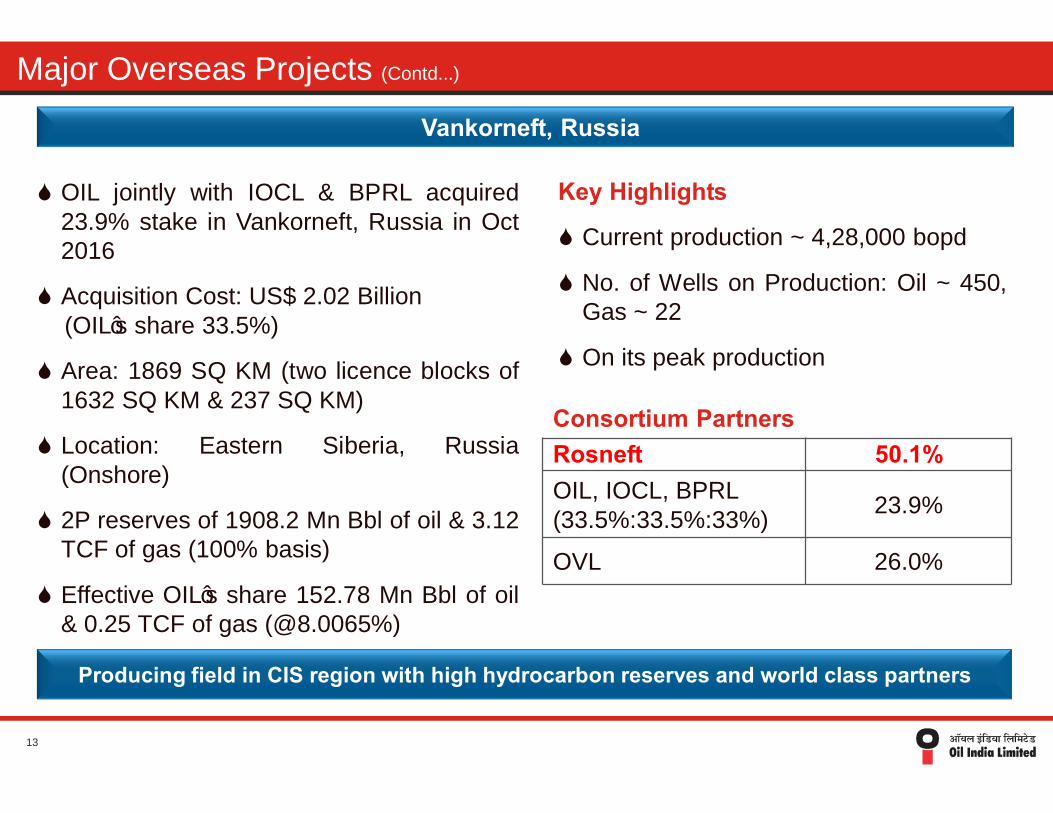
Major Overseas Projects (Contd...)
S OIL jointly with IOCL & BPRL acquired23.9% stake in Vankorneft, Russia in Oct2016
S Acquisition Cost: US$ 2.02 Billion(OIL’s share 33.5%)
S Area: 1869 SQ KM (two licence blocks of1632 SQ KM & 237 SQ KM)
S Location: Eastern Siberia, Russia(Onshore)
S 2P reserves of 1908.2 Mn Bbl of oil & 3.12TCF of gas (100% basis)
S Effective OIL’s share 152.78 Mn Bbl of oil& 0.25 TCF of gas (@8.0065%)
Rosneft 50.1%OIL, IOCL, BPRL (33.5%:33.5%:33%) 23.9%
OVL 26.0%
Consortium Partners
Key Highlights
S Current production ~ 4,28,000 bopd
S No. of Wells on Production: Oil ~ 450,Gas ~ 22
S On its peak production
Vankorneft, Russia
Producing field in CIS region with high hydrocarbon reserves and world class partners
13
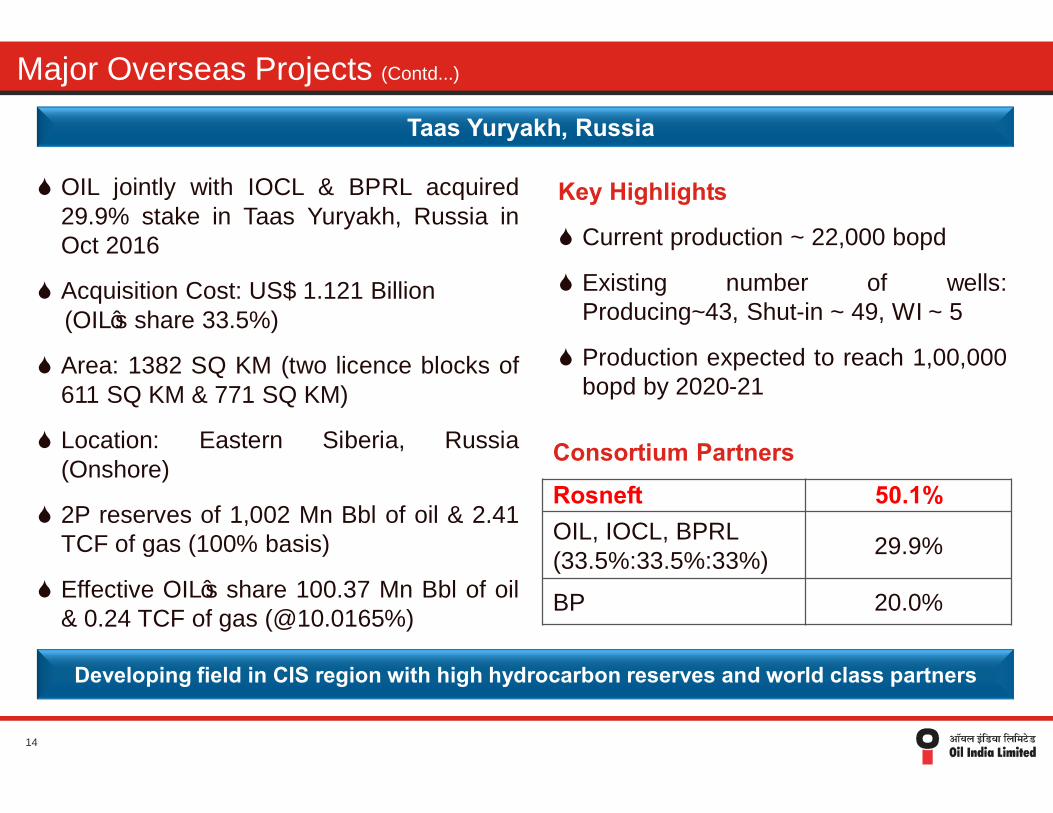
Major Overseas Projects (Contd...)
S OIL jointly with IOCL & BPRL acquired29.9% stake in Taas Yuryakh, Russia inOct 2016
S Acquisition Cost: US$ 1.121 Billion(OIL’s share 33.5%)
S Area: 1382 SQ KM (two licence blocks of611 SQ KM & 771 SQ KM)
S Location: Eastern Siberia, Russia(Onshore)
S 2P reserves of 1,002 Mn Bbl of oil & 2.41TCF of gas (100% basis)
S Effective OIL’s share 100.37 Mn Bbl of oil& 0.24 TCF of gas (@10.0165%)
Rosneft 50.1%OIL, IOCL, BPRL (33.5%:33.5%:33%) 29.9%
BP 20.0%
Consortium Partners
Key Highlights
S Current production ~ 22,000 bopd
S Existing number of wells:Producing~43, Shut-in ~ 49, WI ~ 5
S Production expected to reach 1,00,000bopd by 2020-21
Taas Yuryakh, Russia
Developing field in CIS region with high hydrocarbon reserves and world class partners
14

Strategic strengths

Strong In-House Capabilities
15
Vertically Integrated E&P Operations
In-house Expertise and Integration across Oil & Gas Infrastructure
10 Logging Units
20 Drilling Rigs20 Work-over Rigs
One 2D and two 3D Seismic crew
Infrastructure to Support E&P Activities
~150k KL Crude Storage
5,000 km O&G Pipelines
70 Production Installations
Production and Storage FacilitiesIn-House Expertise
Seismic API(2D and 3D)
Drilling
WirelineLogging
FieldDevelopment
Production
Transportation
IOR / EORField/Reservoir
Management

8.7 9.6 10.0
18.4 17.8 16.6
FY 14 FY 15 FY 16Raising Cost Levies
1.3 1.4 1.2
0.3 0.40.3
FY 14 FY 15 FY 16Raising Cost Levies
Attractive Cost Structure
OIL has Advantage of low cost structure due to largely in house infrastructure
3.0
3.7
4.2
5.3
5.96.3
FY 14 FY 15 FY 16Finding Cost F&D cost
16
Finding & Development Cost (USD/ BOE) Crude Oil Production Cost (USD/ bbl)
Natural Gas Production Cost (USD/ MMBTU)
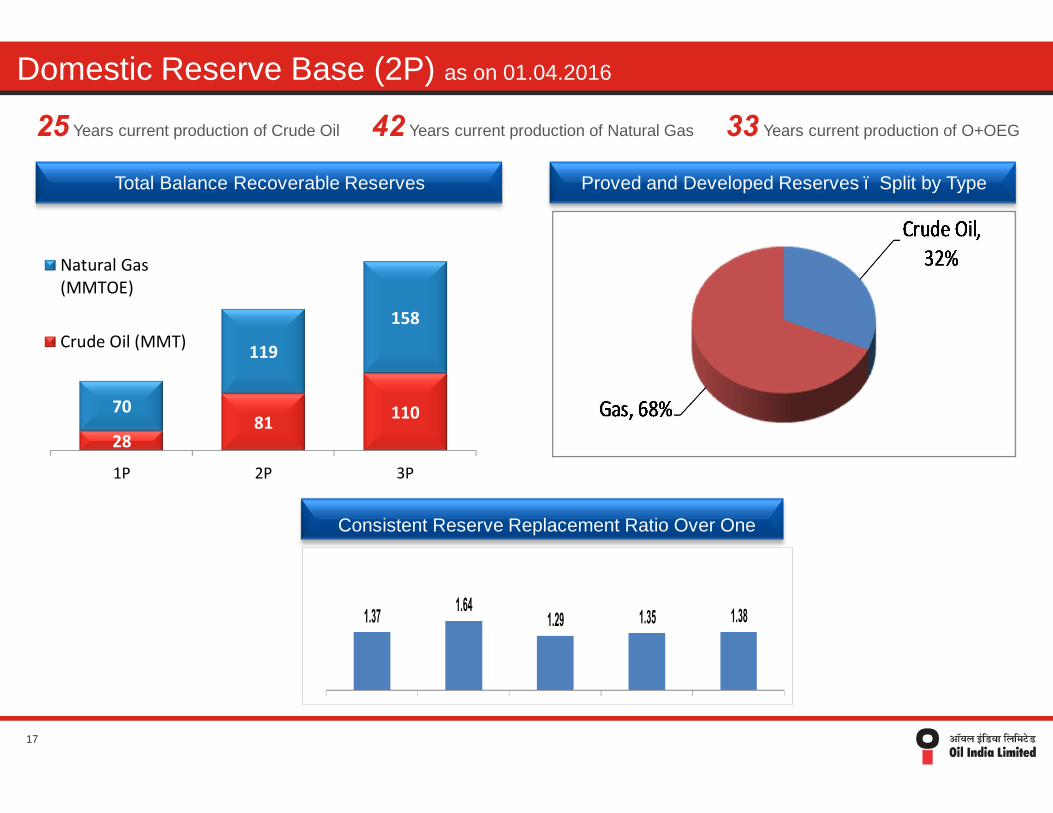
Domestic Reserve Base (2P) as on 01.04.2016
Total Balance Recoverable Reserves Proved and Developed Reserves – Split by Type
Consistent Reserve Replacement Ratio Over One
25 Years current production of Crude Oil 42 Years current production of Natural Gas 33 Years current production of O+OEG
2881 11070
119
158
1P 2P 3P
Natural Gas(MMTOE)
Crude Oil (MMT)
1.37 1.641.29 1.35 1.38
FY12 FY13 FY14 FY15 FY1617

Operating and Financial Highlights

2,6262,722
2,838
1,474
FY14 FY15 FY16 H1 FY17
3.50 3.443.25
1.60
FY14 FY15 FY16 H1 FY17
Crude Oil and Natural Gas Production
Crude Oil Production (MMT) Natural Gas Production (MMSCM)
18
OIL produces about 9% of India’s total Domestic Oil and Natural Gas production

11,215 11,020 11,141
3,164 2,461
FY14 FY15 FY16 Q1 FY16 Q1 FY17
5,195 4,802 4,991
1,503 1,103
FY14 FY15 FY16 Q1 FY 16 Q1 FY 17
Financial highlightsEBITDA (Rs. crore)Revenue (Rs. crore)
Net Profit (Rs. crore)
19
2,9812,510 2,330
743494
FY14 FY15 FY16 Q1 FY16 Q1 FY17
EBITDA & PAT Margin (%)
46 44 45
2723 21
FY 14 FY 15 FY 16
EBITDA Margin PAT Margin
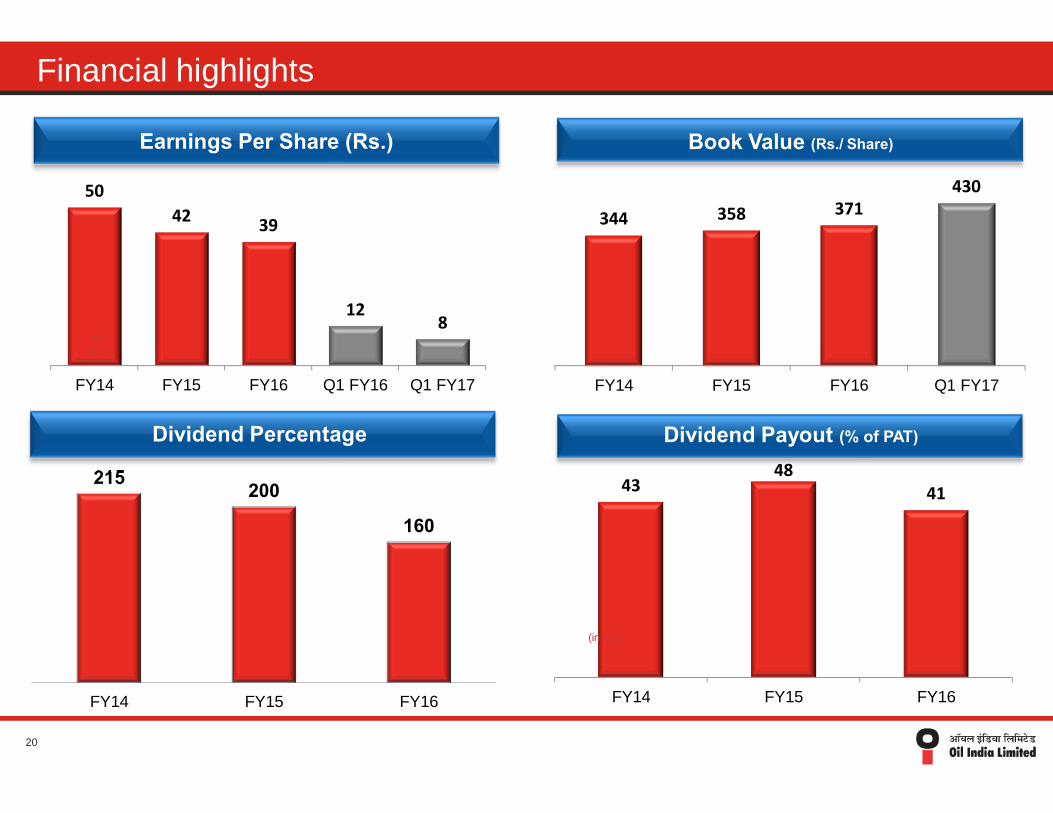
Financial highlights
Book Value (Rs./ Share)
344 358 371430
FY14 FY15 FY16 Q1 FY17
20
215 200
160
FY14 FY15 FY16
Dividend Percentage
5042 39
128
FY14 FY15 FY16 Q1 FY16 Q1 FY17
(in Rs.)
Dividend Payout (% of PAT)
Earnings Per Share (Rs.)
4348
41
FY14 FY15 FY16
(in Rs.)

Strong Liquidity with Low Leveraging
21
Total Debt (Rs. Crore)
Strong Cash Balance (Rs. Crore)
Debt Equity Ratio
11744
8917 9594 10085
FY14 FY15 FY16 Q1 FY17
47.2%
38.8% 41.2%36.2%
FY14 FY15 FY16 Q1 FY17
Net Worth (Rs. Crore)
20708 21498 22302
25841
FY14 FY15 FY16 Q1 FY17
9783
83419199 9347
FY14 FY15 FY16 Q1 FY17

Contribution to Exchequer
1,333 854 719
1,603
1,531 1,420
1,218
1,200 1,008
FY 14 FY 15 FY 16
Corporate Tax Cess Dividend & Others
1,276 1,280 1,253
509 542 593
FY 14 FY 15 FY 16
Royalty VAT & Others
Central Government State Governments
(Rs.crore)
22
(Rs.crore)
4,154
3,5853,147
1785 1822 1846

1,61,0291,39,869
72,314
11,496
FY13 FY14 FY15 FY16
Government Policy and Outlook on Subsidy
P Petrol Prices De-regulated in June 2010
P Diesel Prices De-regulated in October 2014
P Direct Benefit Transfer Scheme for LPGimplemented effective Jan 1, 2015. subsidieson Domestic LPG fully compensated by Govt.
P >10 mn users surrendered LPG subsidy under“Give it Up”, a voluntary initiative
P No subsidy to tax payers with an annual incomeof more than Rs.10 lakh.
P Monthly increase in price of LPG by Rs.2/ cyl.P Govt. absorbing subsidy on PDS Kerosene upto
Rs.12/ litreP Monthly increase in price of PDS Kerosene by
25-50/ paiseP Direct Benefit Transfer Scheme for PDS
Kerosene under implementation.
(INRin Crores)
Outlook on Subsidy
Subsidy burden declines sharply with fall in crude oil prices and policy decisions
Total Petroleum Subsidy
(Rs crore)
23
FY13 FY14 FY15 FY16
ONGC 49,421 56,384 36,300 1,096
OIL 7,892 8,737 5,523 155
GAIL 2,687 1,900 1,000 -
Total 60,000 67,021 42,822 1,251
Sharing of Subsidy by Upstream Companies

Realized Price for Crude Oil & Natural Gas
Crude Oil (USD/BBL)
24
106.4
84.3
46.447.1 47.1 45.3
28.7 29.1 28.8
FY14 FY15 FY16Gross Realized Price Price Realized after SubsidyNet Realization after Levies
Natural Gas (US$/MMBTU)
4.2
4.8 4.7
3.5
3.9 4.0
3.2
3.6 3.6
FY14 FY15 FY16
Gross Price Price Realized Net Realization after Levies

Growth Strategy
Growth Strategy
25
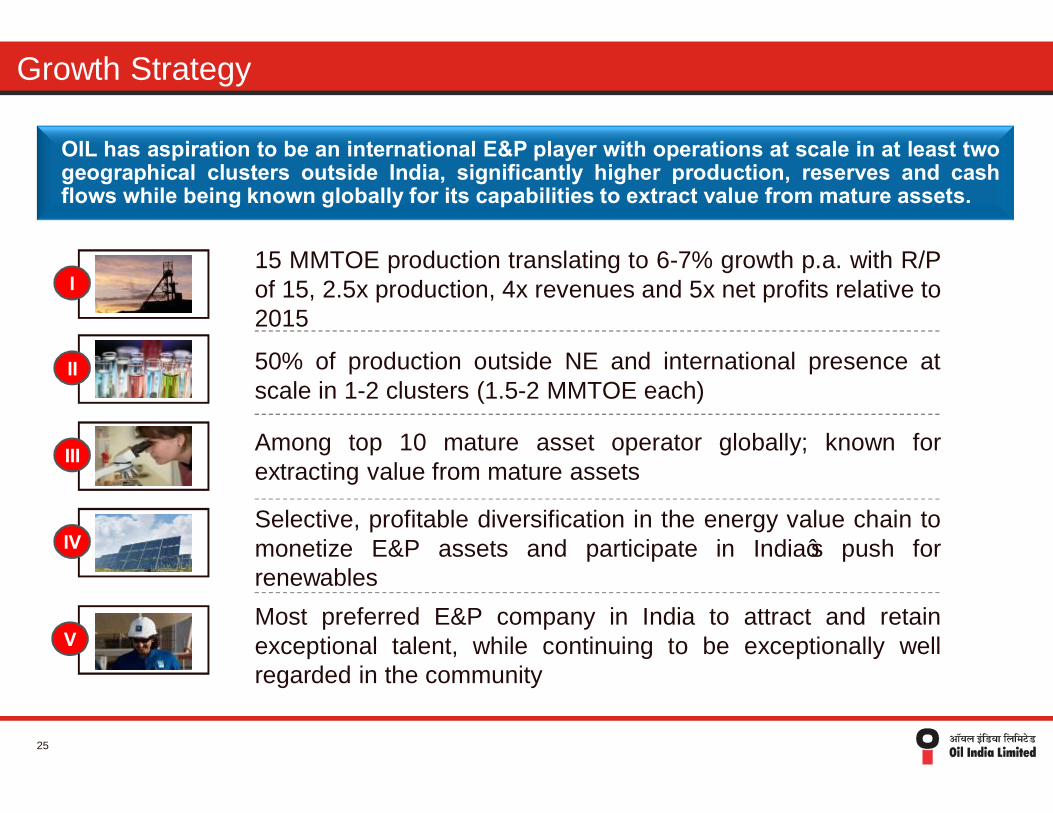
OIL has aspiration to be an international E&P player with operations at scale in at least twogeographical clusters outside India, significantly higher production, reserves and cashflows while being known globally for its capabilities to extract value from mature assets.
15 MMTOE production translating to 6-7% growth p.a. with R/Pof 15, 2.5x production, 4x revenues and 5x net profits relative to2015
50% of production outside NE and international presence atscale in 1-2 clusters (1.5-2 MMTOE each)
Among top 10 mature asset operator globally; known forextracting value from mature assets
Selective, profitable diversification in the energy value chain tomonetize E&P assets and participate in India’s push forrenewablesMost preferred E&P company in India to attract and retainexceptional talent, while continuing to be exceptionally wellregarded in the community
III
IV
I
V
II
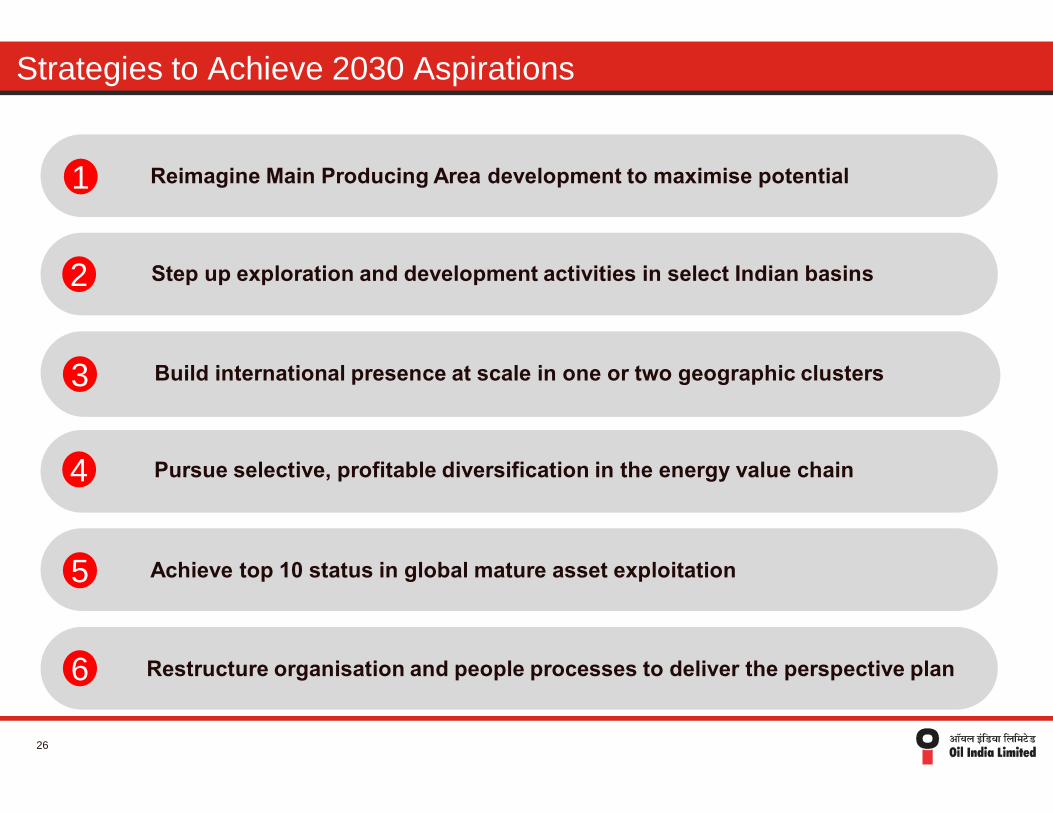
Strategies to Achieve 2030 Aspirations
26
1 Reimagine Main Producing Area development to maximise potential
Step up exploration and development activities in select Indian basins
Build international presence at scale in one or two geographic clusters
Pursue selective, profitable diversification in the energy value chain
Achieve top 10 status in global mature asset exploitation
Restructure organisation and people processes to deliver the perspective plan
2
3
4
5
6

Technology Innovation/ Improvements
27
§ Use of advanced techniques have enabled company to maintain production rates in theUpper Assam basin despite majority of the fields being old.
§ Company deploys a wide array of IOR and EOR to achieve maximum recovery of oilreserves.
§ Introduced hydro-frac operations to produce tight sands.
§ Introduced radial drilling technology to improve productivity.
§ Introduction of ESPs to improve artificial lifting from wells.
§ Gravel pack completion for efficient production of unconsolidated sand reservoirs.
§ Plans to introduce extended reach completions to tap the reservoirs lying underlogistically difficult areas.

Positive Policy Environment
§ Maximising domestic Oil & Gas production is a strategic priority for the Govt., with an aimto reduce import dependence by 10% by 2022.
§ “Hydrocarbon Vision 2030 for Northeast India” gives strategic importance to thedevelopment of Northeast India which is the main operating area for OIL.
§ Action areas envisaged under the NE Vision for upstream sector:§ Increase in production from mature fields§ Enhancing exploration activities§ Offering premium on gas production§ Re-allotment of relinquished blocks on nomination to NOCs§ Concept of Zero phase of exploration and increase in exploration time to 8+4 years§ Expansion of Refining capacity and Pipeline network
§ Declaration of Hydrocarbon Exploration Licencing Policy (HELP) in place of NELP
§ Monetisation of marginal fields - Bid round already kicked off
§ Unconventional Exploration Policy for PSUs
§ National Data Repository to facilitate Open Acreage Offer
28

Capex Plans
2017-18 : Rs.4,290 crore
29
9%
23%
22%
36%
10%
2016-17 : Rs.4,020 crore
10%
34%21%
19%
16%
429
391
935
753
681
706
1051
921
527
1002
2015-16
2014-15
Survey Exploratory Drilling Development Drilling Capital Equipment Overseas Projects
3622
3773

Production Guidance for FY’17
2016-17
Crude oil 3.28 MMT
Natural gas 2981 mmscm
30

Conclusion
Steady and sustained Growth
Sound Financial Health
Strong operating track record
More than 5 decades of E&P expertise
Spreading wings: NE - Pan India - Global
Large prospective E&P acreage
Pioneer in Pipeline transportation
Entry into Offshore/ Deep Water Blocks
Entry into discovered and producing assets
Diversifying into new areas. Core Focus remains in E&P
31

• Thank You