oil pollution management and environmental assessment in
TRANSCRIPT

OIL POLLUTION MANAGEMENT AND ENVIRONMENTAL ASSESSMENT IN THE
NIGER DELTA: A CASE STUDY OF OPERATIONS OF CHEVRON NIGERIA LTD IN
UGBORODO COMMUNITY IN DELTA STATE OF NIGERIA
BY
TOSAN S. N. EYITSEDE, Final Dip.Tech (B.Tech Equiv.), PGD; PGSD; MSc, MBA
[STUDENT No. 443783-2]
Being a dissertation submitted to the Department of Environmental Science, College
of Agriculture and Environmental Sciences, University of South Africa (UNISA) in
partial fulfillment of the requirements for the award of Master of Science (M.Sc)
Degree in Environmental Management (97462).
SEPTEMBER, 2010
i

CERTIFICATION
This is to certify that the thesis “Oil Pollution Management and Environmental Assessment in
the Niger Delta: A case study of the Operations of Chevron Nigeria Limited in Ugborodo
Community in Delta State of Nigeria” is original work carried out by Tosan Samuel Nene
Eyitsede in the Department of Environmental Science, University of South Africa.
Signed --------------------------------------------------
(Student)
Tosan S.N. Eyitsede
Signed ---------------------------------------------------
(Project Supervisor)
Prof.Babajide I. Alo PhD, FNES, FIPAN, FICCON
Professor of Chemistry
University of Lagos, Nigeria.
ii

DEDICATION
This project is dedicated specially to God Almighty, for granting me this golden opportunity to
undertake a Postgraduate study in environmental management.
iii

ACKNOWLEDGEMENT
I seize this opportunity to acknowledge God Almighty, for providing me this avenue to train
once again. I am indebted to my supervisor, Prof. Babajide. I. Alo, of the University of Lagos,
Nigeria for accepting to supervise my work outside the University of South Africa. I am deeply
encouraged, privileged and honored to work under him. I express appreciation for his great
sacrifice and willingness despite his tight schedule, to find a time to guide and provide directions
for my research work with his wealth of experience. I am equally grateful to my wife and
children for their love, cooperation and understanding, my colleagues in Chevron, Operations
Laboratory for their support morally and professionally.
Finally, I wish to thank my employer, Chevron Nigeria Limited, for the financial support,
permission to undertake the study, and for the use of her facilities.
iv

TABLE OF CONTENTS
PAGE
Title: …………………………………………………………………………. i
Certification: ………………………………………………………………… ii
Dedication:…………………………………………………………………… iii
Acknowledgement:…………………………………………………………… iv
Table of contents:…………………………………………………………….. v- ix
List of Tables:………………………………………………………………… viii-ix
List of figures:………………………………………………………………… vii
Abstract:………………………………………………………………………. x
CHAPTER ONE
Introduction:………………………………………………………………….. 1-5
1.0 Chevron Nigeria Limited Historical Background:………………………… 6-10
1:1 Ugborodo Community Brief History ……………………………………. 10-15
1:4 Statement of the Problem:………………………………………………… 16-17
1:3 Aims and Objective:……………………………………………………… 18
1.3 Justification for the project------------------------------------------------------- 19
1.4 Scope and Limitation:……………………………………………….,,,,,,, 20
1.4 Research Plan :……………………………………………………….,,,,,. 21
V
CHAPTER TWO:
Literature Review:……………………………………………………………… 22-60
CHAPTER THREE:
Research Methodology:………………………………………………………… 61-67
CHAPTER FOUR:
Results and Discussion:……………………………………………………… 68- 118
CHAPTER FIVE:
Conclusion and Recommendations:…………………………………………. 119 - 127
References:…………………………………………………………………… 128 -135
Appendix 1&2……………………………………………………………….. 136 - 141
vi

LIST OF FIGURES
Fig. 1.1: Map of Nigeria showing Escravos location...………………………………….. 11
Fig. 1.1a: Map Showing Escravos location...…………………………………………… 12
Fig. 1.2 Picture showing Ugborodo after invation by the Ijaws ……………………... 14
Fig. 1.3 Picture showing Ugborodo community as Chevron Next Neighbour………… 15
Fig. 2.4 Map of Nigeria showing Geographical area of Warri incuding Ugborodo…… 56
Fig.2. 5 Map of Nigeria showing position of Ogidigben / Ugborodo community.......... 58
Fig.2. 6 Geographical Map showing Ugborodo & surrounding communities…........ 59
Fig. 4.11a Acute Toxicity test on Tilapia (24 hours.).................................................... 89
Fig. 4.11b Acute Toxicity test on Tilapia (48 hours)....................................................... 90
Fig. 4.11c Acute Toxicity test on Tilapia (96hours)....................................................... 92
Fig. 4.12a Acute Toxicity test on Earthworm (24 hours.)............................................... 94
Fig. 4.12b Acute Toxicity test on Earthworm (48 hours)................................................ 95
Fig. 4.12c Acute Toxicity test on Earthworm (72 hours)................................................ 97
Fig. 4.12d Acute Toxicity test on Earthworm (96hours)............................................... 99
Fig. 4.13 Destroyed Forest due to pollution .................................................................... 111
Fig. 4.14 Pix showing gas flare heating the environment ................................................ 112
Fig. 4.15 Pix showing oil drilling well-head and impact on the ecology within ND…. 113
Fig 4.16 Pix showing devastating effect of oil exploration (Gas flaring effect)………. 114
Fig. 4.17 Pix showing devastating effect of oil exploration (Gas flaring effect)………. 115
Fig. 4.18 Pix showing ruptured water pipes in Niger Delta ............................................ 116
Fig. 4.19 Pix showing crop affected by environmental pollution.................................... 117
vii
Fig. 4.20 Pix showing ruptured pipe due to pollution ..................................................... 118
LIST OF TABLES
Table 1.1 Products of refined crude…….:…………………………………………. 5
Table 2.1 Sources / Causes of oil Pollution………………………………………… 27
Table 2.2: Types of pollution resulting from Oil Industry ………………………….. 28
Table 2.3: Causes of oil spills in Nigeria with respect to operational locations
(Facilities){‘76-‘86} ------------------------------------------------------ 30
Table 2.4: Characteristics properties of Crude Oil:……………………………........ 32
Table 2.5: Physico-Chemical properties of Bonny Ligh: :……………………………. 33
Table 2.6: Comparative significance of crude oil properties in context of dispersal:... 34
Table 2.7: Production capacities of oil producing companies..................................... 51
Table 3.1: Sample Size for the Field Selection…………………………………….. 62
Table 3.2: Responses and Refusal rates…………………………………………….. 63
Table 4.1: Sample Size Selection…………………………………………………….. 68
Table 4.2 .Responses and Refusal Rate ……………………………………………… 69
Table 4.2a.Responses to Administered Questionnaire…………………………….. 70
Table 4.2b: Frequency Representation of the Personal analyzed data of Respondents:..72
Table 4.3a: Observed values compiled from “YES” or “NO” of Respondents…………74
Table 4.3b:The value of X2 Observed, from H1………………………………………..75
Table 4.3c Computation Values for X2 from H1………………………………………..75
Table 4.4a-c: Observed values compiled from “YES” or “NO” of Respondents for H2 76
Table 4.4b: Observed, The value of X2 Observed, from H2 Values for H3..……… 77
viii

Table 4.4c: Computation Values for H2..……………….. …………………………… 79
Table 4.5a: Observed values compiled from “YES” or “NO” of Respondents for H3.. 78
Table 4.5b: Observed, The value of X2 from H3…………………………...……… 79
Table 4.5c: Computation Values for H3..…………………………………………… 79
Table 4.6a: Observed values compiled from “YES” or “NO” of Respondents for H4.. 80
Table 4.6b: Observed, The value of X2 from H4…………………………...……… 80
Table 4.6c: Computation Values for H4..…………………………………………... 81
Table 4.7a: Observed, compiled from “YES” or “NO” of Respondents …………… 82
Table 4.7b: Observed, The value of X2 from H5…………………………...……… 82
Table 4.7c: Computation Values for X2 from H5..………………………………… 82
Table 4.8 : Support for continue exploration& production activity in Niger Delta….. 84
Table 4.9: % of employment with oil company of youths and indigene ………………85
Table 4.10: Average monthly income of the hosts community indigenes……………. 86
Table 4.11a: Acute toxicity tests of Escravos crude oil on Tilapia 24 hours……………88
Table 4.11b: Acute toxicity tests of Escravos crude oil on Tilapia 48 hours………… 90
Table 4.11c: Acute toxicity tests of Escravos crude oil on Tilapia 96 hours……………91
Table 4.12a: Acute toxicity tests of Escravos crude oil on Earthworm 24 hours……… 93
Table 4.12b: Acute toxicity tests of Escravos crude oil on Earthworm 48 hours……… 95
Table 4.12c: Acute toxicity tests of Escravos crude oil on Earthworm 72 hours……… 96
Table 4.12d: Acute toxicity tests of Escravos crude oil on Earthworm 96 hours……… 98
ix
ABSTRACT
Since the discovery of oil in Nigeria, way back in 1950s, the country has invariably suffered
some negative environmental consequences such as oil pollution resulting from gas flaring and
oil extraction, loss of mangrove trees, which before now was a source of livelihood for the
indigenous people and habitat for the area’s biodiversity. Oil production activities have caused
contamination of marine life, and habitat, which in turn have had negative consequences on the
health of humans, who consume the sea food. Inadequate attention had been paid by the
successive Governments of Nigeria and the oil companies to these environmental problems over
the years.
In this study, an assessment of the effects of oil and gas exploration and exploitation on the
nearby communities in some of Chevron’s operational areas was carried out using the Ugborodo
community as a case study. Furthermore, investigations were carried out on the toxicity effects
of the Escravos crude oil on aquatic organisms like Tilapia and a terrestrial organism such as the
Earthworms (Lumbricus terrestris,). The study established the effect and the impact of crude oil
when exposed to such organisms mentioned above. The rate of death of barbus fingerlings of
Tilapia and the Earthworm (Lumbricus Terrestris) at different concentrations of crude oil was
determined and reported. The community survey undertaken by polling data shows the
dwindling of the natural resources of the area due to oil exploration and the survey indicate the
impacts on natural resources from pollution by crude oil and the consequences on the affected
communities using the Ugborodo community in the Chevron’s Nigeria Limited Operational base
as a case study.
x

CHAPTER ONE
INTRODUCTION
1.1 BACKGROUND TO THE STUDY
In recent years, tremendous attention has been directed towards environmental pollution by
man’s activities which adversely affect the lives of plants and animals on land, water and air.
Pollution is defined as the introduction by man, directly or indirectly, of substances or energy
into the environment resulting in deleterious effects of such a nature as to endanger human
health, harm living resources and ecosystems, and impair or interfere with amenities and other
legitimate uses of the environment (OECD, 1976]
One major pollutant that has aroused considerable interest in Nigeria especially in the Niger
Delta is crude oil. Pollution by crude oil can occur by spillages from onshore or offshore
operations of the petroleum industry. It is believed that when these oil spills occur, they may
affect the flora and fauna and may impact soil fertility and aquatic animals which constitute the
major protein reserves for human in the petroleum industry operational areas [Nwankwo, J 1983]
WHAT IS CRUDE OIL? Crude oil is mainly hydrocarbon found in Nigeria and other parts of
the World in liquid state in natural underground reservoir, and has been formed from dead pre-
historic animals. It is measured in barrels, each containing about 42gallons. The hydrocarbon oil
is a source of energy, wealth for nations and can cause environmental degradation.
1

Oil has played a key role in economic advancement of many developed economies. It has
conferred considerable wealth on some nations and individuals blessed with this natural resource
or are enterprising enough to be at the forefront of the technology to tap and distribute its various
forms as an energy source. Because of its ease of transportation, it is the residual form of energy
similar to coal, nuclear and solar energy. Furthermore petrochemical industries which have also
contributed to global development are crude oil-based. However, along with all the benefits
derivable from oil comes the risk of environmental pollution.
Oil pollution, as a major source of environmental degradation, has attracted global awareness
especially since marine ecosystems are potentially at risk due to the activities of the oil industry.
Oil pollution therefore, is the introduction of oil directly or indirectly, to the environment and
which results in deleterious effects. Over the past three decades, a large amount of literature has
been produced, describing oil and its effects in some temperate regions, the Middle East and in
some tropical areas of South America and Africa.
According to Cairo, J. et al (1975), when temperature increases, pollutants show high toxicity to
test animals. This observation predicts major expected differences in the impact of pollutants in
temperate and tropical ecosystems.
2

Biodegradation of chemically unstable pollutants would also be faster in warmer waters. Baker
(1981) indicated that, where a complex biologically accommodated community is destroyed or
affected within the tropical areas, recovery may take a long time. It is clear that acute and local
effects of pollutants will be severe in the tropics and accumulation of pollutants may be less of a
problem.
As noted by Nwankwo, J.N, and Ifeadi, C.N (1985), Oil activities started around 1956, when oil
was struck in commercial quantities in Nigeria with the first well located at Oloibiri in Ogbia
Local Government Area of Bayelsa State (then Rivers State). Production has continued since
then reaching a peak of 2.4 million barrels per day in 1979 and today Nigeria total production is
well over 6.98m barrels per day. Nigeria attained the status of major producer, ranking seventh in
the world in 1972 (NNPC, 1994); and is currently the largest in Africa and sixth in the World.
Early in 1960’s oil had also been found in some other African countries such as Algeria, Angola,
Gabon, Libya, Cameroon and Sao-Tome and Principe. West and Central Africa has a sizeable
reserve, which is of a particular interest to the rest of the world because it is for the most part,
high quality light crude, giving a greater gasoline yield after basic refining. An added advantage
is its low sulphur content, which makes it preferable by countries faced with increasingly
stringent environmental standards, (UNDP, 1982).
Nigeria crude oil is characteristically light, having higher percentage of lighter water soluble
components and is less viscous than the heavier crude oils like that from Venezuela. The major
organic substances are hydrocarbons such as naphthalene, paraffin, olefins and aromatics.
3
The inorganic substances include sulphur, nitrogen, and heavy metals such as nickel and
vanadium.
Crude oil may be described as sweet if the sulphur to crude weight in ratio is lower than 1.5%
and as sour if greater than 1.5%. The specific gravity of the heavy crude oil is 1, sulphur
content, five, and boiling point below 270 Celsius. The viscosity of crude oils varies with
specific gravity, sulphur contents, wax, vanadium and asphaltene contents.
Refined crude oil contains, as in Table 1.1 mixtures of hydrocarbon – Hexane plus 97.19%;
iso –pentane 0.81%; n –pentane 0.67%; n – butane 0.67%; iso – butane 0.33%; propane –
023%. as well as sulphur, and nitrogen compounds as basic or non-basic, acidic or non-acidic
compounds.
TABLE 1.1 PRODUCTS OF REFINED CRUDE OIL CONTENT WEIGHT (%) Methane Not Detected Ethane 0.01 Propane 0.23 Iso-Butane 0.33 Normal-Butane 0.67 Iso-Pentane 0.81 Normal-Pentane 0.67 Hexane Plus 97.19 Light-Naphtha Cuts - Heavy-Naphtha - Kerosene - Light-Distillate - Atmospheric Residue - Heavy-Gas Oil - Vacuum Residue -
Source: Nigerian National Petroleum Corporation, 1987
4
1.2 CHEVRON NIGERIA LIMITED: HISTORICAL BACKGROUND
Chevron Nigeria Limited has been a corporate citizen of Nigeria for over 35 years. The
Company is a subsidiary of Chevron Overseas Petroleum Incorporated (COPI).
The company is based in San Ramon, California, United States of America (USA).
The Chevron Corporation, Worldwide includes units for Petroleum Exploration, Production,
Refining, and Marketing Company based in San Francisco, USA.
The Company in Nigeria has operations and administrative offices in Escravos, Warri and Port
Harcourt. The Head Office of Chevron Nigeria Limited is located at Lekki Peninsula, Lagos.
Escravos, located near Warri, in Delta State, is the hub of the company’s operations, housing its
operational base oil storage tanks and with a combined capacity of well over 36 million barrels
of crude oil.
1.2.1 BUSINESS HISTORY Chevron Nigeria Limited (CNL) began business in Nigeria in December 1961, when it obtained
its first oil prospecting license from the Federal Government. By June 1962, the Company
consolidated its business interests with the receipt of another license, which extended its
prospecting right over 5178 sq. km onshore in the Niger Delta region. This belt straddles Delta,
Ondo, Rivers, Imo and Akwa Ibom States (CNL- Policy & Government Public Affairs Record).
The company ownership profile has changed over the years. Beginning in 1973, the Federal
Government, through the Nigeria National Petroleum Corporation (NNPC), initiated a joint
venture policy, and as at today, it has 60% interest in the NNPC/Chevron Joint Venture.
Chevron, has the remaining 40% as the operating partner of the Joint Venture.
5
1.2.2 CHEVRON’S PRODUCING FIELDS Chevron Nigeria Limited as a company operates onshore and offshore Oil fields within the Niger
Delta. The Okan field, Nigeria’s first successful offshore oil field, was spudded by Chevron on
December 8, 1963; at the mouth of the Escravos River, 11 kilometers into the Atlantic Ocean.
The field, which commenced production March 1965, attained on Thursday, October 15, 1992 a
landmark production level of 500 million barrels of crude and since then production had been on
a continuous basis. In addition the company had successfully secured and extended to the deep
offshore exploration through its Agbami FPSO which is another landmark achievement by
Chevron Nigeria Limited for the Nigeria oil industry
1.2.3 CHEVRON’s GAS UTILIZATION PROJECTS The company has successfully initiated and completed a multi-phase gas utilization project to
eliminate gas - flaring in the Niger Delta, called the Escravos Gas Project (EGP). Supported by
the World Bank due to the environmental friendliness of the project, this project costs well over
one billion dollars. It is worthy of note that the project, because of its economic potentials and
environmental benefits, won international approvals. On the economic front, the project’s
primary aim, which is the gathering and distribution of 170 million cubic feet of associated gas
daily from the company’s fields in the Escravos area? This amounts to about 80% of the gas
currently being flared in those fields. The gathered gas is sold locally and internationally.
6
In addition, Chevron also established the Escravos Gas to Liquids (EGTL) project. This project
is estimated to cost 5.6 billion US dollars. It was expected to be commissioned by the third
quarter of 2013. At the start of business operation, the project will utilize 300MMCFPD of Gas
from EGP to produce 34,000 BPD of distillates and Naphtha.
1.2.4 SAFETY AND ENVIRONMENTAL PROTECTION IN CHEVRON OPERATIONS In conformity with Chevron standards nationwide, CNL is zestfully committed to sound
environmental and safety practices. At all times, the company maintains a state of constant
alertness to combat any eventual oil spills. It maintains a highly trained oil spill response team
equipped with state of the art spill response kits and tools. In addition, CNL is a member of
Clean Nigeria Associates (CNA), a Nigerian oil spill response cooperative, operating within
Nigeria’s oil industries to assist members in combating spills that are beyond their individual
capacity. The Company is also a corporate member of the Nigeria Environmental Society
(NES – Nigeria Premier Environmental NGO). Chevron adopts environmentally friendly tenets
and engenders safety on all producing facilities. To this end, Chevron has also carried out an
extensive, multi-million Naira upgrading and replacement of production platforms for secondary
treatment of produced water to remove oil and grease. There are other programmes within and
outside the Company aimed at improving the health, safety and the environment (HSE) such as
STOP (Safety Training Observation Program), SLA (Safety Leadership Authorization) among
others.
7

Chevron Nigeria Limited, in collaboration with Chevron Oil (Nigeria) Ltd has built and
presented to an NGO, the Nigeria Conservation Foundation (NCF), a multi-million Naira
Environmental Research and Education Center called ‘The Lekki Conservation Center’.
1.2.5 MANPOWER CAREER DEVELOPMENT The Company has over two thousand (2000) national staff in addition to other expatriates
working in Nigeria. Nigerians account, for about 90% of the total staff strength of the Company
in Nigeria. Some Nigerians occupy key technical, supervisory and managerial positions. It is of
note that the current Deputy Managing Director of the Company is a Nigerian. Chevron as a
company regards employees as its greatest asset and spares no expense on their training and
development. Employees attend training courses locally and internationally on regular basis in
addition to international assignments, that provide staff with necessary exposure for personal
career development.
1.2.6 STAFF WELFARE PROGRAMMES Chevron offers various benefit and incentives to staff with necessary retirement packages. These
include a home ownership scheme, a medical scheme, which take care of the employees and
their families, and a savings plan that guarantees enhanced terminal benefits for the employees.
8

There exists also the Educational Assistance scheme, which enables employees to further their
education and a similar scheme is targeted at employees’ children. The Company also operates a
non-contributory pension plan, which guarantees regular monthly payment to employees after
retirement.
1.2.7 COMMUNITY DEVELOPMENT IN CHEVRON
Chevron Nigeria Limited cherishes its good relations with its host communities and maintains
a sensitive approach to their needs. The company’s community development programs funded
and executed in collaboration with its joint venture partner, NNPC, are based on its philosophy
that it would rather be identified with long lasting projects that would be relevant and beneficial
to greater majority of the people than support transient schemes. In pursuit of this policy, health,
education and infrastructural development are given pride of place. The manifestation of this
commitment includes the provision of a multi-million naira community cottage hospital for the
benefit of the company’s closest neighbors in Escravos areas; the donation of medical equipment
to health institutions in various communities, the building of classrooms blocks and the provision
of scholarships to deserving students nationwide at the secondary and tertiary levels. Also
Chevron has dug several water canals to facilitate transportation and commerce in its areas of
operations as most of the areas are water-logged riverine areas.
9

Furthermore, Chevron pledged a $5m community development programme to improve the
quality of life for the people living in the Niger Delta areas. This was launched in partnership
with the International Foundation for Education and Self Help (IFESH) in November 1999.
The program is aimed at addressing critical social, economic and development issues through
skills development, basic education, health education, enterprise development and food
production. Specifically the programme involves training and facilitating the self-employment of
approximately 1000 youths; strengthen the food production capacity of fishermen / farmers in
Chevron’s area of operations; providing basic education for primary school children, literacy
classes for adults and teachers, (training for primary school teachers).
1.3 UGBORODO TOWN, HOST COMMUNITY FOR THE CHEVRON’S HUB
OPERATIONAL AREA IN THE NIGER DELTA NIGERIA.
Ugborodo community, which is the major town or center nearest to Chevron Nigeria Limited
operational hub, is located 110 kilometer from Warri city. It is situated approximately 5o 12’E
and 5 o 34’N of the equator. The estimated population of the community is put at between
500,000 and 2,000,000 inhabitants in several small towns and villages. Ugborodo is a generic
name for the entire community.
10
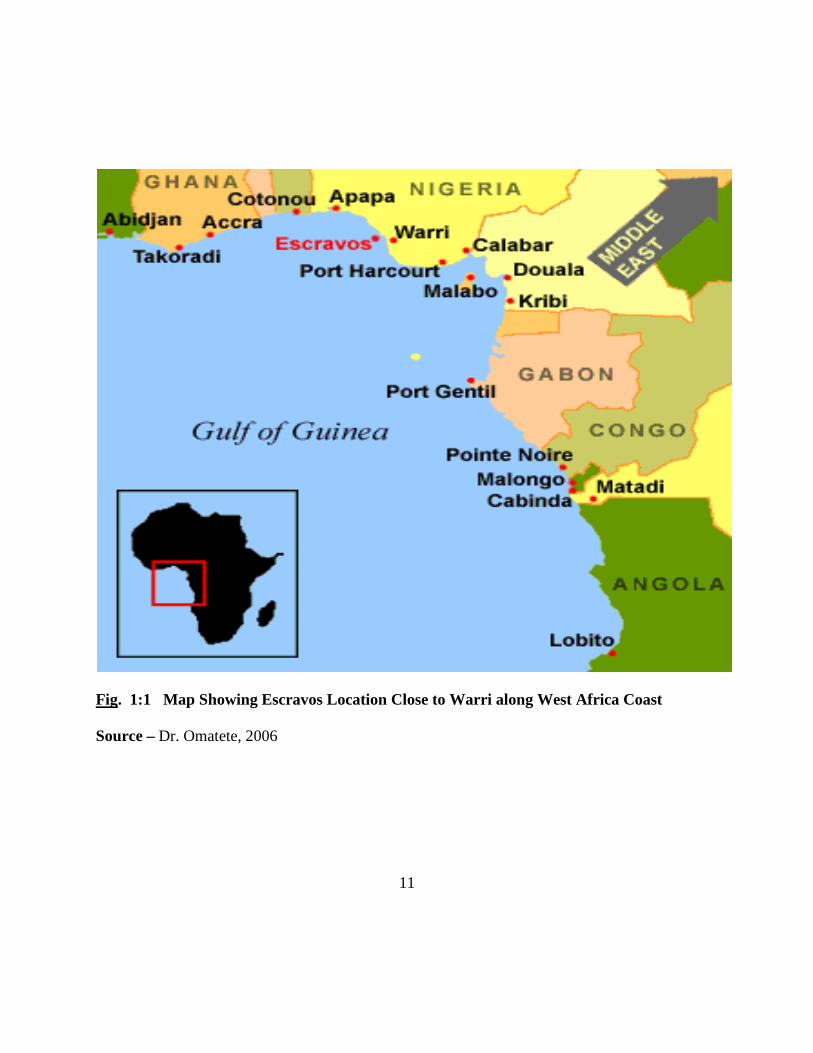
Fig. 1:1 Map Showing Escravos Location Close to Warri along West Africa Coast
Source – Dr. Omatete, 2006
11

Fig: 1.1a Location Map showing the study Area (Ugborodo Community) Source: Preliminary Assessment Report on EIA for the Escravos Gas Project Nov. 1992. Prepared by the University of Lagos Consultancy (Unilag Consult.)
12

The inhabitants of Ugborodo are Itsekiris who are the aborigines. The community
(Ugborodo) is now thinly populated due to several inter-ethnic conflicts and the rivalry
between the Itsekiris and the Ijaws that causes almost endless fighting. It is believed that over
50% to 90% of the community land had also been eroded into the ocean due to the oil
exploration and production activity by the oil industry.
The community’s major sources of livelihood include fishing and subsistence
agriculture. This community’s traditional economic activities have started dwindling and
believed to have collapsed due to the oil exploration and production activities in the area. Today,
fishing can no longer guarantee the indigene’s stable incomes to keep the family.
Consequently many of them (youths and adult males) have turned to miscellaneous contract jobs
with Chevron or Shell Petroleum Development Company. Many jobless youths still roam the
villages.
13
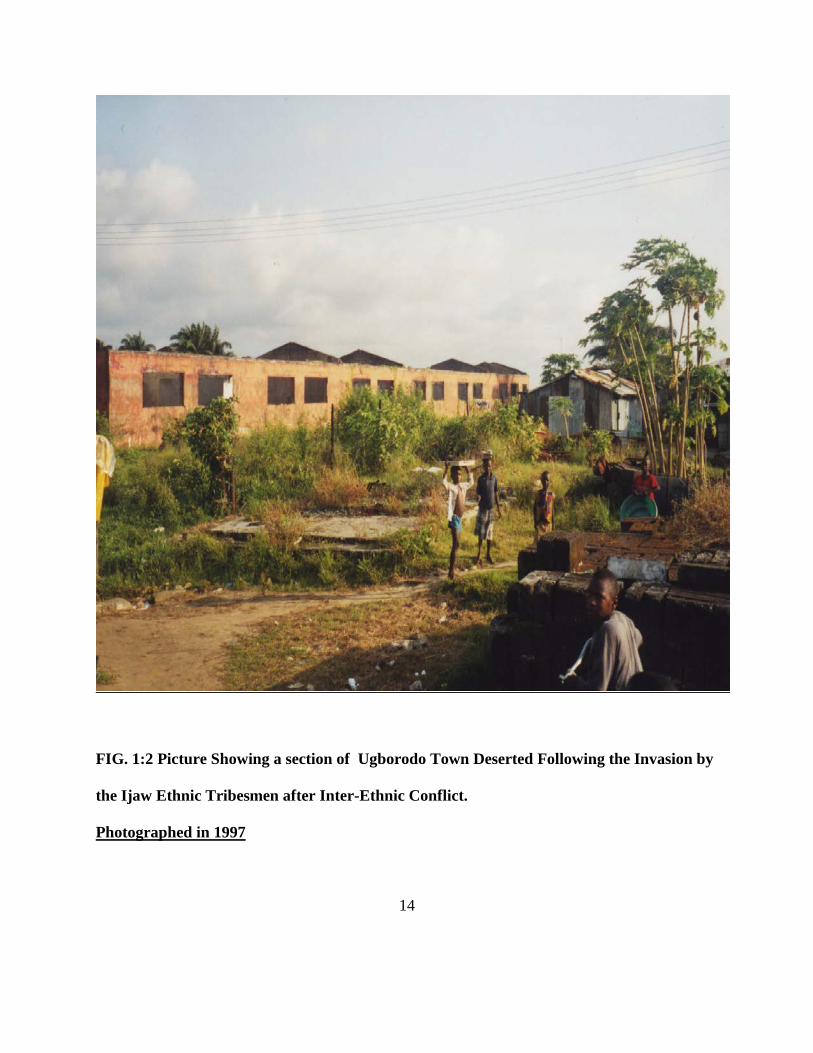
FIG. 1:2 Picture Showing a section of Ugborodo Town Deserted Following the Invasion by
the Ijaw Ethnic Tribesmen after Inter-Ethnic Conflict.
Photographed in 1997
14

DOC ID© Chevron 2005
12
FIG. 1:3 Picture Showing Chevron Nigeria Ltd Hub Operational base and Ugborodo Town
in background
Source: Photographed in 1996. Extracted from Chevron News.
15

1.4 STATEMENT OF PROBLEM
The major cause of conflict and civil unrest in the Niger Delta has been the massive
environmental degradation in the past decades resulting from oil production activities. Rural to
urban migration has been on a steady increase in Nigeria especially in the Niger Delta Region
due to several factors. This immigration has been attributed in part to a lack of rural development
programmes which should ordinarily entice the local populace to remain in their communities to
develop local technologies there, even in the midst of oil exploration and production. Rural
development programmes have unfortunately not been fully utilizing the most valuable resource
of the indigenous people themselves, and have not been based on their values. Instead local
people have traditionally and continuously been relegated to the sidelines. Sustainable
development has continuously eluded people in the Niger Delta of Nigeria over the years despite
the fact that the Niger Delta is the third largest mangrove ecosystem in the world covering about
seventy thousand (70,000) square kilometers. The Niger Delta, a region most remarkable for its
oil rich deposits has been exploited actively for the last five decades. The questions that therefore
arise are:
(a) How ecologically sustainable are the broad environmental practices adopted so far by the oil
companies, especially in the Niger Delta area?
(b) What is responsible for the general neglect by both the oil companies and the successive
Nigerian Governments?
( c ) What is responsible for the loss of productivity and general poor quality of life in the Niger
Delta?
16
Most communities in the Niger Delta are not only deprived of access to natural resources but
are also not adequately compensated for loss of homelands due to the oil exploration and
exploitation activities.
The entire situation is further exacerbated and compounded by lack of social amenities – in the
rural communities. Social infrastructures such as potable water, public utilities, roads, hospitals,
schools are absent in most of the communities.
Moreover, the nonchalant behaviour of most of the oil companies regarding oil pollution from
activities within the oil industry further worsens the bad situation
In the light of this, it is important to examine whether it is possible to prevent, and / or avoid
degradation of the environment in the oil producing areas and where such despoliation had
occurred, examine what attempts are being made for clean-up and consequent restoration of the
environment.
This study will attempt to provide answers for all of the above questions. The study will
critically assess the problem using the situation in the Ugborodo Community in Warri South
Local Government of Delta state, a nearby host community in Chevron Operational base in
Escravos in the Niger Delta as case study.
17

1.5 AIMS AND OBJECTIVES OF THE STUDY
This research is motivated by the increasing concern for the Niger Delta environment as a
whole and the Chevron’s base host Community, Ugborodo in particular. The specific objective
of this study is to examine the various problems of the oil producing communities in the
Niger Delta vis-à-vis the activities of the multinational oil companies in Nigeria. The general
objectives of the study include:
a) To examine the impact of oil pollution on the environment (especially the ecology such
as land, air and aquatic environment), including selected oil hydrocarbon toxicological
studies.
b) To assess management strategies put in place for solving environmental oil pollution in
order to achieve a sustainable society.
c) To examine available plans for managing the interface between different stakeholders to
achieve peaceful coexistence in the oil producing communities.
d) To examine existing strategies for poverty alleviation, promotion of integrated rural
development, and local empowerment /employment generation.
e) To make suggestions on how multinational oil companies in Nigeria can make significant
contributions to the development of a more environmentally friendly Niger Delta,
particularly in the Ugborodo community.
18
1.6 JUSTIFICATION OF THE STUDY
The nexus of oil pollution management and sustainable development has been an issue already
well recognized by the Federal Government of Nigeria and oil companies operating in the Niger
Delta due to its sensitivity. Therefore the current study is complementary and as well as
important to the government, oils producing companies and the citizenry of Nigeria. The
research is also worthwhile for it could form the basic frame work for providing both primary
and secondary information for further study on the subject and can also assist Chevron Nigeria to
assess the performance of its corporate social responsibility efforts in Ugborodo its host
community.
The community ‘Ugborodo’ has all the characteristics of a typical oil producing
community and these make it a true reference point / case study for the Niger Delta and its
associated problems.
Ugborodo community is faced with issues of environmental degradation, deprivation and
unsustainable development. It is quite obvious from this point of view that Ugborodo
community’s numerous problems could be resolved through the proper and adequate
application of sustainable development principles, precepts and practices, which could in turn
be replicated in all other oil producing communities within the Niger Delta, and in fact in
all other oil producing communities, of the Niger Delta in general.
19
1.7 SCOPE AND LIMITATION
The scope of this work covers:
• An assessment of oil pollution and management,
• Toxicity effects of crude oil on test organisms - tilapia fish and earthworms.
• Environmental impact of pollution on the Ugborodo study community and other selected
areas
• Examination of sustainable development practices (if any) in the Ugborodo community.
• Assessment of Chevron Nigeria Limited corporate social responsibility, contingency
plans, bioremediation plans, etc. in the community and other relevant matters.
The major limitations in the study were mostly due to time and resources.
20
1.8 RESEARCH PLAN
The research work consist of five chapters, starting with Chapter One, which covers an
Introduction - the nature and sources of oil pollution; chemical composition, degree or categories
of pollution; Chevron Nigeria Limited’s historical background, business history etc., The chapter
also deals with production fields, the Chevron’s Escravos Gas project, Chevron Nigeria
Limited’s (a) Safety and environmental protection practice,
(b) Manpower and development, and
(c) Staff welfare; the chapter also covers a treatise on the Ugborodo Community. Statement of
problem, aims of the study, scope and limitation.
Chapter Two is made up of literature review of environmental assessment as applicable to the oil
industry in Nigeria, and the various community development efforts of Chevron Nigeria Limited.
Chapter Three of the project work and report discusses the methodology of the research study
and the various research instruments used.
Chapter Four covers the research results obtained from the data collected and the analysis of the
data and findings.
Chapter Five summarizes the findings of the study and includes the recommendations arising
from the study.
21

CHAPTER TWO
LITERATURE REVIEW
2.1 INTRODUCTION
In an attempt to improve his living condition and make life much easier for him, man’s rapid
advancement in technology has in no small way contributed vastly to the increase in
environmental pollution. Man’s activities such as food production and processing,
manufacturing, packaging and agriculture have continually produced waste of diverse chemicals
components. In the heart of pollution of the environment are arrays of chemicals, which are
introduced directly or indirectly into the environment.
Early humans undoubtedly, lived in some harmony with the environment, as did other animals.
Their retreat from the wilderness began with the first prehistoric agricultural revolution. Then the
ability to control and use fire allowed the early humans to modify or eliminate natural vegetation
and the domestication and herding of grazing animals resulted in over grazing and soil erosion.
The demand for wood has equally depleted the forests. While human populations remained small
and human technology modest, their impacts on the environment was at the best localized.
As population increased and technology improved and expanded, however, more significant and
widespread problems arose. With the industrial revolution, human beings began in earnest to
change the face of the earth, the nature of its atmosphere and the quality of its water.
22

Today unprecedented demands on the environment from a rapidly expanding human population
and from advancing technology are causing a continuing and accelerating decline in the quality
of the environment and its ability to sustain life.
Thousands of people die every year from illnesses caused by environmental pollution while
thousands other suffer chronic disabilities such as diminished physical strength and endurance,
lower intelligence and lack of alertness. Pollutants are substances in the environment, which as a
result of man’s activities become a threat to health, safety and quality of life. (Wild, 1972)
2.2 CRUDE OIL DEFINITION:
Crude oil is a complex mixture of mainly hydrocarbon components with differing physical,
chemical and biological properties. The basic product obtained from geological strata, is termed
crude oil. Crude oil is similar to coal in that it is greatly enriched in carbon and hydrogen
compound as compared with the average composition of the earth crust. From this a wide range
of other products are derived during refining processes. In order of increasing densities, the main
ones can be classified as Gases, Petrol, Kerosene, Fuel oils, Asphalt and Paraffin.
23

The physical and chemical characteristics of these products differ to some extent
depending upon the crude from which they are derived (i.e. whether light or heavy
crude). Crude oils contain light fraction similar to petrol, and heavy wax fractions as
well.
The composition of any particular crude will depend upon the source and may vary from
a volatile fluid to a viscous semi solid. For example the sulphur content of crude oil
ranges from 0.18 - 2.60/kg in mass depending on the origin of the oil. Sulphur is present
as sulphide mercaptans, thiophenes and more complex organic sulphur compounds which
are present in most crude oils at less than 1g/kg, but some may also contain some
naphteric acids and phenolic compounds.
Crude oils vary widely in appearance and consistency from country to country and from
fields. Its ranges from yellowish brown mobile liquids to black, viscous semi solids. See
Table 2.1 page 27 on characteristics properties of Nigerian crudes. Crude oils are usually
classified into three groups, according to the hydrocarbons they contain:
(a). Paraffin base crude oils: These consist of paraffin but little or no asphaltic matter.
They consist mainly of paraffinic hydrocarbons and usually give good yields of
paraffin wax and high grade lubricating oils.
(b) Asphaltic base crude oils: These contain little or no paraffin wax but asphaltic
matter is usually present in large proportions. They consist mainly of naphtenes
yielding lubricating oils that are more viscosity sensitive to temperature than those
from paraffin based crude oils.
24

( c) Mixed based crude oils: These contain substantial amount of both paraffin wax and
Asphaltic matter. Both paraffin and naphthene are present in certain proportion of
Aromatic hydrocarbons. Although most crude oils exhibit a considerable overlapping
of the type described above and by far the majority are of the mixed base type.
Oil spillage is a form of industrial pollution associated with the exploration and
transportation of petroleum. Inhabitants of the oil producing areas have since come to live
with this hazard. Oil spills have ravaged the livelihood of many Nigerians in the oil
producing areas in general and Niger Delta in particular. Most spillages occur as a result
of corrosion in the pipelines used for oil production. Spillages could sometimes be quite
devastating on people and environment. Ifeadi and Nwankwo (1987) grouped the various
causes of oil spills that occurred between 1976 and 1986 under eight headings as follow:
a. Blow Outs: Oil well blow out occurs when the well is not kept under control
that is to behave in such a way that the hydrostatic mud head counter balances
the formation pressure and prevents the formation fluid from entering the well
formation during drilling operations.
b. Sabotage: When the cause of spill is mischievously deliberate and not
accidental.
C Corrosion: When the cause of leakage is rusty equipment.
25

d Equipment Malfunction: Breakdown and failure of equipment are often the
most frequent causes of separator and tank over-flow.
e Operations / Maintenance Error: Bad oil operation practices like untrained
personnel and lack of maintenance of the equipment.
f Natural causes (rain, flood, etc.)
g. Accident from third party
h Unknown Causes.
26

Table 2.1 SOURCES / CAUSES OF OIL POLLUTION
SOME OF THE SOURCES OF OIL POLLUTION IN NIGERIAN OIL
INDUSTRY OPERATIONS
S/N ACTIVITIES/OPERATIONS SOURCES OF POLLUTION
1. EXPLORATION Noise from Detonation processes, Movement of
Heavy and Light Vehicles, Rattling of
Drilling Rigs 24hours daily, Problem of Disposal
of Spent Lubrications, Diesel and Domestic Waste,
Spent Drilling Muds, Chemicals and Well Blow
Outs.
2. REFINING AND
PETROCHEMICAL
PROCESSES
Effluent Discharges, Gas Flaring and Emissions,
Tank Leakages, Valve Malfunctioning, Human
Errors, Exploration and Fire Outbreaks.
3. PIPELINE AND PRODUCT
MARKETING
OPERATIONS (PPMC)
Pipeline Leakages and Ruptures, Tank Leakages
and Overflows, Road Tanker and Sea Tanker.
Collisions, Malfunctioning of Valves and Pumps at
Jetties or Depots and Hose Ruptures.
Source: Nwankwo and Irrechukwu, 1981.
27
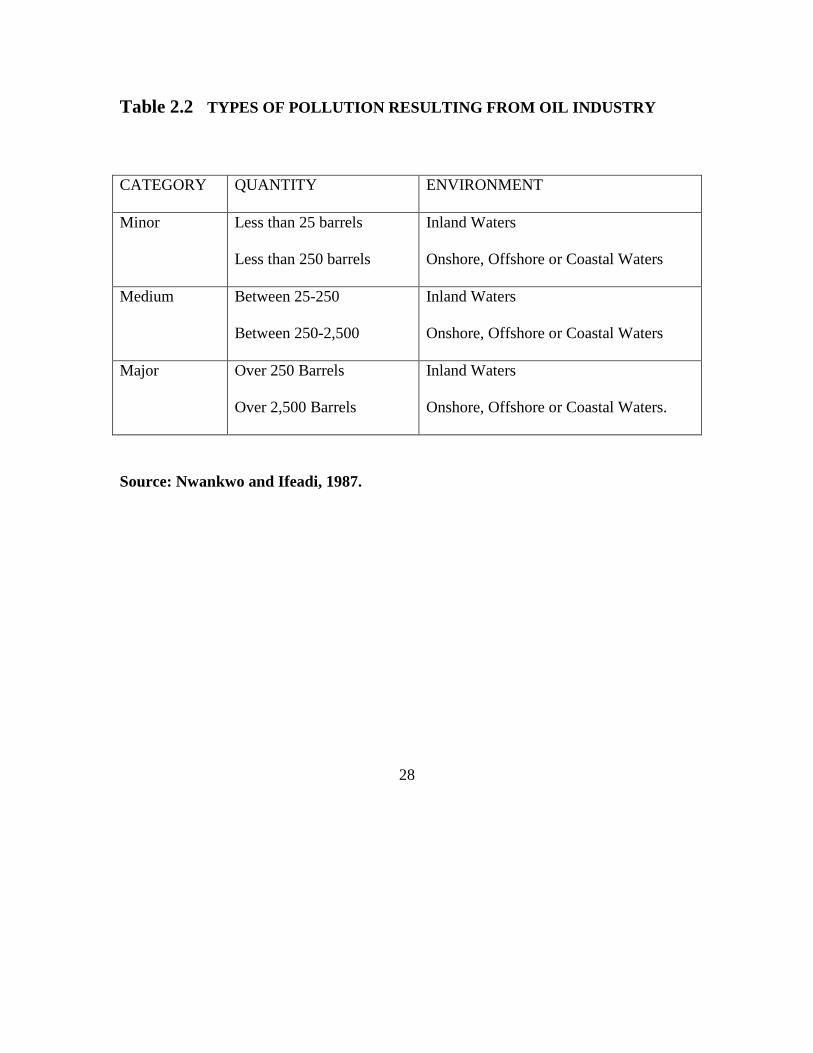
Table 2.2 TYPES OF POLLUTION RESULTING FROM OIL INDUSTRY
CATEGORY QUANTITY ENVIRONMENT
Minor Less than 25 barrels
Less than 250 barrels
Inland Waters
Onshore, Offshore or Coastal Waters
Medium Between 25-250
Between 250-2,500
Inland Waters
Onshore, Offshore or Coastal Waters
Major Over 250 Barrels
Over 2,500 Barrels
Inland Waters
Onshore, Offshore or Coastal Waters.
Source: Nwankwo and Ifeadi, 1987.
28

Nwankwo and Ifeadi, (1987) also grouped the operations within the industry were
into eight categories:
a. Pipeline (Trunk, Delivery, Gathering line etc)
b. Flow Station, Trunk farm.
c. Well Head.
d. Drilling Site.
e. SMB, BOP, Terminal.
f. Depots / Pump Station.
g. Refinery.
h. Unknown source (mystery spill)
As noticed from the type of pollution resulting from oil industry categories table 2.2
the quantities spilled on swamp location were also higher than those spilled on land
for the various classes of oil spills. The respective frequencies of oil spills together
with the quantities spilled for various causes of spills and operational sources or
locations of such spills are summarized in Table 2.3
29
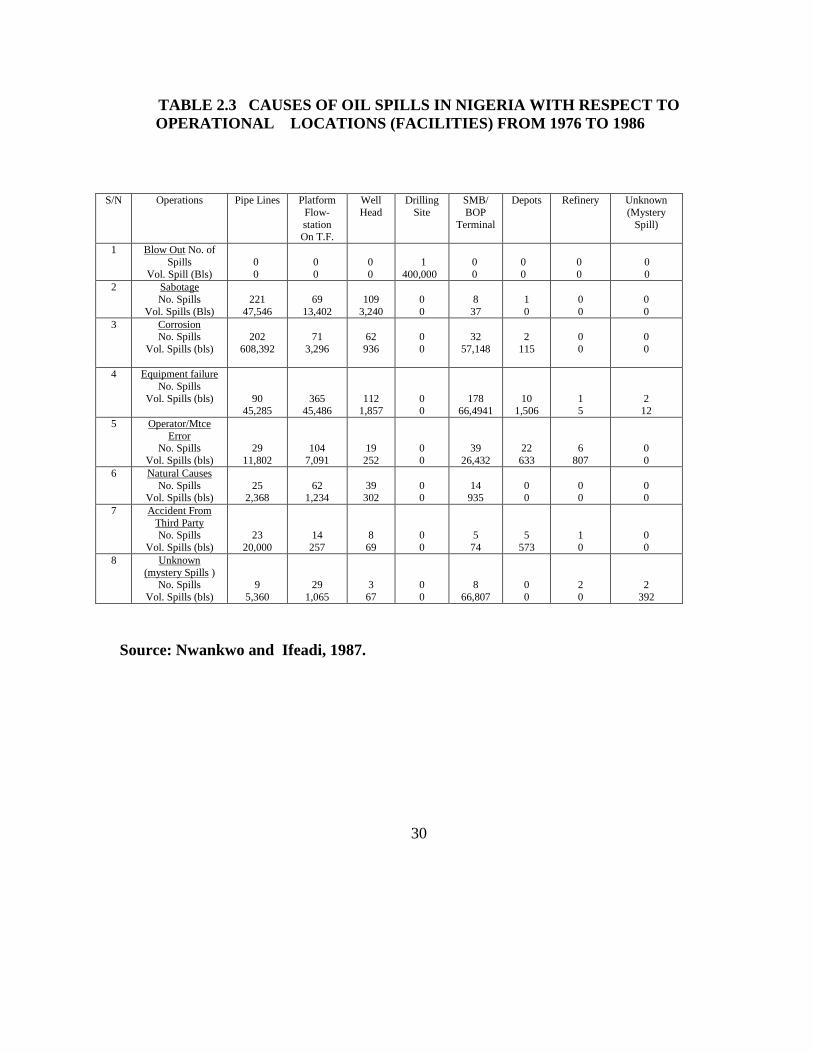
TABLE 2.3 CAUSES OF OIL SPILLS IN NIGERIA WITH RESPECT TO OPERATIONAL LOCATIONS (FACILITIES) FROM 1976 TO 1986
S/N Operations Pipe Lines Platform Flow-station On T.F.
Well Head
Drilling Site
SMB/ BOP
Terminal
Depots Refinery Unknown (Mystery
Spill)
1 Blow Out No. of Spills
Vol. Spill (Bls)
0 0
0 0
0 0
1 400,000
0 0
0 0
0 0
0 0
2 Sabotage No. Spills
Vol. Spills (Bls)
221
47,546
69
13,402
109
3,240
0 0
8
37
1 0
0 0
0 0
3 Corrosion No. Spills
Vol. Spills (bls)
202
608,392
71
3,296
62 936
0 0
32
57,148
2
115
0 0
0 0
4 Equipment failure No. Spills
Vol. Spills (bls)
90 45,285
365 45,486
112 1,857
0 0
178 66,4941
10 1,506
1 5
2 12
5 Operator/Mtce Error
No. Spills Vol. Spills (bls)
29 11,802
104 7,091
19 252
0 0
39 26,432
22 633
6
807
0 0
6 Natural Causes No. Spills
Vol. Spills (bls)
25
2,368
62
1,234
39 302
0 0
14
935
0 0
0 0
0 0
7 Accident From Third Party No. Spills
Vol. Spills (bls)
23 20,000
14 257
8 69
0 0
5
74
5 573
1 0
0 0
8 Unknown (mystery Spills )
No. Spills Vol. Spills (bls)
9 5,360
29 1,065
3 67
0 0
8
66,807
0 0
2 0
2 392
Source: Nwankwo and Ifeadi, 1987.
30
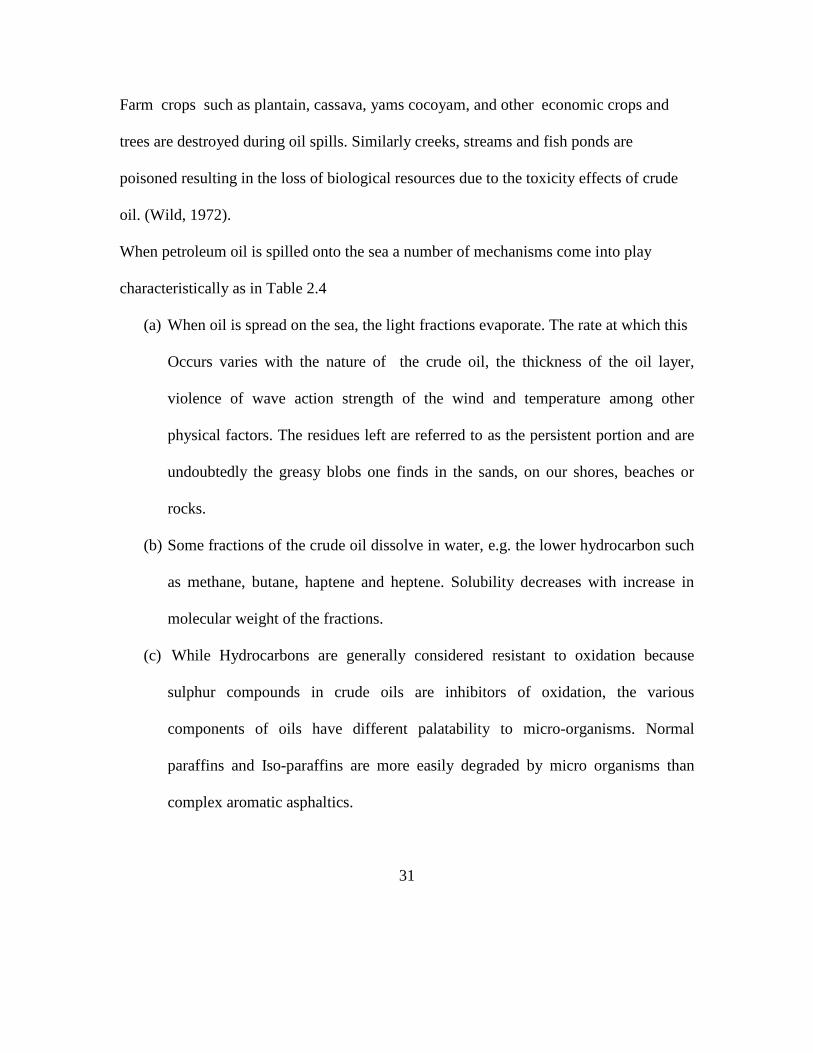
Farm crops such as plantain, cassava, yams cocoyam, and other economic crops and
trees are destroyed during oil spills. Similarly creeks, streams and fish ponds are
poisoned resulting in the loss of biological resources due to the toxicity effects of crude
oil. (Wild, 1972).
When petroleum oil is spilled onto the sea a number of mechanisms come into play
characteristically as in Table 2.4
(a) When oil is spread on the sea, the light fractions evaporate. The rate at which this
Occurs varies with the nature of the crude oil, the thickness of the oil layer,
violence of wave action strength of the wind and temperature among other
physical factors. The residues left are referred to as the persistent portion and are
undoubtedly the greasy blobs one finds in the sands, on our shores, beaches or
rocks.
(b) Some fractions of the crude oil dissolve in water, e.g. the lower hydrocarbon such
as methane, butane, haptene and heptene. Solubility decreases with increase in
molecular weight of the fractions.
(c) While Hydrocarbons are generally considered resistant to oxidation because
sulphur compounds in crude oils are inhibitors of oxidation, the various
components of oils have different palatability to micro-organisms. Normal
paraffins and Iso-paraffins are more easily degraded by micro organisms than
complex aromatic asphaltics.
31

There seems to be general agreement that anaerobic utilization of crude oil hydrocarbons
by micro-organisms either does not occur or is so slow that it can be neglected,
Hence, any oil sunk to the bottom of the sea, where oxygen content is low, can be
expected to remain more or less indefinitely.
TABLE 2.4 CHARACTERISTIC PROPERTIES OF NIGERIAN CRUDE
S/N Characteristics Bonny
Light
Akwa-Ibon
Light
Escravos
Light
Brass
Blend
Forcados
Blend
Bonny
Medium
Penington
Light
1 Specific
Gravity 60/60f
0.8498
/35.0
API
0.8448/
36.0 API
0.8448/
36.0 API
0.8108
/43.0
API
0.8762/ 30
API
0.8984/
26.0 API
0.8448/ 36
API
2 BS&W IP
359(Vol.%)
0.12 0.16 0.09 0.08 0.08 0.15 0.12
3 Pour Point 0C 5.4 12.0 7.2 11.0 -23.0 -40.0 3.0
4 Reid Vapour
Pressure (Psi)
4.9 5.6 5.0 6.60 3.0 1.6 3.4
5 Sulphur
Content
0.11 0.12 0.14 0.10 0.20 0.20 0.10
Source : Nigerian National Petroleum Corporation 1972.
32
TABLE 2.5 PHYSICO-CHEMICAL PROPERTIES OF BONNY LIGHT CRUDE OIL TEST RESULT
API Gravity at 60f 33.7
Specific Gravity at 60f 0.8565
Viscosity at 70f (cst) 9.832
Viscosity at 100f (cst) 4.099
Viscosity at 130f 3.112
Viscosity at 70f (sus) 58.2
Viscosity at 100f (sus) 59.5
Viscosity at 130f (sus) 36.4
Flash Point (0C) <0
Pour Point (0C) +7
Sulphur (wt) 0.10
Mercaptan Sulphur (% wt) <0.0001
Hydrogen Sulphur (% wt) <0.0001
Total Nitrogen (% wt) 0.57
BS&W (% Vol.) 3.2
Neutralization Number (mg KOH) 0.40
Reid Vapour Pressure (psi) 4.2
Conradson Carbon Residue (% wt) 1.03
Ash Content (% wt) 0.02
Nickel Content (ppm) 2.1
Vanadium Content (ppm) 0.1
Sodium Content (ppm) 19.3
Wax Content (% wt) 13.04
Carbon Content (% wt) 83.92
Hydrogen Content (% wt.) 12.46
Oxygen Content (% wt.) N/P
Asphaltene Content (% wt.) 0.14
Total Chloride 0.0038
Source: Nigerian National Petroleum Corporation 1972
33
TABLE 2.6 COMPARATIVE SIGNIFICANT CRUDE OIL PROPERTIES Characteristics Libyan
/Zelten
Nigeria
Light
Iran
Light
Iran
Heavy
Iraq
Kirkuk
Kuwait Venezuela
(M) Specific Gravity
0.829 0.867 0.854 0.869 0.845 0.869 0.896
Sulphur Content (%wt)
0.21 0.11 1.33 1.58 1.88 2.5 1.54
Kinematics Viscosity 100f Centistokes
4.13 5.16 5.6 8.83 4.75 9.6 33.75
Pour Point f. 45.0 5.0 -5 10.0 -30 -25.0 -30.0 Wax Content (% wt)
11.4 8.5 7.0 6.7 6.5 5.5 4.8
Asphaltenes (%wt)
0.13 0.5 0.7 1.9 1.3 1.4 3.05
Vanadium Content (ppm)
5.0 5.0 36.0 107.0 25.0 27.0 170.0
Acidity (mg. KOH/g)
0.19 0.14 0.07 0.13 0.17 0.15 0.41
Residue>700f. %wt
37.5 35.8 42.7 47.8 39.8 51.3 57.7
Residue>700 pour point
100.0 110.0 80.0 80.0 80.0 70.0 50.0
TABLE 2.3 Source: Nigerian National Petroleum Corporation 1972.
Tables 2.4 and 2.5 above show some unique property of different characteristics of
varying crude oil in Nigeria as well as physic-chemical properties, while Table 2.6 is an
example of comparative significant crude oil properties.
34
Furthermore, when oil is spilled on land the light fractions evaporate while the remaining
oil migrates down-wards under the force of gravity. The mobility of the oil depends on its
viscosity, quantity of oil spilled and the permeability of the oil. During its movement,
there is absorption and reactions between the oil and the rock matrix tending to
immobilize and attenuate the oil (Wild, 1972). Crude and petroleum products in soil are
bio-degradable by bacteria in the presence of trace salts and adequate dissolved oxygen.
The toxicity increases along the series paraffins, napthenes and olefin to aromatic
(Crapp , 1981a);
2.3 TOXICITY OF CRUDE OIL HYDROCARBONS
In each series of hydrocarbons, the smaller molecules are more toxic than the larger ones.
Octane and decane are very toxic, while duo-decane and higher paraffins are almost non-
toxic. However, carbon-12 olefin and carbon-12 aromatic are quite toxic.
Toxicity could be inversely correlated with water solubility; this idea was first put
forward by Baker et al 1981, which also found out that in crude oils, higher toxicity was
generally associated with the aromatic fractions boiling below 149 degree Celsius. Some
oils increase in toxicity when exposed to light due to the formation of acids and some
increase in toxicity with storage. While the boiling range influences toxicity independent
of the hydrocarbons. The boiling range 150-2750C (the naphtha and kerosene fractions
are the most toxic). The toxicity is also influenced by viscosity and surface tension
(Baker, 1981).
35
2.4 ENVIRONMENTAL IMPACT OF OIL EXPLORATION ACTIVITIES ON
ECOSYSTEMS
2.4.1 EFFECT OF OIL
Crude oil exploration and activities of the oil industry profoundly affect the physical,
biological and aesthetic value of the environment and the economic life and health of the
local people and even the more distant environment.
(a) EFFECT ON SURFACE WATER (streams, rivers, sea).
Minor cases can damage a large volume of water making it unusable for a long time. The
most serious aspect of oil pollution is the possibility of the contamination of rivers and
other inland waters that serve as sources of drinking water. There are many incidents in
Nigeria where drinking water supplies were contaminated by oil. One case in history that
can illustrate this point is the Funiwa-5 oil well blow out of January 1980. This Well
owned by Texaco Overseas Petroleum Company Nigeria Unlimited (TOPCON), blew out
on January 17, 1980, releasing an estimated 200,000 barrels of crude oil into the sea. Due
to high tides and roughness of the sea, coupled with prompt cleaning up operations using
chemicals and sawdust, most of the oil was dispersed and cleaned up. Crude oil was
however found on the adjacent beaches and mudflats even five months after the blowout.
Sheenly water was observed in shallow holes dug in the beach. Coastline villages such as
Fish-Town, Sangana, Koulama-1, Kounama-2 and Otuo Island, all of which are built on
abandoned, beach ridges were affected.
36
As a result of the oil spillage the fresh surface waters used by the villages became
contaminated to the extent that both Texaco Overseas Petroleum Company (TOPCON)
and the Rivers state Government had to drill boreholes to provide ground water, (Alo et
al (1982).
(b). EFFECT ON FLORA: The mangrove swamps and salt marshes are the most
sensitive of the shoreline types (Gundelach, et al 1981). Floating oil is usually transported
by waves and currents and stranded along the shoreline where it accumulates, especially
in low wave energy ecosystem like mangrove swamps. This means that even where a
spillage occurs offshore, it may, if unchecked, be transported through the many
indentations along the shoreline into the inland waters, lagoons and estuaries by the tidal
action of the sea. Although, there are differences between oil spill sites, generalized
responses have been observed to be common to many areas. Gundelach et al (1981)
indicated that where a spillage occurs within the mangroves system and both trees and
root systems are oiled, defoliation and tree death occurs rapidly within months and where
the mangrove is killed outright, numerous stress responses, both on the tree as well as
mangrove associated organisms may follow, e.g., tree mortality, defoliation of canopy,
root mortality, development of abnormal adventitious pneumatophore, leaf deformities,
reduction in tree girth etc.
37

The findings of Imevbore (1981) two months after the Funiwa-5 blowout showed
yellowing of mangrove trees, complete defoliation of trees and fallen, uprooted, dead
defoliated trees.
In a study of the impact of a minor oil spillage in the estuarine Niger Delta, Ekweozor,
and Snowden, (1987) observed about 10-38% oiling of the Rhizophora mangle plant
roots and 27-51% oiling of the juvenile Rhizophora mangle plants. They noted that the
mangrove trees showed some yellowing of the trees followed by partial defoliation as a
result of the oiling. Some of the juvenile red mangroves died after 2-3 months of the
incident.
This general pattern of response by mangroves in the Niger Delta following oil spills is
consistent with that reported in the other areas of the world. For example, it was
estimated that about five hectares of mainly red mangroves (R-mangle) were killed
following the “Santa Augusta” spill in the Island of St. Goix, Similarly the death of
juvenile red mangroves observed by Snowden and Ekweozor (1989) following oiling as a
result of a spillage was in agreement with who noted that 50% oiling of the leaves of
Rhizophora mangle seedling following an oil spill in Florida resulted in their death, and
also 50% oiling of pneumatophores of Avicenia had the same effect.
38

As the effect of spillage on mangrove depends on the amount of oiling on the plants,
estimation of the percentage of oiling of the mangrove when carrying out impact
assessments may assist predictions as to future deterioration of the mangroves to
produced visible impact on plants though may be minimal during the first 6-12 months of
the spillage except in very heavily spilled areas where smaller trees (less than 1m) may
begin to show defoliation within three weeks and die within five weeks. Larger trees
(3m-6m) begin to show signs of stress and defoliation which will lead to death 12-24
months after the spillage. Damage to mangrove plants are mainly due to the smothering
of pneumatophores of mangroves resulting in oxygen starvation (Imevbore, 1989; and
Baker, 1981). Imevbore (1980) noted that these root systems are adaptations for growth
by plants in soil lacking aeration, and that gaseous exchange takes place freely through
the lenticels and large intercellular spaces.
This oil hinders root respiration causing death to the root cells and loss of physiological
mechanism in the root tip. A coating of oil has also been shown to have the secondary
effect of increasing absorption of solar energy thereby elevating the temperature above
the lethal limits for mangrove plants. The recovery and survival of partially defoliated
mangrove trees are possible if the quantity of oil spilled is within tolerable limits
(Spooner, 1967).
39

( c ) EFFECT ON FAUNA: Most information on the effects of pollution on marine and
estuarine organisms concentrates on benthic and inter-tidal organisms. These organisms
include a large number of species of mollusc, crustaceans, echinoderms polychaetes,
coelenterates and hydroid (Ekweozor (1989). Many of these species, notably oysters,
lobsters and scallops constitute important natural fisheries resources and are also benthic-
amenable to marine ecosystems. A close study of the littoral benthos at the Bonny
Estuary indicates that this ecosystem is much more complex. Thus the existence of one
component of this system depends on the normal function of all the components of the
ecosystem (Ekweozor, (1989). The sensitivity of these organisms is important to the
overall function of the ecosystem as benthic organisms have a critical role to play in the
transfer of energy to fish species, especially the juveniles and benthic feeders. Many
benthic organisms lack mobility, once their free swimming larvae settle out of the water
column, and they remain in the same location for the remainder of their existence. Some
may be capable of every slow, poorly directed movement which can in no way compare
to those of finfish. It is this sedentary life that makes the benthic species good pollution
indicators (Ekweozor, 1989).
These organisms are very susceptible to oil pollution because many of them inhabit the
inter-tidal zone, where they become easily coated with oil and smothered when oil drifts
onshore. In one of the detailed impact studies following the Funiwa-5 blowout, it was
suggested that the mangrove plant communities were an important breeding ground for
some marine fish, and deforestation following oil pollution had adverse effects on the
local fishing industries.
40

The spill had caused the death of edible crabs such as Callinectes pallidus, Uca tangere
and ostia tilapia (Imevbore 1980). However, Ekekwe (1981), recorded that mortalities in
the intertidal and subtitle communities were not on large scale, but included oysters,
Littering and Tympanotonus fuscata. In a study of the effects of minor spillages within
the estuarine Niger Delta, reduction of microfaunal density and diversity within the
intertidal zone close to the spill site occurred. Other effects observed were increased
mortality of Oysters and a reduction in the fiddler crab populations
41

2.4 TRENDS IN OIL EXPLORATION AND PRODUCTION IN NIGERIA
Foreign participation in the Nigerian petroleum industry dates back to the early 20th
century when European authorities recognized oil as the fuel of the future and
encouraged private businesses to undertake aggressive exploration all over the world. In
Britain, specifically, the Royal Navy had begun its changeover from coal to oil fuel and a
British contributor observed in the monthly journal, The Nineteenth Century, that "there
is no bigger and no more obvious gap in our...Imperial equipment than the paucity of our
supplies of oil." British oil companies, therefore, began exploration in Trinidad, the East
Indies, Burma, Persia and elsewhere.
Although the Persian oil fields that were already in production, had vast reserves, were
closer to the surface and therefore required no new technology, the imperial authorities
nevertheless realized that the involvement necessary to assure that Britain secures
supplies from that region might lead to certain political and strategic complications. They
therefore considered that a similar source of oil within the British Empire, if discovered,
would be ideal. The introduction of the Nigeria Bitumen Corporation through her
influence on the Government of Southern Nigeria and based on Bergheim - British
Businessman knowledge of the region's geology, that petroleum existed in Southern
Nigeria and that the Nigeria Bitumen Corporation, could find oil, will eventually
achieved a monopoly of prospecting rights in Nigeria by buying up all other drilling
licenses.
42
For the next six years, officials in the Colonial Office protected Bergheim's monopoly of
the prospecting rights, rewrote mining legislation at his request creating the Southern
Nigerian Mining Regulation (Oil Ordinance) of 1907 and provided the Nigeria Bitumen
Corporation with a loan to support its search for petroleum. By 1912, the Corporation had
sunk about 15 wells in Southern Nigeria, eastwards from the Lekki lagoon towards the
Niger Delta, and had already spent ₤143,000 (one hundred and forty-three thousand
pound sterling).
In September of that year (1912), however, Bergheim was killed in an automobile
accident and with him died much of the aggressive drive to find oil in Nigeria. Thus, the
first search for oil in Nigeria ended in mid-1913 and was not resumed seriously for
almost 25 years. Shortly after Bergheim’s death, World War 1 set in and oil exploration
in the country ceased. In 1937, an Anglo-Dutch consortium, Shell D' Arcy came to
Nigeria and had the whole country as one concession. Between 1938 and 1939, the
company drilled seven wells for about ₤16,296 (Sixteen thousand pounds two hundred
and Ninety-six Shillings) around Owerri without any success. This second phase of the
search for oil in the country was interrupted by World War II (1939-1945) but by 1951,
the company had drilled its exploration well, called IHUO-1.
A second well soon followed in 1953 called AKATA-1, with just marginal gas. Between
1953 and 1955, Shell had drilled 13 additional wells. It eventually struck its first
commercial well in 1956 at Oloibiri in present-day Bayelsa State [Obasi, 2006]. That
discovery, after an investment of over 30 million naira, proved the venture commercially
viable.
43
Later, in the same year, more oil was found at Afam in Rivers State. Subsequently, the
construction of pipelines from Oloibiri to Port Harcourt was undertaken to facilitate
export. The export of the first cargo of crude oil took place on 17 February, 1958.
The successes of Shell encouraged other companies to join in the exploration race. Mobil
was awarded the Sokoto Basin, the Benue Trough and fringes of the Niger Delta to
explore in 1956. After some seismic and field geological surveys in the Sokoto Basin
where it recorded no success, it withdrew from Sokoto and obtained license to explore in
the Dahomey Basin. Between 1959 and 1961, Mobil had drilled four wells in Dahomey
Basin which were dry and the company pulled out of the area. Meanwhile, in 1959, the
sole concession right over the whole country, earlier granted to Shell, was reviewed and
exploration rights were extended to other foreign companies.
This was in line with the policy of increasing the pace of exploration, while at the same
time ensuring that the country was not too dependent on one company or nation. Shell
thus, relinquished about 50 per cent of its Niger Delta concession and retained the
successful or potentially successful parts. In April 1960, Tenneco, an American company,
arrived in Nigeria, and was granted a concession along the western coast. This was the
position when, in October 1960, Nigeria gained independence from Britain.
The attainment of independence in 1960 led to intense exploration activities, as the nation
put in place policies that would lead to major economic and political changes in the oil
sector. Firstly, exploration companies outside Britain and America were invited to
establish presence and explore in Nigeria. Oil was also becoming a vital energy fuel, and
44
Nigeria's production had more than tripled from 5,000 barrels per day in 1958, to 17,000
barrels per day in 1960.
Within the first five years of independence, therefore, no less than nine international oil
companies had become active in Nigeria, namely: Shell-BP, Mobil, Tenneco, Texaco,
Gulf (now Chevron), Safrap (now Elf), Agip, Philip and Esso.
These internationals companies were soon joined, in the late 1960s, by Japan Petroleum,
Occidental, Deminex, Union Oil, Niger Petroleum and Niger Oil Resources. The climax
of that era was the formation of the Nigerian National Oil Corporation (NNOC), the
predecessor of the Nigerian National Petroleum Corporation (NNPC), and the admission
of Nigeria into OPEC, the Organization of Petroleum Exporting Countries, in July, 1971.
Oil production had, by this period, moved from 17,000 barrels per day (bpd) in 1960 to
45,000 bpd in 1966 and later to 1 million barrels per day in 1970, shortly after the civil
war. Nigeria's economy became increasingly dependent on crude oil, on account of
revenue accruing thereof, to meet the challenges of the post-civil war era. The Nigerian
government also entered into joint venture agreements with several multinational oil
companies engaged in oil exploration and production activities in the country.
In January 1986, the government introduced more attractive fiscal terms for private sector
participation in oil and gas development in the country. This was through a Memorandum
of Understanding (MOU) providing a guaranteed margin of two dollars per barrel to the
producing companies in exchange for certain exploration and enhanced recovery
commitments.
45

Five years later, in 1991 the government offered new MOU's which provided for much
better terms in recognition of inflation and to encourage foreign partners to continue to
expand their investments. Since then, the investments of the major oil companies in the
country have risen steadily in response to these incentives.
This response has been most evident not only in the oil sector but also in the vast and
continuing expansion of activities in the gas sector, led by Shell, Mobil and Chevron.
Chevron Nigeria Limited began its exploration and production activities in Nigeria as
Gulf Oil Company (Nigeria) in December 1961, when it obtained its first oil prospecting
license from the Federal government. The receipt of another prospecting license in June
1962 consolidated the company's interest over a concession area measuring 5,000 square
kilometers offshore and about 2,500 square kilometers onshore in the Niger Delta.
To facilitate its operations in the concession area granted which now straddled both sides
of the Niger Delta, the company established a base at Escravos, near Warri, in Delta State
to coordinate its operations in the west and another in Port Harcourt, Rivers State, for the
eastern operations.
On December 8, 1963, the company made its first discovery, which was also Nigeria's
very first successful offshore well. Befittingly, the field was christened 'OKAN,' meaning
'one' in Itsekiri language spoken by the local people of the nearby onshore area. That
discovery marked the beginning of the enduring relationship between the multinational
company and Nigeria.
46
On April 1, 1965, the Company commenced export, shipping Nigeria's first consignment
of offshore crude to the world market. Over the next few years, the company's
exploration and production jobs grew with the successive spudding and commissioning
of the Delta South Oil Field (1969); and the Parable, Malu, Isan and Abiteye oil fields
(1972).
On April 1, 1973, the Federal Government, through the Nigerian National Petroleum
Corporation (NNPC), initiated a process of participating and establishing working
interests in the company's operations. Hence, through the then Nigerian National Oil
Corporation (NNOC), the Nigerian government, acquired a 35 per cent stake in the
company. By 1979, this stake increased to 60 per cent. In 1984, when Gulf Oil
Corporation and Chevron Corporation merged their global operations, Gulf in Nigeria
effectively became a subsidiary of Chevron. The name changed to Chevron Nigeria
Limited and this was effected in July 1991.
Landmark development in Chevron's participation in the Nigerian petroleum industry is
the West African Gas Pipeline (WAGP) project. Under this project, gas is to be pumped
from Nigeria's Escravos area in Delta State to the West African countries of Benin, Togo
and Ghana. A memorandum of understanding for the project was signed on 11 August,
1999 between the governments of Nigeria, Benin, Togo and Ghana and the consortium of
Chevron, Shell, Nigerian National Petroleum Corporation, Ghana National Petroleum
Corporation, Societe Beninoise de Gaz and Societe Togoleise de Gaz. The memorandum
confirms the consortium as the project developer and defines the legal framework for its
execution and sets the stage for its commercialization.
47
It also confirmed Chevron's status as project manager as earlier proposed in the joint
venture agreement. Chevron Nigeria Limited, which operates the Escravos fields, set the
target 2001 and 2002 as dates for completing the 992km, 18-22 inch diameter offshore
pipeline and the first deliveries of gas to Benin, Togo and Ghana. A study conducted for
Chevron by the Dames and Moore Group of consultants’ estimates that the project will
yield the following benefits:
a) Secure investment totaling 1.8 million U.S. dollars into Nigeria and the other
three West African countries;
b) Create 10,000-20,000 direct jobs in the sub-region as a result of WAGP gas being
available;
c) Reduce gas flaring by 78 million tonnes in Nigeria and thereby reduce green
house gas emissions in West Africa by as much as 100 million tons over a 20
years period; and
d) Save hundreds of thousands of acres of native forests and environmental success
that was expected to serve as "prototype to the inter-connection of the region,
identifying and removing roadblocks to economic integration" of the West
African sub-region.
Nigeria is the largest oil producer in Africa and the eleventh largest in the world, with
average of 2.5 million barrels per day (bpd) in 2004. In August 2004, Nigeria's finance
minister announced plans to produce 2.6 million (bpd) of oil in 2005.
48

On March 16, 2005 OPEC set Nigeria's production quota at 2,265,000 bpd compared to
2,224,000 bpd, from the quota set in September 2004.
In January 2005 Nigeria earned a total of US$2.6 billion, an equivalent of N345.8 billion
from the sale of crude oil alone, at an average of US$46.86 per barrel and with an
estimated daily sale of 1.79 million barrels The majority of Nigeria's crude exports are
destined for markets in the United States and Western Europe, with Asia and Latin
America becoming increasingly important as well.
In 1970, the end of the Biafra war coincided with the rise in the world oil price, and
Nigeria was able to reap instant riches from its oil production. Nigeria joined the
Organization of Petroleum Exporting Countries (OPEC) in 1971 and established the
Nigerian National Petroleum Company (NNPC) in 1977; a state owned and controlled
company which is a major player in both the upstream and downstream sectors.
Despite its major problems of civil unrest, political instability, border disputes, corruption
and poor governance, international oil companies have always seen Nigeria as an
attractive area for upstream investment in the sector.
Exploration so far has been taking place in five major sedimentary basins, namely, the
Niger Delta, the Anambra Basin, the Benue Trough, the Chad Basin and the Benin Basin.
The most productive basin so far is the Niger Delta which includes the continental shelf
and which makes up most of the proven and possible reserves. All oil production to date
has occurred in this basin.
49

In February 2005 Nigerian lawmakers announced that they would launch a three day
public hearing in the capital Abuja, to discuss how to amend the laws governing the oil
industry in order to create more local jobs and boost government revenues. The House of
Representatives Committee on Petroleum Resources reviewed the 1969 Petroleum Act.
In March 2005 the government appointed Britain's Hart Group to conduct a five year
audit of the activities in the oil and gas sector, in an effort to give effect to government's
commitment to the principles of the Extractive Industry Transparency Initiative (EITI).
The idea of NEITI is to have full disclosure in the oil and gas sector which is why NEITI
appoints advisers to select competent companies to carry out the audit of the sector.
Nigeria has opened up the deeper offshore areas for exploration by both foreign and local
investors in the oil industry. In 1990, the Government offered a number of new
concessions in water depths of up to 3,000m. BP/Statoil, Shell, Mobil, Elf, Agip and
Exxon were among the major oil companies that won the concessions. Estimates of
recoverable oil reserves in Nigerian deepwater areas approximate up to 20 billion barrels.
Exploration and appraisal in the deep offshore began in 1995 and several discoveries
have been made in this area despite high production costs associated with deep water
exploration.
2.4.1 PRODUCTION CAPACITIES OF OIL PRODUCING
COMPANIES IN NIGERIA
ExxonMobil is currently producing around 570,000 bpd in Nigeria and plans to invest
$11 billion in the country's oil sector between 2003 and 2011, increasing production
50
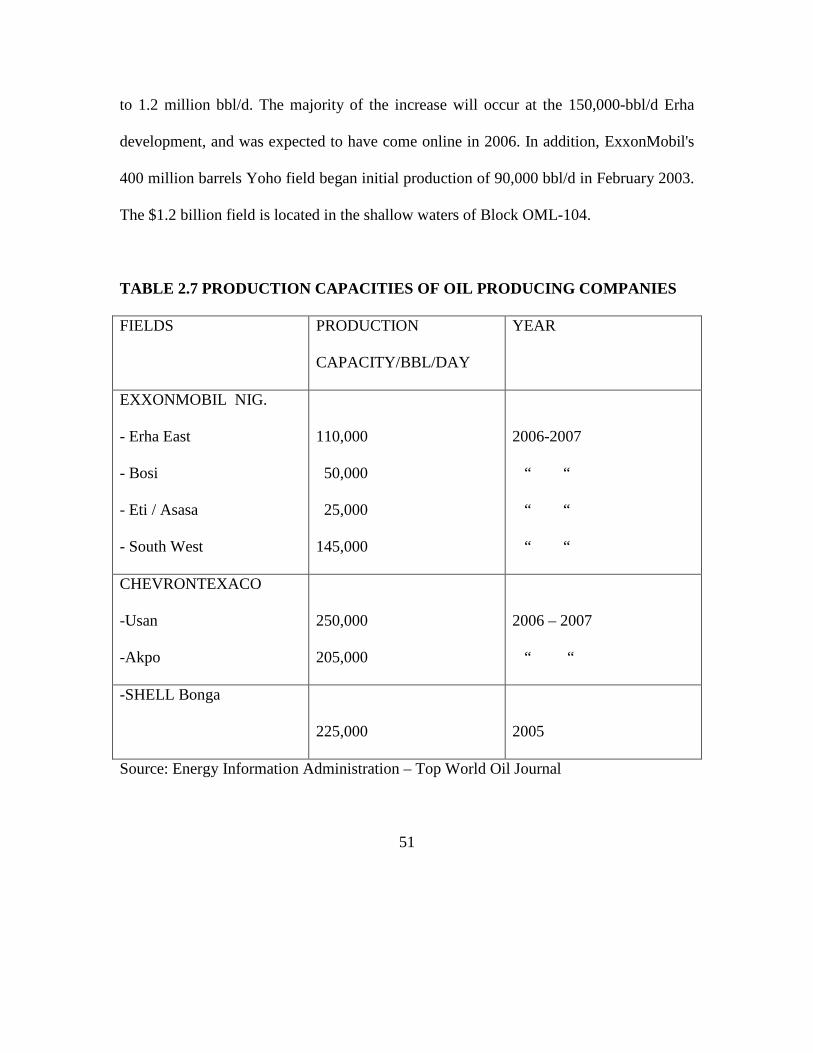
to 1.2 million bbl/d. The majority of the increase will occur at the 150,000-bbl/d Erha
development, and was expected to have come online in 2006. In addition, ExxonMobil's
400 million barrels Yoho field began initial production of 90,000 bbl/d in February 2003.
The $1.2 billion field is located in the shallow waters of Block OML-104.
TABLE 2.7 PRODUCTION CAPACITIES OF OIL PRODUCING COMPANIES
FIELDS PRODUCTION
CAPACITY/BBL/DAY
YEAR
EXXONMOBIL NIG.
- Erha East
- Bosi
- Eti / Asasa
- South West
110,000
50,000
25,000
145,000
2006-2007
“ “
“ “
“ “
CHEVRONTEXACO
-Usan
-Akpo
250,000
205,000
2006 – 2007
“ “
-SHELL Bonga
225,000
2005
Source: Energy Information Administration – Top World Oil Journal
51
Although Yoho's full-field output of 150,000 bpd was expected in late 2004, the
timetable for completion was pushed back to mid-2005.
ChevronTexaco, Total, Agip, and ConocoPhillips are also involved in the Nigerian oil
sector. Output at Total's Amenam field reached 120,000 bbl/d in January 2005. The
Amenam field contains reserves of 500 million barrels of oil.
In January 2005 Dow Jones reported that the Nigerian government revoked development
rights for 24 undeveloped oil blocks and will offer them again in the country's next major
oil licensing round. The blocks had been re-awarded to oil majors including Royal
Dutch/Shell Group (RD SC), ChevronTexaco Corp. (CVX), as well as small indigenous
oil companies. The previous owners of the blocks had held them for at least 10 years,
without any activity.
In October 2004 Total Nigerian operating subsidiary and Elf Petroleum Nigeria Ltd.
made a significant discovery in the area west of the Usan field in the deepwater Oil
Prospecting License (OPL) 222, offshore South-Eastern Nigeria. (Total Fina Elf) has a
20% interest in OPL-222. Oil was sampled at Usan 5 in several levels confirming the
presence of additional quantities of oil as well as further potential in previously untested
reservoirs.
In January 2005 the same Total Fina Elf encountered hydrocarbons in OPL 222, during
the well test of Usan 6. The oil flowed at a rate of 5,800 barrels of oil per day under
restricted flow conditions.
52

In September 2004 Shell Exploration and Production (EP) Africa announced that it aimed
to invest $9-billion in Nigeria's oil and gas over the next five years. The money will go to
the development of oil exploration and production in deep offshore leases, expand the
Nigerian liquefied natural gas project, and cover joint operations with the Nigerian
National Petroleum Corporation.
In January 2005, Syntroleum Corporation announced that it had finalized agreements
with Lundin Petroleum, Challenger Minerals, Providence Resources, Howard Energy
Co., Palace Exploration and Yinka Folawiyo Petroleum Co. Ltd to begin the appraisal of
the Aje discovery field offshore Nigeria located in Oil Mining Lease 113. The Nigerian
government approved the agreement in April 2005. The OML 113 license covers
approximately 454,000 acres located off western Nigeria near the border with Benin.
Yinka Folawiyo Petroleum Company (YFP) is the licensee and the operator of this OML
113. The company was granted a 20 year term license in June 1998. Aje is situated 24
kilometers offshore in water depths ranging from 99 to over 1,500 meter. Aje was
discovered with the drilling of the Aje- 1 well in 1996 which encountered a thin oil rim in
the gas-charged Turonian sandstone testing at a combined flow rate of 42 mmcfd and
2,262 billion oil per day from three zones. Due to mechanical problems with the well, the
Aje-1 well only reached the Turonian sandstone. The Aje-2 appraisal well drilled in 1997
penetrated the deeper Cenomanian sandstone at a depth of 2,400 meters. The
Cenomanian oil zone was tested by Aje -2 from a structurally low position at a rate of
3,866 bpd of 39 degree API oil from an 8 meter thick interval.
53

It is pertinent to mention that in February 2005, ESSO Exploration and Production
Nigeria and the Sao Tome "One" Limited, signed a Production Sharing Contract (PSC)
with the Nigeria - Sao Tome and Principe Joint Development Authority (JDA). The
consortium co-ventures with ChevronTexaco and Dangote Energy Equity Resources, to
explore for commercial hydrocarbons in Block 1 of the offshore Joint Development Zone
(JDZ) concession.
Also in March 2005, Spinnaker Exploration Company entered into a Farmout Agreement
covering a 12.5% interest in OPL Block 256 offshore Nigeria from Ocean Energy Nigeria
Limited. OPL Block 256 was acquired by Devon and Nigerian Petroleum Development
Company Limited (NPDC) in a mini-bid round in 2002. Block 256 is located
approximately 200 kilometers off of the coast of Nigeria in water depths ranging from
1,500 to 2,800 meters.
Similarly, in March 2005, Mart Resources signed a formal agreement with Network
Exploration to co-participate in the development of the Qua Ibo, Oil Field in Nigeria. The
Qua Ibo, Oil Field is located onshore in Nigeria's Niger Delta region and was awarded to
Network under the Nigerian Government's marginal field allocation program. Fields
allocated under this program contain significant proven reserves determined by previous
drilling, but remain undeveloped.
In April 2005, a subsidiary of Pioneer Natural Resources joined Oranto Petroleum and
Orandi Petroleum in an existing production sharing contract on Block 320 in Nigerian’s
deepwater area. The companies gained exploration rights from the Nigerian National
Petroleum Corporation.
54

The 442,000 acre (1,790 square km) block is located about 90 miles (150 km) southeast
of Lagos in water depths ranging between 6,900 to 8,900 feet (2,100 to 2,700 m).
Equator and Peak Petroleum Industries Nigeria Limited, in April 2005 signed an
agreement to undertake jointly the potential development of two oil and gas discoveries
and drill a significant exploration prospect in Oil Mining Lease (OML) 122, offshore
Nigeria. The estimated costs of the 2005 activities on OML 122 by Equator was US$25
million including seismic license fees, G&A costs and the drilling of two wells.
In May 2005, the Nigerian National Petroleum Corporation (NNPC) authorized Total, as
operator, to begin developing the offshore Akpo field on the Oil Mining License (OML)
130 of Nigeria. Total holds a 24% interest in the OML 130, alongside NNPC, Petrobras
and Sapetro.
2.5 NIGER DELTA REGION
The Niger delta is the source of over 90 per cent of crude oil which is the mainstay of the
Nigerian economy. Oil accounts for over 90 per cent of the country’s export earnings and
some 80 per cent of government revenue; but the history of development associated with
oil exploitation in Nigeria has been troubled from the outset.
55

Fig. 2.4: Map of Nigeria showing geographical areas. Ugborodo is located in Warri South West LGA in the Niger Delta region Source CNL Impact; Comm, News 1982 More than four decades of oil exploration and production activities have left a severely
degraded environment in Nigeria's Niger Delta oil region, through uncontrolled discharge
of oil or its by-products including chemicals and wastes,
56

The Niger Delta is located on the Atlantic Coast of Southern Nigeria. It is the second
largest delta in the world with a coastline spanning about 450 kilometers and it has been
described as the largest wetland in Africa and among the three largest in the world
(NDES, 1997). About 2,370 square kilometers of the Niger Delta area consist of rivers,
creeks and estuaries with stagnant swamp covering about 1900 sq. km. This is largest
Mangrove swamp in Africa; The region also falls within the tropical rain forest zone. The
ecosystem of the area is highly diverse and supportive of numerous species of terrestrial
aquatic flora and fauna in addition to human life.
Niger Delta area cuts across nine states in Southern Nigeria which includes Abia, Akwa-
Ibom, Bayelsa, Cross River, Delta, Edo, Imo, Ondo and Rivers States. The region has
emerged as one of the most ecologically sensitive regions in Nigeria.
57

Fig. 2.5: Map of Nigeria showing the position of Ogidigben / Ugborodo community within the Niger Delta in Delta State. Source CNL Impact – Comm. News 1982
58

2.6 PRESENT STUDY
The broad objective of the present study is born out of the desire to investigate
ecological, health and social-economic problems emanating from the impact of oil
pollution in the Niger Delta. The need to achieve a sustainable society through the nexus
of oil pollution management and sustainable development program already recognized by
the Federal Government of Nigeria and the oil companies operating in the area due to its
sensitivity.
While the specific objectives of the current study are:
a) To examine the nature and sources of pollution from the exploration and
production activity of the oil companies in general and Chevron Nigeria limited in
particular.
b) To investigate the toxicity of the crude oil on the test organisms.
c) To investigate the extent to which oil pollution affect the ecology of the
community and its impact on socio – economic development of Ugborodo
Community.
59

d) To assess how effective is Chevron Nigeria limited oil pollution management
strategies put in place for solving environmental oil pollution in order to achieve a
sustainable society.
e) To examine available plans for managing the interface between different
stakeholders to achieve peaceful coexistence in the oil producing communities.
f) To examine existing strategies for poverty alleviation, promotion of integrated
rural development, and local empowerment /employment generation.
g) To make suggestions on how multinational oil companies in Nigeria can make
significant contributions to the development of a more environmentally friendly
Niger Delta, particularly in the Ugborodo community.
60

CHAPTER THREE
RESEARCH METHODOLOGY
3.0 INTRODUCTION
Several research instruments were employed for the purpose of this study, The
questionnaire survey method, however was top of the list of methods used. This
Questionnaire Survey method involved selecting samples of respondents and
administering of structured questionnaires. Other methods used in the study included
personal interviews, opinion polls, laboratory experimental techniques to determine the
toxicity of crude oil on biological species; tilapia fish and earthworms.
3.1 QUESTIONNAIRES: This consisted of structured questions administered to
different respondents to solicit for specific information. The questionnaires were given
out to a cross-section of stakeholders within the oil business industry such as the oil
workers, government personnel, NGOs and the indigenes within the host communities
etc.
3.2 INTERVIEWS: This took the form of personal interactions; face to face encounters
and focus –group discussions (FGDs) with selected group, of people.
3.3 Population Size: Due to logistics constraints in the Niger Delta, the sample size
chosen for the study was limited to 50 respondents selected from the oil company-
Chevron, Government and regulatory agencies and the host community-Ugborodo.
61

Respondents were carefully chosen to cut across Government, the oil Company, and the
host community. It is to be noted that the host community respondents not cut across
media, NGOs, CBOs etc. The total number of questionnaires sent out was 50 and 45
respondents completed and returned the questionnaire. This represented 90% response
rate.
3.4 DATA COLLECTION METHOD
A simple random sampling method was used to administer the questionnaire to each unit
of the study population as shown below:
Table 3.1 Sample Size for the field Selection
RESPONDENT GROUP NUMBER SELECTED
Oil Company 10
Government 15
Host community 25
TOTAL 50
Source: Field Study
62

3.2.1 FIELD SIZE SELECTION
The field work faced challenges as most of the respondents were not receptive in terms of
information dissemination while a few others cooperated.
Consequently, only 45 respondents completed and returned their questionnaires as
indicated below. Similarly, not all the people interviewed responded positively.
TABLE 3.2 RESPONSE AND REFUSAL RATE
Respondent
Group
Number No. of response
expected
Actual
Response
Refusal Rate
Oil Company 10 10 8 2
Government 15 15 13 2
Host
Community
25 25 24 1
TOTAL 50 50 45 5
Source: Field Study
‘Table 3.2 shows that five respondents or 10% of the total number of respondents did not
complete or return the questionnaire’
63

3.3 EXPERIMENTS CONDUCTED
3.3.1 INVESTIGATION OF THE TOXICITY OF ESCRAVOS CRUDE OIL ON TILAPIA FISH Materials: Escravos crude oil sample; Fish fingerlings; Aquaria-Glass
containers {(15x18x23cm); Air-compressor (Blitz model den 135),
Hypodermic Needles and Syringes; Volumetric Standard Flask and Timer }
Method – The fish fingerlings bought from fishermen at the riverbank in
Escravos on arrival and were taken to the lab. The Tilapia fish fingerlings
were introduced into the test chambers as quickly as possible on arrival with
minimum handling. They were allowed a minimum of 5-days equilibration
time, adequate aeration being maintained to bring the pH and DO
concentration, etc to be in equilibrium with atmospheric conditions. They
were fed once a day with commercial fish feed and the tank was cleaned as
necessary. The room temperature was maintained at 27 0C throughout the test
period. There was as much as possible a 12hrs light / darkness cycle.
Ten fingerlings were introduced into each chamber containing four liters’ of
water, preventing overcrowding in the tanks
The Tilapia fingerlings were introduced into the test chambers within one
hour after the 10ul of crude oil was added into the water and followed by a
swirling with a glass rod to form a homogenous layer of oil floating on the
surface of the water.
64
This was considered to correspond quite well to conditions in waters of low
turbulence and without tides. A homogenous layer resembling the oil slick formed on
surface of the water in the event of an oil spill was formed. For the oil dispersants,
10% test solutions of the dispersant were prepared, from which calculated volumes
were introduced into the test chambers.
Aeration was again maintained during the test as this was the only way of ensuring
adequate oxygenation and also for the fact the test materials have the ability to
deplete the dissolved oxygen concentrations. A control experiment was set up in each
case without addition of the test chemical material.
The number of dead fish in each test chamber was counted every 24 hours after the
beginning of the experiment. The criteria for identification of death were lack of body
movement, opercula or fin movement and lack of reaction to gentle prodding. Being a
time dependent test, 24, 48 and 96 hourly observations were recorded, while the
LC50 and LD50 of the crude oil to the test organisms are then determined.
65
3.3.2 INVESTIGATION OF THE EFFECT OF TOXICITY OF ESCRAVOS CRUDE OIL ON EARTHWORM (LUMBRICUS TERRESTRIES)
• Materials: Escravos crude oil sample; Earthworm; Aquaria Glass containers
(15x18x23cm); Air-compressor Blitz model den 135; Hypodermic Needles
and Syringes; Volumetric Standard Flask & Timer }
• Method: The Earthworms were collected from river banks by digging the soil
underneath where they are usually found and were kept in a container
containing sand or water. The samples (earthworms) were later brought to the
laboratory and allowed to remain in a larger container containing water for a
period of 2-3 days to acclimatize to the laboratory environment. During
acclimatization, the container which the earthworms were kept was constantly
washed and refilled every day with fresh water. No feeding and no aeration
were done during these periods. After the acclimatization periods, which
lasted for at least 3days, the experiments were then conducted in a four liter
water tank where the earthworms were exposed to each concentration ranges
from 5ul, 10ul, 15ul etc of crude oil diluted serially for a periods of four days,
(24, 48, 72 & 96 hrs),
66
The lethal concentration LC50 (concentration at which 50% of the test
organisms died) and the LT50 (Time at which 50% of the test organisms have
died) was then calculated. These values were plotted on a graph with log dose
on the x-axis and probit to form the toxicity curve. (See fig 4.12)
Temperature and pH parameters were measured daily, and the water
characteristics were determined, as the pH of the tank was kept at between 7.1
and 7.2
The test experiment was then monitored for a period of 96 hours and the tank
water were renewed every 24 hours with fresh solutions / dilutions.
67
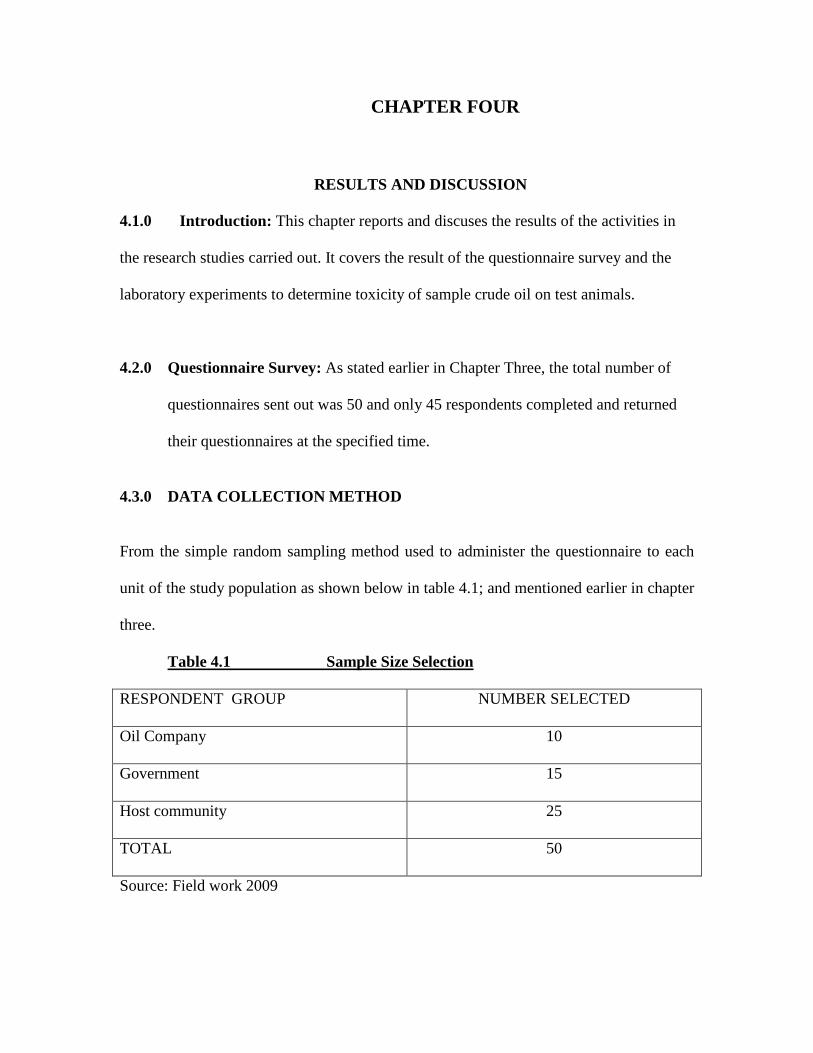
CHAPTER FOUR
RESULTS AND DISCUSSION
4.1.0 Introduction: This chapter reports and discuses the results of the activities in
the research studies carried out. It covers the result of the questionnaire survey and the
laboratory experiments to determine toxicity of sample crude oil on test animals.
4.2.0 Questionnaire Survey: As stated earlier in Chapter Three, the total number of questionnaires sent out was 50 and only 45 respondents completed and returned their questionnaires at the specified time.
4.3.0 DATA COLLECTION METHOD
From the simple random sampling method used to administer the questionnaire to each
unit of the study population as shown below in table 4.1; and mentioned earlier in chapter
three.
Table 4.1 Sample Size Selection
RESPONDENT GROUP NUMBER SELECTED
Oil Company 10
Government 15
Host community 25
TOTAL 50
Source: Field work 2009

68
Ten (10) numbers of respondents selected from the questionnaires to the company staff in
various divisions of Chevron Nigeria Limited. At the same time fifteen (15) number of
the questionnaires were distributed to various groups of Government agencies (i.e. the
NNPC, DPR, Local Government Council and so on. While the remaining twenty-five
(25) number of questionnaires were distributed to the host community (i.e. the immediate
Ugborodo community and its surroundings neighbors).
TABLE 4.2 RESPONSES AND REFUSAL RATE
Respondent
Group
Number No. of response
expected
Actual
Response
Refusal Rate
Oil Company 10 10 8 2
Government 15 15 13 2
Host
Community
25 25 24 1
TOTAL 50 50 45 5
Source: Field work 2009
Table 4.2 shows that five respondents or 10% of the total number of respondents did not
complete or return the questionnaire’ that is, out of the 10 number questionnaires given to
the oil company 8 numbers was completed and returned while 2 numbers of the
questionnaires could not be retrieved due to staff vacation and lack of willingness to
69

completed and return questionnaire on time. Similarly, same number (2) questionnaires
were left on completed and not returned while on one number questionnaire were not
completed and returned from the host community respondents.
Table 4.2a RESPONSES TO THE ADMINISTERED QUESTIONNAIRES.
Respondents No. of
Questionnaire sent
out
Number Returned Percentage
Oil Company 10 8 16
Government 15 13 26
Host Community 25 24 48
TOTAL 50 45 90
Source: Field work 2009
The responses to the administered questionnaires as shown above in table 4.3. Forty five
questionnaires were completed and returned out of the 50 questionnaires administered.
Five of the questionnaire were not returned and could not be recovered. The forty five
completed questionnaires returned represent 90% as shown in the above table 4.3. The
success rate for the company respondents were 16%, Government respondents were 26%
and 48% from the host community.
70
The frequency representations of the personal analyzed data of respondents are shown
below in table 4.4; the respondents are carefully chosen from different strata of the
society amongst the stakeholders. The population sizes of the research consist of the
sample element within the operating Oil Company, the Government sector and the Host
communities. A simple random method is done to select a unit of the population to
obtained assigned set of random number of the element to generate eight (8) married men
from the oil company with age bracket of between 10-35yrs whose educational
qualifications fall within the Senior Secondary Certificate and first Degree from the
Polytechnic / University. Similarly this same method was use to select Ten (10) male and
three (3) female respondents from the Government sector, age bracket 10-35yrs, out of
this population, 12 were already married and one single, their educational qualifications
are within the Polytechnic / University and other professional Certificates.
While a total of Twenty – Four (24) respondents were randomly selected for the purpose
of this research from the host community. Out of these number, twenty-one married, and
three singles, whose educational falls within the Senior School Certificates, Tertiary and
others.
Therefore, the total overall frequency representation shows personal analyzed data
as:Total respondents 45 (38Male +7 Female) spread across the ages bracket of 10-35yrs;
selected from both Senior Secondary and Tertiary level of educational qualifications. 41
out of the 45 are married while 4 are singles.
71

Table 4.2b FREQUENCY REPRESENTATION OF THE PERSONAL
ANALYZED DATA OF RESPONDENTS.
RESPONDENTS/ CADRES SEX AGE
EDUCATIONAL QUALIFICATIONS MARITAL/STATUS
M F 10-20
21-35 35+ SEC.CERT TERT.INST. OTHERS MARRIED SINGLE
Oil Company 8 - - - 8 - 8 - 8 - Government 10 3 - 3 10 - 10 3 12 1 Host Community 20 4 3 19 2 2 18 4 21 3 TOTAL 38 7 3 22 20 2 36 7 41 4 Source: Field study 2009
To further verify the validity of the above data obtained from the field study from the
tables 4.1; 4.2 and 4.3, the use of Chi-Square analysis were then applied.
With the use of Chi-Square Analysis, the following five hypotheses were the tested:
1. Good pollution management enhances clean environment and healthy living.
2. Good pollution management enhances clean environment and does not destroy
vegetation, farmland, fishing ground, cash crops, economic trees and human
settlements.
72
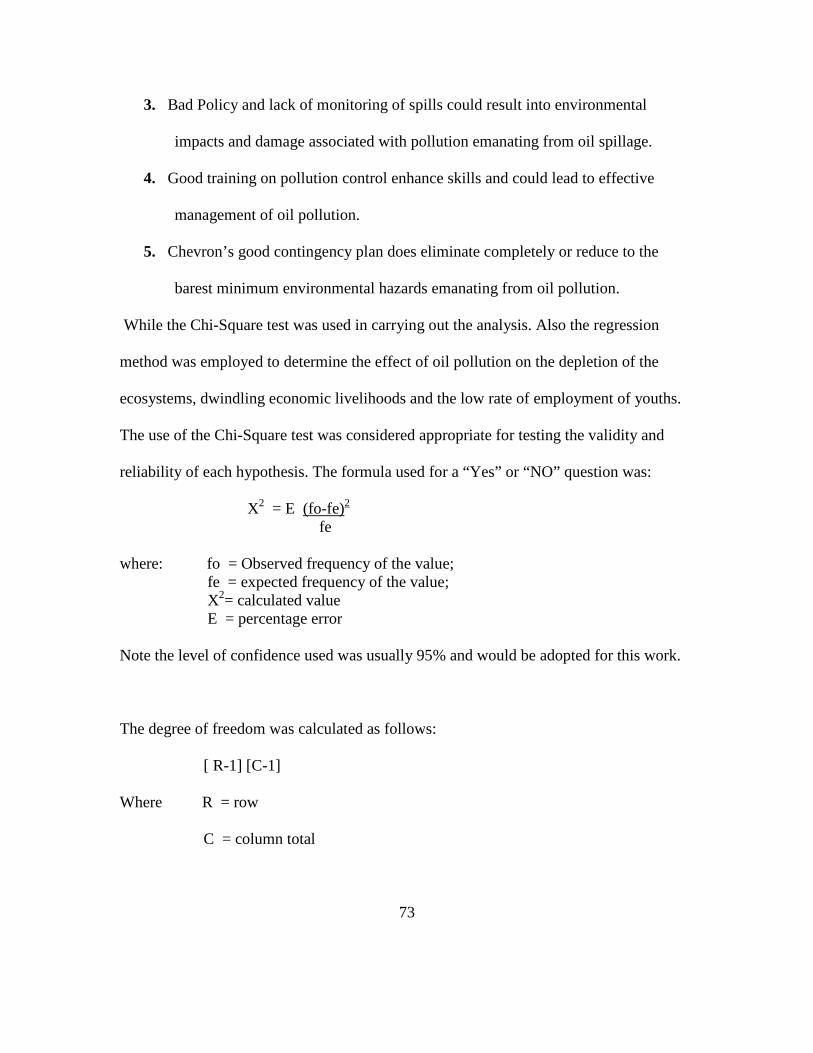
3. Bad Policy and lack of monitoring of spills could result into environmental
impacts and damage associated with pollution emanating from oil spillage.
4. Good training on pollution control enhance skills and could lead to effective
management of oil pollution.
5. Chevron’s good contingency plan does eliminate completely or reduce to the
barest minimum environmental hazards emanating from oil pollution.
While the Chi-Square test was used in carrying out the analysis. Also the regression
method was employed to determine the effect of oil pollution on the depletion of the
ecosystems, dwindling economic livelihoods and the low rate of employment of youths.
The use of the Chi-Square test was considered appropriate for testing the validity and
reliability of each hypothesis. The formula used for a “Yes” or “NO” question was:
X2 = E (fo-fe)2 fe where: fo = Observed frequency of the value; fe = expected frequency of the value; X2= calculated value E = percentage error Note the level of confidence used was usually 95% and would be adopted for this work.
The degree of freedom was calculated as follows:
[ R-1] [C-1]
Where R = row
C = column total
73

The five null hypotheses were tested one after the other to
ascertain their validity or otherwise. Another point to note, is that
Hn = nth hypothesis
Xn2 = value of X2 for nth hypothesis
Expected Value = Row total x column Total Grand Total
HYPOTHESIS 1. Good pollution management enhances clean environment
and healthy living.
From the table 4.3 a total of Eight (8) respondents responded ‘YES’ while only two says;
NO’ an indication that 96% support good pollution management while only 4%
disagreed.
Response to this question was then analyzed as follows to obtain X2
Table 4.3a: OBSERVED VALUES COMPILED FROM THE “YES” & “NO”
RESPONDENTS
RESPONDENTS YES NO TOTAL Oil Company 8 0 8 Government 13 0 13
Host Community 22 2 24 TOTAL 43 2 45
Source: Field study 2009.
74
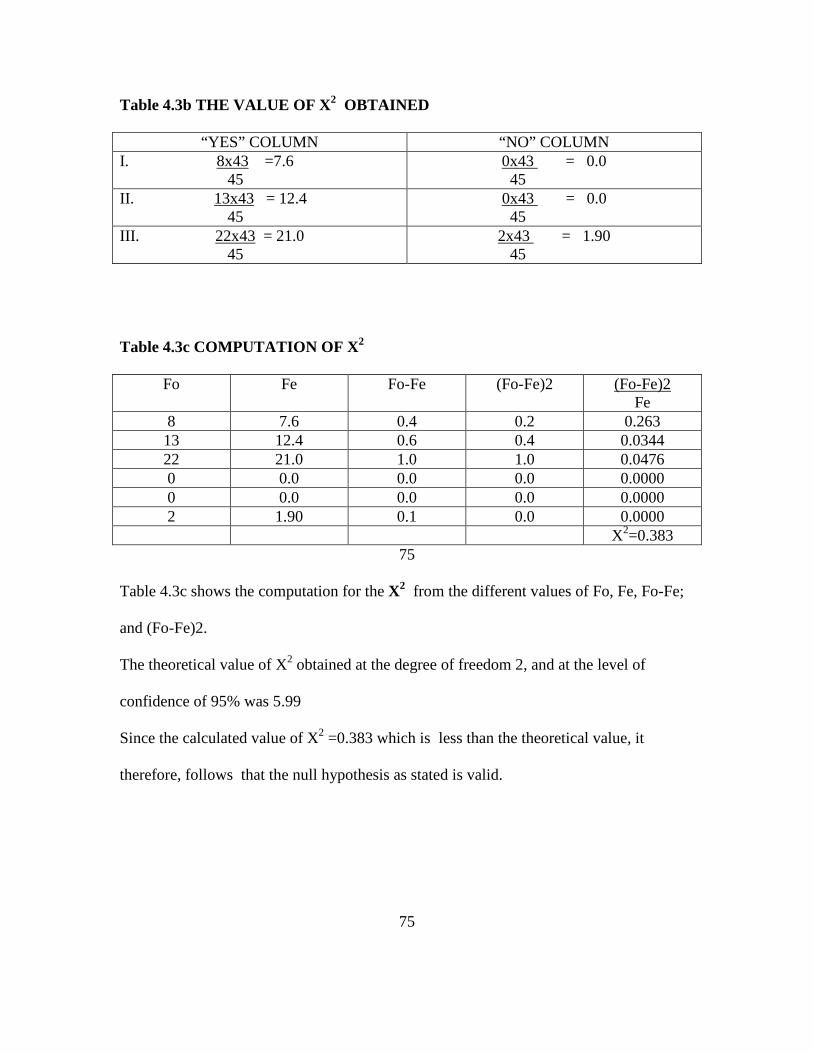
Table 4.3b THE VALUE OF X2 OBTAINED
“YES” COLUMN “NO” COLUMN I. 8x43 =7.6 45
0x43 = 0.0 45
II. 13x43 = 12.4 45
0x43 = 0.0 45
III. 22x43 = 21.0 45
2x43 = 1.90 45
Table 4.3c COMPUTATION OF X2
Fo Fe Fo-Fe (Fo-Fe)2 (Fo-Fe)2 Fe
8 7.6 0.4 0.2 0.263 13 12.4 0.6 0.4 0.0344 22 21.0 1.0 1.0 0.0476 0 0.0 0.0 0.0 0.0000 0 0.0 0.0 0.0 0.0000 2 1.90 0.1 0.0 0.0000 X2=0.383
75
Table 4.3c shows the computation for the X2 from the different values of Fo, Fe, Fo-Fe;
and (Fo-Fe)2.
The theoretical value of X2 obtained at the degree of freedom 2, and at the level of
confidence of 95% was 5.99
Since the calculated value of X2 =0.383 which is less than the theoretical value, it
therefore, follows that the null hypothesis as stated is valid.
75
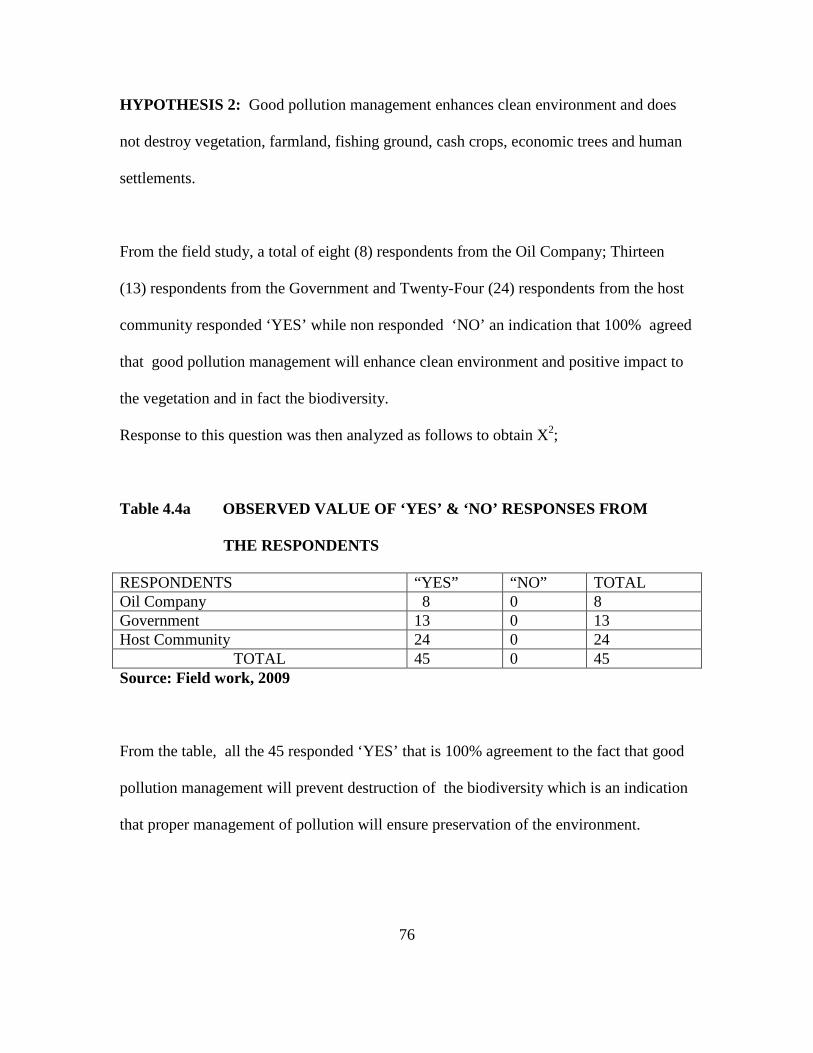
HYPOTHESIS 2: Good pollution management enhances clean environment and does
not destroy vegetation, farmland, fishing ground, cash crops, economic trees and human
settlements.
From the field study, a total of eight (8) respondents from the Oil Company; Thirteen
(13) respondents from the Government and Twenty-Four (24) respondents from the host
community responded ‘YES’ while non responded ‘NO’ an indication that 100% agreed
that good pollution management will enhance clean environment and positive impact to
the vegetation and in fact the biodiversity.
Response to this question was then analyzed as follows to obtain X2;
Table 4.4a OBSERVED VALUE OF ‘YES’ & ‘NO’ RESPONSES FROM
THE RESPONDENTS
RESPONDENTS “YES” “NO” TOTAL Oil Company 8 0 8 Government 13 0 13 Host Community 24 0 24
TOTAL 45 0 45 Source: Field work, 2009
From the table, all the 45 responded ‘YES’ that is 100% agreement to the fact that good
pollution management will prevent destruction of the biodiversity which is an indication
that proper management of pollution will ensure preservation of the environment.
76

Table 4.4b THE VALUE OF X2 OBTAINED
“YES” COLUMN “NO” COLUMN 1 8x45 = 8
45 0x0 = 0
45 2. 13x45 =13
45 0x0 = 0
45 3. 24x45 =24
45 8x45 = 8
45
Table 4.4c COMPUTATION OF X2
Fo Fe Fo-Fe (Fo-Fe)2 (Fo-Fe)2 Fe
8 8 0 0 0 13 13 0 0 0 24 24 0 0 0 0 0 0 0 0 0 0 0 0 0 0 0 0 0 0 X2=0
Source: Field work, 2009
The results from the computation of X2 shows ‘0’ Therefore the second null hypothesis
as stated is valid since the computation of X2, is ‘0’ and less than the theoretical value
of 5.99. The null hypothesis stated earlier is valid.
77

HYPOTHESIS 3: Bad Policy and lack of monitoring of spills could result into
environmental impacts and damage associated with pollution emanating from oil spillage.
From the table 4.5a only 7 responded ‘YES’ (16% of the population) while a total of 38
say ‘NO’ (84% of the population). This shows that 84% of the population does not
believe that bad policy and lack of monitoring of spills would impact negatively on the
environment in the face of modern technology and standard already attained in the
industry. The reflection of this will be notice from the computation value of X2
Table 4.5a OBSERVED VALUE OF ‘YES’ & ‘NO’ RESPONSES FROM
THE RESPONDENTS
RESPONDENTS “YES” “NO” TOTAL Oil Company 2 6 8 Government 3 10 13 Host Community 2 22 24
TOTAL 7 38 45 Source: Field work, 2009
From the table all the 7 responded ‘YES’ that is 16% agreement and 38 responded ‘NO’
that is 84% disagreement) despite the bad policy, with good company management and
standard the impact may still be minimal relatively.
78

Table 4.5b THE VALUE OF X2 IS OBTAINED
“YES” COLUMN “NO” COLUMN 1. 8x 7 = 1.2445
45 8x38 = 6.7556
45 2. 13x 7 =2.0223
45 13x38 = 10.9778
45 3. 24x 7 =3.7334
45 24x38 = 20.2667
45
Table 4.5c Computation of X2
Fo Fe Fo-Fe (Fo-Fe)2 (Fo-Fe)2 Fe
2 1.2445 0.7556 0.4889 0.3029 3 2.0223 0.9777 0.9559 2.1157 2 3.7334 1.7334 -3.0047 -0.8049 8 6.7556 1.2444 1.5486 0.2293 13 10.9778 2.0222 4.0893 0.3725 24 20.2667 3.7333 1.3938 1.4542
X2 = 4.5646
The theoretical value of X2 at the degree of freedom 2, at the level of confidence of 95%
is 5.99. and since the calculated value of X2, i.e. 4.5646 still less than the theoretical
value, it therefore means that the null hypothesis as stated earlier is valid.
79

HYPOTHESIS 4; Good training on pollution control enhance skills and could lead to
effective management of oil pollution.
From the table 4.6a below, 36 responded ‘YES’ (80% of the population) while 9 (20% of
the population) said ‘NO’. That is majority of the respondents agreed that good training
of personnel will lead to acquisition of necessary skill to effectively manage oil
production operation to reduce pollution incident.
Table 4.6a -- OBSERVED VALUE OF ‘YES’ or ‘NO’ RESPONSES FROM
THE RESPONDENTS
RESPONDENTS “YES” “NO” TOTAL Oil Company 7 1 8 Government 8 5 13 Host Community 21 3 24
TOTAL 36 9 45 Source: Field work, 2009
With 36 responding ‘YES’ (i.e. 80% of the population) and 9 responding ‘NO’ (i.e.
20% of the population) the validity of the hypothesis is therefore not in doubt as will be
seen from the X2
Table 4.6b THE VALUE OF X2 IS OBTAINED
“YES” COLUMN “NO” COLUMN 1. 8x 36 = 6.4
45 8x9 = 1.6
45 2. 13x 36 =10.4
45 13x9 = 2.6
45 3. 24x 36 =19.2
45 24x9 = 4.8
45
80

Table 4.6c COMPUTATION OF X2
Fo Fe Fo-Fe (Fo-Fe)2 (Fo-Fe)2 Fe
7 6.4 0.6 0.36 0.0563 8 10.4 -2.4 5.76 0.5538
21 19.2 1.8 3.24 0.1687 1 1.6 -0.6 0.36 0.2250 5 2.6 2.4 5.76 0.2250 3 4.8 -1.8 3.24 0.6750 X2=3.8942
The theoretical value of X2 at the degree of freedom is 2, at level of confidence of 95%
is 5.99 Since the calculated value of X2 is 3.8942 and is below the theoretical value, it
follows therefore that the null hypothesis is valid.
Hypothesis 5: Chevron’s good contingency plan does eliminate completely or reduce to
the barest minimum, environmental hazards emanating from oil pollution.
From the table 4.7a below, 9 responded ‘YES’ (i.e. 20% of the population) and 36
responded ‘NO’ (i.e. 80% of the population) says ‘NO’. A reversal of the case in
hypothesis 4 field study results, which shows that more of the population of the
respondents disagreed with the question asked regardless of good contingency, the skilled
personnel still play a major roles in pollution management and control.
81
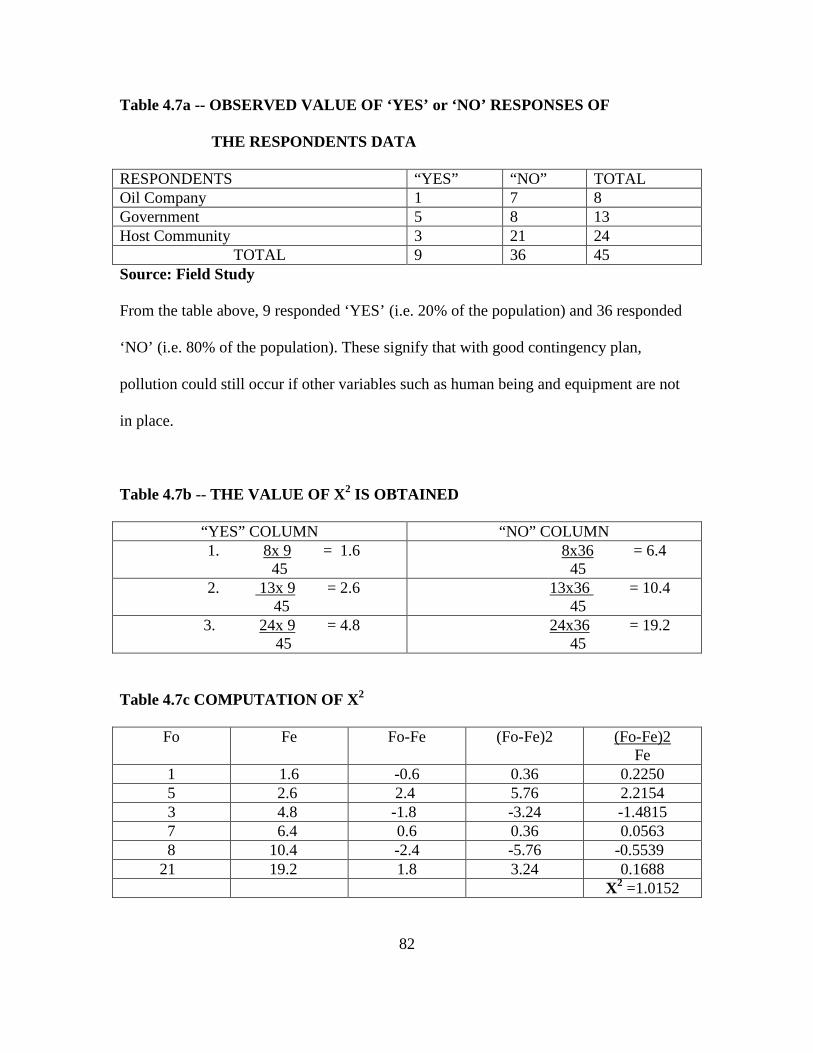
Table 4.7a -- OBSERVED VALUE OF ‘YES’ or ‘NO’ RESPONSES OF
THE RESPONDENTS DATA
RESPONDENTS “YES” “NO” TOTAL Oil Company 1 7 8 Government 5 8 13 Host Community 3 21 24
TOTAL 9 36 45 Source: Field Study
From the table above, 9 responded ‘YES’ (i.e. 20% of the population) and 36 responded
‘NO’ (i.e. 80% of the population). These signify that with good contingency plan,
pollution could still occur if other variables such as human being and equipment are not
in place.
Table 4.7b -- THE VALUE OF X2 IS OBTAINED
“YES” COLUMN “NO” COLUMN 1. 8x 9 = 1.6
45 8x36 = 6.4
45 2. 13x 9 = 2.6
45 13x36 = 10.4
45 3. 24x 9 = 4.8
45 24x36 = 19.2
45
Table 4.7c COMPUTATION OF X2
Fo Fe Fo-Fe (Fo-Fe)2 (Fo-Fe)2 Fe
1 1.6 -0.6 0.36 0.2250 5 2.6 2.4 5.76 2.2154
3 4.8 -1.8 -3.24 -1.4815 7 6.4 0.6 0.36 0.0563 8 10.4 -2.4 -5.76 -0.5539
21 19.2 1.8 3.24 0.1688 X2 =1.0152
82

The theoretical value of X2 at the degree of freedom is 2, at the level of confidence of
95% is 5.99 Since the calculated value of X2 is 1.0152 and is less than the theoretical
value, it therefore means, that the null hypothesis as stated earlier is valid. The validity
of the five hypotheses above further confirmed the logical empirical analysis of the
results obtained from the survey
4.2 STAKEHOLDERS’ OPINIONS FROM POLLING OPINION SURVEY DATA
Polling Data or Opinion survey – The study undertook an opinion survey of stakeholder
within the community. It was to examine their involvement in the management of the
resources, the extent of collaboration of all stakeholders in the management towards
sustainability in the Niger Delta region. This collaboration, between the stakeholders on
the management of the resources in the Niger Delta region, is expected to improve the
harnessing of resources and ideas, mutual testing of concepts and much quicker
advancement and development of appropriate techniques for solving problems in the
region.
The exercise was conducted amongst a cross section of the community in January 2008.
46% of respondents favoured allowing oil and gas drilling in Niger Delta especially in
Ugborodo to continue. But in another survey conducted in January 2009, those that
favoured allowing the continued operations of the oil and gas exploration activities in the
region had declined to 21% (Table 4.8)
83
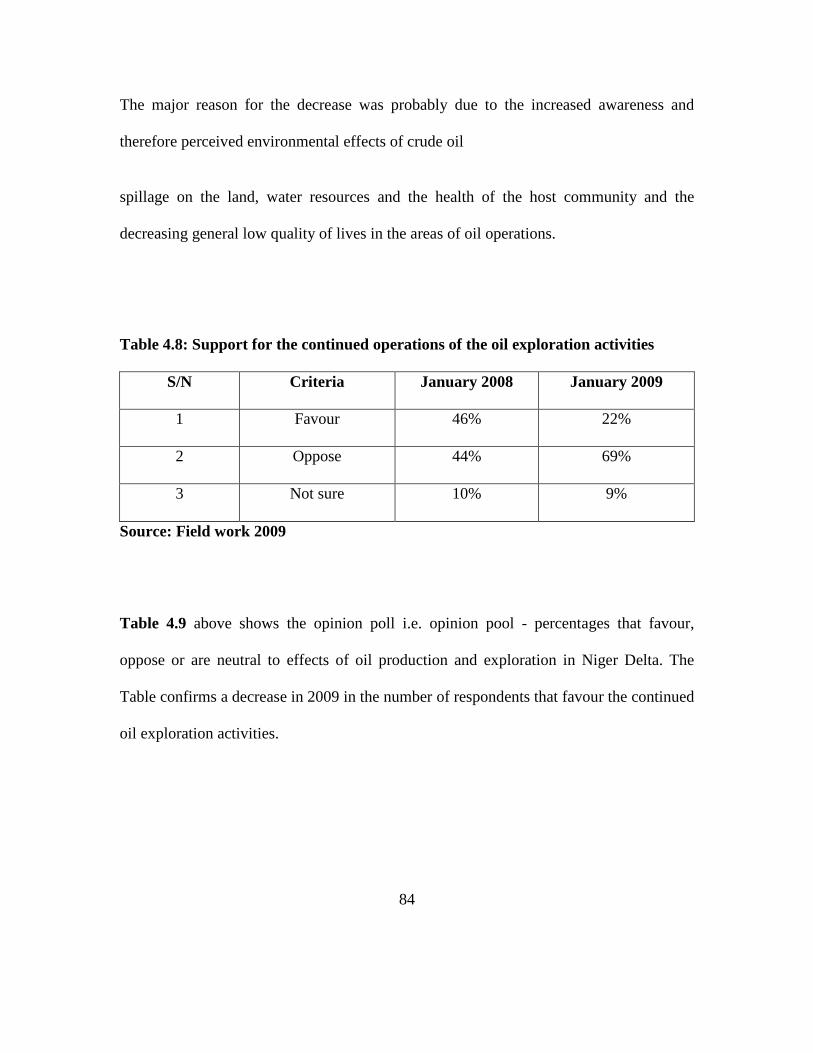
The major reason for the decrease was probably due to the increased awareness and
therefore perceived environmental effects of crude oil
spillage on the land, water resources and the health of the host community and the
decreasing general low quality of lives in the areas of oil operations.
Table 4.8: Support for the continued operations of the oil exploration activities
S/N Criteria January 2008 January 2009
1 Favour 46% 22%
2 Oppose 44% 69%
3 Not sure 10% 9%
Source: Field work 2009
Table 4.9 above shows the opinion poll i.e. opinion pool - percentages that favour,
oppose or are neutral to effects of oil production and exploration in Niger Delta. The
Table confirms a decrease in 2009 in the number of respondents that favour the continued
oil exploration activities.
84
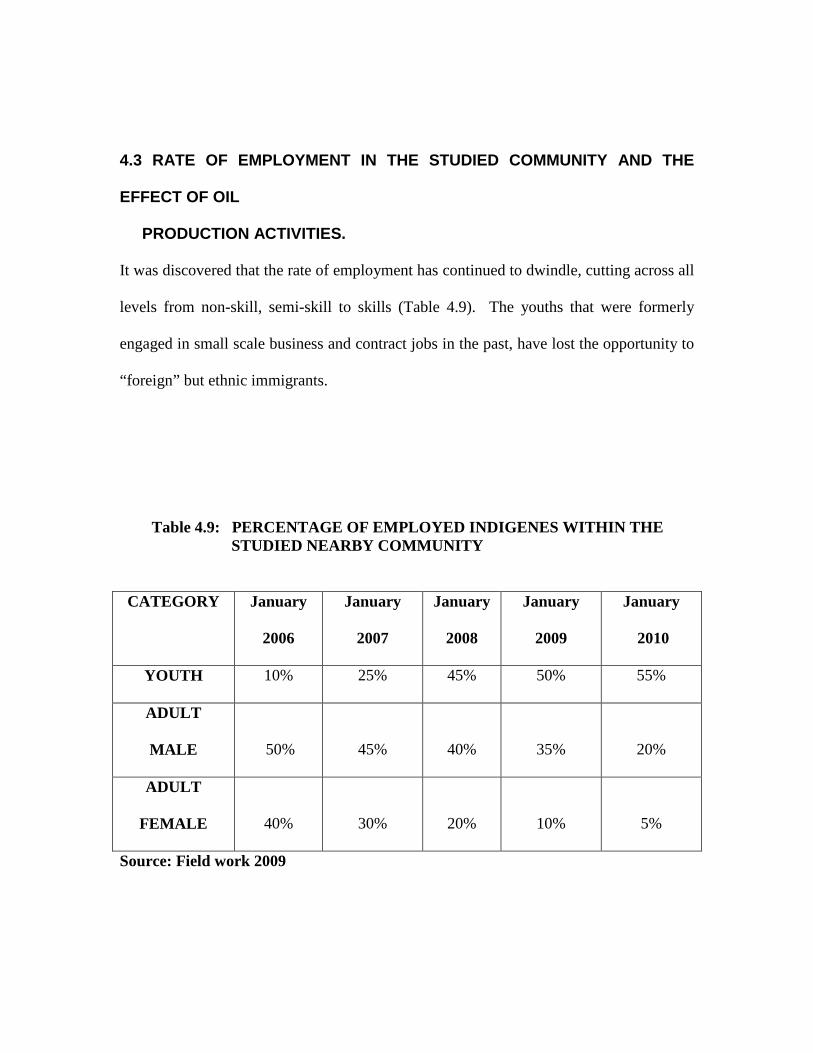
4.3 RATE OF EMPLOYMENT IN THE STUDIED COMMUNITY AND THE
EFFECT OF OIL
PRODUCTION ACTIVITIES.
It was discovered that the rate of employment has continued to dwindle, cutting across all
levels from non-skill, semi-skill to skills (Table 4.9). The youths that were formerly
engaged in small scale business and contract jobs in the past, have lost the opportunity to
“foreign” but ethnic immigrants.
Table 4.9: PERCENTAGE OF EMPLOYED INDIGENES WITHIN THE STUDIED NEARBY COMMUNITY CATEGORY January
2006
January
2007
January
2008
January
2009
January
2010
YOUTH 10% 25% 45% 50% 55%
ADULT
MALE
50%
45%
40%
35%
20%
ADULT
FEMALE
40%
30%
20%
10%
5%
Source: Field work 2009

85

Table 4.10: AVERAGE MONTHLY INCOME IN THE STUDIED COMMUNITY
Occupation Average Income
(N)
% from Fishing/
Farming
Jan. 2008
% from Fishing/
Farming April. 2008
% from
Fishing/
Farming Aug.
2009
% from
Fishing/
Farming
Aug. 2010 Fishing 450 100 50 25 0
Farming 450 100 80 50 10
Trading 100 80 60 40 20
Craft Clerical 800 500 250 15 0 50
Boat Driving and
Factory work
600 400 200 280 200
Contract/Business 1000 800 500 250 200
Sources: Field work 2009
86

It was discovered that the average income of the citizens continued to decline from year
to year due to the impact of oil exploration and production activities. This trend cut
across all occupations as shown in Table 4.10. above.
87

4.6 TOXICITY OF ESCRAVOS CRUDE OIL ON TILAPIA.
A laboratory investigation of the toxicity of crude oil on Tilapia species as test organism
was conducted in order to confirm or disprove the effect of oil spills on biological
systems. The results of the crude oil toxicity tests at various concentrations, doses,
temperatures and durations and the doses and concentrations (LC50 and LD50) of
experimental values are shown in Tables 4.11 a to c.
The table shows the crude oil toxicity at various concentrations, doses, temperatures and
durations for experiments at particular lethal doses and concentrations (LC50 and LD50)
of experimental values shows the rate of dead Fingerlings of Tilapia (i.e No of dead
Tilapia in relation to concentrations of crude oil).
At 5 ul/L concentration, the number of dead Tilapia recorded was 1/10; while at
Table 4.11 (a): Acute toxicity tests of Escravos crude on Tilapia (24hours)
Concentration No of Dead Tilapia % Response Probit
5 ul/L 1/10 10 3.72
10ul/L 2/10 20 4.16
15 ul/L 3/10 30 4.48
20ul/L 5/10 50 5.00
25ul/L 6/10 60 5.25
Note: LC 50 = 21.5ul/L Slope function S. 2.89 Confidence limits = 14.23-32
Source: Laboratory experiment, 2008
88
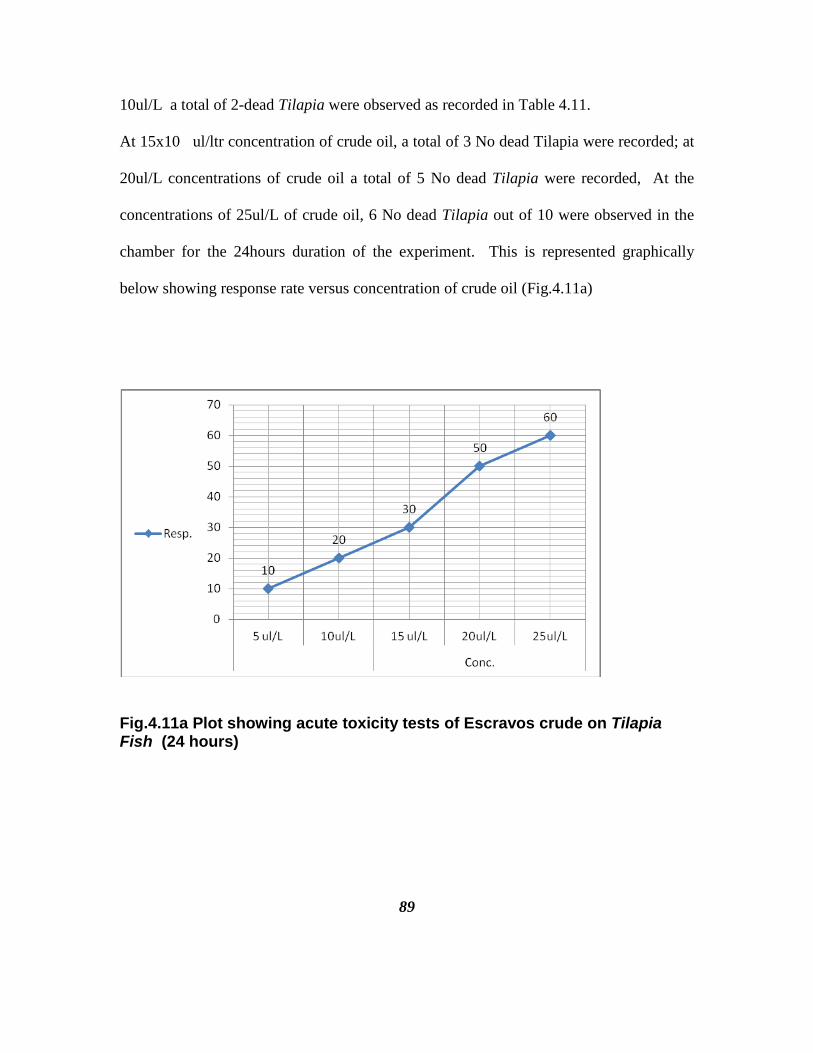
10ul/L a total of 2-dead Tilapia were observed as recorded in Table 4.11.
At 15x10 ul/ltr concentration of crude oil, a total of 3 No dead Tilapia were recorded; at
20ul/L concentrations of crude oil a total of 5 No dead Tilapia were recorded, At the
concentrations of 25ul/L of crude oil, 6 No dead Tilapia out of 10 were observed in the
chamber for the 24hours duration of the experiment. This is represented graphically
below showing response rate versus concentration of crude oil (Fig.4.11a)
Fig.4.11a Plot showing acute toxicity tests of Escravos crude on Tilapia Fish (24 hours)
89

Table 4.11 (b): Acute toxicity tests of Escravos crude on tilapia (48 hours)
Concentration No of Dead Tilapia % Response Probit
5 ul/L 3/10 30 4.48
10ul/L 4/10 40 4.74
15ul/L 5/10 50 5.00
20ul/L 5/10 50 5.00
25ul/L 7/10 70 5.52
(a) LC 50 = 16.5x10 ul/ltr Slope function S. 7.8 Confidence limits = 7.5 – 36.76
Fig.4.11 (b): Plot showing Acute Toxicity Tests of Escravos Crude on
Tilapia
SCALE: 5 divisions represent 5 x 10 ul/ltr on the X-axis 1 division represents 10 % response on the Y-axis.
90

Acute toxicity test (48hrs) on Tilapia fish is shown in Table 4.11b and
graphically represented in Fig.4.11b.
The 96hour toxicity test results are shown in table 4.11c and graphically in
fig 4.11c
Table 4.11 (c): Acute toxicity tests of Escravos crude on tilapia (96hours)
Concentration No of Dead Tilapia % Response Probit
5 ul/L 3/10 30 4.48
10ul/L 5/10 50 5.00
15ul/ltr 7/10 70 5.52
20ul/L 9/10 90 6.28
25ul/L 10/10 100 6.96
Note: LC 50 = 8.6x10 ul/ltr Slope function (S) = 4.13 Confidence limits = 5.05 – 14.9
91
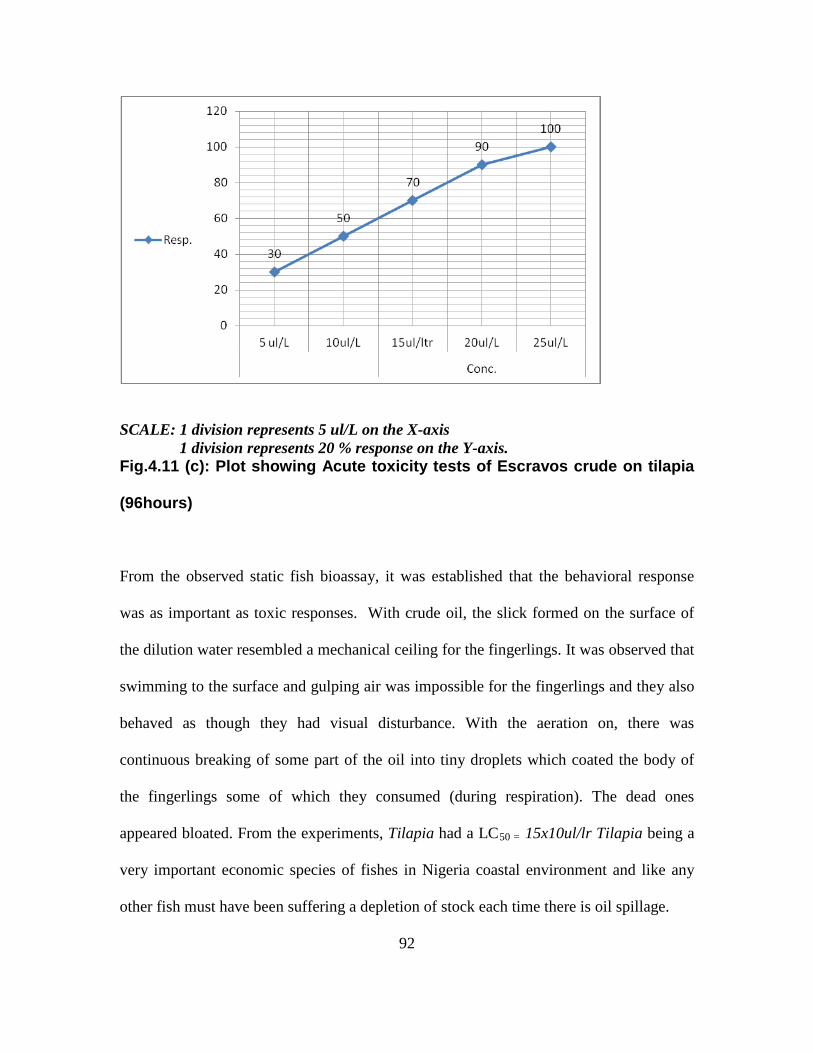
SCALE: 1 division represents 5 ul/L on the X-axis 1 division represents 20 % response on the Y-axis. Fig.4.11 (c): Plot showing Acute toxicity tests of Escravos crude on tilapia
(96hours)
From the observed static fish bioassay, it was established that the behavioral response
was as important as toxic responses. With crude oil, the slick formed on the surface of
the dilution water resembled a mechanical ceiling for the fingerlings. It was observed that
swimming to the surface and gulping air was impossible for the fingerlings and they also
behaved as though they had visual disturbance. With the aeration on, there was
continuous breaking of some part of the oil into tiny droplets which coated the body of
the fingerlings some of which they consumed (during respiration). The dead ones
appeared bloated. From the experiments, Tilapia had a LC50 = 15x10ul/lr Tilapia being a
very important economic species of fishes in Nigeria coastal environment and like any
other fish must have been suffering a depletion of stock each time there is oil spillage.
92

crude oil for 24hrs is 21.5 x 10 ul/liter and this is even conservative considering the spill
of several thousands of metric tonnes of crude in high seas.
4.7 TOXICITY OF ESCRAVOS CRUDE OIL ON EARTHWORMS.
A laboratory investigation of the toxicity of crude oil on Earthworm Lumbricus Terrestris
as test organism was similarly conducted as was done in the case of Tilapia fish.. The
results of the crude oil toxicity tests at various concentrations, doses, temperatures and
durations and the doses and concentrations (LC50 and LD50) of the experiment with
Earthworm showed that they suffered greatly as more death was recorded due to the toxic
nature of the crude than in the case of Tilapia, as observed from Table 4.12a. below.
Table 4.12a - Result of experiments of acute toxicity tests on Lumbricus terrestris
24hr
Concentration No of Dead
Earthworm
% Response Probit
5 ul/L - - -
10 ul/L 3/10 30 4.48
15ul/L 5/10 50 5.00
20ul/L 6/10 60 5.25
25 ul/L 9/10 90 6.28
LC 50 = 15 and LD 50 = 20ul/L
93
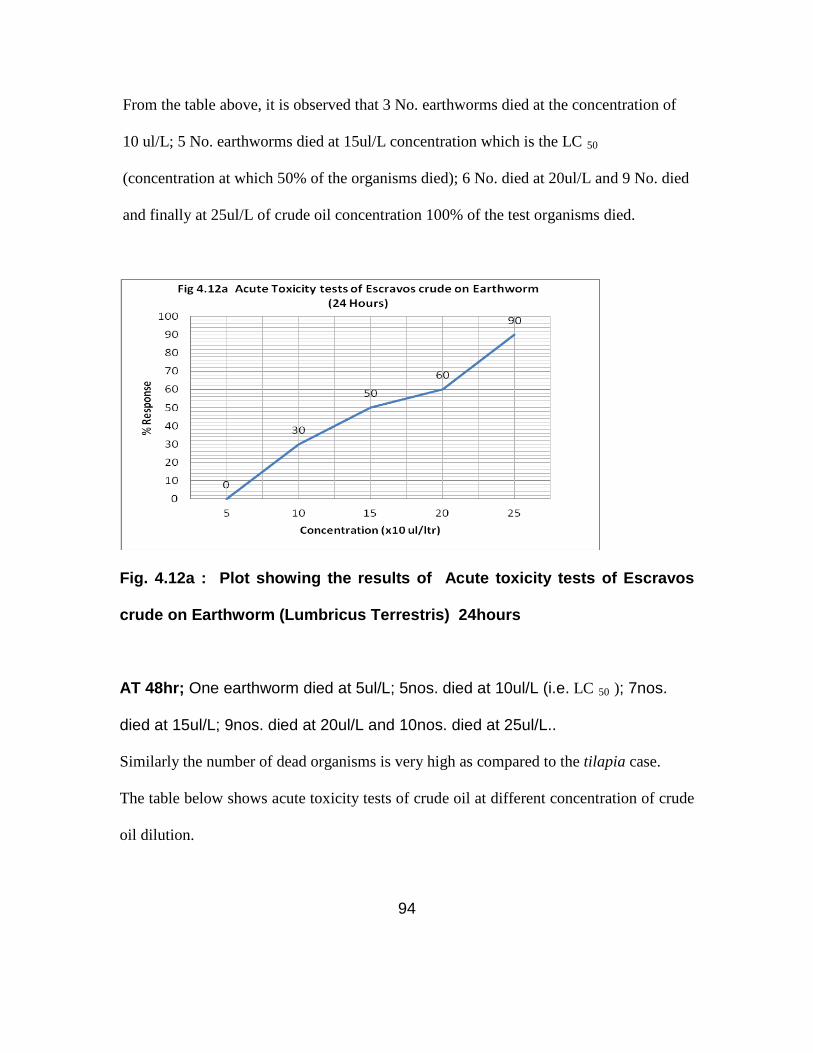
From the table above, it is observed that 3 No. earthworms died at the concentration of
10 ul/L; 5 No. earthworms died at 15ul/L concentration which is the LC 50
(concentration at which 50% of the organisms died); 6 No. died at 20ul/L and 9 No. died
and finally at 25ul/L of crude oil concentration 100% of the test organisms died.
Fig. 4.12a : Plot showing the results of Acute toxicity tests of Escravos
crude on Earthworm (Lumbricus Terrestris) 24hours
AT 48hr; One earthworm died at 5ul/L; 5nos. died at 10ul/L (i.e. LC 50 ); 7nos.
died at 15ul/L; 9nos. died at 20ul/L and 10nos. died at 25ul/L..
Similarly the number of dead organisms is very high as compared to the tilapia case.
The table below shows acute toxicity tests of crude oil at different concentration of crude
oil dilution.
94
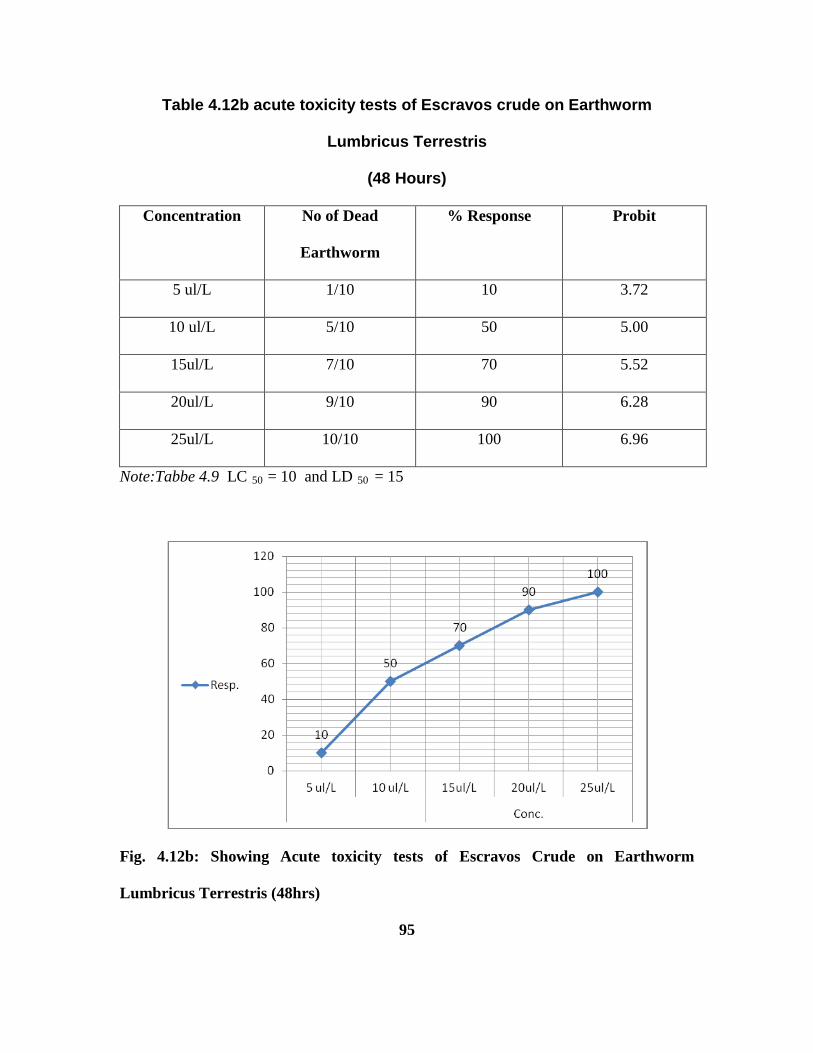
Table 4.12b acute toxicity tests of Escravos crude on Earthworm
Lumbricus Terrestris
(48 Hours)
Concentration No of Dead
Earthworm
% Response Probit
5 ul/L 1/10 10 3.72
10 ul/L 5/10 50 5.00
15ul/L 7/10 70 5.52
20ul/L 9/10 90 6.28
25ul/L 10/10 100 6.96
Note:Tabbe 4.9 LC 50 = 10 and LD 50 = 15
Fig. 4.12b: Showing Acute toxicity tests of Escravos Crude on Earthworm
Lumbricus Terrestris (48hrs)
95

At 72hr, as shown in Table 4.12a below, it is observed that the organisms start dying at
lower concentration starting from 5ul/L, 2nos dead recorded, and at the concentration of
10ul/L 6nos. of earthworms had died more than the expected LC50, whilst at the
concentration of 20ul/L, 100% of earthworms had died which indicates high toxicity of
crude to the test organisms (Earthworm).
Table 4.12c Acute toxicity tests of Escravos crude on Earthworm Lubricus Terrestris
(72 Hours) Concentration No of Dead
Earthworm
% Response Probit
5 ul/L 2/10 20 4.16
10ul/L 6/10 60 5.25
15ul/L 8/10 80 6.18
20ul/L 10/10 100 6.96
25ul/L 10/10 100 6.96
Note: Tabbe 4.9 c (a) LC 50 = 8.5 and LD 50 = 13.5
96
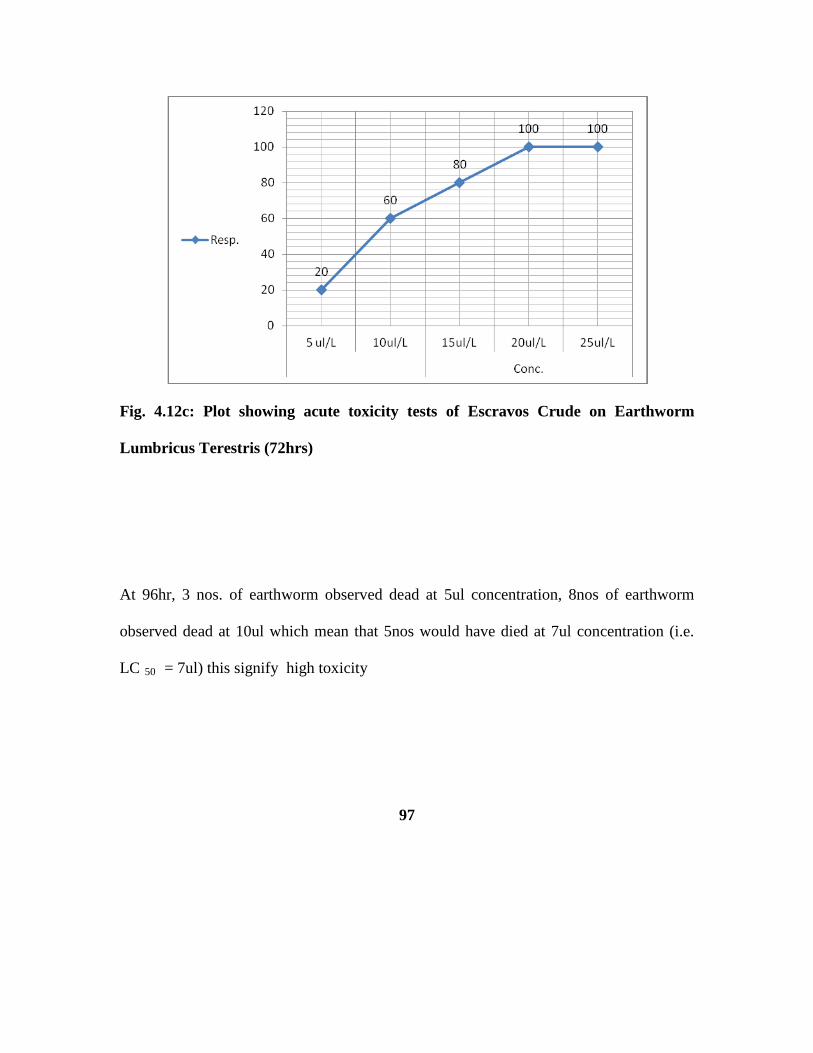
Fig. 4.12c: Plot showing acute toxicity tests of Escravos Crude on Earthworm
Lumbricus Terestris (72hrs)
At 96hr, 3 nos. of earthworm observed dead at 5ul concentration, 8nos of earthworm
observed dead at 10ul which mean that 5nos would have died at 7ul concentration (i.e.
LC 50 = 7ul) this signify high toxicity
97
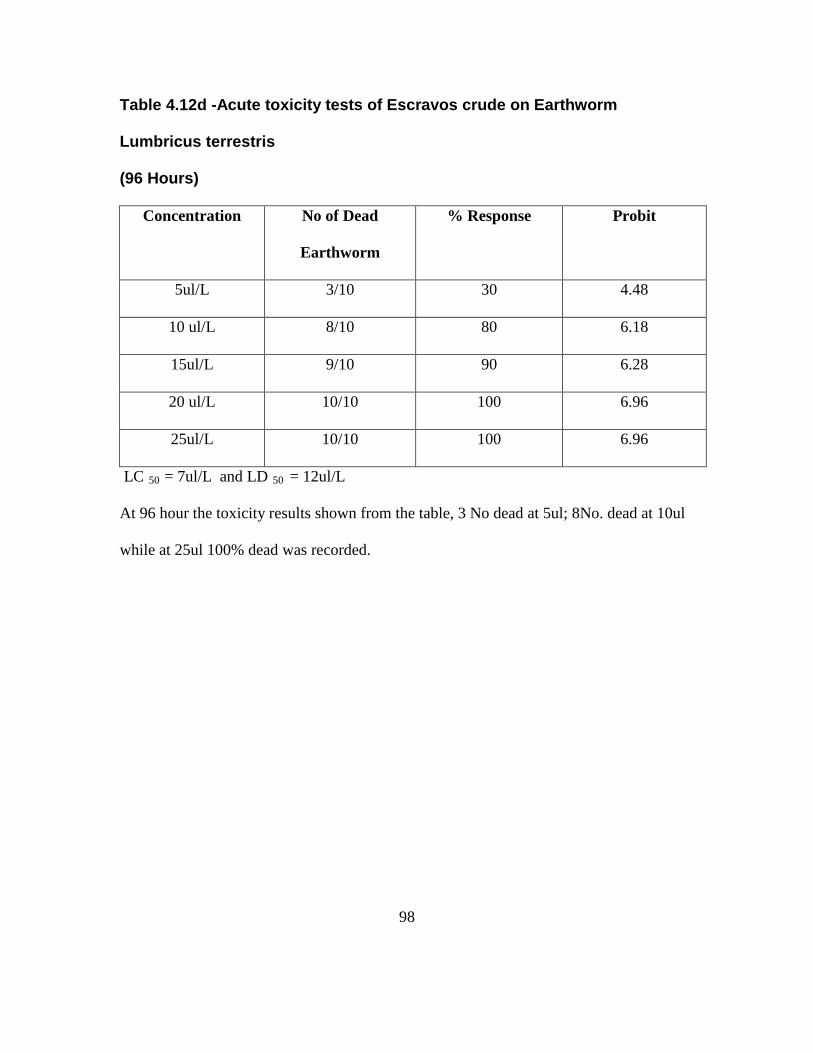
Table 4.12d -Acute toxicity tests of Escravos crude on Earthworm
Lumbricus terrestris
(96 Hours)
Concentration No of Dead
Earthworm
% Response Probit
5ul/L 3/10 30 4.48
10 ul/L 8/10 80 6.18
15ul/L 9/10 90 6.28
20 ul/L 10/10 100 6.96
25ul/L 10/10 100 6.96
LC 50 = 7ul/L and LD 50 = 12ul/L
At 96 hour the toxicity results shown from the table, 3 No dead at 5ul; 8No. dead at 10ul
while at 25ul 100% dead was recorded.
98
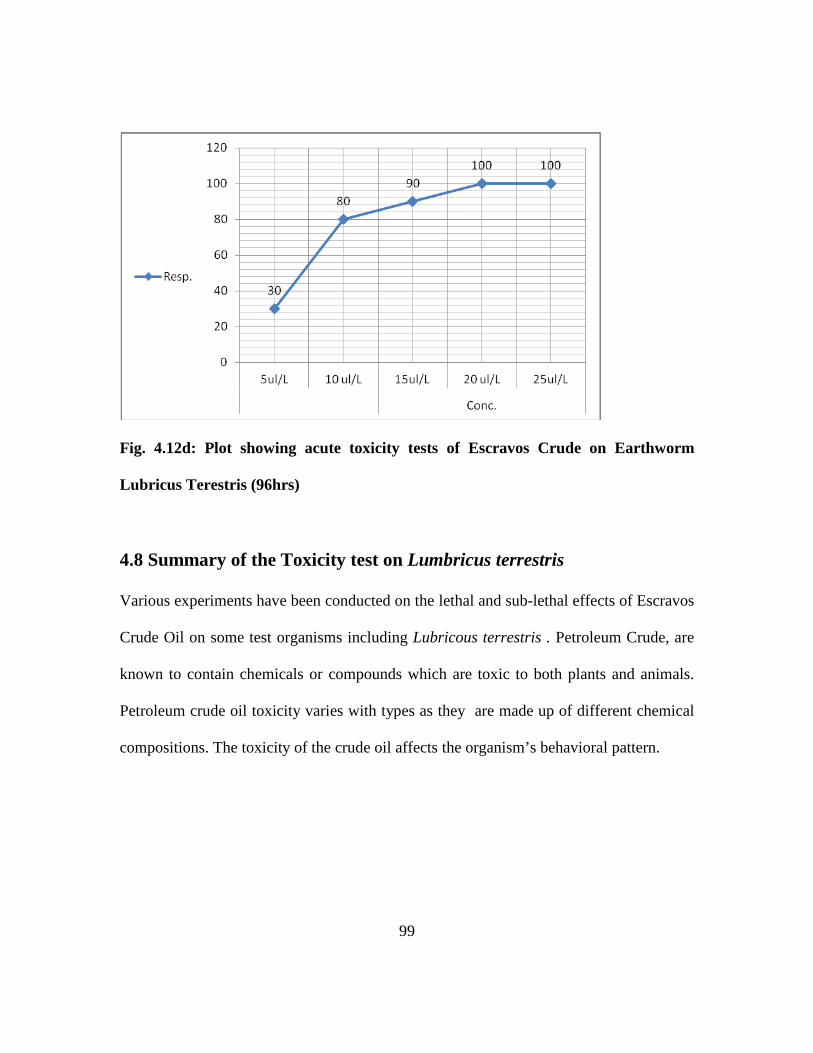
Fig. 4.12d: Plot showing acute toxicity tests of Escravos Crude on Earthworm
Lubricus Terestris (96hrs)
4.8 Summary of the Toxicity test on Lumbricus terrestris
Various experiments have been conducted on the lethal and sub-lethal effects of Escravos
Crude Oil on some test organisms including Lubricous terrestris . Petroleum Crude, are
known to contain chemicals or compounds which are toxic to both plants and animals.
Petroleum crude oil toxicity varies with types as they are made up of different chemical
compositions. The toxicity of the crude oil affects the organism’s behavioral pattern.
99
These varying behavioral responses were observed at the introduction of the Petroleum
crude oil sample into the bath containing the earthworms ranging from erratic movement
and as more of the Crude Oil was added, their movement became sluggish with time and
eventually at Lethal Concentration (LC50 )= 15x10ul/l, for 24hrs; 10x10ul/l for 48hrs;
7.5xul/l for 72hr and even 5x10ul/l for the 96hr. The LD50 for the Earthworms are:
30x10ul/l for 24hrs; 15x 10ul/l for 48hr; 12.5x10ul/l for 72hr and 5x10ul/l for the 96hr
experiment 50% of the organisms died in each case (Lethal concentration is the
concentration at which 50% of the organism died). Dicks (1976) stressed the importance
of behavioral responses in toxicity tests and suggested that each behavioral response
change may be more suitable than the mortality test for making ecological predictions.
And that in fact mortality can be a secondary response resulting from some primary
changes in behavioral pattern since an alteration in natural rhythm of an animal activity
may substantially influence its susceptibility to pollutants, predation and may reduce its
chances of success, should the need for competition arises.
Although not much toxicity data of crude oil on experimental animals are available, the
greatest health hazard have been found to arise when crude oil and products are aspirated
into the lungs. . When there is such aspiration, it rapidly induces acute chemical
pneumonitis which is characterized by pulmonary oedema and haemorrhage which cause
the fatality observed. According to Ebere (1988), the LD50 (for crude oil, gasoline and
kerosine orally in mice were found to be 30.5, 15.2, at 24.5ml/kg respectively though
slightly higher than that of the tilapia and the Earthworms.
100

The Lethal Dose is the cumulative doses at which the 50% of the organisms died for
instance, in this experiment; The LD50 for the Earthworms are: 30x10ul/l for 24hrs; 15x
10ul/l for 48hr; 12.5x10ul/l for 72hr and 5x10ul/l for the 96hr While in the case of the
Tilapia fish we have the following: 40x10ul/l for 24hr; 30x10ul/l for the 48hr; 20x10ul/l
for the 72 hr and 15x10ul/l for the 96hr.
It may be argued that this toxicity level is unattainable orally in man, even in suicide
attempts, but to the petroleum workers who inhale petroleum vapors, or have skin contact
and even eating with contaminated hands, if hands are not properly washed, it could be a
source of toxicity. Also most of the riverine villagers get their drinking water from the
often oil polluted rivers, which contain a high concentration of water soluble fraction of
crude oil.
101
4.8 DISCUSSIONS
4.8.1 EXPERIMENTAL FINDINGS
The findings obtained from the research work show that beside the numerous pollution
incidents and the subsequent damages to the environments within the Niger Delta,
Chevron Nigeria Limited in recognition of these problems, seem to have put in place not
only the Gas to Liquid project but an effective contingency plan for oil spillage response
management strategies to curtail environmental pollution. This study has found the
following for each tested hypothesis:
H1, that good pollution management enhances clean environment and healthy living, as
indicated by the high rate of respondents..
H2: The hypothesis which stated that good pollution management does not destroy
vegetation, farmland, fishing ground, cash crops, economic trees and human settlements
to be true, by the 100% response rate recorded and this was also reflected in the
calculated X2 value.
H3, hypothesis indicated that bad policy and improper monitoring of spills could result
to serious negative environmental impact and this was further confirmed by the increase
in the “No” column (i.e. 38 respondents)
H4 hypothesis, shows that training is very vital in effective handling of pollution
management, as clearly indicated by the number of respondents recorded in “YES”
column.(36 respondents).
102

H5 hypothesis, thus verifies that Chevron Nigeria Limited good contingency plan does
reduce environmental hazards emanating from oil pollution. Increase in the “NO” column
is an indication that the respondents are aware of the importance of the contingency plan.
4.8.2 OTHER DISCUSSIONS
Furthermore, investigations in this study also reveal the following, from the standpoint of
the research undertaken:
1. Chevron Nigeria Limited in her bid to fight environmental pollution, has not only
put in place sound environmental policy but had established an environmental
management plan that could be implemented all over the world during oil
spillage. For instance, her environmental monitoring procedure under policy 530,
when fully implemented during oil spillage conditions will help tremendously to
keep track of performance as well as allow for early detection of hazards,
resulting from any oil spillage(s) being the source of temporary or permanent
environmental damage of the host communities.
2. Chevron Nigeria Limited is committed to her environment and host communities
and as such, the company is found to involve in several community development
programs, which include: provision of a multi-million Naira community cottage
hospital for the benefit of the company’s host communities, building of class-
room blocks and provision of scholarships to deserving students nation-wide at
the secondary and tertiary levels.
103

There is a also recent $5m dollars community development program for the
Niger Delta aimed at addressing critical social, economic and developmental
issues through skills development acquisitions, basic health education, enterprise
development and food production in 1999. All these programmes are embarked
upon in order to work closely with her host communities.
3. The company in association with other oil producing companies, is actively
involved In the Clean Nigeria Association, playing close to the leadership role, in
order to effectively manage the pollution and its associated problems.
4. Its environmental monitoring action through the Company’s Policy 530 as regards
oil and gas production operations, entails adequate contingency plan which is
aimed at checkmating any pollution incident likely to occur and in turn enhances
free environment devoid of negative effect to the host communities.
5. The company has initiated several measures to adequately train the employees in
various pollution and environmental safety management techniques in order to
handle effectively emergencies resulting from oil spills, although there is room for
improvement.
6. In line with statutory guidelines, issued by the Federal Government of Nigeria
through some of her agencies such as FEPA (Now Federal Ministry of
Environment), DPR (Directorate of Petroleum Resources), the company has put in
place appropriate environmental sensitivity index mapping to effectively protect
the environment, in order to eliminate the flaring of gas completely or close to the
104

barest minimum on or before 2010 through its various projects such as EGP 1-3
and Gas to Liquid (EGTL).
(1) From the hypothesis tested in this study H2 indicates that good pollution
management does not destroy the vegetation, farmland, fishing ground, cash
crops, economic trees and human settlement instead the reverse is true. The
study also indicates that petroleum generally is toxic in different respects. The
marine environment which is the highest receiver of these chemicals are
mostly affected.
(2) Also this study has shown that crude oil spills are toxic due to the effect on
both fish and earthworm’s animals. It can be correlated that man is sure to be
affected in the same manner.
(3) The toxicity analysis shows a negative trend in the life of the organisms in the
area.
The basic issue that compels a study like this is the possibility to ensure more cost
effective and participatory programmes in the Niger Delta region and community
development, and to progressively reduce social tension and conflict in the region.
105
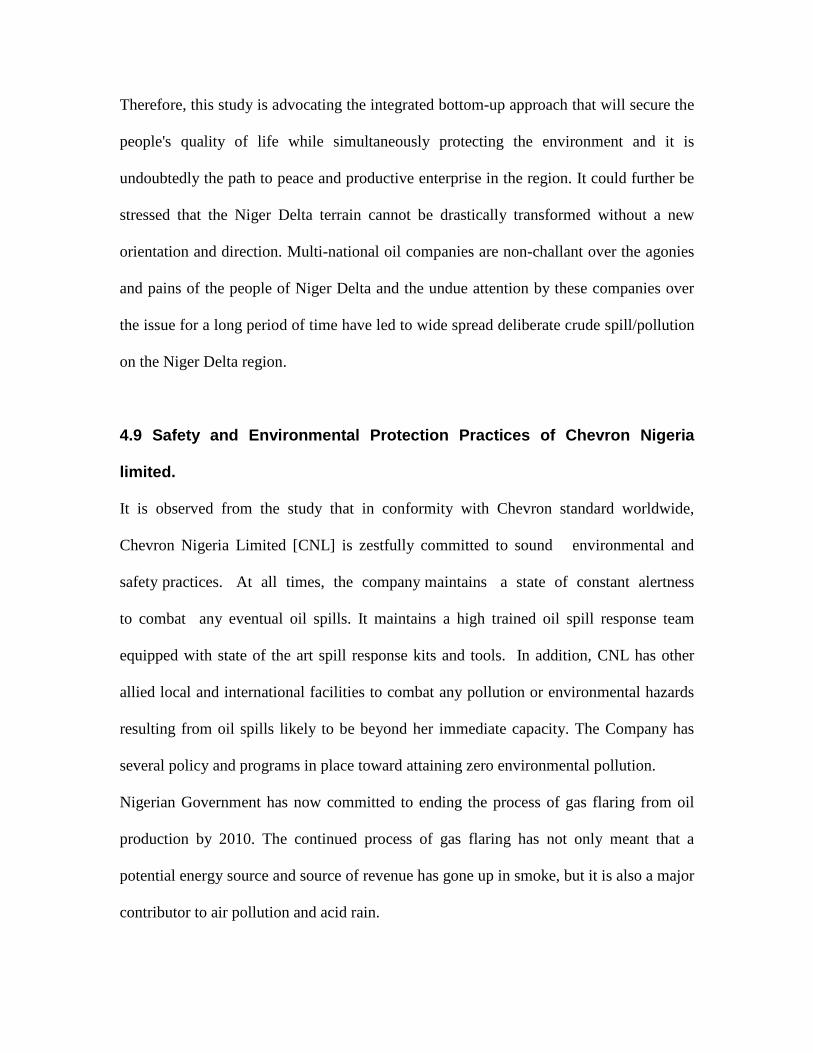
Therefore, this study is advocating the integrated bottom-up approach that will secure the
people's quality of life while simultaneously protecting the environment and it is
undoubtedly the path to peace and productive enterprise in the region. It could further be
stressed that the Niger Delta terrain cannot be drastically transformed without a new
orientation and direction. Multi-national oil companies are non-challant over the agonies
and pains of the people of Niger Delta and the undue attention by these companies over
the issue for a long period of time have led to wide spread deliberate crude spill/pollution
on the Niger Delta region.
4.9 Safety and Environmental Protection Practices of Chevron Nigeria
limited.
It is observed from the study that in conformity with Chevron standard worldwide,
Chevron Nigeria Limited [CNL] is zestfully committed to sound environmental and
safety practices. At all times, the company maintains a state of constant alertness
to combat any eventual oil spills. It maintains a high trained oil spill response team
equipped with state of the art spill response kits and tools. In addition, CNL has other
allied local and international facilities to combat any pollution or environmental hazards
resulting from oil spills likely to be beyond her immediate capacity. The Company has
several policy and programs in place toward attaining zero environmental pollution.
Nigerian Government has now committed to ending the process of gas flaring from oil
production by 2010. The continued process of gas flaring has not only meant that a
potential energy source and source of revenue has gone up in smoke, but it is also a major
contributor to air pollution and acid rain.

106
The phasing-out of gas flaring has been consistently pushed back as Nigeria has focused
on boosting oil exploration and production in order to generate much-needed revenue for
the government, but the 2010 deadline now appears firm as infrastructure to monetize the
associated gas from oil production is in place (Escravos Gas to Liquid joint venture
project between Chevron/NNPC and Sasol Petrochemical Company of South Africa was
billed to commence in 2009). In this study an assessment of how oil and gas exploration
have affected the Ugborodo community was carried out.
4.9.1 Chevron Corporate Social Responsibility.
Chevron Nigeria Limited had continued to intensify her youth’s empowerment programs
through skill acquisition and employment generation in oil producing community
(Ugborodo). It is firmly believed that the role of multinational oil company as a corporate
citizen toward achieving sustainable youth empowerment through skill acquisition
program will reduce the current tension in the Niger Delta Region.
The oil and gas sector has continued to be the backbone of the Nigeria economy,
contributing about 90% of the nation’s foreign earnings and about 25% of the GDP. This
situation may likely continue in the near future and the sustainable development of the oil
and gas sector is, therefore of utmost importance, especially since virtually all of the
activities in both the upstream and downstream sub-sectors are not only pollution-prone,
but readily provoke social discord. Chevron Nigeria Limited has put up so many
strategies in place to manage pollution and sustainable development for efficiency. This
study would further enhance their functionality.
107
4.10 GENERAL DISCUSSION ON IMPACT OF OIL AND GAS POLLUTION ON
THE ENVIRONMENT AND HUMAN HEALTH IN THE NIGER DELTA
The impact of oil and gas pollution on the environment and subsequently on human
varies from tolerable to devastating levels. It was observed from this study using
Ugborodo Community as case study that the inhabitants of the oil producing areas bear
the brunt of excessive and reckless exploitation of crude oil resources. It is not surprising
therefore, that the various communities in the oil producing areas protest vehemently,
most of the time in a militant way to register their grievances. Examples are the. Ogoni
youths in Rivers State who had constantly vented their anger on the oil companies like
the Shell Petroleum Development Company several times, destroying their rigs and other
services installations and further disrupting oil related activities on their land. Most
recently, the Movement for Emancipation of Niger Delta (M.E.N.D), which is known for
kidnapping activities to redress grievance. These activities continue to be major problems
even to the oil producing communities. On the part of the multinational oil companies,
they claim to support sound environmental protection practices as part of their social
responsibility. However, all the benefits derived from oil are associated with the risk of
environmental pollution. Oil pollution, as a major source of environmental degradation,
has attracted global awareness especially since marine ecosystems are potentially at risk
due to the activities of the oil industry. Over the past three decades, a large amount of
literature has been produced, describing oil and its effects in some temperate regions, the
Middle East and in some tropical areas [Nwankwo, J.N. and C.N. Ifeadi 1983].

108
It has been found from this study that for Ugborodo community and most other
communities in the Niger Delta of Nigeria the major derivable benefits are nothing but
draught, desertification, loss of biodiversity, flood, toxic waste spills, spills from oil well
blow-outs resulting in pollution of the environment, gas flaring to mention but a few.
These findings are confirmed or corroborated in the research survey undertaken within
the same areas in a global study by the Niger Delta Environmental Survey (NDES) an
independent survey report. The study by the NDES also covers the environmental and
socio-economic issues within the Niger Delta region including Ugborodo Community.
The NDES report could be arranged in three subsets as follows:
(a) The Natural Environment: The problem subset in this group consisted of the
following - Coastal / riverbank erosion, flooding, sedimentation / siltation,
subsidence, water hyacinth.
(b) Development –Related Problems: The problem subset in this area was land
degradation / soil fertility loss, agricultural decline, shortened fallow, Delta forest
loss (mangroves etc), biodiversity depletion, fisheries decline, oil spillage, gas
flaring, sewage and waste water
(c) Social-Economic Problem: Problems: Problems examined in this subset were
poverty, unemployment, community-oil company conflict, inter-community
conflict, intra-community conflict, conflict over land, inadequate compensation,
displacement,
109

The Report showed that these problems result in decay in societal values, youths
restiveness, killings etc, poor transportation high cost of fuel, housing pressure and
infrastructure decay, crime etc.
It was also observed in the NDES Report that the problems of the communities resulting
from the damage to the environment were many. Environmental protection and
preservation therefore remained one of the most important challenges of the community.
It was perceived with increasing clarity and concern, how the economic and social
possibilities of the present and future generations depend on the success of government,
community and oil companies including the Ugborodo area. Efforts to preserve natural
resources through effective management for excellent performance are to be geared up.
110

Fig 4.13 Pix showing: Destroyed forest by oil pollution (Photograph taken during field
observation 2009)
111

4.15.2 Observation on the Devastating Effects of crude oil production
activities on Families living within oil exploration sites
It was observed that most families live among the oil fields, breathing in hydrocarbon
gases and coping with frequent oil leaks in their community. We also found that a
leaking oil head spews oil and gas in Ugborodo constantly exposing the community to
risk of fire, explosion etc.
Fig 4.14: Pix showing Gas flares heating the environment (Source: Friends of the
Earth in a new Report “Behind the Shine” 1994).
112
Fig 4.15: Pix Showing Oil drilling well-head and impact on the ecology within Niger
Delta. (Source: Friends of the Earth in a new Report “Behind the Shine” 1994).
It was also observed that flaring natural gas from oil fields was a common sight and
dominated the skyline in the Niger Delta. Associated Gas is a by-product of crude oil
production, which needs to be released to produce oil. It is probably the most visible
impact of the oil industry on daily life in the Niger Delta. The flares constantly spew
smoke across the surrounding farms.
113

Oil companies choose to burn the gas instead of re-injecting the gas into the ground or
selling it, as this is considered the most economic option. The Nigerian government
wants flaring to be stopped by 2010 as gas flaring wastes energy and contributes to global
warming. Shell Petroleum Development Company is committed to ending its flaring by
2008, but has backslided on this commitment.
Fig. 4.16: Pix showing devastating effect of oil exploration (Gas Flaring effect)
(Source: Friends of the Earth in a new Report “Behind the Shine” 1994).
114

Fig.4.17 Pix showing devastating effect of Oil Exploration (Gas Flaring). (Source:
Friends of the Earth in a new Report “Behind the Shine” 1994).
115
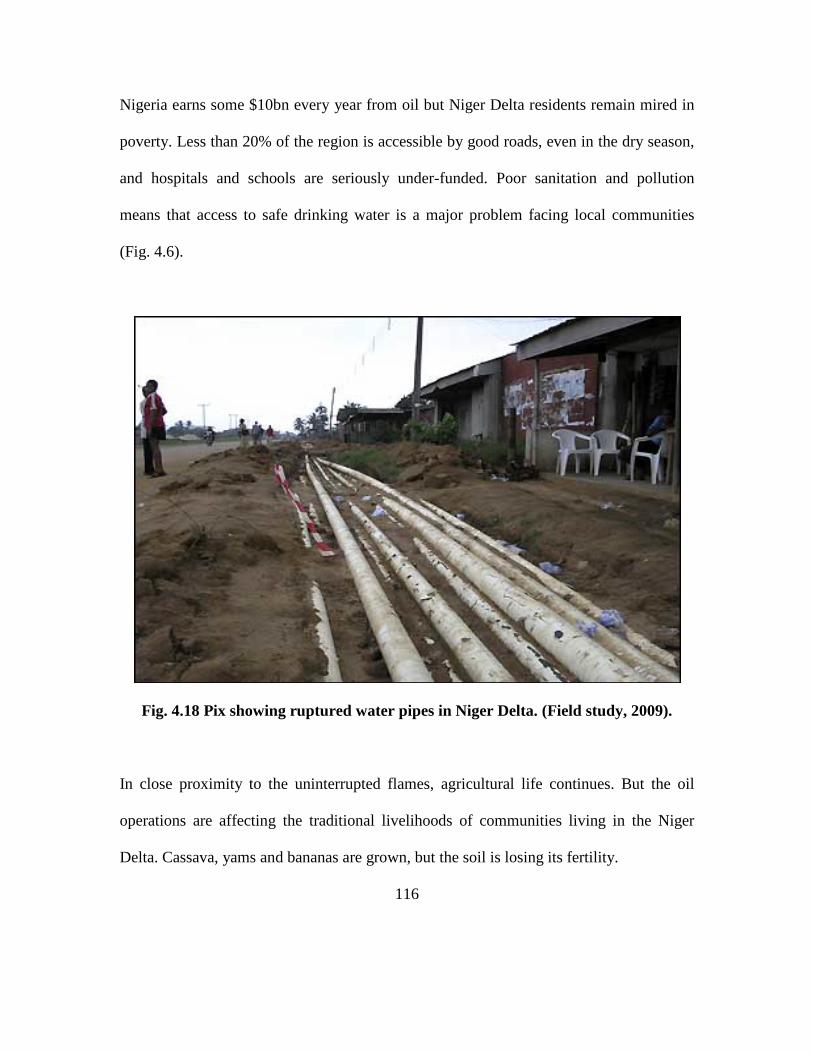
Nigeria earns some $10bn every year from oil but Niger Delta residents remain mired in
poverty. Less than 20% of the region is accessible by good roads, even in the dry season,
and hospitals and schools are seriously under-funded. Poor sanitation and pollution
means that access to safe drinking water is a major problem facing local communities
(Fig. 4.6).
Fig. 4.18 Pix showing ruptured water pipes in Niger Delta. (Field study, 2009).
In close proximity to the uninterrupted flames, agricultural life continues. But the oil
operations are affecting the traditional livelihoods of communities living in the Niger
Delta. Cassava, yams and bananas are grown, but the soil is losing its fertility.
116
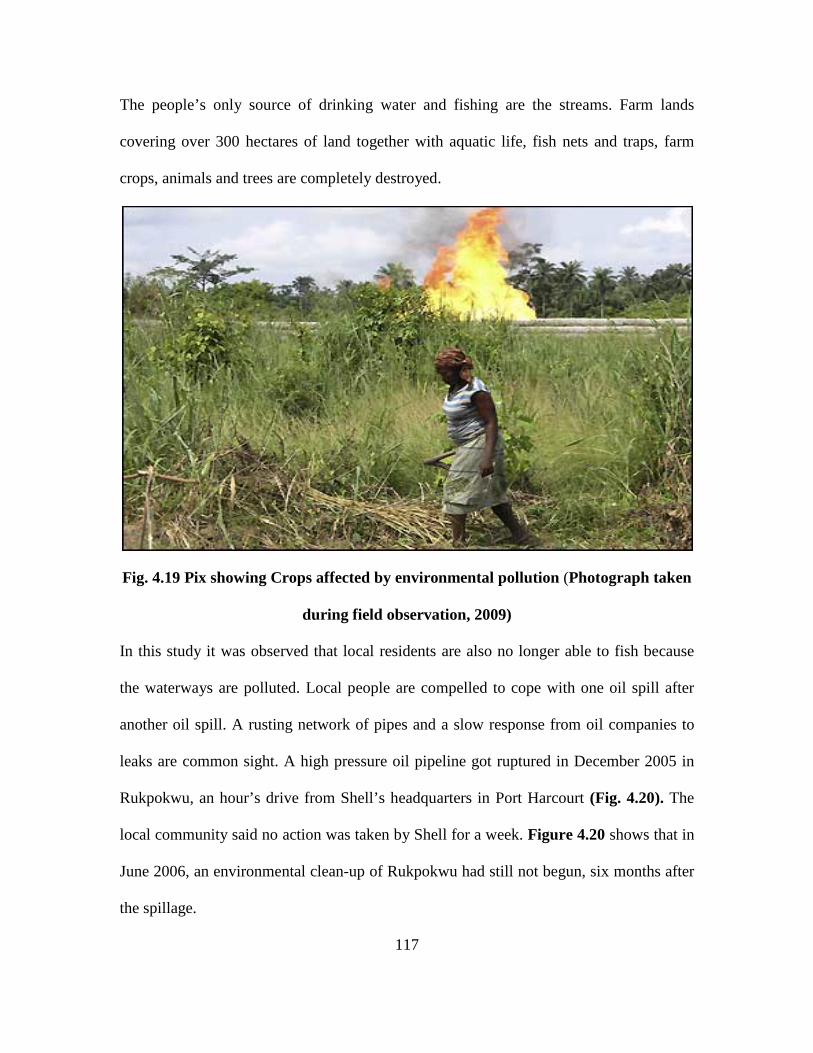
The people’s only source of drinking water and fishing are the streams. Farm lands
covering over 300 hectares of land together with aquatic life, fish nets and traps, farm
crops, animals and trees are completely destroyed.
Fig. 4.19 Pix showing Crops affected by environmental pollution (Photograph taken
during field observation, 2009)
In this study it was observed that local residents are also no longer able to fish because
the waterways are polluted. Local people are compelled to cope with one oil spill after
another oil spill. A rusting network of pipes and a slow response from oil companies to
leaks are common sight. A high pressure oil pipeline got ruptured in December 2005 in
Rukpokwu, an hour’s drive from Shell’s headquarters in Port Harcourt (Fig. 4.20). The
local community said no action was taken by Shell for a week. Figure 4.20 shows that in
June 2006, an environmental clean-up of Rukpokwu had still not begun, six months after
the spillage.
117

Fig. 4.20 Pix showing Ruptured high pressure oil pipe. (Field trip June 2009).
EFFECT OF CRUDE OIL ON UGBORODO COMMUNITY – In the investigation of
this study, there was abundant evidence that crude oil and the activities of the production
activities of the oil industry had profoundly affected the physical, biological and aesthetic
value of Ugborodo and its environs. judging from the environmental degradation
observed in both the physical and the biological conditions of the present Ughorodo town
and community, the economic and health well being of the local people had been
affected. Examples of the devastating effects of oil exploration in the Niger Delta and
Ugborodo Town are shown in fig 4.13 - 4.20.
118

CHAPTER FIVE
CONCLUSIONS AND RECOMMENDATIONS
Arising from the findings and results from this study, it has been shown that crude
petroleum generally and its distillates are toxic in different respects. The marine
environment which appears to be the highest receiver of these chemicals is at the mercy
of man and his industrial development. Crude oil was found to be toxic while chemicals
used during oil spills to arrest the spill are even more toxic than the crude causing much
more toxicity to aquatic organisms. The study has been able to prove that crude
petroleum oil is toxic to both fish and animals of which man is sure to be affected in the
same way. The author hereby makes the following conclusion and recommendations:
1. Maintenance of a continuing educational program to keep oil industry staff and
communities constantly aware of the effect of oil spillage and ensure
bioremediation.
2. Establishment of internationally accepted, standard oil field practices to minimise
oil spillage and their effect.
3. Enactment of relevant legislations with attendant penalties and effective policing.
This study also suggests the following strategies to enhance sustainable development
within the Niger Delta Region:
5.1 Communicating with the Communities on Sustainable Development Strategies -
This strategy is one area that is not very popular in Nigeria. It is believed that the use of
this strategy as an organ of communicating projects in various ways could assist in
119
empowering the community in order to find their voice within the decision making
process of sustainable development through the following suggested mechanisms:
(a) Identify the community goals, theme and partners (subject expert, community
experts, administrators and other media practitioners that can be used.
(b) Establish campaigns and awareness programs on selected themes. The process
will be a unique one and capture the community’s interest.
(c) Local film production could serve as a mechanism
(d) Screen the films and organize a forum where multi disciplinary people connected
with the theme come and exchange ideas in the presence of the community.
(e) Cameras for film production are to be provided and the people are allowed to
handle them by the community themselves to make their own film on any chosen
project.
An example of such a project could be organized by an NGO and sponsored by the
operating oil Companies such as Chevron Nigeria Limited for the film making
industry. The context of this project is to sustain the interest of the community in the
development of the community and conserve its natural resources. Such an approach
helps to strengthen ongoing processes and looks into hitherto untouched mechanisms
which could be innovative and potentially effective. Since the rural community
comprising about 70% of the population is the dominant stakeholder of natural
resource conservation, a Sustainable Communication Action Plans should better come
from their domain and should make communication around the issues concerning
them, the center stage of the project.
120

5.2 Eco-tourism as a Tool for Sustainable Development - Great potential exists in the
beaches of the nearby Escravos Communities namely: Ugborodo, Madangho, and
Ogidigben Agogboro and Elsmere for the development of eco-tourism. Hence it should
be considered as an integral part of official development policy for the Ugborodo
community. Eco-tourism can cause the rapid development of the wasted beaches and
other potentials associated with the geographical location of the Ugborodo community. It
is amazing to know that myriads of ecotourism resources are being wasted every minute
in the natural resort of the area and this could be exploited and sustained. The objective
will be to promote sustainable and responsible tourism, encourage balanced development,
generate foreign exchange, promote tourism-based rural enterprises, create employment
and accelerate rural-urban integration and cultural exchange.
5.3 Establish Interface Management / Conflicts Resolution Schemes /
Processes
One of the greatest drawbacks for the people of the oil producing areas over the years has
been the lack of interface management that would have assisted in the elimination or
reduction of conflicts to the barest minimum.
Therefore establishment of interface management processes will go a long way to stem
the continued violence that erupts sporadically in the region.
Interface management as mentioned cannot be overemphasized. It is a missing link
currently between the stakeholders in the oil producing communities and the operators
and that is why there is constant conflicts and violence in the region over the years.

121
Interface is about creating meeting point between two or more separate entities in order to
achieve certain task(s).
For instance in this case, interface between the youths and the elders, the communities
and the various levels (local, state and Federal Government), other stakeholders like the
NGOs, the Oil companies etc. Interface could be defined in terms of different people of
various professional callings performing different functions or tasks within an
organizational setting interdependently or playing complementary roles to one another. It
could even be inter-organizational structures, or stake holders within the communities,
with a view to enjoying economic advantages arising from the economics of scale.
Interface management within the three tiers of governmental roles as well as host
communities like Ugborodo will be of immense importance in crises management
towards sustainable development.
In the case of the present scenario, all the stakeholders must be adequately managed to
achieve effective and efficient sustainable New Ugborodo Township.
Such will ensure good shelters, good economic well being and crises free society and
peaceful co-existence among the people in the community.
Poor conflict resolution techniques have been one of the major problems associated with
oil producing communities, Ugborodo inclusive.
122
5.4 Establish Small and Medium Entrepreneurship Schemes (SMES) - This concept
can be very vital for youth empowerment, job creation and as an avenue for micro credit
financing of projects that will change the life of the youths from restiveness to peaceful
coexistence among their peers.
Chevron Nigeria Limited had already put in place a similar scheme through her
collaboration with the Federal Government’s Nigerian Opportunity for Industrialization
on Youth Skill Acquisition initiatives to train various youths on different skills ranging
from welding, fabrication, Computer operation and programming education, tailoring
among others. However, this should be expanded in order to spread across the Niger
Delta of Nigeria for its impact to be felt.
5.5 Other Sustainable Development Strategy Options:
Furthermore, to ensure sustainable hydrocarbon exploitation, other strategies that may be
recommended to be adopted for the Niger Delta Region, from this study include the
following:
(a) A realistic national conservation policy that ensures optimum economic returns
from oil and gas exploration and production, must be established in the Region.
This will take into consideration the welfare of the local inhabitants of the oil and
gas producing areas.
123
(b) Ensure minimum disturbance of the soil, topography, vegetation, sensitive
ecological zones, including critical wildlife habitats, wetlands, avian migratory
routs, etc. during the process of exploration, production, refining, transportation
and marketing of oil and gas;
(c) Proscribe all forms of oil and gas exploration and production in estuaries, coastal
waters, beaches and resorts, since such measures will minimize disturbance to and
contamination of benthic and aquatic habitats;
(d) Minimize disturbance / displacement of local inhabitants, their artifacts, roads,
historical sites, sacred groves / places of worship, etc, source of livelihood
(agriculture, fishing, transportation etc.) and pay adequate compensation for
proven cases of pollution;
(e) Prescribe stringent regulations for the efficient collection, treatment and disposal
of oil field wastes (drilling muds and additives, formation waters etc);
(f) Monitor water quality in open drains, streams and other water bodies around oil
and gas operations, as well as groundwater quality in all areas prone to pollution;
(g) Inspect periodically pipelines, ships, barges, tanks and other oil field and refinery
facilities for early detection of corrosion, fatigue leakages, damage and ensure
prompt maintenance;
(h) Encourage all oil and gas operators to keep accurate records of crude oil and
product spills as well as other accidents that impact environmental quality and
report them promptly to the appropriate authorities.
124
(i) Maintain an inventory of certified / approved oil spills control chemicals and
document their toxicity levels and biodegradability;
(j) Monitor air emissions and gaseous waste (CO, CO2, NO, H2S, CH4, etc)
discharged at production platforms, refineries, petrochemical and gas processing
facilities through continual air quality sampling as well as through daily visual
checks for leakages around tanks, pumps, pipelines and transfer points;
(k) Promote conservation and restoration of natural formation pressure through
elimination of gas flaring and the re-injection of produced associated gas and
formation waters.
(l) Promote the complete utilization of produced associated gas, reduce gas flaring
and production of greenhouse gases.
(m) Monitor regularly the functioning of well head and drilling platform devices to
prevent blowouts, and install early warning electronic devices for their detection
and prevention;
(n) Install pressure monitoring gauge and automatic shut-off devices on pumps,
pipelines and ensure their integrity through periodic inspection and testing;
(o) Prescribe minimum standards of environmental safety in all upstream and
downstream oil sector facilities and maintain regular environmental audits of all
existing oil and gas production facilities to ensure the adoption of
environmentally safe practices as well as compliance with set standards.
125

(p) Prescribe minimum environmental and safety regulations for the protection of the
health of workers, the general public and the environment and ensure compliance
through teams of competent inspectors;
(q) Prescribe a realistic quality control assurance scheme for the adoption of all
operators and monitors compliance;
(r) Ensure the implementation of the national Oil Spill Contingency Plan.
(s) Prepare a National Plan of Action for Awareness Preparedness for Emergencies at
the local Level (APELL);
(t) Prescribe stringent penalties for deliberate sabotage of oil and gas installations;
(u) Promote research aimed at accumulating baselines data on oil and gas production
areas;
(v) Encourage the establishment of waste / crankcase oil recovery and reuse systems;
(w) Review and periodically harmonize existing laws to reflect new realities in
environmental management in this sector.
Overall, this study recommends that to achieve peace and equity in the Niger Delta,
the following will need to be put in place:
a. Provision for participation and control of resources by the people of the
host communities.
b. Repeal of obnoxious and contentious statutes
c. Employment of local people by oil companies
126

d. Revival of the agricultural sector in the region
e. Reform of Nigerian land law
f. Provision for the payment of adequate compensation to any impacted
communities
g. Recognition of social responsibilities by oil companies
h. Reform and enforcement of environmental standards in the region
i. Protection and conservation of biodiversity and wetlands of the Niger
Delta.
127
REFERENCES
Adeniyi, E. O.; Olusule, R and Angaye, G. (1983). Environmental and Socio -
Economic Impact of Oil Spillage in the Petroleum Riverine Areas of Nigeria. In:
Proceedings of the 1983 International Seminar on the Petroleum Industry and the
Nigerian Environment of the Impact of Minor Oil Spillage in the estuarine Niger
Delta, (NNPC). Port Harcourt pp233-248.
Alo, B. I., Kusemiju, K, and Almund, O. (1991). Environmental Impact
Assessment of Tapa Spills, A report submitted to Chevron / GOCON Oil
Company Nigeria. p10
Alo, B. I. (1992). Environmental Impact Assessment of the Proposed Escravos
Gas Project. “Preliminary Assessment Report” prepared by University of Lagos
Consultancy Services (Unilag Consult) November, 1992.
Baker, J.M. (1981). “Impact of the Petroleum Industry on Mangrove Ecology”.
In: Proceedings of the 1981 International Seminar on the Petroleum Industry and
the Nigeria Environment,. NNPC / FMW & H, Petroleum Training Institute,
Warri, Nigeria p. 71-89.
Brown, L.R (1987): “A New Era Unfolds” In state of the World 1993: A World
watche Institute Report of progress toward a sustainable society, Ed L. Starke,
London Norton, 1987.
Brundtland Report, 1987 World Commission on Environment and Development,
WCED (1987): Our common future, Oxford: Oxford University Press, p 43.
128
Cairo, J.G. Parker, J.C. et al. 1975. Pollution and Environment Management.
New York: Oxford University Press.
Carroll, John E., (1988): International environmental diplomacy: The
Management and Resolution of Transfrontier Environmental Problems,
Cambridge: Cambridge University Press, p. 291.
Chertow, Marian R. and Daniel C. Esty, eds. (1997): Thinking ecologically: The
next generation of environmental policy, New Haven, CT: Yale University Press,
p. 271.
Chevron Nigeria Limited “Impact 1998” Community Relations News. CNL Vol.
2 No. 3 1998
Chevron Nigeria Limited Safety and Environment Department; 1984. Oil Spillage
Contingency Plan Manual Lagos: CNL International Publ.
Commission on Global Governance (1995): Our global neighborhood Oxford:
Oxford University Press, p. 410.
Cooper, David E. and Joy A. Palmer, Eds. (1996): Just environments:
Intergenerational, International and interspecies issues. Routledge London, p 199
Cowell, E.B. 1970. The Ecological Effects of Pollution on Littoral Communities.
New York: Applied Science Publisher Limited.
Crapp, A. (1981). The Biological Effects of Oil Pollution on Littoral
Communities. London: Field Studies Council 1981.
129

Dicks, B. (1976): The importance of behavioral patterns in toxicity testing and
ecological prediction. In Marine Ecology and Oil Pollution. Ed. By J.M. Baker
303-19 London Institute of Petroleum Publishers.
Duraiappah, A. (1996): Poverty and environmental degradation: A literature
review and analysis. CREED working paper series no. 8, London, UK:
International Institute for Environment and Development, p. 34.
Durning, A. B. (1989): Poverty and the Environment: “Reversing the downward
spiral. Worldwatch paper no. 92. Washington, D.C.: WWI, p. 86.
DPR, Mineral Resources, 1983. Environmental Guidelines and Standards for the
Petroleum Industry Lagos. NNPC No. 5 Vol. 5
Dwivedi, O. P. and Vajpeyi (1995): Environmental policies in the third world: A
comparative analysis, Contributions in political science, Westport, CT:
Greenwood Press, p 229.
Ekekwe, E. (1981): “The Funiwa-5 Oil Well blow-out” In: The Petroleum
Industry and the Nigeria Environment Proceedings of an international seminar
sponsored by the Nigerian National Petroleum Corporation (NNPC) Lagos. Pp
64-68.
Ekweozor, I.K.E. (1985): A baseline study for the monitoring of Oil Pollution in
the Bonny Estuary, Nigeria. M.Phil Thesis, Rivers State University of Science
and Technology, Port Harcourt 325pp.
130

Ekweozor, I.K.E. (1989). A review of the effect of oil pollution in West Africa
Environment. Discovery and Innovations. Journal of Science and Environmental
Management Vol.5 No 1 June, 2001 pp33 -41.
GESAMP /UNDP 1977. Impact of oil in the Marine environment. Joint Group
of Experts on the Scientific Aspect of Marine Pollution (GESAMP); Reports
and studies 6. 250pp
Gelder-Ottway, S.V. et al (1976): “A review of World Oil Spillages 1960-1975”
In Marine Ecology and Oil Pollution, Applied Science Publishers Ltd Essex,
England, pp 483-520
Gundlach, R. E. et al (1981): Sensitivity of coastal environments to oil spills.
In Proceedings of the 1981 International Conference on the Petroleum Industry
and the Nigeria environment. Sponsored by NNPC at the Petroleum Training
Institute, Warri, Nigeria pp.82-88
Ifeadi, C. N. and Nwankwo, J.N. (1987). “Critical Analysis of Oil Spill
Incidents in the Nigeria Petroleum Industry”. Proceedings of the 1987
International Seminar on Petroleum Industry and the Nigerian Environment..
Oweri, Nigeria.: pp104-114 .
Imevbore, A.M.A. and Olusi, S.O. (1979). Human Health Hazard Associated
with Petroleum Industry and the Nigerian Environment. Proceedings of 1979
Seminar of the Federal Ministry of works and NNPC. Pp 232
131
Imevbore, A.M.A. et al (1981): Environmental monitoring in relation to
prevention and control of oil pollution. In: Proceedings of the Petroleum
Industry and the Nigerian Environment: NNPC / FMOW&H Warri, Nigeria.p
135-142.
Independent Commission on Population and Quality of Life (1996): Caring for
the future: Making the decades provide a life worth living: Report of the
Independent Commission on Population and Quality of Life. Oxford, UK:
Oxford University Press, p 359..
Niger Delta Environmental Survey (NDES). (1997); Phase 1 Report. Volume 1.
Environmental and Social-Economic Characteristics Submitted by
Environmental Resources Managers Ltd. Lagos
Niger Delta Environmental Survey Final Report Phases 1 Volume IV. Loss of
Biodiversity, deforestation, degradation of the Niger Delta Sources of Natural
Resources through the activity of Oil Exploration and Production. Commission
study on evaluation of extent of damage and how to remediate the areas
(Abridge version of finding & Recommendation - Report 1997).
Nigerian Environmental Society Technical Journal. 2003. Edited by Ekweozor,
I.K.E. et al. “Biodiversity and Oil Industry in the Niger Delta - A Sensitivity
Environment – Martin G. Ogbe; Department of Zoology Delta State University.
132

NNPC, 1972. The Petroleum Industry and the Nigeria Environment; In
Proceeding of International Seminar on Characteristics properties of the
Nigerian Crude oil sponsor by the Nigerian National Petroleum Corporation
Lagos - 1972
NNPC, 1981. The Nigerian Oil Industry Environmental Diseconomies,
Management, Awobanjo, S.A Oil Spillage in Nigeria: 1976-1980 paper
presented at the 1981 International seminar on the Oil Industry and Nigerian
Environment, Lagos. 1981.
Nwankwo, J. N. (1989): Oil spill incidence at Ulumoro, Nigerian Observer,
XXII, September 13, 1989
Nwankwo, J.N. and Irrechukwu, D.O. (1981): Problem of Environmental
pollution and control in the Nigeria petroleum industry. Proceedings of the 1981
International Seminar on the Petroleum Industry and the Nigerian Environment,
Nov. 9-12 (1981) Petroleum Training Institute, Warri, Delta State, Nigeria, pp
102-107.
Nwankwo, J.N. and C.N. Ifeadi (1987): “The study of Oil Spill Contingency
Planning in Nigeria” In Proceeding of an International Seminar on the
Petroleum and the Nigerian Environment, Port Harcourt, Nigeria, pp 93 – 105.
133
Nwankwo, J.N. and C.N. Ifeadi (1987): The Petroleum Industry and the
Nigerian Environment In: Proceedings of an International Seminal on “The
Status of Oil spill contingency planning in Nigeria” sponsor by NNPC and the
Federal Ministry of Works and Housing, Lagos, Nigeria.
Obasi, N.K. (2006): Foreign participation in the Nigeria Oil and Gas Industry:
http:www.onlinenigeria.com/links/adv.asp1 blurb =493
OECD (1976): Managing the Environment: The Role of Economic Instruments.
Paris: OECD, p 191.
Okoye, N.Y. (1988): “Oil Pollution Control” In: The Law and the Environment
in Nigeria, Shyllon, F (Ed) Vantage Publishers. Ibadan. pp61 – 72.
Omatete O. O (2006): Cry my beloved Ugborodo, a diary of a painful visit to
Itsekiri homeland made desolate by oil pollution and inter-ethnic conflict,
C:\Documents and Settings\tney\Desktop\Ugborodo oil spill.htm, visited June
17th.
Orisakwe Orish Ebere (1988): “Comparative study of Toxicity effect of Nigeria
Crude Oil, Gasoline and Kerosene on Mice”, M.Sc Thesis, Pharmacology
Department College of Medicine University of Lagos Idi-Araba, Lagos.
Orisakwe Orish Ebere et al (2004): Testicular toxicity of Nigerian Bonny light
crude oil in male Albino Rats. Reproductive Toxicology Elmsford Y.N.) 2004;
18 (3), 439-42
134

Snowden, J. L and Ekweozor I.K.E (1987): “The Impact of a minor Oil Spillage
in the estuarine Niger Delta. Marine Pollution Bulletin 18 (11); 595 -599.
Spooner, M.F. (1967): “Biological Effect of the Torrey Canyon Disaster” Journ.
Devon. Trust. Nat. Conserve. 1 (suppl.): p12 – 19. Pollution and Marine Life
Cambridge University Press, London.
UNDP, (1982): “International Environmental Standard for Transnational
Pollution regulations McGuire 1982”. Present theoretical analysis of the
movement of capital standards whxich can reduce transnational pollution,
.mpr.ub.uni-muenchen. 27694/1/wp02-96_ucsb.pdf
Wild, K.W. (1972): In Marine Pollution and Sea life, Fishing News (Books)
Ltd. Pollution and Marine Life, Cambridge University Press, London pp315-
318
135

APPENDIX 1
School of Post Graduate Studies
Dept. of Environmental Science,
College of Agriculture and
Environmental Sciences
University of South Africa (UNISA)
Dear Sir / Madam,
RESEARCH PROJECT QUESTIONNAIRE
Mr. Tosan S.N. Eyitsede, a postgraduate student of the Department of
Environmental Science, College of Agriculture and Environmental Sciences of
UNISA, is currently carrying out a research in Oil Pollution management and
environmental assessment in the Niger Delta, using Chevron Nigeria as a case study.
He will appreciate your positive response by supplying answers to the questionnaire
attached to this letter, considering your position as the Manager / Supervisor /
Technical Officer in the safety and environmental issues.
Be rest assured that all information given by you will be treated with high degree of
confidentiality.
Thanks for your cooperation
Yours faithfully,
Tosan S.N. Eyitsede
136

APPENDIX 11
This questionnaire is designed to solicit your contribution and assistance in order to
enhances the current research on Oil Pollution Management and Environmental
Assessment in the Niger Delta – A case study of Chevron Nigeria Limited.
Please be informed that all answers given in response to the questions asked will be
treated with utmost confidentially it deserves.
Section A
Please circle whichever is applicable;
1. Which of the following position do you belong to in organization;
( ) Manager Safety & Environment Department
( ) Supervisor Safety & Environment department
( ) Technician Safety & Environment Department
( ) Environmental Consultant
2.What is your Sex (i) Male ( ) (ii) Female ( )
3. You are of the age bracket; i. Up to 20yrs ( ) ii. Age between 21-30yrs ( )
iii. Age between 31 - 39yrs ( ) iv. Age 40yrs and above.
4. Are you married ? i. Yes ( ) ii. NO ( )
137

5. Your academic status is i. WASC ( ) ii. Diploma ( ) iii Degree ( )
iv. Others ( )
Section B.
Kindly tick which ever is applicable;
6. You have serve in your organization for a period of : i. Below 2yrs ( )
ii. Between 2-4yrs ( ) iii. Between 5-7yrs ( ) iv. Between 8-10yrs ( )
v. 10 yrs and above. ( )
7. What exactly is your job ? ----------------------------------------------------------
8. For how long have you been on your present job schedule? i. Below 2yrs ( )
ii. Between 3-5yrs ( ) iii. Between 6-8yrs ( ) iv. Between 9-11yrs ( )
v. 11 yrs and above. ( )
9. Have you undergone any form of training in Pollution Management since you join
your company? i. Yes ( ) ii. NO ( )
10. If yes what aspect of Pollution course did you attend?
i. Pollution Management and Spillage control ( )
ii. Toxicology studies and Management of Pollution ( )
iii. Spillage costing on Pollution control ( )
iv. Others, Specify; ---------------------------------------------------------------------------
-----
11. Have you attended courses overseas on Pollution Management? i. Yes ( ) ii NO
12 If yes , in which countries? ----------------------------------------------------------------------
138
13. Has your training in any way assisted you in your job? i. Yes ( ) ii. NO ( )
14. If yes, what aspect does the skill fit into in your job ? ---------------------------------------
----
15 Have you any field experience or practical experience in oil spill drill? i. Yes ( ) ii. NO
( )
16. If yes, in which field or location did this happen? -------------------------------------------
----
17. How long did this experience last ? i. 1-Day to 1-Week ( ) ii. 2-Weeks ( )
iii. 3-Weeks 1-Month ( ) iv. 2 Months and above ( )
18. Was there any damage to the vegetation or marine life ? i. Yes ( ) ii. NO ( )
19. If yes, was there any compensation paid to the affected communities? i.Yes ( ) ii.NO
( )
20. Good spillage management enhances clean environment. i. Yes ( ) ii. NO ( )
21. If no, what is your contrary view ? -------------------------------------------------------------
---
139
Section C
Please answer the following questions as briefly as possible:
22. Pollution management could be better handled with good policies. i. Yes ( ) ii. NO
( )
23. If no, please give reason:-------------------------------------------------------------------------
----
24. Good legislation can help both individuals and companies to manage pollution
effectively
i. Yes ( ) ii. NO ( )
25. If no, please give your opinion:-----------------------------------------------------------------
-----
26. People live longer in pollution free environment. What is your view? --------------------
----
27. The protection of the environment is a joint responsibility that should be left to the
Government alone, or what do you think ? --------------------------------------------------------
----
28. Are you aware of Government policy that tends to protect the environment? i. Yes ( )
ii. NO ( )
29. If yes, to what extent? ----------------------------------------------------------------------------
140

30. Are you aware of any contingency plans by your organization to tackle pollution
problems i. Yes ( ) ii. NO ( ).
31. If yes , what are those plans all about?---------------------------------------------------------
-----
32. In your own opinion how useful are those plans? --------------------------------------------
----
141