oil price shocks and nigeria’s …...oil price shocks and nigeria’s macro economy eme o. akpan1...
TRANSCRIPT
OIL PRICE SHOCKS AND NIGERIA’S MACRO ECONOMY
Eme O. Akpan1
Abstract
A steep upward trend in the price of crude oil in recent years, reaching a record nominal high in mid-2008, has led to increasing concern about its macroeconomic implications, both abroad and in Nigeria given that the Nigerian economy is highly vulnerable to oil price fluctuations. This paper analyses the dynamic relationship between oil price shocks and major macroeconomic variables in Nigeria by applying a VAR approach. The study points out the asymmetric effects of oil price shocks; for instance, positive as well as negative oil price shocks significantly increase inflation and also directly increases real national income through higher export earnings, though part of this gain is seen to be offset by losses from lower demand for exports generally due to the economic recession suffered by trading partners. The findings of the study show a strong positive relationship between positive oil price changes and real government expenditures. Unexpectedly, the result identifies a marginal impact of oil price fluctuations on industrial output growth. Furthermore, the "Dutch Disease" syndrome is observed through significant real effective exchange rate appreciation. Key words: macroeconomic fluctuations, oil price shocks, developing economies, Nigeria VAR modeling
1 Eme Akpan is a PhD student in the Department of Economics university of Ibadan, Nigeria.
1. Introduction
Oil prices have risen significantly over the last several years. Crude oil
prices have increased on average from US $25 per barrel in 2002 to US $55 per
barrel in 2005. An increase in petroleum prices tends to have a contractionary
impact on world demand and growth in the short term. Higher crude oil prices
raise inflation, with the magnitude depending in part on the extent of labor market
flexibility (wage-cost push inflation) and the ability of producers to pass on cost
increases to consumers. Over time, the impact of rising oil prices on activity and
inflation depends also on policy responses and supply side effects (IMF, 2005).
This steep upward trend in the price of crude oil in recent years, reaching
a record nominal high of US $147 in mid-2008 and a sharp drop to US $46 a
barrel, has led to increasing concern about its macroeconomic implications, both
abroad and in Nigeria. Nigeria is highly vulnerable to fluctuations in the
international oil market despite being the 6th largest producer of oil in the world.
This is given the fragile nature of the Nigerian macro economy and the heavy
dependence on crude oil proceeds.
Theoretically, an oil-price increase leads to a transfer of income from
importing to exporting countries through a shift in the terms of trade. The
magnitude of the direct effect of a given price increase depends on the share of
the cost of oil in national income, the degree of dependence on imported oil and
the ability of end-users to reduce their consumption and switch away from oil. It
also depends on the extent to which gas prices rise in response to an oil-price
increase, the gas-intensity of the economy and the impact of higher prices on
other forms of energy that compete with or, in the case of electricity, are
generated from oil and gas. Naturally, the bigger the oil-price increase and the
longer higher prices are sustained, the bigger the macroeconomic impact (Majidi,
2006).
It is generally argued that for net oil-exporting countries, a price increase
directly increases real national income through higher export earnings, though
part of this gain would be later offset by losses from lower demand for exports

3
generally due to the economic recession suffered by trading partners. Whereas
in net oil-importing countries, higher oil prices lead to inflation, increased input
costs, reduced non-oil demand and lower investment. Tax revenues fall and the
budget deficit increases, due to rigidities in government expenditure, which drives
interest rates up. Because of resistance to real declines in wages, an oil price
increase typically leads to upward pressure on nominal wage levels. Wage
pressures together with reduced demand tend to lead to higher unemployment,
at least in the short term. These effects are greater the more sudden and the
more pronounced the price increase and are magnified by the impact of higher
prices on consumer and business confidence (Wakeford, 2006, Majidi, 2006).
The present study is motivated by the fact that Nigeria relies heavily on
crude oil export revenues, representing about 90 per cent of total export earnings
and on average about 70 per cent of government revenues in annual budgets.2
Oil price shocks are predominantly defined with respect to price
fluctuations resulting from changes in either the demand or supply side of the
international oil market (Hamilton, 1983; Wakeford, 2006). These changes have
been traditionally traced to supply side disruptions such as OPEC supply quotas,
This has severe implications for the Nigerian economy given the current,
wide swings in oil prices in the international oil market. It is therefore vital to
analyse the effect of these fluctuations on the Nigerian macro economy and
possibly trace the channels of transmission of oil price shocks to the Nigerian
economy. Consequently, the specific objective of this study is to analyse the
impacts of oil price shocks on key macro economic variables in Nigeria and
measure the magnitude of such impacts. It draws implications for
macroeconomic policy, and the government’s vision 2020 agenda. The paper
adopts a Vector Autoregressive (VAR) Model and quarterly series from 1970-
2007 for the estimation.
2. Oil Price Shocks in Nigeria
2 In fact annual budgets are formulated in Nigeria based on oil prices. The 2009 budget was revised in line with the prevailing market price of oil indicative of huge dependence of Nigeria on oil proceeds.
4
political upheavals in the oil-rich Middle East and activities of militant groups in
the Niger Delta region of Nigeria. The shocks could be positive (a rise) or
negative (a fall)3
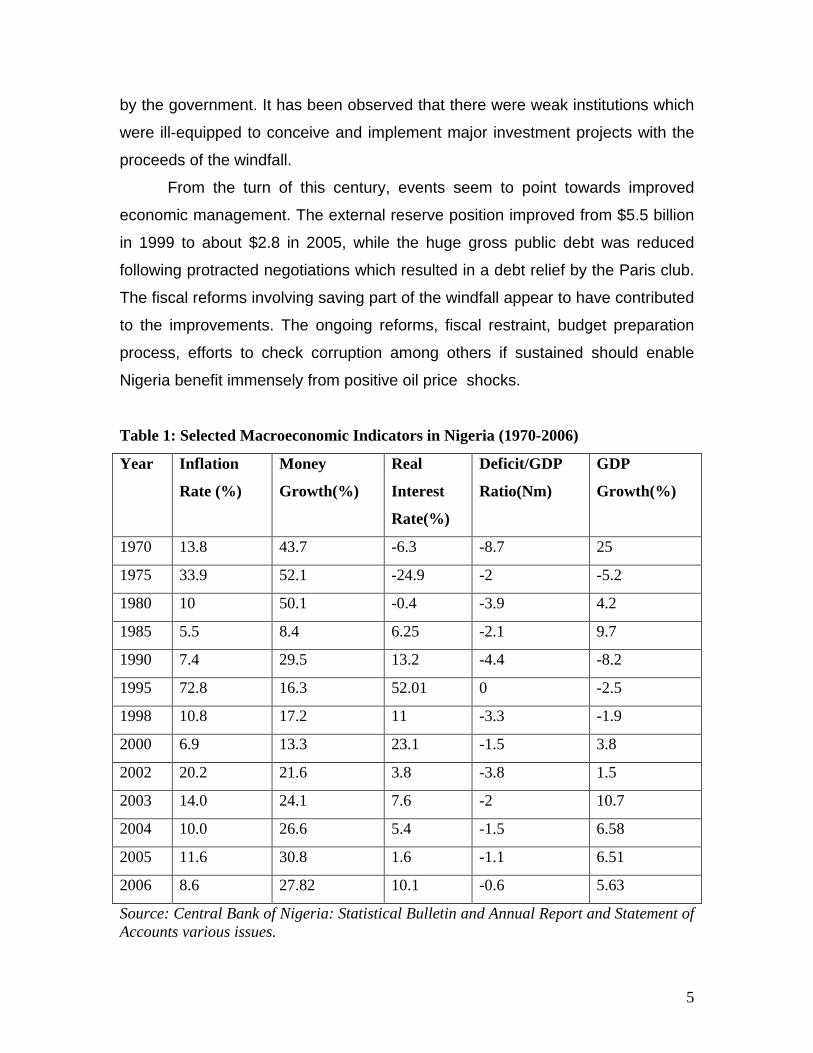
Despite this perceived benefit of oil price change, the macroeconomic
environment in Nigeria during the booms was undesirable. For instance inflation
was mostly double digit in the 1970s; money supply grew steeply, while huge
fiscal deficits were also recorded. Reported in Table 1 are selected
macroeconomic indicators in Nigeria. A plausible explanation for the dismal
performance of the indicators is the inefficient management of crude oil receipts
. Two issues are identified regarding the shocks; first is the
magnitude of the price increase which can be quantified in absolute terms or as
percentage changes, second is the timing of the shock, that is, the speed and
persistence of the price increase.
Going by the foregoing, four oil shocks can be observed in Nigeria. Each
of the shocks had connections with some movements in key macroeconomic
variables in Nigeria. For instance, the 1973-74, 1979-80, and 2003-2006 periods
were associated with price increases while the oil market collapse of 1986 is an
episode of price decrease. During the first oil shock in Nigeria (1973-74), the
value of Nigeria’s export measured in US dollars rose by about 600 per cent with
the terms of trade rising from 18.9 in 1982 to 65.3 by 1974. Government revenue
which stood at 8 per cent of GDP in 1972 rose to about 20 per cent in 1975. This
resulted in increased government expenditure owing largely from the need to
monetize the crude oil receipts. Investment was largely in favour of education,
public health, transport, and import substituting industries (Nnanna and Masha,
2003).
During the oil price shock of 2003-2006, Nigeria recorded increases in the
share of oil in GDP from about 80 per cent in 2003 to 82.6 per cent in 2005. The
shock was gradual and persisted for a while. This could be regarded as a
permanent shock. The result of the shock was a favourable investment climate,
increased national income within the period although a slight decline was
observed in the growth rate of the GDP.
3 This study is concerned primarily with positive oil price shocks.
5
by the government. It has been observed that there were weak institutions which
were ill-equipped to conceive and implement major investment projects with the
proceeds of the windfall.
From the turn of this century, events seem to point towards improved
economic management. The external reserve position improved from $5.5 billion
in 1999 to about $2.8 in 2005, while the huge gross public debt was reduced
following protracted negotiations which resulted in a debt relief by the Paris club.
The fiscal reforms involving saving part of the windfall appear to have contributed
to the improvements. The ongoing reforms, fiscal restraint, budget preparation
process, efforts to check corruption among others if sustained should enable
Nigeria benefit immensely from positive oil price shocks.
Table 1: Selected Macroeconomic Indicators in Nigeria (1970-2006)
Year Inflation
Rate (%)
Money
Growth(%)
Real
Interest
Rate(%)
Deficit/GDP
Ratio(Nm)
GDP
Growth(%)
1970 13.8 43.7 -6.3 -8.7 25
1975 33.9 52.1 -24.9 -2 -5.2
1980 10 50.1 -0.4 -3.9 4.2
1985 5.5 8.4 6.25 -2.1 9.7
1990 7.4 29.5 13.2 -4.4 -8.2
1995 72.8 16.3 52.01 0 -2.5
1998 10.8 17.2 11 -3.3 -1.9
2000 6.9 13.3 23.1 -1.5 3.8
2002 20.2 21.6 3.8 -3.8 1.5
2003 14.0 24.1 7.6 -2 10.7
2004 10.0 26.6 5.4 -1.5 6.58
2005 11.6 30.8 1.6 -1.1 6.51
2006 8.6 27.82 10.1 -0.6 5.63
Source: Central Bank of Nigeria: Statistical Bulletin and Annual Report and Statement of Accounts various issues.
6
3. Literature Review Over the past twenty years, dozens of scholars have explored the
relationships between oil price shocks and the macroeconomic performance of
national economies. Different methods of analysis have yielded different results,
sometimes sharply different, sometimes modestly.
The empirical literature on the macroeconomic impacts of oil supply
shocks evolved as the new state of the oil market revealed itself gradually after
1973. One of the initial beliefs following the 1973-74 price shock was that the
new, higher price of oil might be a permanent feature of a changed natural
resource regime. Accordingly, one recurrent theme was the aggregate
economy’s response to a sudden, permanent price shock. How would an
economy adjust to the new circumstances? This assumption underlies Rasche
and Tatom’s (1977, 1981) application of the potential GNP concept to the oil
price shock problem and continues as late as the work of Bruno and Sachs
(1982, 1985) on adjustment to supply shocks. Even Eastwood’s (1992)
investigation of the implicit substructure of some oil-macro simulation models
assumes a single, permanent price shock.
Another theme in the empirical macroeconomic studies of the oil price
shocks has been what could be called the attribution issue: to what extent was
recession caused by the oil price shocks, government policies, or other events?
Rasche and Tatom’s estimate of a 7% long-run reduction in real GNP due to the
1973-74 oil price increase appeared suspiciously high to a number of macro
economists who focused on the share of oil in GNP.4
Darby (1982) estimated the impact of the 1973-74 oil price shock on real
income in eight OECD countries. He was unsatisfied with the ability of the
available data to distinguish among three factors that may have contributed to
the recession: the oil price shocks; a largely independent course of monetary
policy fighting inflation in the wake of the 1973 collapse of the Bretton Woods
system; and a partly statistical partly real effect of the imposition and subsequent
elimination of price controls over the period 1971-75. Darby looked forward to the
4 See for example, Tobin, 1980, pp. 31-34.
7
availability of internationally comparable data which would permit similar
investigation of the 1979-80 oil price shock, but this line of research has not been
pursued consistently since the early 1980s.
James Hamilton’s (1983) study of the role of oil price shocks in United
States business cycles has had considerable influence on research on the
macroeconomics of oil price shocks. As Mork’s (1994) review paper outlines,
economists worked for nearly a decade on methods of incorporating oil price
shocks into macroeconomic models before a synergy developed between real
business cycle (RBC) models and oil price shocks. An oil price shock proved to be
a believable mechanism which yielded the unanticipated, temporary supply
shocks needed by the RBC models. The subsequent decline of the real oil price,
despite the two shocks of the 1970s, appeared to put a new light on the origins
and the probable future of oil price shocks. To the extent that the oil market had
undergone a permanent change in the fall of 1973, that change seemed to be
more one of moderately effective cartel power centered in a politically unstable
part of the world than one of a permanent shift into escalating scarcity of
minerals. Subsequent research on OPEC supply behavior (Griffin, 1985; Jones
1991; Dahl and Yücel, 1991; Wirl, 1990) and on the predictive capability of the
Hotelling exhaustible resource model in the oil market (Watkins 1992) has
reinforced this unfolding interpretation of the events of oil market events of the
1970s and 1980s. Hamilton (1983) shifted the macroeconomic analysis of oil
shocks from demand-side phenomena to the supply side, a movement which
Rasche and Tatom's supply oriented analyses had not entirely accomplished,
and relied on the statistical concept of Granger causality to test for directions of
effect in a business cycle setting of recurrent shocks.
In a more recent study, Wakeford (2006) assessed the impact of oil price
shocks on the South African macro economy. The study traced the history of oil
shocks and their impact on South Africa. The findings reveal that while
commodity exports-especially gold-provided an initial buffer, the economy was
not immune to sustained price shocks. The paper considered the outlook for
future oil shocks and their possible impact, given South Africa’s strengths and
8
vulnerabilities. The study concludes that while there are several short-run supply
risks, the major threat is the inevitable peaking of oil production which may occur
within 5 to 10 years. This, the study argues will result in recurrent oil shocks and
greater volatility and recommended governments’ accelerated action on the
shared growth initiative to cushion the effect of the shocks.
Similarly, Bartleet and Gounder (2007) examined oil price shocks and
economic growth in Venezuela using the Vector Autoregressive (VAR)
methodology based on quarterly data. Three oil price measures were considered,
following the various theoretical implications that oil price shocks have on
economic growth. The authors analysed the short-run impact of oil price shocks
in a multivariate framework which traced the direct economic impact of oil price
shocks on economic growth as well as indirect linkages. Furthermore, the models
employed the linear oil price and two leading nonlinear oil price transformations
to examine various short-run impacts. A Wald and Likelihood Ratio tests of
Granger Causality, was utilized and the results indicated that linear price change,
the asymmetric price increase and the net oil price variables were significant for
the system as a whole, whereas the asymmetric price variables was not.
Following the causality analysis of oil price nexus, the generalized impulse
responses and error variance decompositions the authors reaffirmed the direct
link between the net oil price shock and growth, as well as the indirect linkages.
They concluded that since oil consumption continued to increase in New
Zealand, there is a need for policy-makers to consider oil price shocks as a major
source of volatility for many variables in the economy.
The literature on the impact of oil price shocks on developing oil
producing/supplying countries is scant. The main focus of research has been on
net oil importers and developed countries. Some limited studies have been
conducted on the effects of oil price changes on the macro economy of
developing countries. In these studies, net oil exporters are the centre of focus.
Eltony and Al-Awadi (2001) in a study on Kuwait find that linear oil price
shocks are significant in explaining fluctuations in macro economic variables in
Kuwait. The results reveal the importance of oil price shocks in government
9
expenditures which are the major determinants of the level of economic activity in
Kuwait.
Raguindin and Reyes (2005) examined the effects of oil price shocks on
the Philippine economy over the period 1981 to 2003. Their impulse response
functions for the symmetric transformation of oil prices showed that an oil price
shock leads to a prolonged reduction in the real GDP of the Philippines.
Conversely, in their asymmetric VAR model, oil price decreases play a greater
role in each variable’s fluctuations than oil price increases.
In a related study, Anshasy et al. (2005) assessed the effects of oil price
shocks on Venezuela’s economic performance over a longer period (1950 to
2001). The study adopted a general to specific modeling VAR and VECM
technique to investigate the relationship between oil prices, governmental
revenues, government consumption spending, GDP and investment. The results
found two long-run relationships consistent with economic growth and fiscal
balance. Furthermore, they found that this relationship is important not only for
the long-run performance but also for short-term fluctuations.
Olomola (2006) investigated the impact of oil price shocks on aggregate
economic activity (output, inflation, the real exchange rate and money supply) in
Nigeria using quarterly data from 1970 to 2003. The findings revealed that
contrary to previous empirical findings, oil price shocks do not affect output and
inflation in Nigeria significantly. However, oil price shocks were found to
significantly influence the real exchange rate. The author argues that oil price
shocks may give rise to wealth effect that appreciates the real exchange rate and
may squeeze the tradable sector, giving rise to the “Dutch-Disease”. The present
study differs from Olomola (2006) by introducing more variables into the VAR
model such as government expenditure and real imports. This is considering the
fact that about oil proceeds account for about 90 per cent of total government
revenue in Nigeria. In addition, Nigeria is an import dependent country implying
that oil price shocks do have implications for imports and government
expenditure in Nigeria. It also uses industrial output as a measure of output as
against GDP.
10
From the foregoing, most of the empirical studies carried out have
focused on the oil importing economies, particularly the developed economies.
Few studies exist yet on the effect of oil price shock on key macroeconomic
variables for an oil exporting country as Nigeria. This study intends to fill this gap.
The paper, thus, overlaps with, and draws on relevant aspects of the foregoing
studies but defines its scope somewhat differently as earlier stated in the
objective of the study.
4. Data and Methodology
The study adopts quarterly observations for the period 1970 to 2007. This
period is chosen to capture the first and second oil boom periods of the 70s and
mid-2000s respectively. Data for the study are quarterly series and are obtained
from the IFS CD Rom 2007. Quarterly series are preferred as it increases the
data points and provides greater degrees of freedom. All variables except
inflation are in logarithmic terms. A proper definition of oil prices is a difficult task.
Here oil prices are used in real terms, taking the ratio of the average world
nominal oil price in US dollars to the US Consumer Price Index extracted from
IFS database. The definition of oil prices adopted for the study is symmetric oil
price growth rates as well as Mork’s asymmetric definition of oil price changes.
Other variables are defined as follows;
• Real industrial production (rgdpi) measures industrial value added per
capita. The variable is measured at 1990 constant prices and is obtained
from the central bank of Nigeria statement of accounts various issues.
• Real effective exchange rate (reex) is the nominal effective exchange rate
adjusted for inflation rate differentials with the US price index as the main
trading partner of Nigeria. The definition of real exchange rate is such that
an increase means a real appreciation of the naira. An appreciation is
meant to hurt the economy’s external competitiveness and vice versa for a
decrease. Data on (reex) is obtained from the IFS CD Rom database.
11
• Real Public Expenditure (rgex) is total government expenditure based on
1990 constant prices, adjusted for inflation.
• Real oil price (roilp) is the quarterly nominal average world oil prices
deflated by the US consumer price index. Data is obtained from the IFS
CD Rom.
• Inflation (inf) is defined as the annual changes in CPI of the Nigerian
economy obtained from the IFS CDRom.
5. Empirical Methodology To investigate the response of macroeconomic variables to asymmetric
and innovations in oil prices, an unrestricted Vector Autoregressive model (VAR)
is adopted. The VAR model provides a multivariate framework where changes in
a particular variable (oil price) are related to changes in its own lags and to
changes in other variables and the lags of those variables. The VAR treats all
variables as endogenous and does not impose a priori restrictions on structural
relationships. Since the VAR expresses the dependent variables in terms of
predetermined lagged variables, it is a reduced-form model. Once the VAR has
been estimated, the relative importance of a variable in generating variations in
its own value and in the value of other variables can be assessed (Forecast Error
Variance Decomposition (VDC)). VDC assesses the relative importance of oil
shocks in the volatility of other variables in the system. The dynamic response of
macroeconomic variables to innovations in a particular variable can also be
traced out using the simulated responses of the estimated VAR system (Impulse
Response Functions (IRF)). Thus, the IRF enables the determination of the
dynamic effects of oil price shocks on the Nigerian macro economy. The
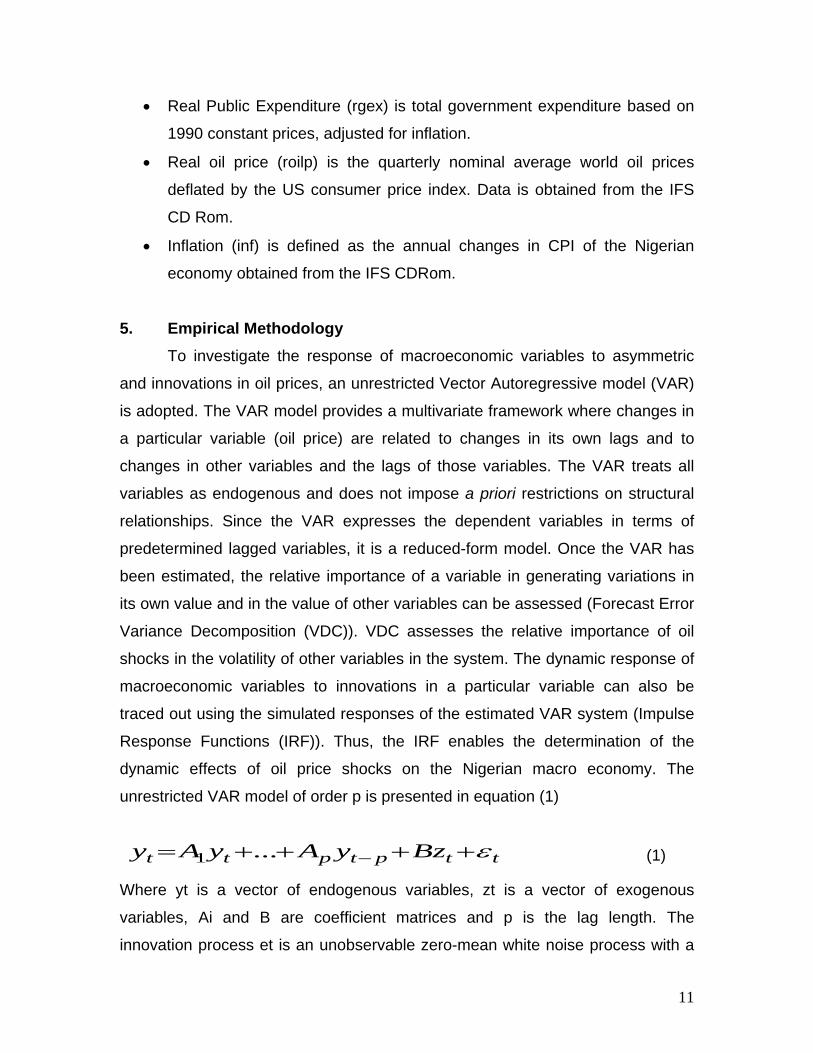
unrestricted VAR model of order p is presented in equation (1)
1 ...t t p t p t ty A y A y Bz ε−= + + + + (1)
Where yt is a vector of endogenous variables, zt is a vector of exogenous
variables, Ai and B are coefficient matrices and p is the lag length. The
innovation process et is an unobservable zero-mean white noise process with a

12
time invariant positive-definitive variance –covariance matrix. The VAR system
can be transformed into its moving average representation in order to analyse
the system’s response to real oil price shock, that is:
10
t i ti
y µ γ ε∞
−=
= ∑ (2)
Where 0γ is the identity matrix, µ is the mean of the process. The moving
average representation is used to obtain the forecast error variance
decomposition and impulse response function.
In the restricted VAR models, the vector of endogenous variables,
according to our first Cholesky ordering, consists of real oil price (roilp,), real
government expenditures (rgex), real industrial GDP per capita (rgdpi)., inflation
(inf), real effective exchange rate (reex), and real import (rimp):
[ ], , ,inf, ,ty roilp rgex rgdpi reex rimp= (3)
The innovations of current and past one-step ahead forecast errors are
orthogonalised using Cholesky decomposition so that the resulting covariance
matrix is diagonal. This assumes that the first variable in a pre-specified ordering
has an immediate impact on all variables in the system, excluding the first
variable and so on. In fact, pre-specified ordering of variables is important and
can change the dynamics of a VAR system. The vector of exogenous variables is
given by:
[ ]tan , 1, 2, 3, 4, 5tz cons t D D D D D= (3)
where D1-D5 refers to all other important exogenous variables during the period
1970-2006.
13
In the ordering of the variables, the real oil price changes are ranked as a
largely exogenous variable, especially for the case of the Nigerian economy.
Although Nigeria is one of the major suppliers of crude oil to the global markets,
its production and export quota are predetermined by the OPEC criteria,
domestic consumption and investment in oil fields. In addition, demand for crude
oil is largely determined by global economic growth, energy intensity within
industrialized economies, speculator operations in oil markets, the policy of key
oil consumers on strategic petroleum reserves, among others. Hence, oil prices
are regarded as exogenous for the Nigerian economy. It is expected that
significant shocks in oil markets affect contemporaneously the other key macro
economic variables in the system.
The second variable in the ordering is government expenditures.
Government expenditures can broadly be defined as recurrent and capital
consumptions. Recurrent expenditures include expenditures on government
employees, subsidies, etc, while capital expenditures aim to add rather than
maintain the physical and material assets of an economy. A pattern observed for
Nigeria since 1970 is the large growing wage bill, which reflects the trend and
magnitude of government spending. The role of government has also been on
the increase since 1970 reflected in the expansion in total government spending.
This is owing to the fact that the government is the main recipient of oil rents and
tries to distribute them through increase in salaries and subsidies which blow up
government spending. These implicit subsidies cover consumption of petroleum
products and long-term loans. Another measure of increased government
activities is the sustained budget deficit witnessed by the Nigerian economy for
about 30 out of the 38years under review. These rank government expenditure
as an exogenous variable in the first ordering.
Industrial production is also affected instantly by the level of government
demand. The industry production per capita as a proxy for real per capita income
feeds into changes in inflation. The positive development in oil prices, which
results in higher levels of government expenditures and income per capita,
pushes the effective demand upward. In addition, the limited capacity of domestic
14
supply and inefficiencies as well as time lags in response to increased demand
may push the general consumer prices upward, fuelling inflation.
The increase in inflation results in real effective exchange rate
appreciation. The real effective exchange rate measures the relative prices of
non-tradable goods to tradable goods and is a measure of the competitiveness of
an economy. The real effective exchange is defined as a weighted real exchange
rate index, with the weights assigned to trading partners of the local economy. If
domestic prices increase, while prices abroad remain unchanged, this would
increase the relative prices of non-tradable leading to a fall in the
competitiveness of an economy. In this study, we assume that a shock in real
effective exchange rate contemporaneously affects real imports in Nigeria. As
indicated earlier, any significant developments in exchange rate markets will
affect the competitiveness of Nigerian products in the international market as well
as foreign trade.
6. Empirical results
This section presents the empirical results of the analysis beginning with
the time series properties of the variables used for the estimation. This is meant
to ascertain the appropriateness of the specification and determine the
underlying properties of the data generating process. Following this, the empirical
results are presented.
6.1 Unit Root Results
The analysis is based on time series data. This therefore requires some
specific approaches to the analysis. It is generally known that the econometric
estimation of a model based on time series data demands that the series be
stationary as non-stationary series usually result in misleading inferences. Engle
and Granger (1987) provide a standard technique to deal with this problem. This
involves testing the variables of an equation for stationarity. The estimation
therefore begins by conducting stationarity test to ascertain the stationarity or
otherwise of the variables and the appropriateness of the specification for VAR
15
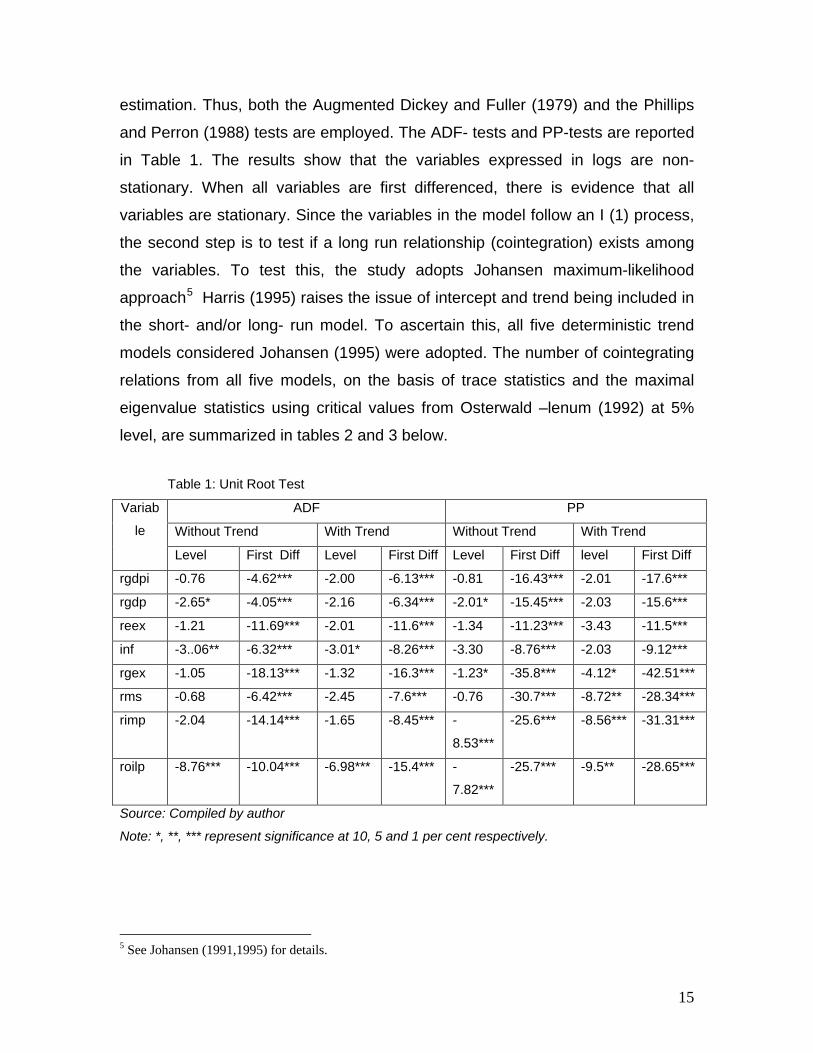
estimation. Thus, both the Augmented Dickey and Fuller (1979) and the Phillips
and Perron (1988) tests are employed. The ADF- tests and PP-tests are reported
in Table 1. The results show that the variables expressed in logs are non-
stationary. When all variables are first differenced, there is evidence that all
variables are stationary. Since the variables in the model follow an I (1) process,
the second step is to test if a long run relationship (cointegration) exists among
the variables. To test this, the study adopts Johansen maximum-likelihood
approach5
Table 1: Unit Root Test
Harris (1995) raises the issue of intercept and trend being included in
the short- and/or long- run model. To ascertain this, all five deterministic trend
models considered Johansen (1995) were adopted. The number of cointegrating
relations from all five models, on the basis of trace statistics and the maximal
eigenvalue statistics using critical values from Osterwald –lenum (1992) at 5%
level, are summarized in tables 2 and 3 below.
Variab
le
ADF PP
Without Trend With Trend Without Trend With Trend
Level First Diff Level First Diff Level First Diff level First Diff
rgdpi -0.76 -4.62*** -2.00 -6.13*** -0.81 -16.43*** -2.01 -17.6***
rgdp -2.65* -4.05*** -2.16 -6.34*** -2.01* -15.45*** -2.03 -15.6***
reex -1.21 -11.69*** -2.01 -11.6*** -1.34 -11.23*** -3.43 -11.5***
inf -3..06** -6.32*** -3.01* -8.26*** -3.30 -8.76*** -2.03 -9.12***
rgex -1.05 -18.13*** -1.32 -16.3*** -1.23* -35.8*** -4.12* -42.51***
rms -0.68 -6.42*** -2.45 -7.6*** -0.76 -30.7*** -8.72** -28.34***
rimp -2.04 -14.14*** -1.65 -8.45*** -
8.53***
-25.6*** -8.56*** -31.31***
roilp -8.76*** -10.04*** -6.98*** -15.4*** -
7.82***
-25.7*** -9.5** -28.65***
Source: Compiled by author
Note: *, **, *** represent significance at 10, 5 and 1 per cent respectively.
5 See Johansen (1991,1995) for details.
16
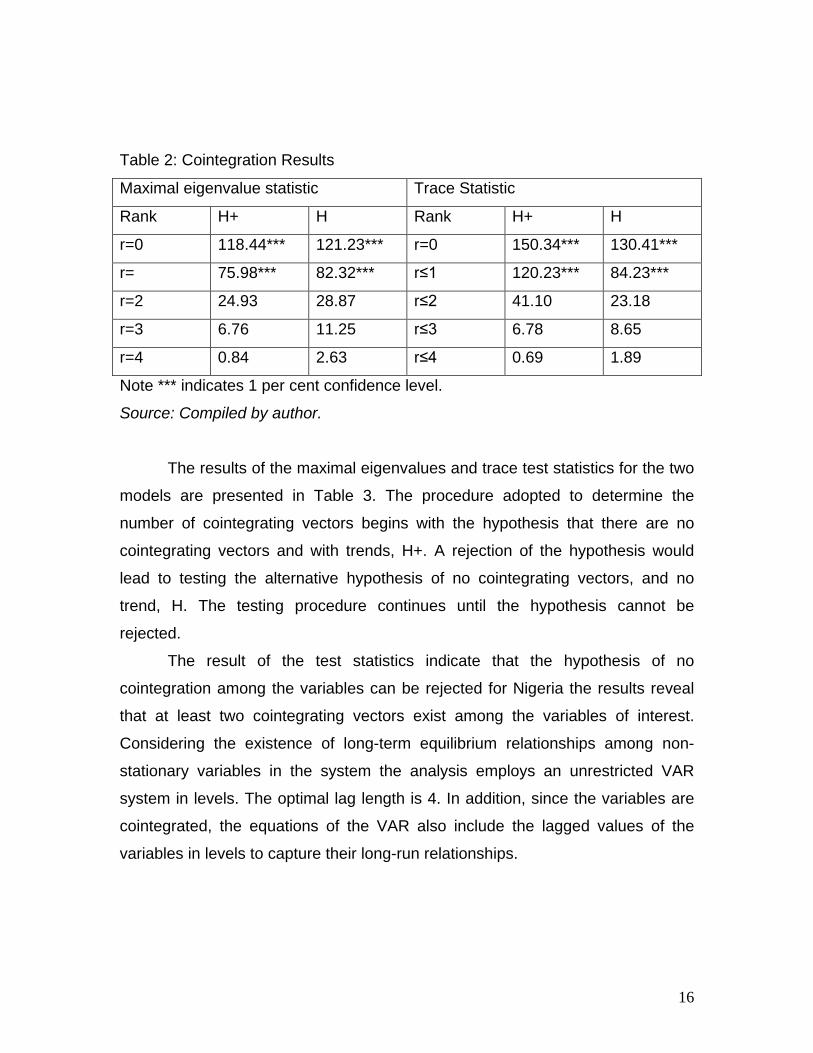
Table 2: Cointegration Results
Maximal eigenvalue statistic Trace Statistic
Rank H+ H Rank H+ H
r=0 118.44*** 121.23*** r=0 150.34*** 130.41***
r= 75.98*** 82.32*** r≤1 120.23*** 84.23***
r=2 24.93 28.87 r≤2 41.10 23.18
r=3 6.76 11.25 r≤3 6.78 8.65
r=4 0.84 2.63 r≤4 0.69 1.89
Note *** indicates 1 per cent confidence level.
Source: Compiled by author.
The results of the maximal eigenvalues and trace test statistics for the two
models are presented in Table 3. The procedure adopted to determine the
number of cointegrating vectors begins with the hypothesis that there are no
cointegrating vectors and with trends, H+. A rejection of the hypothesis would
lead to testing the alternative hypothesis of no cointegrating vectors, and no
trend, H. The testing procedure continues until the hypothesis cannot be
rejected.
The result of the test statistics indicate that the hypothesis of no
cointegration among the variables can be rejected for Nigeria the results reveal
that at least two cointegrating vectors exist among the variables of interest.
Considering the existence of long-term equilibrium relationships among non-
stationary variables in the system the analysis employs an unrestricted VAR
system in levels. The optimal lag length is 4. In addition, since the variables are
cointegrated, the equations of the VAR also include the lagged values of the
variables in levels to capture their long-run relationships.
17
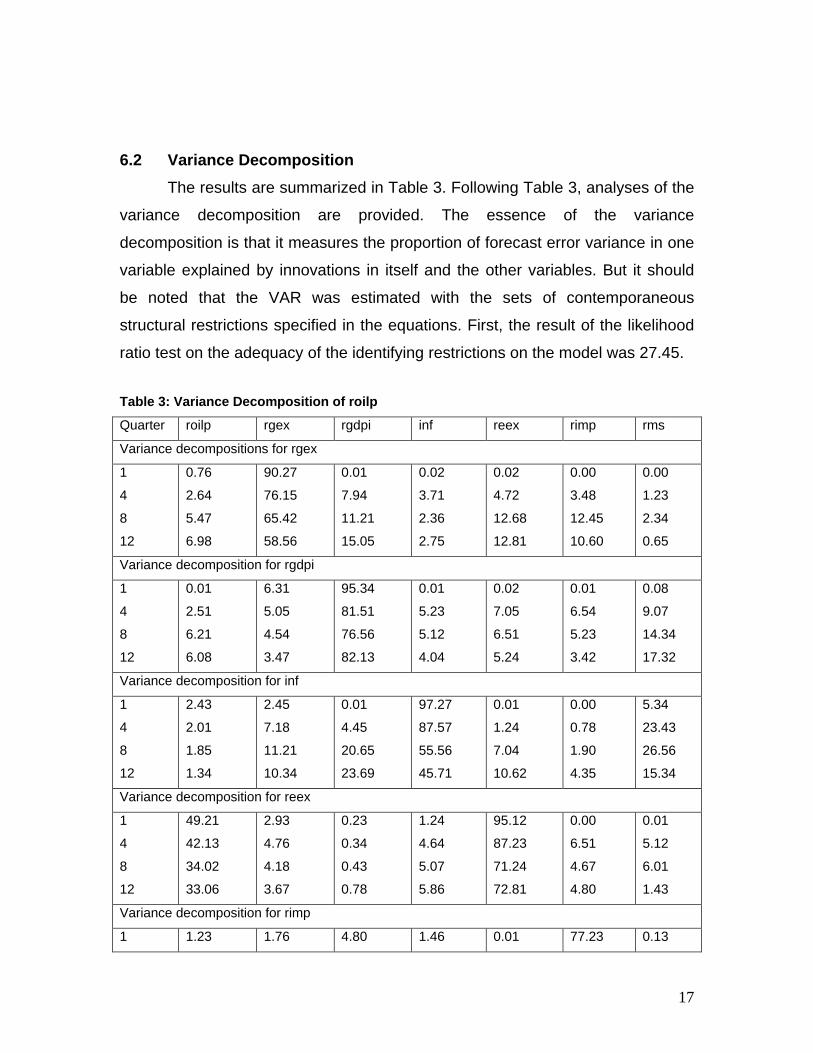
6.2 Variance Decomposition
The results are summarized in Table 3. Following Table 3, analyses of the
variance decomposition are provided. The essence of the variance
decomposition is that it measures the proportion of forecast error variance in one
variable explained by innovations in itself and the other variables. But it should
be noted that the VAR was estimated with the sets of contemporaneous
structural restrictions specified in the equations. First, the result of the likelihood
ratio test on the adequacy of the identifying restrictions on the model was 27.45. Table 3: Variance Decomposition of roilp
Quarter roilp rgex rgdpi inf reex rimp rms
Variance decompositions for rgex
1
4
8
12
0.76
2.64
5.47
6.98
90.27
76.15
65.42
58.56
0.01
7.94
11.21
15.05
0.02
3.71
2.36
2.75
0.02
4.72
12.68
12.81
0.00
3.48
12.45
10.60
0.00
1.23
2.34
0.65
Variance decomposition for rgdpi
1
4
8
12
0.01
2.51
6.21
6.08
6.31
5.05
4.54
3.47
95.34
81.51
76.56
82.13
0.01
5.23
5.12
4.04
0.02
7.05
6.51
5.24
0.01
6.54
5.23
3.42
0.08
9.07
14.34
17.32
Variance decomposition for inf
1
4
8
12
2.43
2.01
1.85
1.34
2.45
7.18
11.21
10.34
0.01
4.45
20.65
23.69
97.27
87.57
55.56
45.71
0.01
1.24
7.04
10.62
0.00
0.78
1.90
4.35
5.34
23.43
26.56
15.34
Variance decomposition for reex
1
4
8
12
49.21
42.13
34.02
33.06
2.93
4.76
4.18
3.67
0.23
0.34
0.43
0.78
1.24
4.64
5.07
5.86
95.12
87.23
71.24
72.81
0.00
6.51
4.67
4.80
0.01
5.12
6.01
1.43
Variance decomposition for rimp
1 1.23 1.76 4.80 1.46 0.01 77.23 0.13

18
4
8
12
9.87
9.78
10.46
3.23
3.78
3.98
3.23
2.34
2.35
8.23
13.24
14.23
8.67
13.23
15.34
65.32
54.87
46.23
1.23
1.34
2.43
Variance decomposition for rms
1
4
8
12
0.01
10.01
19.87
20.21
2.12
10.23
12.23
24.12
0.00
0.24
0.54
0.76
0.03
0.01
0.02
0.07
4.34
6.31
10.98
14.07
0.01
2.23
4.34
3.10
98.78
90.45
78.42
75.12
Source: compiled by author
• Government Expenditure
The variance decomposition shows that the response of real government
expenditure to a one standard deviation shock to positive oil price changes was
significantly different from zero. This result confirms the huge monetization of
crude oil receipts and subsequent increase in government expenditure as
explained earlier. However, with the introduction of an oil stabilization fund by the
central bank to save some part of oil windfalls, the picture may differ in future.
This result contradicts that of Farzanegan and Markwardt (2008) where positive
oil shocks accounted for an insignificant variation in government revenue.
• Real Imports Real import response to a shock in real oil prices is positive and lasts until
the end period. The increasing response of real import for the first quarters after
initial shock is significantly different from zero. The positive response of real
imports to positive shocks act as a built-in stabilizer, mitigating the inflationary
effects of increased money supply after positive oil price shocks. The long-run
decreasing trend, albeit not statistically significant, of CPI inflation may be due to
increased import volumes. In Nigeria, import volume has increased significantly
over the years.
• Real Exchange Rate The variance decomposition suggests that shocks to oil price as presented in
table 4 accounted for about 49 per cent of shocks to real exchange rate in the 1st

19
quarter declining in effects to about 34 per cent in the 8th quarter, and further to
about 33 per cent in the 12th quarter. Money supply shocks contributed about 5
per cent of the shocks to real exchange rate in the 4th quarter rising marginally to
about 6 per cent in the 12th quarter. The contribution of output shocks to the
shocks in the real exchange rate is not very significant. The result shows a less
than 1 per cent contribution over a twelve-month period. Shocks to inflation
contributed an average of 5 per cent to real exchange rate shocks over the 4th
quarter to the 12th quarter. This finding is consistent with Amano and Van
Norden, 1998 and Olomola, 2006). On the whole, a high oil price may have given
rise to wealth effects that appreciates the exchange rate. This squeezed the
tradable sector and resulted in the “Dutch-disease syndrome in Nigeria.
• Money Supply An interesting aspect of the result is that both oil price shocks and shocks
to the real exchange rates affected domestic money supply at long lags. This
supports earlier studies that monetary policy responds to oil price shocks with a
lag (Bernanke et al. 1997; Bohi, 1989). For instance, the result shows that in the
first quarter, oil price shocks did not contribute to the shocks in money supply
until the 4th, 8th and 12th quarters where oil shocks contributed about 10, 19 and
20 per cent respectively to variations in domestic money supply. On the other
hand, the effect of real exchange rate shock averaged about 4 per cent in the
first period, rising to about 6 per cent in the fourth quarter, 11 per cent in the 8th
quarter and 14 per cent in the 12th quarter. Real output shock accounted for
about 0.4 per cent over the entire 12 quarters. Similarly, the contribution of
inflation rate shocks to shocks in money supply was 0.03 per cent for the first
quarter, rising to a marginal figure of 0.7 per cent in the tenth quarter.
• Output The result of the study indicates that oil price shocks do not significantly
affect industrial output in Nigeria. This contradicts the expectations that oil price
shocks tend to lower GDP (Gordon, 1989); impacts significantly on industrial

20
output growth Farzanegan and Markwardt, 2008) and confirms the findings of
(Barsky and Kilian, 2004 and Olomola, 2006) and that oil price shocks had
marginal impact on output. Specifically, the empirical result indicates that money
supply accounted for the largest variations in output. For instance, about 0.08 per
cent of the shocks in the output in the first quarter were as a result of variations in
money supply. This rose to about 9 per cent in the fourth quarter, 14 per cent in
the eighth quarter and about 17 per cent in the twelfth quarter. The oil price
shocks contributed about 2.5 per cent to shocks in output in the fourth quarter,
and averaged about 6 per cent over the eighth and tenth quarters. For inflation
rate shocks, the contribution to output declined from about 5 per cent in the
fourth quarter through 5 per cent in the eighth quarter to about 4 per cent in the
twelfth quarter.
• Inflation The inflationary effects of oil price shocks on the Nigerian economy can be
explained through the AD-AS model. Increasing oil revenues contribute to higher
levels of government expenditure. Considering the dominant role of the
government in the domestic economy, which is beyond the budgetary
expenditures and includes great implicit expenditures (e.g various oil subsidies,
salaries and wage bills of government employees e.t.c), current and capital
expenditures of the government will rise as oil revenue rises. In addition, given
that net foreign reserves of the central bank increases, the money supply will
increase. The increased money supply and government expenditures will shift
the demand curve upward. Output changes accounts for the largest share of
shock inflation rate, while oil price shock explained relatively little. Output
changes contributed about 45 per cent to changes in commodity price level in the
first quarter, declining through 35 per cent in the tenth quarter. Real exchange
rate contributed about 10 per cent to changes in inflation rate in the first quarter,
rising through 15 per cent in the fourth quarter to about 20 per cent in the tenth
quarter. However, oil price explained only 0.3 per cent of changes in inflation rate
in the first quarter, rising to about 6 per cent in the eighth quarter and 10 per cent
21
in the tenth quarter. This finding confirms that oil price may not be necessarily
inflationary contrary to findings by Barsky and Kilian (2004) and Rotemberg and
Woodford (1996).
In the same vein, increasing oil prices and foreign exchange revenues
lead to higher volumes of imports. As the Nigerian industrial output is highly
dependent on imported raw materials and capital intermediaries, the volume of
domestic production will rise, shifting the supply curve to the right. However,
limited capacity of domestic industries and inefficiency of production technology
impede the rapid adjustment of supply section to increased demand. Thus, the
combination of movements of supply and demand curves will increase the level
of production and prices in the economy.
Another explanation for inflationary effects of positive oil price changes in
Nigeria is through the Dutch disease phenomenon and within the “spending
effects” as suggested by Corden (1984). The “spending effect” happens because
higher oil prices lead to higher wages or profits in the oil related sectors, thus
increasing aggregate effective purchasing power and demand in the economy.
While the price of the tradable sector (oil and manufacturing) is exogenously
determined in the international market, the price of the non-tradable sector which
includes services and the agricultural sector is determined within the domestic
market. A component of increased demand is shifted to the non-tradable sector,
causing demand-push inflation in these sectors. In this case, if the assumption is
that there is mobility between tradable and non-tradable sections. Therefore,
there will be movement of workers toward the booming oil and manufacturing
sectors leading to a neglect of the agricultural sector and subsequent decline in
output of the sector. This phenomenon is often described as the Dutch disease
syndrome.
7. Conclusion
The Nigerian economy is very vulnerable to oil price shocks. The real
effective exchange rate falls significantly (domestic currency depreciates) for the
entire period. This is worrisome and calls for concern by policy-makers. The

22
implication of this finding is that there is likelihood for potential currency crisis
after a shock occurs especially negative shock in the international oil market.
This depreciation increases the price of imports, and despite the traditional belief
that this should boost the non-oil sector; the findings from the study are different.
On the contrary, the result shows the opposite. For real output, which depends
heavily on imported raw material and intermediary, will face a down turn and may
be forced to downsize. Due to increased imports in the Nigerian economy,
inflationary pressures are inevitable and are pronounced. Government
expenditures fall at the onset but increase significantly by the fourth quarter
owing to the sticky nature of government expenditures in Nigeria.
On the whole, the picture paints an unstable future for the Nigerian
economy following oil price shocks. There is a strong need for policy makers to
focus on policy that will strengthen/stabilize the macroeconomic structure of the
Nigerian economy with specific focus on; alternative sources of government
revenue (reduction of dependence on oil proceeds), reduction in monetization of
crude oil receipts (fiscal discipline), aggressive saving of proceeds from oil
booms in future in order to withstand vicissitudes of oil shocks in future.

23
REFERENCES Anashasy, E.A., et al. (2005); “Evidence on the role of oil prices in Venezuela’s economic Performance: 1950-2001” Working Paper, University of Washington. Barsky, R. B., and L. Kilian. (2004): Oil and the Macro economy Since the 1970s. NBER Working Paper 10855. Retrieved from http://www.nber.org/papers /w10855 Bernanke, B. S., Gertler, M, and Watson, M. W. (1997): Systematic Monetary Policy and the Effects of Oil Price Shocks. Brookings Papers on Economic Activity, 1: 91-148 Bohi, Douglas R. (1991): Energy Price Shocks and Macroeconomic Performance. Washington, D.C.: Resources for the Future. Blanchard,O.J and J.Gali (2007): “The macroeconomic effects of Oil Price Shocks: Why are the 2000s different from the 1970s?, MIT department of Economics Working Paper No.07-21. Central Bank of Nigeria Statistical Bulletin various issues. Corden, M.W. (19840: Booming sector and Dutch disease Economics: Survey and Consolidation, Oxford Economic papers 36, 359-380. Dahl, C. A., and M. Yücel. (1991) "Testing Alternative Hypotheses of Oil Producer Behavior," Energy Journal 12(4): 117-138. Darby, M.R. (1982): “The price of Oil and World Inflation and Recessions”, American Economic Review 72, 738-751. Dickey, D.A. and Fuller W.A. (1979): “Distribution of the Estimators for Autoregressive Time series with a Unit Root”, Journal of the American Statistical Association 74, 427-431. Eastwood, R. K. (1992): "Macroeconomic Impacts of Energy Shocks," Oxford Economic Papers 44: 403-425. Eltony, M.N. and M.Al-Awadi (2001): “Oil price fluctuations and their impact on the macroeconomic variables of Kuwait: a case study using a VAR model”, International Journal of Energy Research 25 (11), 939-959. Farzanegan M. R and Markwardt G (2007): “The Effects of Oil price Shocks on the Iranian Economy”, Faculty of Business, Dresden University of Technology, D-01062, Dreden, Germany. Gordon, Robert J. (1984): “Supply Shocks and Monetary Policy Revisited”. American Economic Review. May, 74(2): 38-43.
24
Granger, C.W.J (1969): “Investigating Causal Relations by Econometric Models and Cross-Spectral Methods, Econometrica 37, 424-438. Griffin, J. M. (1985) "OPEC Behavior: A Test of Alternative Hypotheses," American Economic Review 75, pp. 954-963. Gounder, R and Bartleet M. (2007): “Oil Price Shocks and Economic Growth: Evidence for New Zealand, 1989-2006” Paper Presented at New Zealand Association of Economist Annual Conference, Christchurch, 27th to 29th June, 2007. Hamilton, J.D. (1983): “Oil and the Macro economy since World War 11, The Journal of Political Economy 91, 228-248. Harris, R.I.D. (1995): Using Cointegration Analysis in econometric Modeling, New York, Prentice-Hall. International Monetary Fund (IMF). 2006. International Financial Statistics. Washington, D.C.: IMF. Johansen, S. (1991): “Estimation and Hypothesis Testing of Cointegration Vectors in Gaussian Vector Autoregressive Models, Econometrica 59, 1551-1580. Johansen, S. (1995): Likelihood-based Inference in Cointegrated Vector Autoregressive Models, Oxford, Oxford University Press. Jones, C. T. (1991): "OPEC Behavior under Falling Prices: Implications for Cartel Stability," Energy Journal 11(3): 117-129. Majidi, M.(2006) “Impact of Oil on International economy” International Economics Course, Centre for Science and Innovation Studies. Mork (1994): “Business Cycles and the Oil Market”, The Energy Journal, 15 (Special Issue), The changing World petroleum Market, 39-67. Nnnanna, O.J and I. Masha (2003) “Oil price Fluctuation, macroeconomic behaviour and Policy Response in Nigeria: A VAR Specification”, West African Journal of Monetary and Economic Integration. Vol. 3, No. 1, pp. 85-113. Olomola, P.A. (2006) “Oil Price shock and aggregate Economic activity in Nigeria” African Economic and Business Review Vol.4No.2, fall 2006 Osterwald-lenum, m. (1992): “A Note with quantiles of the asymptotic Distribution of the maximum Likelihood Cointegration rank Test statistics”, Oxford Bulletin of Economics and Statistics 54,481-472. Phillips, P.C.B. and P.Perron (1988): Testing for a unit Root in Time Series regression, Biometrika 75, 335-346.

25
Raguindin, C.E. and R.G. Reyes (2005): “The effects of Oil price shocks on the Philippine economy: A VAR Approach”, Working paper, University of the Philippines School of Economics. Rasche, R., and Tatom, J. (1981). Energy Price Shocks, Aggregate Supply and Monetary Policy: The Theory and International Evidence”, in Brunner, K., and Meltzer, A. H. (eds). Supply Shocks, Incentives and National Wealth, Canergie-Rochester Conference series on Public Policy, 4: 9-93. Rotemberg, J.J. and M.Woodford (1996): Imperfect Competition and the Effects of energy prices, Journal of Money, Credit and Banking 28, 549-577. Tobin, J. (1980): "Stabilization Policy Ten Years After," Brookings Papers on Economic Activity 19-71. Van Wijenbergen (194): “Inflation, Employment, and the Dutch disease in Oil-exporting Countries: A short-run Disequilibrium Analysis, Quarterly Journal of Economis 99, 233-250. Wakeford J. (2006): “The impact of oil price Shocks on the South African Macroeconomy: History and Prospects”, in Accelerated and Shared Growth in South Africa: Determinants, constraints and opportunities. 18-20 October, 2006. Watkins, G. C. (1992): "The Hotelling Principle: Autobahn or Cul de Sac?" Energy Journal 3(1):1-24. Wirl, F. (1990) "Dynamic Demand and OPEC Pricing," Energy Economics 12: 174-177.