oil pt testing program paper
TRANSCRIPT

\
Proficiency Testing Program for Used Oil Analysis Laboratories
Alvia Gaskill, Jr. Environmental Reference Materials, Inc.
P.O. Box 12527 Research Triangle Park, N.C. 27709
Paper in the Proceedings of the EPA/A WMA 14* International Symposium on the Measurement of Toxic and Related Air
Pollutants, Research Triangle Park, North Carolina, September 12-14, 2000
Proficiency Testing Program for Used Oil Analysis Laboratories Alvia Gaskill, Jr. Environmental Reference Materials, Inc. P.O. Box 12527
Research Triangle Park, N.C. 27709
ABSTRACT Of the nearly one billion gallons of used lubricating oil produced annually in the U.S., nearly 60% is recycled as fuel burned for energy recovery. The facilities involved in the generation, processing and combustion are sometimes required by air quality and RCRA Part 279 permits to test the oil for compliance with federal and state standards for metals, sulfur, halogenated contaminants, PCBs, flash point and other substances and properties. End users, such as burners, may also require additional testing to meet commerce standards for water, viscosity and heating value. The lack of a comprehensive program to assess the performance of laboratories testing used oil to be burned as fiiel has limited the ability of regulators and industry to determine the quality of the test results and as a consequence, the degree of compliance with the regulations and commerce standards. The program described here provides all of the above stakeholders with an objective snapshot of used oil analysis performance. Participating laboratories, who include cement kilns, utilities, oil recyclers and commercial testing laboratories, receive two samples quarterly to be tested for ash content, BTU heating value, total halogens, flash point, pH, specific gravity, sulfur, viscosity, water, and metals. A separate sample is provided to be tested for PCBs. The samples consist of real used oils collected from generators and have included engine and hydraulic system oils from cars, trucks and heavy equipment as well as antifreeze. Participants are allowed to use any method they choose. The interlaboratory results are averaged and after removal of outliers, the Z-score calculated for each participant. The Z-score is the number of standard deviations of a laboratory's result from the mean of the overall data set and is internationally recognized as an appropriate way to compare resuhs for parameters without expected values, making it ideally suited for used oils. A Z-score greater than 2 is considered an indicator of analytical error. To date, nearly 50 U.S. and international laboratories have participated in the program. Results from the first six rounds are discussed. Performance appears unrelated to the method used, whether it is an EPA or ASTM method or is an in-house procedure, justifying the averaging of results across methods. Test results for bulk properties like BTU content, specific gravity and viscosity show better interlaboratory agreement than for minor and trace constituents like halogens, PCBs and metals. The accurate determination of arsenic at the federal limit of 5 ug/g was found to be problematic due to various
\
analytical problems. Quantification of arsenic at lower levels, such as the 1 ug/g limit set by the state of N.C, would be even more difficuh, because this limit is at or below the detection limit for many laboratories.
INTRODUCTION More than one billion gallons of used lubricating oil are produced annually in the U.S. Of this, nearly 60% is recycled as fiael burned for energy recovery. The facilities involved in the generation, processing and combustion are sometimes required by state air quality and RCRA Part 279 permits^ to test the oil for compliance with federal and state standards. Testing is often performed for total halogens, flash point, sulfur, PCBs and certain toxic metals (As, Cd, Cr, Pb, Sb, Ba, Be, Hg, Se, Ag, Tl). End users may also require additional testing for ash content, BTU heating value, pH, specific gravity, viscosity, water and metals (Al, B, Ca, Cu, Fe, Mg, Mn, Mo, Ni, P, Si, Na, Sn, Ti, V and Zn) to meet commerce standards for sale of used oil as fiiel or as feedstock in the manufacture of re-refined lubricants.
The lack of a comprehensive program to assess the performance of laboratories testing used oil to be burned as fiiel has limited the ability of regulators and industry to determine the quality of the test results and as a consequence, the degree of compliance with the regulations and commerce standards. Such a testing program would provide stakeholders with several key benefits. It would allow users and suppliers of oil analyses to monitor and determine the quality of test results. It would allow regulators to assess the likelihood of compliance with regulations for real-world oil shipments. Within the testing laboratories, it would facilitate corrective action measures, allow the laboratories to evaluate new methods, train new analysts and certify testing equipment as properly fiinctioning.
To meet these needs, we started a quarterly used oil proficiency testing program in 1998 with the overall goal of providing stakeholders with an objective snapshot of used oil analysis performance. The program is described here and results from the first six rounds are discussed.
PROGRAM DESIGN The program consists of four quarterly rounds of samples shipped to the laboratories. There are no restrictions on participation, but laboratories must pay an annual or quarterly fee in order to enroll. The sample sets consist of two samples of real used engine or other lubricating oil which can be tested for all parameters except PCBs. A separate sample is supplied for PCBs. Some sample characterization is performed by us prior to shipment to ensure the homogeneity of the batches. Some spiking is also performed to provide meaningfiil levels for certain parameters such as chlorine, water and metals which may not always be present at detectable levels. The reason for providing two samples rather than a single sample is that if a laboratory produces an unacceptable resuh for one sample, it may

\
be a random occurrence, while similar unacceptable performance on both samples is more likely due to a systemic problem within their facility. Participating laboratories can use any method they choose to perform the testing and they can perform any tests they choose to run. However, they are requested to report the method used with their results. A list of parameters to be evaluated in each round is provided along with a compilation of methods previously used to aid participants in identifying the method(s) they used. To date, nearly 100 different EPA^ and ASTM^ methods have been used.
Parameters evaluated are ash content, BTU heating value, total halogens (expressed as total chlorine), flash point, pH, specific gravity, sulfiir, viscosity, water, PCBs and the 27 metals mentioned before. If sufficient interest is shown, additional parameters are added in subsequent rounds.
The types of samples which have been distributed cover a wide range of used oils intended to approximate the materials being recycled. These have included engine oils fi-om gasoline burning vehicles (automobiles, motorcycles) and diesel burning equipment (bulldozers, backhoes, dump trucks, vacuum trucks, fleet delivery trucks); lubricating oils fi-om the hydraulic systems of construction equipment; cutting oil; heavy fiael oil; antifreeze and oily wastewater. Participants have included electric utilities; cement kins; used oil collectors, processors, and transporters; used oil re-refiners; used oil burners; lubricant producers; commercial testing laboratories and regulatory agencies.
EVALUATION CRITERIA Because there is such great diversity in the types of test methods used for individual parameters (e.g., 11 different methods have been used to determine sulfiir in this program), it is necessary to combine all results for a given parameter and average them, regardless of the test method used, in order to achieve a meaningfiil number of test results for statistical analysis. Also, because most of the parameters evaluated do not have expected values, the Z-score is used to compare resuhs across laboratories'*. The Z-score is the number of standard deviations of a laboratory's result from the mean of the overall data set:
Z score = (Lab result) - (Mean of all results) (Standard deviation of mean of all results)
Although the mean and the standard deviation can sometimes be obtained from other sources (test methods, results from selected or referee laboratories, etc.), due to the lack of such information for used oil test methods, the Z-score calculations for this program are based entirely on the data reported by the participants.

Results with Z-scores >6 are considered outliers and are not included in the final calculation of the mean and standard deviation for a parameter. For data sets containing more than 15 data points, a Z-score of 4 is used to exclude outliers. For normally distributed data, the way most proficiency testing data are assumed to be distributed, including the data in this program, a Z-score of greater than +2 or less than -2 may be indicative of analytical error, since this resuh is expected to occur in less than 5% of all resuhs reported. A result outside the ±2 Z-score window does not always mean it is erroneous, i.e., being different is not the same as wrong. However, when laboratories use EPA or ASTM methods, results that differ this much fi-om the mean of all results are suspect and should be investigated for error or a high detection limit. It is understood that organizations may have different criteria for acceptable data and these may affect the comparability of their resuhs with those fi-om other organizations. For example, a company required to meet the EPA limit for halogens in oil of 1000 ppm should be more concerned with a result that is three times the mean of that reported by other laboratories for a mean value of around 1000 ppm than a company operating under a permit that allows it to bum up to 5% halogens.
Because it is not possible to normalize laboratory results to reflect potentially differing decision thresholds, all Z-scores are calculated under the assumption that the laboratory's goal is to achieve a Z-score between 2 and -2 at the level tested. Efforts are made to identify those results for which factors other than analytical error cause the results to fall outside this range. All values reported as "<" a given value are treated in the statistical analyses as the number reported. For example, if a value is reported as "<500", the resuh "500" is used in the statistical analyses. Because most of these tests are performed to ensure that a given parameter does not exceed a specified threshold, this represents a reasonable conservative approach to treatment of the data.
REPORTING OF RESULTS Participants receive both an overall report summarizing the performance of all of the laboratories in a given round and a participant specific report summarizing their performance. Included in the participant specific report are Z-scores for each parameter and for each area (e.g., RCRA regulated metals, other toxic metals, overall metals, etc.) as well as a grand overall Z-score for all tests performed. Within each area, the individual Z-scores are averaged to obtain an average for the area, e.g., the overall Z-score for other toxic metals is calculated by averaging the Z-scores for all reported parameters in the other toxic metals area. The overall Z-score for all metals is calculated by averaging the Z-scores for all of the metals in all of the metals areas (RCRA regulated used oil, other toxic metals and other metals). In certain cases, summary Z-scores are shown both with and without extreme scores (e.g., a Z-score of 45 will distort the mean of a small data set) in order to give the end user of this report a clearer picture of laboratory performance.

\
One or two Z-scores >2 may not be indicative of routine performance, while such Z-scores across the board may signal a serious breakdown in performance requiring major corrective action. An excerpt from a participant specific report is shown in Table 1.
Table 1. Participant Specific Report for Lab 35 for Round 99-3 99-3a 99-3b 99-3d
Parameter Z-score Z-score Z-score ash content 0.3 -0.1 NA BTU heating value 0.4 -0.6 NA chlorine -1.0 -0.5 NA flash point -0.7 -0.8 NA PCBs NA NA -0.4 specific gravity 0.0 0.3 NA sulfiu- -0.2 0.2 NA viscosity NC NC NA water 0.6 -0.4 NA Overall for these 0.5 Overall for metals 0.5 Grand overall score 0.5 Overall Z-scores are based on the arithmetic mean of the absolute value of individual Z-scores. NC = not calculated NA = not applicable. A typical test report for resuhs from all laboratories in a round is shown in Table 2. In this example, 18 laboratories using 11 different test methods, achieved Z-scores <2 for used automobile engine oil spiked to produce a level of 12.2 ug/g chromium. The spiked level does not take into consideration the background level of chromium, which is typically 1-2 ug/g in such oils. Table 2. Test Report for All Laboratories for Chromium in Sample 99-lb-March 1999, ug/g Lab Result Z-score Method
1 <10 -0.7 SW-846 3051/7190 2 < 6.7 -1.2 SW-846 3051A/6010A 3 21.6 1.2 SW-846 3051/7190 5 26 1.9 SW-846 3051A/7190
11 13.5 -0.1 SW-846 3040A/6010B 16 12 -0.4 ICP Kerosene Dilution In-House 20 7.9 1.1 DCP In-House 24 8.1 -1.0 SW-846 3051/60lOA 25 7.0 -1.2 SW-846 3051/FAAS Cr method 26 19 0.8 Spectrographic In-House 28 13.6 -0.1 ASTM D6052 29 9.4 -0.8 ASTM D5185 30 12.1 -0.3 SW-846 3051A/GFAAS In-House 31 23 1.4 SW-846 3050/FAAS In-House 33 12.0 -0.4 SW-846 6010B 34 14.0 0.0 ASTM D5185 35 13.9 -0.1 SW-846 3040A/6010B 36 25 1.7 Spectrographic In-House Mean Standard deviation
14.2 6.2
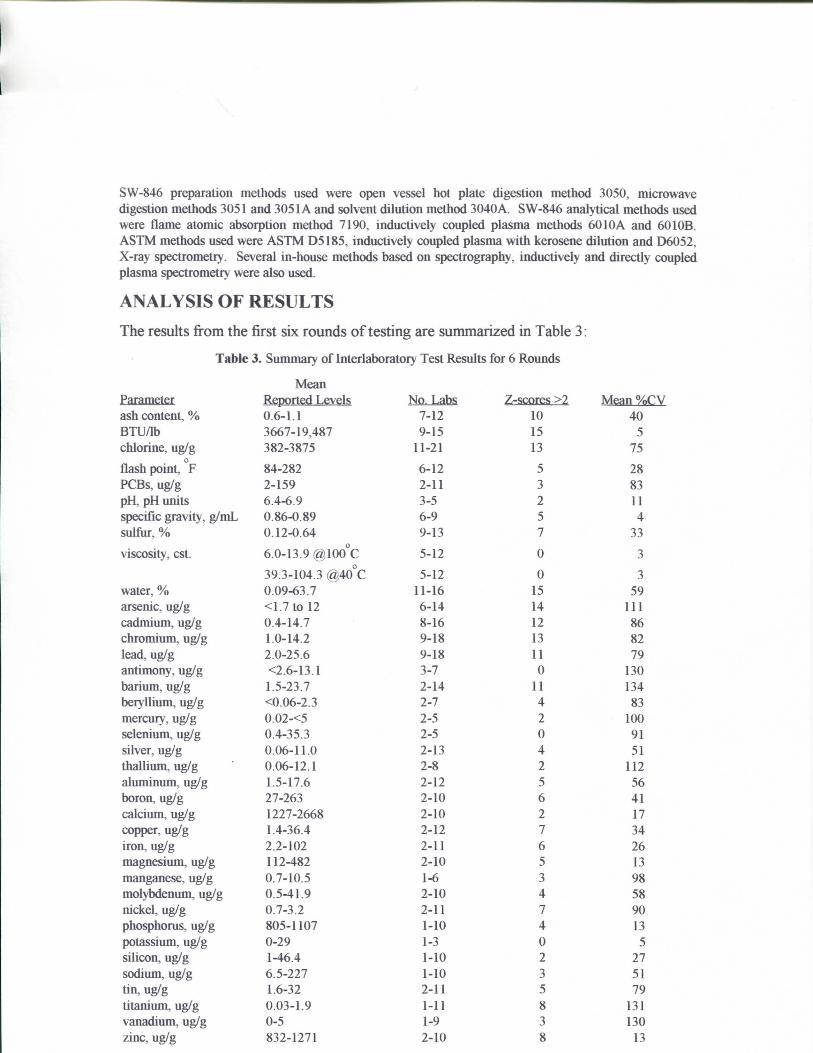
SW-846 preparation methods used were open vessel hot plate digestion method 3050, microwave digestion methods 3051 and 3051A and solvent dilution method 3040A. SW-846 analytical methods used were flame atomic absorption method 7190, inductively coupled plasma methods 6010A and 6010B. ASTM methods used were ASTM D5185, inductively coupled plasma with kerosene dilution and D6052, X-ray spectrometry. Several in-house methods based on spectrography, inductively and directly coupled plasma spectrometry were also used. ANALYSIS OF RESULTS The resuhs from the first six rounds of testing are summarized in Table 3 :
Table 3. Summary of Interlaboratory Test Results for 6 Rounds Mean
Parameter Reported Levels No, Labs. Z-scores >2 Mean %CV ash content, % 0.6-1.1 7-12 10 40 BTU/lb 3667-19,487 9-15 15 5 chlorine, ug/g 382-3875 11-21 13 75
0
flashpoint, F 84-282 6-12 5 28 PCBs, ug/g 2-159 2-11 3 83 pH, pH units 6.4-6.9 3-5 2 11 specific gravity, g/mL 0.86-0.89 6-9 5 4 suUur, % 0.12-0.64 9-13 7 33 viscosity, est. 6.0-13.9 @100°C 5-12 0 3
39.3-104.3 @40°C 5-12 0 3 water, % 0.09-63.7 11-16 15 59 arsenic, ug/g <I.7to 12 6-14 14 111 cadmium, ug/g 0.4-14.7 8-16 12 86 chromium, ug/g 1.0-14.2 9-18 13 82 lead, ug/g 2.0-25.6 9-18 11 79 antimony, ug/g <2.6-I3.1 3-7 0 130 barium, ug/g 1.5-23.7 2-14 11 134 beryllium, ug/g <0.06-2.3 2-7 4 83 mercury, ug/g 0.02-<5 2-5 2 100 selenium, ug/g 0.4-35.3 2-5 0 91 silver, ug/g 0.06-il.O 2-13 4 51 thallium, ug/g 0.06-12.1 2-8 2 112 aluminimi, ug/g 1.5-17.6 2-12 5 56 boron, ug/g 27-263 2-10 6 41 calcium, ug/g 1227-2668 2-10 2 17 copper, ug/g 1.4-36.4 2-12 7 34 iron, ug/g 2.2-102 2-11 6 26 magnesium, ug/g 112-482 2-10 5 13 manganese, ug/g 0.7-10.5 1-6 3 98 molybdenmn, ug/g 0.5-41.9 2-10 4 58 nickel, ug/g 0.7-3.2 2-11 7 90 phosphorus, ug/g 805-1107 1-10 4 13 potassium, ug/g 0-29 1-3 0 5 silicon, ug/g 1-46.4 1-10 2 27 sodiimi, ug/g 6.5-227 1-10 3 51 tin, ug/g 1.6-32 2-11 5 79 titanium, ug/g 0.03-1.9 1-11 8 131 vanadium, ug/g 0-5 1-9 3 130 zinc, ug/g 832-1271 2-10 8 13

\
Results for all parameters based on 6 rounds and 12 samples except for PCBs (5 rounds, 6 samples), specific gravity, viscosity, potassium (4 rounds, 8 samples), pH, selenium, boron (5 rounds, 10 samples). Reported levels are the mean of all results with outliers removed. Z-scores represent total number of laboratory results >2 for all rounds. %CV = coefficient of variation, standard deviation/mean x 100%.
The resuhs show that the interlaboratory precision of test parameters, expressed as the %CV, falls into four distinct ranges (Table 4), with the precision for bulk properties like BTU, specific gravity and viscosity and for metals at relatively high concentrations Hke calcium, magnesium and zinc, much better than for trace contaminants Uke water and most of the other metals as would be expected.
Table 4. Precision of Test Parameters Parameters
BTU, specific gravity, viscosity, potassium pH, calcium, magnesium, phosphorus, zinc ash content, flash point, sulfijr, boron, copper, iron, sihcon chlorine, PCBs, water, arsenic, cadmium, chromium, lead, antimony, barium, beryllium, mercury, selenium, silver, thallium, aluminum, manganese, molybdenum, nickel, sodium, tin, titanium and vanadium
An average of one Z-score >2 was identified per analyte per round. Although many have no obvious explanation, those which do, provide usefijl information about method performance. These are summarized in Table 5:
Table 5. Explanations for Z-scores >2
Ash content: incomplete drying of ash before final weighing; use of incorrect method that measures sediment only; reporting of percent combusted instead (1-ash content)
BTU: failure to ignite high water content materials; recording and math errors
Chlorine: use of test that only measures organic chlorine, but reported as total chlorine, thus missing inorganic chloride
Flash point: differing thresholds, e.g., >100°F, >140°F, >230°F
PCBs: lack of experience in performing test Water: incomplete Karl Fischer titration; use of centrifiigation which fails to detect emulsified water
Range 0-10% 10-25% 25-50% >50%
\
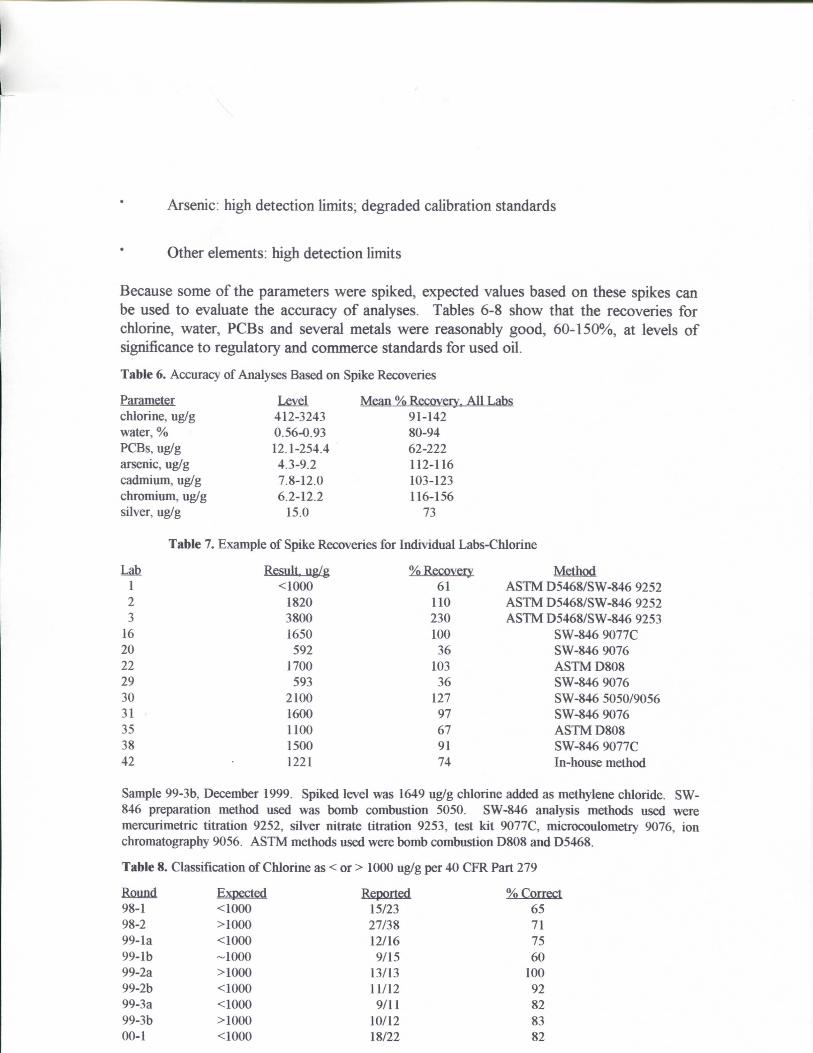
Arsenic; high detection hmits; degraded cahbration standards
Other elements: high detection limits Because some of the parameters were spiked, expected values based on these spikes can be used to evaluate the accuracy of analyses. Tables 6-8 show that the recoveries for chlorine, water, PCBs and several metals were reasonably good, 60-150%, at levels of significance to regulatory and commerce standards for used oil. Table 6. Accuracy of Analyses Based on Spike Recoveries Parameter Level Mean % Recoverv. All Labs chlorine, ug/g 412-3243 91-142 water, % 0.56-0.93 80-94 PCBs, ug/g 12.1-254.4 62-222 arsenic, ug/g 4.3-9.2 112-116 cadmium, ug/g 7.8-12.0 103-123 chromium, ug/g 6.2-12.2 116-156 silver, ug/g 15.0 73
Table 7. Example of Spike Recoveries for Individual Labs-Chlorine Lab Result, ug/g % Recovery Method
1 <1000 61 ASTM D5468/SW-846 9252 2 1820 110 ASTM D5468/SW-846 9252 3 3800 230 ASTM D5468/SW-846 9253
16 1650 100 SW-846 9077C 20 592 36 SW-846 9076 22 1700 103 ASTM D808 29 593 36 SW-846 9076 30 2100 127 SW-846 5050/9056 31 1600 97 SW-846 9076 35 1100 67 ASTM D808 38 1500 91 SW-846 9077C 42 1221 74 In-house method Sample 99-3b, December 1999. Spiked level was 1649 ug/g chlorine added as methylene chloride. SW-846 preparation method used was bomb combustion 5050. SW-846 analysis methods used were mercurimetric titration 9252, silver nitrate titration 9253, test kit 9077C, microcoulometry 9076, ion chromatography 9056. ASTM methods used were bomb combustion D808 and D5468. Table 8. Classification of Chlorine as < or > 1000 ug/g per 40 CFR Part 279 Round Expected Reported % Correct 98-1 <I000 15/23 65 98-2 >1000 27/38 71 99-la <1000 12/16 75 99-lb -1000 9/15 60 99-2a >1000 13/13 100 99-2b <1000 11/12 92 99-3a <1000 9/11 82 99-3b >1000 10/12 83 00-1 <1000 18/22 82
\ \
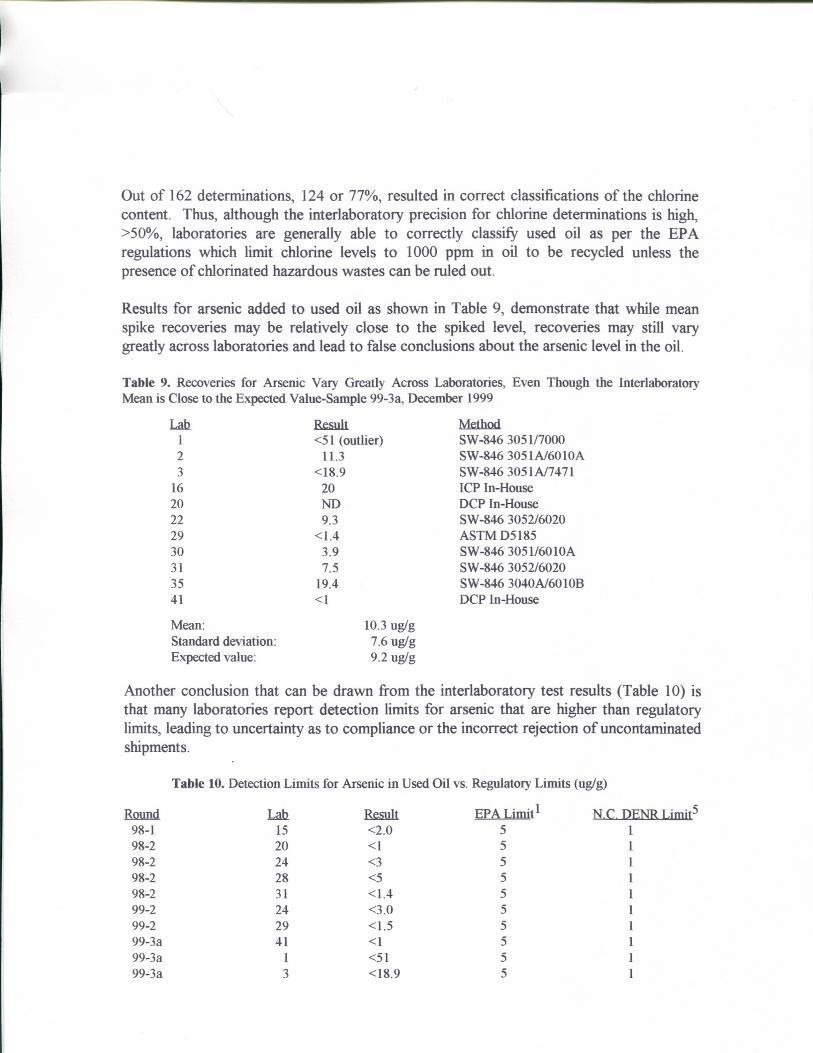
Out of 162 determinations, 124 or 77%, resulted in correct classifications of the chlorine content. Thus, ahhough the interlaboratory precision for chlorine determinations is high, >50%, laboratories are generally able to correctly classify used oil as per the EPA regulations which limit chlorine levels to 1000 ppm in oil to be recycled unless the presence of chlorinated hazardous wastes can be ruled out. Resuhs for arsenic added to used oil as shown in Table 9, demonstrate that while mean spike recoveries may be relatively close to the spiked level, recoveries may still vary greatly across laboratories and lead to false conclusions about the arsenic level in the oil. Table 9. Recoveries for Arsenic Vary Greatly Across Laboratories, Even Though the Interlaboratory Mean is Close to the Expected Value-Sample 99-3a, December 1999
Lah Result Method 1 <51 (outlier) SW-846 3051/7000 2 11.3 SW-846 3051A/6010A 3 <18.9 SW-846 3051 A/7471
16 20 ICP In-House 20 ND DCP In-House 22 9.3 SW-846 3052/6020 29 <1.4 ASTM D5185 30 3.9 SW-846 3051/6010A 31 7.5 SW-846 3052/6020 35 19.4 SW-846 3040A/60 lOB 41 <1 DCP In-House Mean: 10.3 ug/g Standard deviation: 7.6 ug/g Expected value: 9.2 ug/g
Another conclusion that can be drawn from the interlaboratory test resuhs (Table 10) is that many laboratories report detection limits for arsenic that are higher than regulatory hmits, leading to uncertainty as to compliance or the incorrect rejection of uncontaminated shipments.
Table 10. Detection Limits for Arsenic in Used Oil vs. Regulatory Limits (ug/g) Round
98-1 98-2 98-2 98-2 98- 2 99- 2 99-2 99-3a 99-3a 99-3a
Lab 15 20 24 28 31 24 29 41
1 3
Result <2.0 <1 <3 <5 <1.4 <3.0 <1.5 <1 <51 <18.9
EPA Limit 1 N.C.PENRLitnit^ 5 5 5 5 5 5 5 5 5 5

COMMENTS ABOUT SPECIFIC PARAMETERS Ash content; Much of the variabiUty observed is Hkely due to sample inhomogeneity. The mean CV for all samples was 40%, but for a virgin oil sample, only 4%.
BTU; Since most used oils and hydrocarbon fiaels have BTU contents of 19,000-20,000 BTU/lb, any resuhs outside this range should be investigated for analytical error or the presence of non hydrocarbon contaminants like water, antifreeze and alcohols.
Chlorine; High results (2-3X expected) reported by several labs using bomb combustion/colorimetric titration suggest some labs will have problems with these methods. Analyses using field test kits and microcoulometry consistently produced the most accurate resuhs.
Flash point; Since this is most often performed to determine if a threshold temperature is exceeded, few laboratories report actual flash points. As a resuh of this and the differing thresholds used, comparison of resuhs is difficuh.
Metals, PCBs; Some labs still report resuhs such as 0 or ND, which are often inadequate for decision making.
Metals; Resuhs for most of the toxic metals were reported at detection limit levels, since few of these were spiked and these elements are not typically found in used oil. As a resuh, there is Hmited information about the accuracy and precision of these determinations to be discerned from the study resuhs.
CONCLUSIONS
Test resuhs for certain parameters; viscosity, specific gravity, pH, and BTU content are generally quite rehable and consistent across labs, because these parameters are bulk properties of used oil, less affected by sample variability than trace constituents and because the test methods are also relatively foolproof The exception is flash point, which, ahhough a reliable test, produces resuhs which are often threshold specific.
The accuracy and interlaboratory precision of resuhs for metals seem to correlate well with their concentration. The best CV's were observed at levels >10 ug/g, while below this level, the agreement was generally much worse. Because many EPA and state regulations set permitted levels below 10 ug/g for arsenic.

cadmium, chromium and other elements, the accuracy of test results for these parameters at the permitted levels should be estabUshed within each laboratory performing such testing.
Method performance appears to be unrelated to the method used, regardless of whether h is an EPA or ASTM method. Thus, the averaging of resuhs across methods is justified.
A used oil proficiency testing program such as this one, can provide much usefiil information about laboratory performance, but should not be considered a substitute for an in-house quality control program.
REFERENCES 1. Code of Federal Regulations (40 CFR), Part 279, Standards for the Management
of Used Oil, published by the Federal Register. 2. U.S. EPA, Test Methods for Evaluating Solid Waste, Physical/Chemical Methods,
(SW-846), Third Edition, November 1986, Office of Solid Waste, Superintendent of Documents, U.S. Government Printing Office, Washington, D.C. 20402
3. ASTM Annual Book of Standards, Vols. 05.01 to 05.04, Petroleum Products, Lubricants and Fossil Fuels, 2000, American Society for Testing and Materials, West Conshohocken, PA.
4. Thompson, M. and Wood, R., International Harmonized Protocol for Proficiency Testing of (Chemical) Analytical Laboratories, Journal of AO AC International, 1993, 76, No. 4, 1993, 926-940.
5. Dr. Arun Shendrikar, N.C. Department of the Envirormient and Natural Resources (DENR), personal communication, 2000.