oil security and collaboration in northeast asia - keei security and collaboration in northeast asia...
TRANSCRIPT

Oil Security and Collaboration in Northeast Asia
Seoul, Korea, 16-17 March, 2004
Norio EHARAHead of Non-Member Countries Division
Asia/Pacific and Latin American Countries International Energy Agency (IEA)
Content
Challenges for Northeast Asia Oil Security
Ways towards Regional Oil Collaboration and IEA’s Role

1. China factor
2. Supply security
3. Diversification
Challenges for Northeast Asia Oil Security

1. China Factor : Oil Demand in Asia
0
100
200
300
400
500
600
700
1971 2000 2010 2020 2030
China
East Asia
Jap/Aus/NZ
India
Russia
Korea
Mtoe China exceeded Japan and is the 2nd largest oil consumer in the worldThe rate of demand increase is one of the highest in the world: 3% Volatile to the oil disruption and price hikes => concern of the world

China Factor: Impact in NE Asia
0
200
400
600
800
1000
1200
1400
1600
1971 2000 2010 2020 2030
OECD NA
OECD Eur
China
East Asia
Jap/Aus/NZ
India
Russia
Korea
NE Asia
Mtoe Of the top 10 oil consumers, 4 are Northeast Asian EconomiesNE Asia will consume 20% of the world oil in 2030

Growing gap between Oil demand and Production in China
0
2
4
6
8
10
12
14
1980 1990 2000 2010 2020 2030
Production Consumption
Mb/d

China’s Impact on Global Primary Energy Demand, 2000-2030
20
49
16 6
30
8
29 41
50 55 5343
0%10%20%30%40%50%60%70%80%90%
100%
TPES Coal Oil Gas
China OECD Non-OECD (excl.China)

2. Supply Security Increasing Oil Import Dependency
0
10
20
30
40
50
60
70
80
90
100
OECDPacific
OECDEurope
OECDN.America
South Asia China East Asia
net i
mpo
rts a
s pe
r cen
t of o
il su
pply
2000 2010 2030
34%
60%
82%
72%
85%
95%
31%
52
71%
36%40%
53%52%
66%
85%94%
90%
95%

Disruptions of Major Crisis
Growing Oil Import Dependence on MEVulnerability to price volatility and supply disruption

Oil demand growth will come from transport sector
0
50
100
150
200
Transp. Electricity Industry Res&Comm
Japan/Aus/NZ
020406080
100120
Transp. Electricity Industry Res&Comm
Russia
0
50
100
150
200
250
300
Transp. Electricity Industry Res&Comm
China0
20
40
60
80
Transp. Electricity Industry Res&Comm
Republic of Korea
Mtoe

Strong Concern on Oil Security in China and India
Total World Oil Stocks: 6.0 billion barrels**Excludes ex-USSR, China and South African strategic stocks.
OECD Commercial
45%OECD
Strategic 21%
Non-OECD Commercial
18%
At sea/In transit16%
China and India : 5 + 5 million tons
= 10 million tons = 6% of OECD Strategic
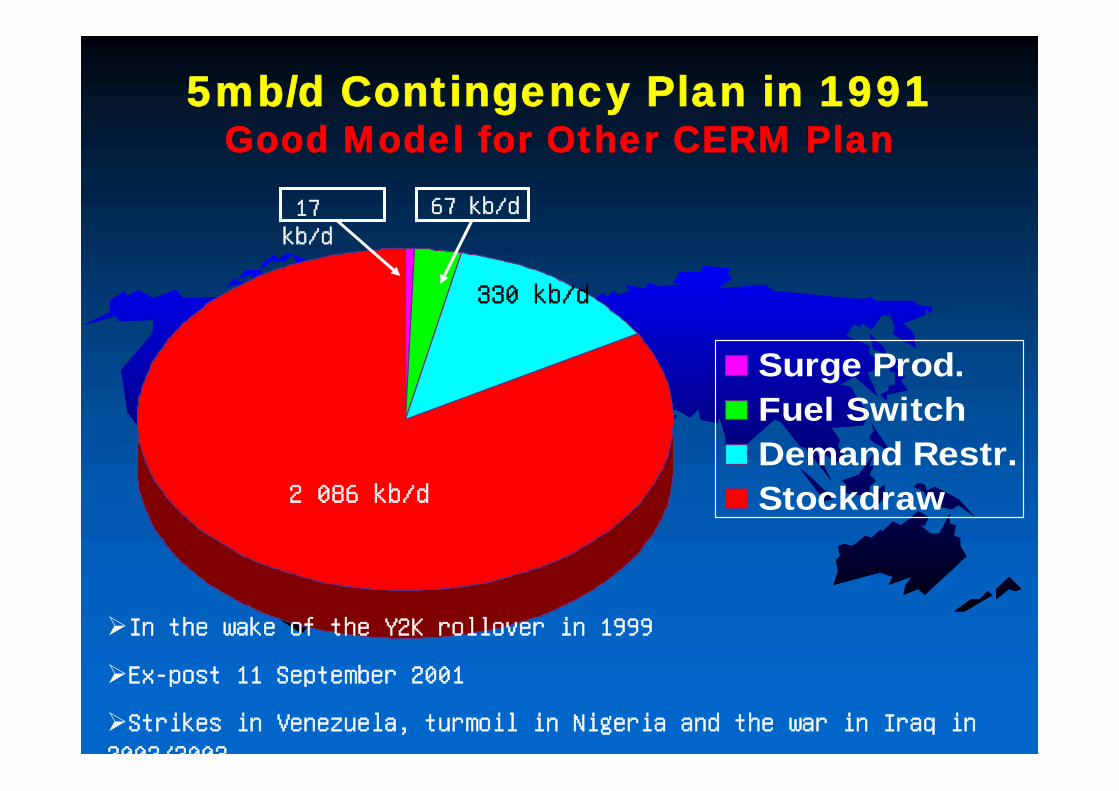
5mb/d Contingency Plan in 1991Good Model for Other CERM Plan
Surge Prod.Fuel SwitchDemand Restr.Stockdraw
67 kb/d
330 kb/d
2 086 kb/d
17 kb/d
In the wake of the Y2K rollover in 1999
Ex-post 11 September 2001
Strikes in Venezuela, turmoil in Nigeria and the war in Iraq in 2002/2003

3. Diversification: Regional Mismatch Growing international and inter-regional trade in energy
•International oil trade grows considerably as the gap widens between P&Cs•Inter-regional trade will rise from 32m/bd (43%) in 2000 to 66 mb/d (55%) in 2030. •Asia: from 4.9 mb/d in 2000 to 24 mb/d in 2030. (China: 1.7m/bd-10 mb/d). •The Middle East strengthens its position as the world oil exporter.

0
200
400
600
800
1000
1200
China Russia Japan Korea DPRK Mongolia
Coal Oil Gas Nuclear Hydro Renewables
Different TPES in NE AsiaMtoe
20%
49%
52%5% 19%21%
Diversity of energy supplyRegional mismatch = potential co-operation
- Infrastructure investment- Market reform and transparency- Need of good business models with Russia: Lessons of other regions

TPES Projection in NE Asia
0
100
200
300
400
Oil Gas Coal Nuclear Other
Japan/Aus/NZ
0100200300400500600
Oil Gas Coal Nuclear Other
Russia
0
200
400
600
800
1000
1200
1400
Oil Gas Coal Neclear Other
China
0
50
100
150
200
Oil Gas Coal Nuclear Other
Republic of Korea
Mtoe
More diversified in Japan and Korea, more rely on domestic resources in China and Russia
2000 2030

Energy Supply Potential from East Russia
♦ Energy Production in Siberia and the Far East
80-11067-8952-6342-4932Far East
154-202
124-174
105-13387-9678Eastern
Siberia
927-1023
940-1017
963-1033
1019-1064998Western
SiberiaPrimary Energy
Production
(Mt)
20202015201020001999
♦Energy Resources in East Russia
- Oil (Potential): 14 billion tonnes in East Siberia and the Far East- Hydro and Tidal generation capacity: 17.2 GW- Natural Gas (proven): 5.4 tcm (12% of total Russian reserves)

Russian Oil Production OutlookRussian Oil Production Outlook
0
100
200
300
400
500
600
1990 1995 2000 2005 2010 2015 2020
Mill
ion
tonn
es /
year
West Siberia European Part of Russia E. Siberia & Far EastRussia - Optimistic case Russia - Moderate case Old StrategyIEA-WEO
OldInvestment
New
$160-$200
$230-$240
Source: Russian Energy Strategy, May 2003 / IEA projection – WEO (2002)

Gazprom and Rosneft: Angarsk-Nahodka: $5B - 1mbd
YUKOS, TNK-BP, Sibneft:Angarsk-Daikin: $2B – 400 kbd

Ways toward Regional Oil Co-operation and the IEA’s Role
in NE Asia

OLADE
IEA Collaboration in the Global energy security systems
ASEAN(ACE, ASCOPE)
Japan, Korea
ASEAN+3
China
India
US, Canada, Australia & NZ
Russia
Mexico, Peru, Chile
APEC-EWG(APERC)
EU
SAARC
AFRC
Energy Charter
IEA

Basis for the NE Asia and IEA Collaboration
IEA Ministerial Communiqué in April 2003Emerging need to collaborate with key NMCsLessons from the past and share the policy goals
Japan&Korea + China, Russia as strategic partners with MOUs Same challenges and objectives :
Oil supply securityInvestmentMarket volatility and economic damage

Co-operation between NE Asia and IEA
Current and future co-operation
Stock Workshops with China (2001&2002), ASEAN+3 (2002), ASEAN (2003&2004) and India (2004) => Hotlines
IEA/KEEI Conference on energy security in March & IEA/KERI Conference on electricity in May 2004
Cross-border study on oil and gas in 2005/2006

Suggestions for Joint Work in the Future
Energy security co-operation with NE Asia andIEA’s Emergency Response Measures
Experience sharing for energy policy and market reform to fosterinvestmentHarmonization of the regional framework with world energy securityin real emergency situation => simulation exercise in 2004, joint workshop in the future, etc
Oil data system and market monitoringNE Asia specific data Information exchange for energy market transparencyProducer-consumer dialogue: IEF in 2004 in Amsterdam & EEM in 2005 Paris
The IEA’s contribution to capacity building Training of experts and statisticiansCo-operation with bodies and countries in NE Asia

Government Role for Regional Co-operation
Regulatory & Regulatory & market market
frameworksframeworks
ENERGY & OIL SUPPLY
Security
Energy security Energy security policies & policies & measuresmeasures
International International trade rulestrade rules
Environmental Environmental policies & policies & measuresmeasures
Government policies will shape the energyGovernment policies will shape the energy--supply landscapesupply landscape
ProducerProducer--ConsumerConsumerdialoguedialogue
Research & Research & developmentdevelopment