oil shock vulnerabilities & impacts: case study of malawi
TRANSCRIPT
1
Oil Shock Vulnerabilities & Impacts:
Case Study of Malawi
Prepared for United Kingdom Department for International Development
by
Blake Robinson
Sustainability Institute, Stellenbosch University
Dr Jeremy Wakeford
School of Public Leadership & Sustainability Institute, Stellenbosch University
30 June 2013
Source: United Nations (2012)
2
Contents
Contents .................................................................................................................................................. 2
Abbreviations .......................................................................................................................................... 3
Units of Measurement ............................................................................................................................ 3
List of Figures .......................................................................................................................................... 4
List of Tables ........................................................................................................................................... 4
1. Introduction .................................................................................................................................... 5
2. Energy system ................................................................................................................................. 5
2.1. Overview of the energy system .............................................................................................. 5
2.2. Oil dependence of the energy system .................................................................................... 9
2.3. Likely impact of oil shocks on the energy system ................................................................. 12
3. Transport system .......................................................................................................................... 13
3.1. Overview of the transport system ........................................................................................ 13
3.2. Oil dependence of the transport system .............................................................................. 15
3.3. Likely impacts of oil shocks on the transport system ........................................................... 16
4. Agriculture .................................................................................................................................... 16
4.1. Overview of agriculture ............................................................................................................. 16
4.2. Oil dependence of agriculture ................................................................................................... 17
4.3. Likely impact of oil shocks on agriculture .................................................................................. 18
5. Macro-economy ............................................................................................................................ 18
5.1. Overview of the macro-economy ......................................................................................... 18
5.2. Oil dependence of the macro-economy ............................................................................... 19
5.3. Strengths and vulnerabilities of the macro economy ........................................................... 21
5.4. Likely impact of oil shocks on the macro-economy .............................................................. 22
6. Society ........................................................................................................................................... 23
6.1. Poverty and inequality .......................................................................................................... 23
6.2. Household food security ....................................................................................................... 26
6.3. Settlement patterns .............................................................................................................. 28
6.4. Social cohesion ...................................................................................................................... 28
7. Summary ....................................................................................................................................... 29
8. References .................................................................................................................................... 31

3
Abbreviations
AIDS Acquired immune deficiency syndrome
BERL Bioenergy Resource Limited
ESCOM Electricity Supply Corporation of Malawi
ETHCO Ethanol Company of Malawi
FISP Farm Input Subsidy Programme
GDP Gross Domestic Product
HIV Human immunodeficiency virus
IRENA International Renewable Energy Agency
LPG Liquid petroleum gas
MERA Malawian Energy Regulating Authority
MDG Millennium Development Goals
NOCMA National Oil Company of Malawi
UN United Nations
Units of Measurement
MWK Malawian Kwacha
Km Kilometre
PJ Petajoules
USD United States Dollars

4
List of Figures
Figure 1: Total primary energy supply in 2000 and 2008 ....................................................................... 6
Figure 2: Malawi’s Energy Mix ................................................................................................................ 7
Figure 3: Malawi Energy Mix Projections 2010-2050 ............................................................................. 8
Figure 4: Retail gasoline prices in January 2012 in USD per litre .......................................................... 10
Figure 5: Annual consumption of petroleum ........................................................................................ 12
Figure 6: Total imports of refined petroleum as a percentage of GDP ................................................ 20
Figure 7: Total imports of refined petroleum as a percentage of total imports (USD) ........................ 20
Figure 8: Total imports of refined petroleum as a percentage of total exports (USD) ......................... 21
Figure 9: Income inequality: share in total income per quintile 2005 (IHS2) and 2011 (IHS3) ............ 24
Figure 10: Proportion of the population by food security status in 2011 ............................................ 27
Figure 11: Population Distribution ........................................................................................................ 28
List of Tables
Table 1: National energy demand per sector by fuel type (TJ/year) in 2008 ....................................... 12
Table 2: Malawi Road Network Classification, April 2008 .................................................................... 15
Table 3: Percentage of GDP by sector................................................................................................... 19
Table 4: Mean consumption per person per year by type of consumption ......................................... 25
Table 5: Relative prices of fuel for cooking in 2009 .............................................................................. 26
Table 6: Summary of Malawi’s strengths, vulnerabilities and likely impacts of oil shocks .................. 29

5
1. Introduction
This case study examines Malawi as an example of a low income oil importing country from the
perspective of its vulnerability to shocks in oil price and supply.1 In 2010, Malawi was among the
world’s 10 poorest countries according to the IMF. The 2009 UN Human Development Report
indicated that 73.9% of the population lived below the poverty line of USD1.25 per day, and 90.4%
lived on less than USD2 per day (Europa 2012:761). The country currently has no known sources of
oil, and is thus entirely reliant on other countries for this form of energy.
The case study is organised according to five subsystems of the socio-economic system, namely:
energy; transport; agriculture; macro-economy and society. Each of the first four major sections
includes a brief overview of the subsystem, an analysis of its oil dependency, and a discussion of the
likely impacts of oil shocks under business-as-usual policy environments. Section 5 analyses Malawi’s
social vulnerabilities to oil shocks. The concluding section provides a summary of key strengths,
vulnerabilities and likely impacts of oil shocks in each of the five subsystems.
2. Energy system
This section presents an overview of Malawi’s energy system and the role of oil and oil products in
the country’s energy mix. It begins by considering the primary sources of energy supply, energy
carriers and energy demand, and then looks more specifically at supply and demand for oil and
petroleum products. Oil supply is discussed in terms of imports, biofuels and storage capacity, and
the likely impacts of oil shocks on the energy system are discussed in the final subsection.
2.1. Overview of the energy system
The role of oil in Malawi’s energy system needs to be placed in the context of the country’s overall
mix of energy supply and demand.
Primary energy supply
The figure below compares Malawi’s primary energy supply in 2000 and 2008, indicating a fairly
consistent energy profile over the 8 year period. The country’s energy mix consists predominantly of
biomass - firewood, crop residues, charcoal and animal dung –contributing to approximately 84% of
primary supply. This is followed by oil and oil products at 11%, and hydro energy at 4% and coal and
coal products at 1%. The 2% drop in biomass is matched by a 2% increase in the use of oil and oil
products, indicating an increasing reliance on oil as a primary source of energy over the 8 year
period.
1 The report forms part of a broader study commissioned by the United Kingdom Department for International
Development entitled “Oil Shock Mitigation Strategies for Developing Countries”.

6
Figure 1: Total primary energy supply2 in 2000 and 2008
(Source: IRENA 2012)
Final energy consumption
The breakdown of Malawi’s final energy consumption indicates that the country has not moved
significantly toward modern energy carriers, and around 80% of consumption still takes the form of
burning biomass. The chart below shows that electricity - sourced predominantly from 283MW of
installed hydropower capacity on the Shire River (Chimwala 2012b) - is the second most accessed
form of energy at only 8%. This figure is so low because only 8% of the Malawian population is
currently connected to the electricity grid, and this is almost exclusively in urban and peri-urban
areas. Whereas around 25% of urban households are serviced with electricity, only 1% of rural
households share this privilege (REEEP 2012). To meet currently suppressed demand and projected
future demand, Malawi would need an estimated additional 140 MW of available capacity in place
by 2015 (REEEP 2012).
2 Excluding electricity trade.
0%
10%
20%
30%
40%
50%
60%
70%
80%
90%
100%
2000 (114.7PJ) 2008 (134.1PJ)
Coal and coal products
Hydro
Oil and gas products
Biomass
7
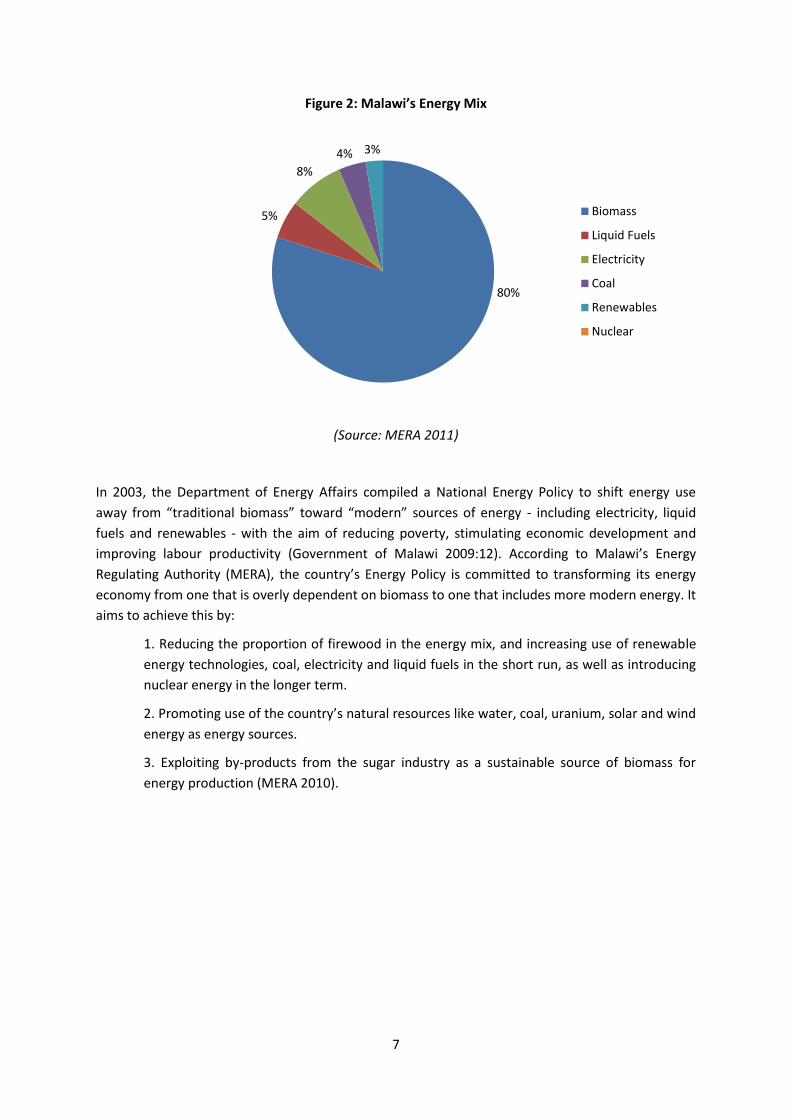
Figure 2: Malawi’s Energy Mix
(Source: MERA 2011)
In 2003, the Department of Energy Affairs compiled a National Energy Policy to shift energy use
away from “traditional biomass” toward “modern” sources of energy - including electricity, liquid
fuels and renewables - with the aim of reducing poverty, stimulating economic development and
improving labour productivity (Government of Malawi 2009:12). According to Malawi’s Energy
Regulating Authority (MERA), the country’s Energy Policy is committed to transforming its energy
economy from one that is overly dependent on biomass to one that includes more modern energy. It
aims to achieve this by:
1. Reducing the proportion of firewood in the energy mix, and increasing use of renewable
energy technologies, coal, electricity and liquid fuels in the short run, as well as introducing
nuclear energy in the longer term.
2. Promoting use of the country’s natural resources like water, coal, uranium, solar and wind
energy as energy sources.
3. Exploiting by-products from the sugar industry as a sustainable source of biomass for
energy production (MERA 2010).
80%
5%
8%
4% 3%
Biomass
Liquid Fuels
Electricity
Coal
Renewables
Nuclear
8
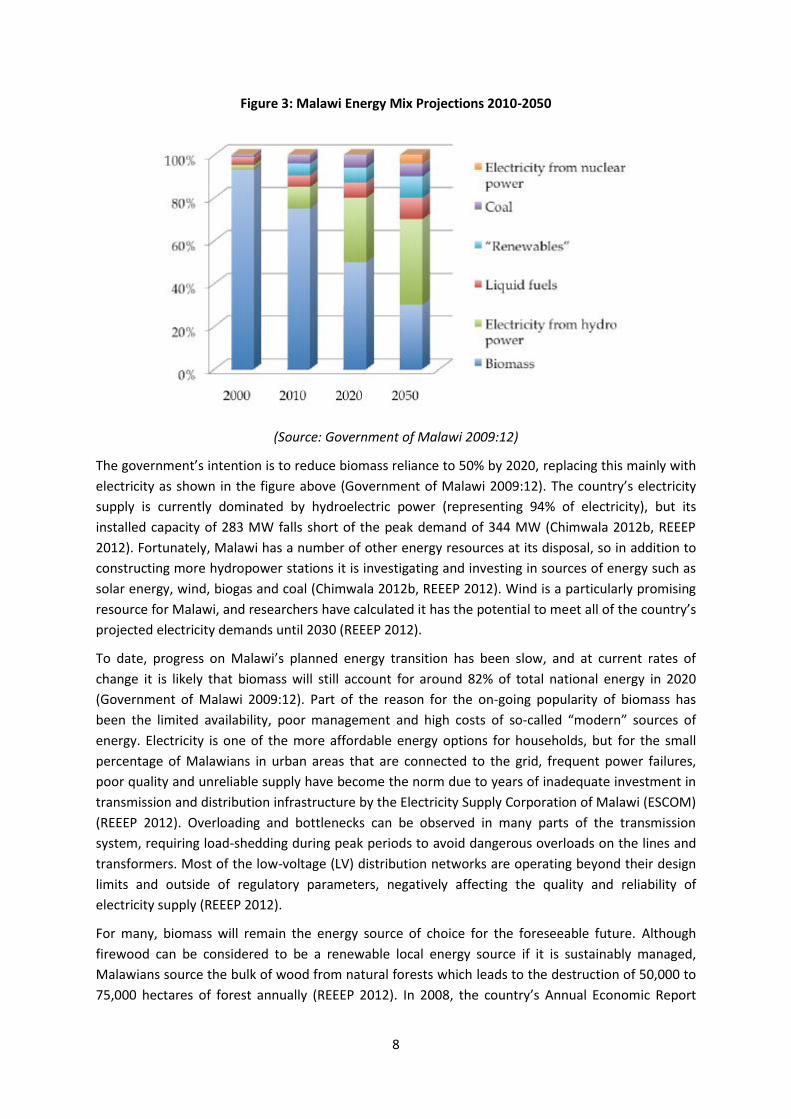
Figure 3: Malawi Energy Mix Projections 2010-2050
(Source: Government of Malawi 2009:12)
The government’s intention is to reduce biomass reliance to 50% by 2020, replacing this mainly with
electricity as shown in the figure above (Government of Malawi 2009:12). The country’s electricity
supply is currently dominated by hydroelectric power (representing 94% of electricity), but its
installed capacity of 283 MW falls short of the peak demand of 344 MW (Chimwala 2012b, REEEP
2012). Fortunately, Malawi has a number of other energy resources at its disposal, so in addition to
constructing more hydropower stations it is investigating and investing in sources of energy such as
solar energy, wind, biogas and coal (Chimwala 2012b, REEEP 2012). Wind is a particularly promising
resource for Malawi, and researchers have calculated it has the potential to meet all of the country’s
projected electricity demands until 2030 (REEEP 2012).
To date, progress on Malawi’s planned energy transition has been slow, and at current rates of
change it is likely that biomass will still account for around 82% of total national energy in 2020
(Government of Malawi 2009:12). Part of the reason for the on-going popularity of biomass has
been the limited availability, poor management and high costs of so-called “modern” sources of
energy. Electricity is one of the more affordable energy options for households, but for the small
percentage of Malawians in urban areas that are connected to the grid, frequent power failures,
poor quality and unreliable supply have become the norm due to years of inadequate investment in
transmission and distribution infrastructure by the Electricity Supply Corporation of Malawi (ESCOM)
(REEEP 2012). Overloading and bottlenecks can be observed in many parts of the transmission
system, requiring load-shedding during peak periods to avoid dangerous overloads on the lines and
transformers. Most of the low-voltage (LV) distribution networks are operating beyond their design
limits and outside of regulatory parameters, negatively affecting the quality and reliability of
electricity supply (REEEP 2012).
For many, biomass will remain the energy source of choice for the foreseeable future. Although
firewood can be considered to be a renewable local energy source if it is sustainably managed,
Malawians source the bulk of wood from natural forests which leads to the destruction of 50,000 to
75,000 hectares of forest annually (REEEP 2012). In 2008, the country’s Annual Economic Report
9
estimated that 7.5 million tons of firewood and charcoal were consumed by households per annum,
exceeding sustainable supply by 3.7 million tons (REEEP 2012).The National Forest Policy of 1996
recognises the value and importance of wood fuels and explicitly promotes the idea of sustainable
wood fuel production as a commercial enterprise under certain conditions, but the entrenched
belief amongst politicians and law enforcement authorities that wood fuels should not be
encouraged has made it difficult to promote sustainable practices. Those responsible for granting
licences for charcoal production under the 1997 Forestry Act have thus far not been sufficiently
satisfied with any charcoal producer’s ability to meet the criteria, and as of 2009 no licences were in
place. This effectively renders illegal any production of charcoal from indigenous trees in Malawi,
with negative repercussions in terms of energy access for the poor (Government of Malawi 2009:15-
17).
In recognition of such issues and the high likelihood that biomass will continue to be the country’s
predominant form of affordable energy in the foreseeable future, the Malawi Biomass Energy
Strategy of 2009 was developed to promote the biomass energy sector in a more proactive and
positive way. Instead of dismissing biomass as an outdated and irrelevant energy source as the
National Energy Policy has done, the strategy aims to improve the sustainable supply and efficiency
of biomass so that it can continue to meet the needs of the poor for affordable energy, but in a way
that contributes positively to the country’s economy and does not allow for over-exploitation of
biomass resources (Government of Malawi 2009).
2.2. Oil dependence of the energy system
After biomass, oil and oil products are the second greatest contributors to the country’s primary
energy mix, constituting 11%. This figure has grown since 2000, and is likely to increase further in
accordance with the Department of Energy’s modernisation plans. The energy system’s dependence
on oil will now be considered from the supply and demand side.
Supply of oil
Malawi has no known sources of oil and natural gas, and does not have facilities for refining oil.
However, in October 2011 the government awarded exploration licenses to a UK-based company to
investigate oil and gas reserves beneath Lake Malawi. While the extent of these reserves is not yet
certain and the 50 year dispute with Tanzania over which country owns the lake continues, this may
represent a significant opportunity for Malawi to reduce its dependence on imported oil and
diversify its energy mix (Reuters 2012).
Malawi imports 97% of all refined petroleum products, including gasoline and jet fuel via Tanzania,
Mozambique and South Africa (REEEP 2012, Government of Malawi 2009:23). In 2008, 7,209 barrels
of refined petroleum products were imported into Malawi on average per day, and in 2011 the
country’s petroleum consumption was estimated at 9,000 barrels per day (EIA 2012). As a
landlocked country, its economy is highly dependent on liquid fuels for transportation, and for the
importation of fuel itself. Fuel transport costs to the major market in Blantyre range between $90
and $150 per tonne, depending on the type of fuel being transported (Government of Malawi
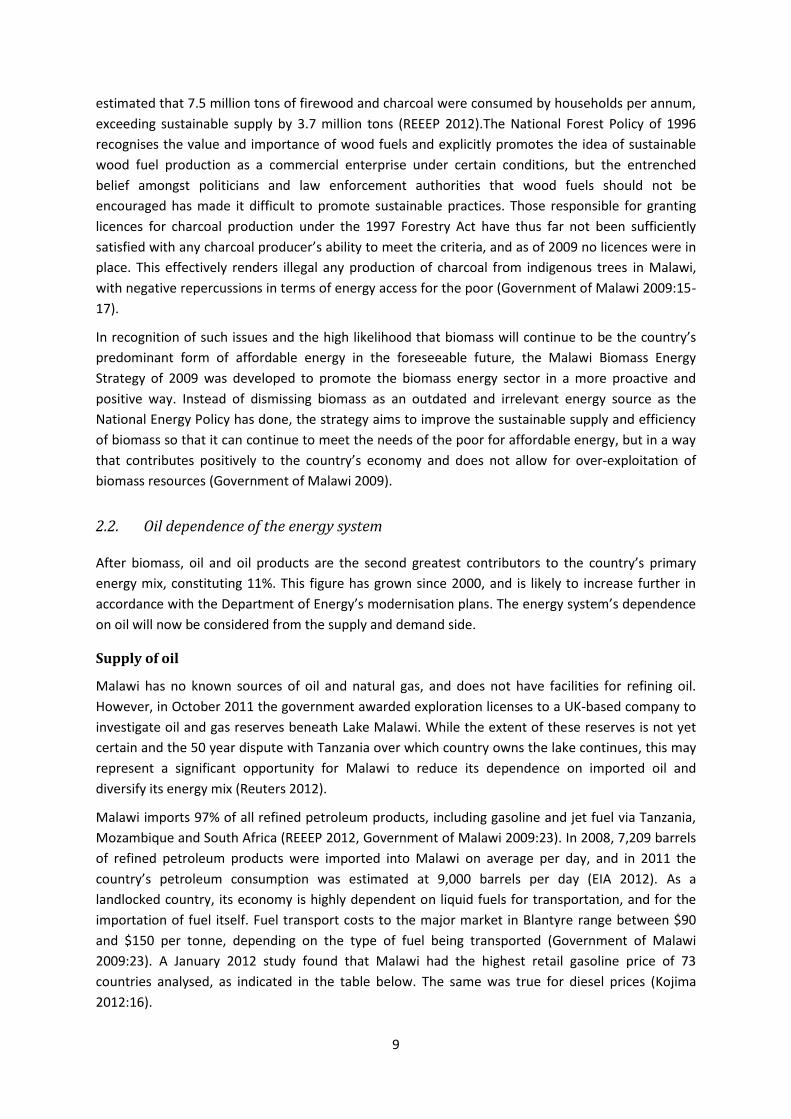
2009:23). A January 2012 study found that Malawi had the highest retail gasoline price of 73
countries analysed, as indicated in the table below. The same was true for diesel prices (Kojima
2012:16).
10
Figure 4: Retail gasoline prices in January 2012 in USD per litre
(Source: Kojima 2012:15)
Shortages in oil supply have a significant and immediate impact on Malawi’s economy as fuel
reserves currently last only three days (Chimwala 2012a). In an effort to improve security of oil
supply during times of crisis, the state-owned National Oil Company of Malawi (NOCMA) plans to
spend $25 million on the construction of three new oil storage facilities in Mzuzu, Lilongwe and
Blantyre by the end of 2013 (Khanje 2012). These will hold 15 million, 25 million and 20 million litres
respectively (Chimwala 2012a), and together with the rehabilitation of old fuel facilities at Mchinji
and Chipoka, these reserves should allow the country to sustain oil supply for about 15 days.
Reliance on imported liquid fuels renders Malawi vulnerable to shortages in supply and oil price
fluctuations, and this has led to an increased focus on biofuels. Malawi has been using ethanol-
blended fuel since the energy crisis in the early 1970s, with petroleum companies adopting a
blending ratio of 10% ethanol to 90% petrol (Masina 2008:71). Under the 2009 Liquid Fuels and Gas

11
(Production and Supply) Regulations, it has become compulsory to blend all fuels with a minimum
level of organic oxygenates of not less than 10% (PISCES 2011:5). Increasing the ethanol-petrol
blending ratio has been identified as a means of minimising the foreign exchange impact of greater
liquid fuel consumption (MERA 2010), although this does little to help fuel consumers as ethanol
prices are based on import parity rather than the cost of production. The price of ethanol is pegged
at 5% below the landed cost of petrol to ensure that blending remains financially attractive to
suppliers, although MERA is reviewing this pricing policy (Government of Malawi 2009:20).
Malawi has two locally owned companies that produce ethanol from sugarcane - Ethanol Company
of Malawi (ETHCO) and Presscane Limited. Each of their factories can produce 16 million litres of
ethanol a year from, but in 2008 Presscane only produced 10.8 million litres of ethanol per year from
its plant in Chikwawa while ETHCO’s Nkhota-kota plant produced closer to 7 million litres (Masina
2008:71). The Malawian government has funded a five year MWK140 million (USD1 million) research
project to explore alternative sources of fuel for vehicles. The Department of Science and
Technology in collaboration with ETHCO is investigating the conversion of petrol vehicles to dual-fuel
vehicles that run on ethanol or a combination of petrol and ethanol in a single tank (Masina
2008:71).
Domestic production of biodiesel was recently boosted with the launch of an $8 million production
plant by Bioenergy Resources Limited (BERL) in the Lilongwe region. Currently designed to convert
250t of Jatropha to 5,000 litres of biodiesel each day (approximately 1.8 million litres per year), the
plan is to increase capacity fourfold in the coming years. In addition to providing liquid fuel for
blending with paraffin and diesel, the nutrient rich seedcake produced as a by-product will be sold to
farmers as a biofertiliser. This has an additional economic benefit as it can be used as a substitute for
imported fertilisers that are typically derived from fossil fuels. Thousands of farmers are already
benefitting from the Jatropha market, and the project is in line with the government’s efforts to
diversify the economy by reducing dependence on tobacco as a cash crop, and empower rural
communities (Chimwala 2012).
Demand for oil
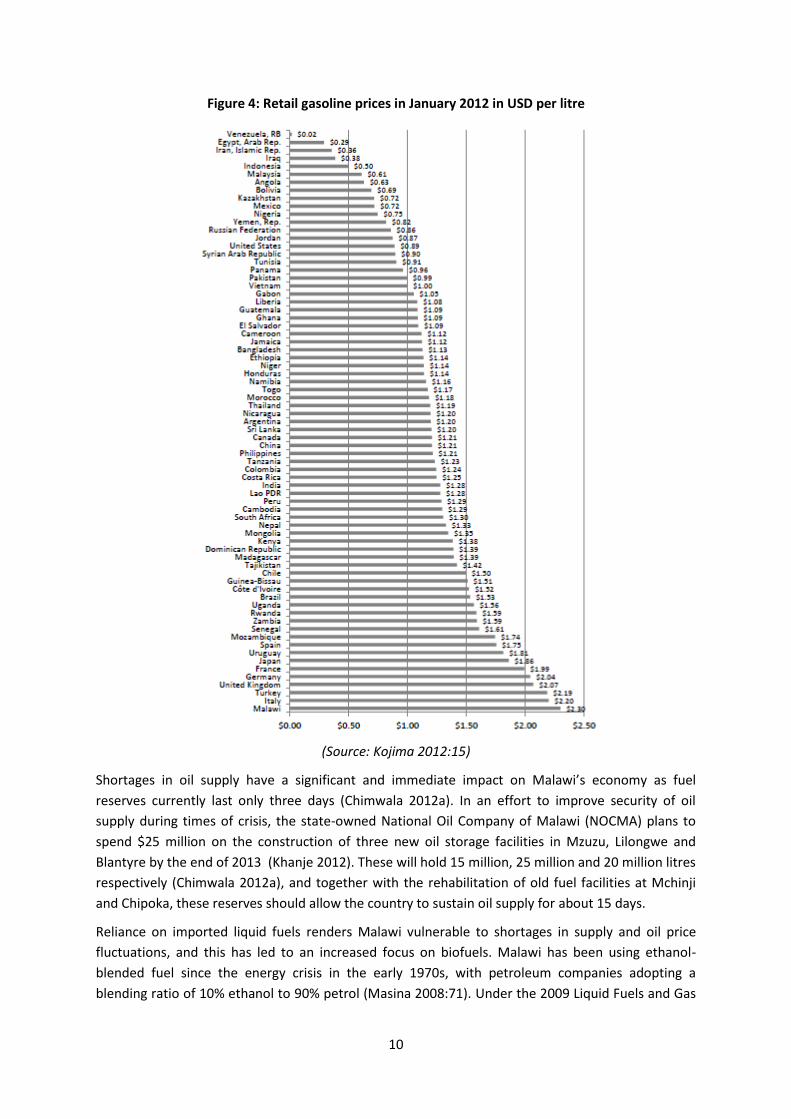
There is no doubt that demand for oil and oil products is increasing in Malawi, and current levels of
suppressed demand indicate that this trend is unlikely to change in the near future (assuming that
fuel prices do not rise dramatically). As the graph below shows, consumption of petroleum has
consistently increased since the country’s first democratic elections in 1993, although the pace of
this growth has fluctuated over time.
12
Figure 5: Annual consumption of petroleum
(Source EIA 2012)
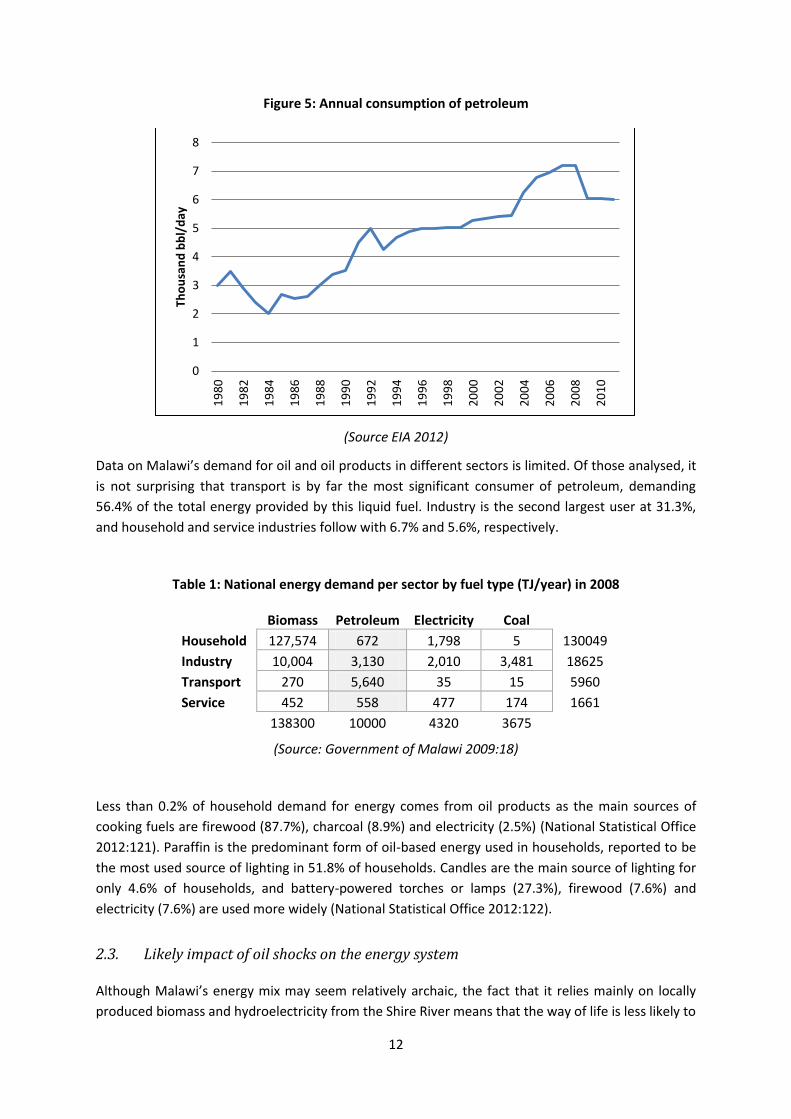
Data on Malawi’s demand for oil and oil products in different sectors is limited. Of those analysed, it
is not surprising that transport is by far the most significant consumer of petroleum, demanding
56.4% of the total energy provided by this liquid fuel. Industry is the second largest user at 31.3%,
and household and service industries follow with 6.7% and 5.6%, respectively.
Table 1: National energy demand per sector by fuel type (TJ/year) in 2008
Biomass Petroleum Electricity Coal
Household 127,574 672 1,798 5 130049
Industry 10,004 3,130 2,010 3,481 18625
Transport 270 5,640 35 15 5960
Service 452 558 477 174 1661
138300 10000 4320 3675
(Source: Government of Malawi 2009:18)
Less than 0.2% of household demand for energy comes from oil products as the main sources of
cooking fuels are firewood (87.7%), charcoal (8.9%) and electricity (2.5%) (National Statistical Office
2012:121). Paraffin is the predominant form of oil-based energy used in households, reported to be
the most used source of lighting in 51.8% of households. Candles are the main source of lighting for
only 4.6% of households, and battery-powered torches or lamps (27.3%), firewood (7.6%) and
electricity (7.6%) are used more widely (National Statistical Office 2012:122).
2.3. Likely impact of oil shocks on the energy system
Although Malawi’s energy mix may seem relatively archaic, the fact that it relies mainly on locally
produced biomass and hydroelectricity from the Shire River means that the way of life is less likely to
0
1
2
3
4
5
6
7
8
19
80
19
82
19
84
19
86
19
88
19
90
19
92
19
94
19
96
19
98
20
00
20
02
20
04
20
06
20
08
20
10
Tho
usa
nd
bb
l/d
ay
13
be affected by oil shocks than a more developed country which is more heavily dependent on oil.
That said, petroleum meets over 94% of the transport industry’s needs, and given the high cost of
petrol and low population densities, mobility and trade are likely to be directly threatened by oil
shocks. Until adequate oil storage facilities are in place, the impact of any oil shocks will be felt all
the more swiftly as local shortages follow swiftly on from interruptions in imports. The expansion of
biofuel production is positive in terms of improving the country’s resilience, but output is not
currently at a sufficient level to provide much of a buffer against oil shocks.
3. Transport system
Effective and affordable transport systems are essential for local, regional and international trade,
food distribution and the movement of people between their homes and areas of economic
opportunity. This section begins with an overview of Malawi’s transport system, considering the
country’s predominant modes of transport. It then provides an insight into the oil dependence of the
transport system, before identifying the country’s exposure to oil price and supply shocks.
3.1. Overview of the transport system
Affordable and effective transportation is a significant challenge for landlocked Malawi. The sector is
vital in connecting the country to international markets and distributing goods and services over vast
distances in a region that is predominantly rural and low-density. Transport forms an important
sector of the national economy, and over the past 5 years its share of GDP at constant prices was on
average 4.4% per annum (Roads Authority 2010).
Inefficiencies in Malawi’s transport routes and those of neighbouring Mozambique add significantly
to the costs of trade. It is estimated that 55% of the costs of production are due to transport costs,
which is significantly higher than the 17% found in other developing countries and makes Malawi’s
transport costs amongst the highest in sub-Saharan Africa (Roads Authority 2012).The country’s
main transport networks consist of waterways, rail, road and air transport, which are discussed
below.
Waterborne Transport
Although Malawi is landlocked, Lake Malawi is used to move goods within Malawi and between
Malawi and Tanzania via four major harbours. The lake’s proximity to the East Coast of Africa has
raised the possibility of connection to international markets via the sea. The Shire-Zambezi
waterway was conceived as a way of connecting Lake Malawi to the port of Beira in neighbouring
Mozambique, thus allowing better access to international trade routes. Malawi has already spent
millions of Kwacha on the construction of the Nsanje World Inland Port, but the lack of a
comprehensive feasibility study and concerns raised by the Mozambican government have delayed
the project indefinitely. In June 2011, USD3.5 million was approved by the African Development
Bank to conduct the feasibility study and prepare an investment plan (Chiyembekeza 2012). The
future of the project will depend on the outcome of the feasibility study and whether the
Mozambican government – a critical partner in the endeavour - can be convinced of its viability.

14
Rail transport
Malawi’s railway network is characterised by old and dilapidated locomotives and poorly maintained
tracks which frequently result in the suspension of rail services. The country has 797km of single
track, but this only serves the southern half of the country and most of this is in a poor state. The
Nacala Corridor is currently Malawi’s only viable rail route for imports and exports, stretching 807km
from Nacala to Blantyre, and 1,007km to Lilongwe. However, parts of the track are in a poor
condition - particularly the 77km stretch from Entre Lagos to Cuamba on the Mozambican side
(Chiyembekeza 2012).
While it remains to be seen whether the Shire-Zambezi water corridor will be realised, the Sena
Railway Corridor is being prioritised as a means of improving the country’s transportation network.
The corridor is deemed to be an economically viable option, connecting Nsanje in Malawi to the port
of Beira and the coal mining town of Moatize in Mozambique. Much of the line is in good enough
condition for use by passenger and cargo trains, but the 209km stretch from Blantyre to Nsanje is in
a poor state. While the rehabilitation of this stretch could reduce transport costs by around 25% and
facilitate international trade, the MWK315 million (USD100 million) estimated to be required will be
difficult to source given the Malawian government’s priorities (Chiyembekeza 2012).
Road transportation
Although a well-functioning rail network would undoubtedly help to reduce transportation costs in
Malawi, the unreliability of the current system and the cost and time required to implement the
necessary upgrades have led to a focus on road transportation as a relatively more affordable and
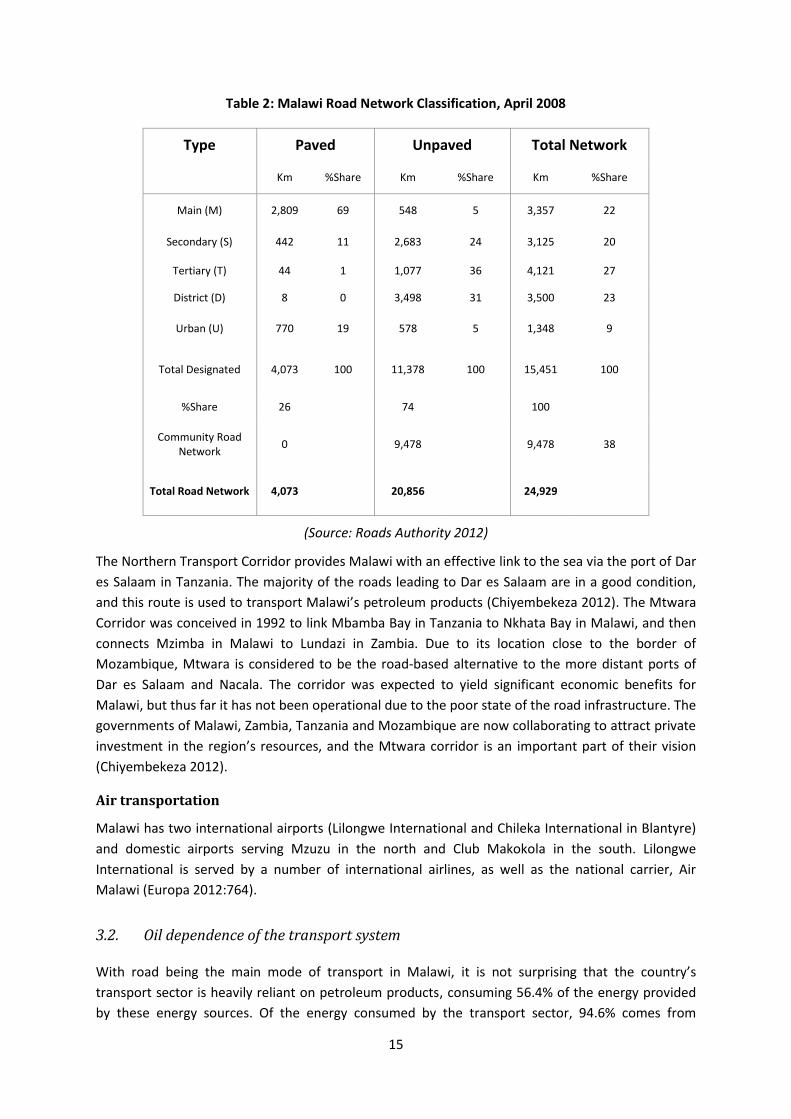
swift option (Chiyembekeza 2012). As indicated in the table below, Malawi has a public road
network of approximately 15,451km, of which about 26% is paved and the remainder has an earth
or gravel surface. In addition there are around 9,478km of undesignated community roads that serve
mainly rural areas (Roads Authority 2012). Roads handle 99% of domestic passenger traffic, and
move over 70% of internal freight. With few other options for the movement of people, goods and
services across the border, roads meet over 90% of international freight and passenger needs (Roads
Authority 2012).
The Malawian Government has recognised the strategic importance of the country’s roads, and has
given high priority to maintaining existing roads and constructing new ones (Roads Authority 2012).
Upgrading of the country’s road network has been slow, but this has speeded up in recent years with
MWK37,000 million (USD 113,8 million) allocated to road rehabilitation in the 2010/2011 budget.
Some of the largest projects included the Jenda-Edingeni Road, the Zomba-Blantyre road and the
Zomba-Jali-Kamwendo road (Europa 2012:764).
15
Table 2: Malawi Road Network Classification, April 2008
Type Paved Unpaved Total Network
Km %Share Km %Share Km %Share
Main (M) 2,809 69 548 5 3,357 22
Secondary (S) 442 11 2,683 24 3,125 20
Tertiary (T) 44 1 1,077 36 4,121 27
District (D) 8 0 3,498 31 3,500 23
Urban (U) 770 19 578 5 1,348 9
Total Designated 4,073 100 11,378 100 15,451 100
%Share 26
74
100
Community Road Network
0
9,478
9,478 38
Total Road Network 4,073
20,856
24,929
(Source: Roads Authority 2012)
The Northern Transport Corridor provides Malawi with an effective link to the sea via the port of Dar
es Salaam in Tanzania. The majority of the roads leading to Dar es Salaam are in a good condition,
and this route is used to transport Malawi’s petroleum products (Chiyembekeza 2012). The Mtwara
Corridor was conceived in 1992 to link Mbamba Bay in Tanzania to Nkhata Bay in Malawi, and then
connects Mzimba in Malawi to Lundazi in Zambia. Due to its location close to the border of
Mozambique, Mtwara is considered to be the road-based alternative to the more distant ports of
Dar es Salaam and Nacala. The corridor was expected to yield significant economic benefits for
Malawi, but thus far it has not been operational due to the poor state of the road infrastructure. The
governments of Malawi, Zambia, Tanzania and Mozambique are now collaborating to attract private
investment in the region’s resources, and the Mtwara corridor is an important part of their vision
(Chiyembekeza 2012).
Air transportation
Malawi has two international airports (Lilongwe International and Chileka International in Blantyre)
and domestic airports serving Mzuzu in the north and Club Makokola in the south. Lilongwe
International is served by a number of international airlines, as well as the national carrier, Air
Malawi (Europa 2012:764).
3.2. Oil dependence of the transport system
With road being the main mode of transport in Malawi, it is not surprising that the country’s
transport sector is heavily reliant on petroleum products, consuming 56.4% of the energy provided
by these energy sources. Of the energy consumed by the transport sector, 94.6% comes from

16
petroleum, 4.5% from biomass (in the form of biofuels) and 0.6% and 0.3% from electricity and coal,
respectively (consumed by the rail sector) (Government of Malawi 2009:18). While road transport is
the most popular form of motorised transport, there were only eight vehicles per thousand
Malawians in 2007, four of which were private motor vehicles (World Bank 2012). This indicates that
motorised mobility is highly constrained for the majority of the population, who rely mostly on
walking and cycling.
The oil dependence of road transportation may decline slightly as biofuels become more prevalent,
but this is unlikely in the immediate future. Local production of biofuels is currently unable to meet
demand, but ethanol and biodiesel capacity is increasing and groups like the Biofuels Association of
Malawi and Biofuel Advisory Council are lobbying for the creation of an appropriate biofuels policy
and legal framework to support the growth of a local industry (PISCES 2011:3). Improvements in the
country’s rail infrastructure might allow for some of the demand for oil to be met by electricity and
coal, but the extent to which the rail system’s challenges can be resolved in the short to medium
term remains to be seen.
3.3. Likely impacts of oil shocks on the transport system
Oil shocks are likely to have a swift and serious impact on Malawi’s transport system and economy
due to the lack of alternatives to road-based transport in most parts of the country. Even though the
transport system is largely inadequate and many people make do with non-motorised forms of
transport, those that are able to afford motorised transport are heavily dependent on petroleum.
Fuel supply shocks are not uncommon as logistical problems have been known to leave parts of
Malawi without fuel for days – even when there is sufficient supply of oil in the country. Typically,
the black market will step in to take advantage of the situation, hiking the fuel price and making it
even less affordable (Face of Malawi 2012). While the people of Malawi may take this in their stride,
fuel supply shortages can spark violent public reaction, as was seen in 2011 (Peak Oil 2011).
4. Agriculture
Agriculture is Malawi’s most important economic sector, accounting for 31% of gross domestic
product in 2010 (World Bank 2012), and most of the population depends entirely on domestic
agriculture for their food needs. This section provides an overview of the agricultural sector and its
oil dependence, before considering the likely impacts of oil shocks on agriculture.
4.1. Overview of agriculture
2011 statistics indicate that over half of the population over the age of 15 was engaged in household
agricultural or fishing activities - about two thirds of the people in rural areas and 10% of those in
urban areas (National Statistical Office 2012:92). In rural areas, 81% of the active population aged 15
and above were classified as subsistence farmers or “Mlimi” in 2005 (National Statistical Office
2005:95). Much of the country’s farming activity takes place in the smallholder sector, which
contributes to approximately 86% of its agricultural output and occupies approximately 80% of
cultivated land (Europa 2012:761).

17
Maize is Malawi’s staple food, and approximately 60% of the country’s farmland is used to cultivate
it. It is estimated that average maize consumption is in the order of 172kg per person per year,
contributing more than 70% to dietary calories (Ellis & Manda 2012:1408). Seasonal changes in
maize supply as a result of weather and climate fluctuations have a direct impact on its price and
affordability. Between 1989 and 2009, the average difference between the lowest and the highest
price months in the annual maize calendar was 60%, with nominal increases from seasonal lowest to
highest price reaching as much as 395% in the 2007-2008 and 2008-2009 seasons (Ellis & Manda
2012:1407). Diversification away from maize toward other food crops like sorghum, cassava,
potatoes, pulses and plantains has been recommended as a means of reducing the risks of maize
crop failures and improving food security (Europa 2012:761).
Low levels of productivity by smallholder farmers is a challenge in Malawi, and this is largely
attributed to low input use exacerbated by inadequate access to credit and markets for inputs and
outputs, small landholding sizes, unfavourable weather conditions and failures in technology
development and transfer. Insufficient access to improved inputs and advice makes it difficult for
farmers to diversify their outputs (Ministry of Agriculture and Food Security 2011:22). Despite
government efforts to promote the adoption of technologies to boost agricultural yields, the low
purchasing power of the poor places many productivity-boosting options out of their reach (Ministry
of Agriculture and Food Security 2011:25).
In line with its focus on ensuring food security as a means of reducing poverty and avoiding future
crises, 50% of the government budget for the agricultural sector in the 2011/2012 financial year is
allocated for the Farm Input Subsidy Programme (FISP) (African Economic Outlook 2012:11). In the
wake of a severe drought in 2004 which resulted in 5 million Malawians (40% of the population)
requiring food aid, FISP was implemented to provide 60% of the population with affordable fertiliser
and seeds for high quality maize and legumes. The programme has learned from the successes and
failures of those that preceded it, and has been the most successful and sustained to date. It has
more than doubled the average maize yield per hectare and allowed farmers to grow other high
value crops without impairing their maize production (DFID 2011:4).
Malawi’s cash crops include tobacco, coffee, cotton, tea and sugar. Tobacco contributed to 46% of
total export revenues in 2010, which was down from an average of about 60% before the start of
uranium exports in 2009. Given efforts to reduce smoking in the developed world, President
Mutharika tried to shift tobacco producers to other crops. There has subsequently been a drop in
registered tobacco estates from 61,834 in 2000 to 11,314 in 2007, but Malawi’s production of
unmanufactured tobacco has increased from 118,000 metric tons in 2007 to 208,155 tons in 2009
(Europa 2012:761-762).
4.2. Oil dependence of agriculture
Smallholder farmers typically employ traditional and non-mechanised methods of cultivation, and
thus have a low dependence on oil for agricultural production (Ministry of Agriculture and Food
Security 2011:25). As an indication of this, Malawi was estimated to have an average of only 4.7
tractors per 100km2 of arable land in 2007 (Trading Economics 2012). Oil is required to transport
goods to and from central market areas, but constrained access to these markets by smallholder
farmers indicates that there is currently suppressed demand for motorised transport by this group.
18
Of the 3 million hectares of cultivable land, more than 99% remains under rain-fed cultivation
(Ministry of Agriculture and Food Security 2011:23), and only 0.5% of cultivated plots use irrigation
(National Statistical Office 2012:135). This indicates that the amount of energy consumed for crop
irrigation is negligible on the whole, and shows how vulnerable the agricultural sector is to the
increased incidences of drought, dry spells, and intense rainfalls experienced in recent decades.
Government and NGOs have been promoting the use of irrigation in recent years, but the
technologies are predominantly low-cost options like treadle pumps that use human or animal
energy (Ministry of Agriculture and Food Security 2011:23). In cases where mechanical pumps are
used, fuel shortages such as those in 2010 and 2011 impede the growth of irrigated crops, forcing
farmers to resort to cutting down trees to sell as firewood to make ends meet (Sukali 2011).
While the agricultural sector’s reliance on liquid fuels for machinery may be relatively low by
international standards, inorganic fertilizers that use oil in their production were used on 61.3% of
cultivated plots in 2011 – 67.9% in urban areas and 61% in rural areas. The derived demand for oil in
the production of herbicides and pesticides is much lower, as only 1.1% of cultivated plots use
herbicides or pesticides (National Statistical Office 2012:135).
4.3. Likely impact of oil shocks on agriculture
If 86% of Malawi’s agricultural output comes from the smallholder sector and this sector employs
methods that are largely traditional and require minimal inputs, then oil shocks are not as likely to
negatively impact on Malawi’s agricultural output as would be the case in countries with highly
mechanised, input-intensive agricultural systems. Oil shocks are most likely to impact on the already
high costs of transport, making it even more difficult and costly to import inputs and distribute
agricultural products to local and foreign markets. The cost of inputs would also rise, most notably in
the form of inorganic fertilizers that use fossil fuels in their production. The major challenges in the
Malawian agricultural sector relate to its vulnerability to weather conditions and low levels of
productivity amongst smallholder farmers, and currently low levels of oil dependence present
opportunities to address these issues in ways that do not increase reliance on oil.
5. Macro-economy
This section starts with an overview of Malawi’s macro-economy, considering its most important
sectors and growth. It then details the economy’s oil intensity, and a list of the country’s main
macroeconomic strengths and vulnerabilities to oil shocks is provided. The final subsection considers
the likely macroeconomic impacts of oil price shocks in Malawi.
5.1. Overview of the macro-economy
The Malawian economy is dominated by agriculture, which together with forestry, fishing and
hunting contributed a constant 31.6% to GDP in 2006 and 2010, as indicated in the table below.
“Wholesale and retail trade, hotels and restaurants” is the second largest sector, and increased from
21.3% to 23.5% of the country’s GDP over the same four year period. “Other services” occupied third
position at 11.3% in 2006, but this moved down to fourth position in 2010, trading places with
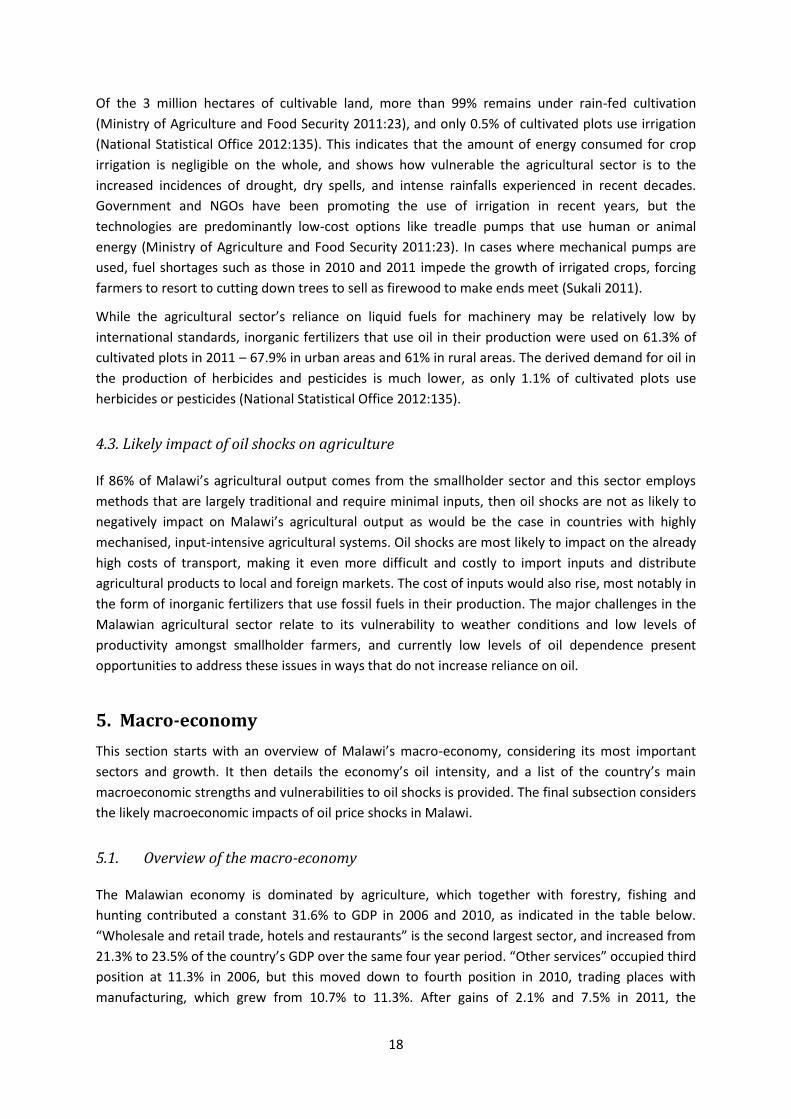
manufacturing, which grew from 10.7% to 11.3%. After gains of 2.1% and 7.5% in 2011, the
19
manufacturing and construction sectors are expected to pick up in 2012, growing a further 5.9% and
9.0%, respectively. Although mining and quarrying contributed only 1.2% to growth in 2010, the
sector may well contribute more significantly to growth in the future as uranium production
increases and the mining of rare minerals such as niobium commences (African Economic Outlook
2012:5).
Table 3: Percentage of GDP by sector
SECTOR 2006 2010
Agriculture, forestry, fishing & hunting 31.6% 31.6%
Mining and quarrying 1.2% 1.2%
Manufacturing 10.7% 11.3%
Construction 3.8% 3.4%
Electricity, gas & water 1.5% 1.8%
Transport, storage and communication 7.1% 7.0%
Wholesale & retail trade, hotels & restaurants 21.3% 23.5%
Finance, real estate and business services 7.9% 7.6%
Public administration, education, health 3.7% 2.8%
Other services 11.3% 9.9%
(Source: African Economic Outlook 2012:4)
Although it remains a poor country, Malawi’s economy has performed better than most Sub-Saharan
African countries in recent years, with an average growth in real GDP of 7% from 2005-2010. It was
relatively protected from the worst of the 2008-2009 recession due to a boost in GDP and the
current account balance as a result of favourable weather, a bumper tobacco crop and the entry of
uranium resources into production in 2009 (Europa 2012:761). However, a poor agricultural season
in 2010 saw growth fall sharply from 8.9% to 6.7%. In 2011, a combination of reduced donor inflows,
foreign exchange difficulties, shortages of essential commodities and low earnings from tobacco
exports saw growth fall to an estimated 5.8%. A continued slow-down is expected for 2012 and
2013, and growth is projected to average between 5.0% and 5.2% (African Economic Outlook
2012:2).
5.2. Oil dependence of the macro-economy
As shown in Section 1, oil only contributes about 11% of Malawi’s primary energy mix, although this
is an average across the country and its contribution to primary energy demand in the formal
economy is likely to be more significant. Malawi imports all of the oil it consumes, and trends over
the past few decades indicate that its economy is becoming increasingly dependent on this energy
resource. The graph below shows the growing petroleum dependence of the economy since the late
1990s, driven both by the rising price of Brent crude oil as well as growing consumption of oil
products. In 2008, total imports of refined petroleum products equated to 6% of GDP, but this
proportion fell to approximately 4.5% in 2011 as petroleum consumption reportedly declined.

20
Figure 6: Total imports of refined petroleum as a percentage of GDP
Source: Author’s calculations based on EIA (2012), BP (2012) and World Bank (2013)3
It is not surprising that an increasing portion of Malawi’s expenditure on imports (in USD) is being
constituted by imports of refined petroleum, as shown below. A steep upward trend was evident
from the late 1990s until 2008, and the percentage of total import expenditure allocated to refined
petroleum products exceeded 12% that year. The proportion fell steeply when oil prices and
consumption plunged in 2009, but is on the rise once more.
Figure 7: Total imports of refined petroleum as a percentage of total imports (USD)
Source: Author’s calculations based on EIA (2011), BP (2012) and World Bank (2012)
A similar trend can be observed when considering total imports of refined petroleum as a
percentage of total exports. In this case, the percentages are even higher as the value of imports
3 The spot price of Brent crude oil has been used to convert barrels of oil into USD value of oil consumed.
0
1
2
3
4
5
6
7
19
80
19
82
19
84
19
86
19
88
19
90
19
92
19
94
19
96
19
98
20
00
20
02
20
04
20
06
20
08
20
10
% o
f G
DP
0
2
4
6
8
10
12
14
19
80
19
82
19
84
19
86
19
88
19
90
19
92
19
94
19
96
19
98
20
00
20
02
20
04
20
06
20
08
20
10
% o
f to
tal i
mp
ort
s
21
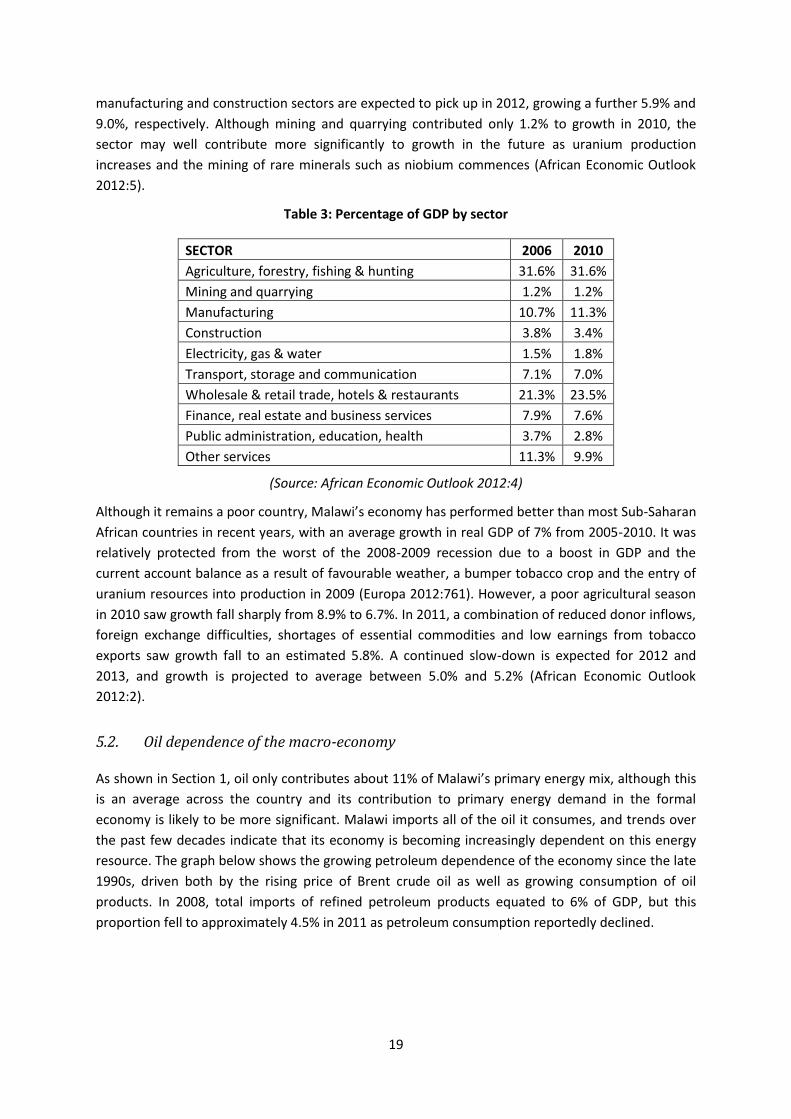
typically exceeds that of exports (i.e. there is a negative trade balance), and in 2008 the percentage
briefly touched 25%.
Figure 8: Total imports of refined petroleum as a percentage of total exports (USD)
Source: Authors’ calculations based on EIA (2012), BP (2012) and World Bank (2013)
5.3. Strengths and vulnerabilities of the macro economy
The major strengths and vulnerabilities of the Malawian macro-economy in the face of international
oil price shocks are as follows:
Malawi’s fiscal performance has improved in recent years due to reforms in tax collection that
have yielded higher than anticipated revenue collection. Tax revenue increased to 19.6% of GDP
in 2011 from 19.1% in 2010 and 18.7% in 2009. However, total expenditure also increased from
35% of GDP in 2010 to 35.5% in 2011. A 3.6% deficit is anticipated in 2012, falling back to 3.0% in
2013 (African Economic Outlook 2012:6). This deficit leaves little financial capacity to invest in
much-needed infrastructure or respond to future shocks.
In June 2011, Malawi’s external debt was USD 912.4 million (15% of GDP), which is
comparatively low by international standards and was found to be sustainable by a debt
sustainability analysis conducted in May 2011. Domestic debt was estimated at 16.5% of GDP in
June 2011, which falls within the upper limit of what is considered safe. The government has
subsequently come under increasing pressure to raise external debt to improve the supply of
foreign exchange for fuel and other imports (African Economic Outlook 2012:4), but this would
not be sustainable in the absence of a major increase in exports.
Malawi’s current account deficit widened from 17.5% of GDP in 2010 to 18.1 percent in 2011,
and a further increase to 18.5% is anticipated for 2012 (African Economic Outlook 2012:7). This
represents a significant risk in terms of potential currency volatility, speculative attacks and
exchange rate depreciation. It is hoped that improved tobacco quality and higher world prices
will allow revenues from tobacco to recover in 2012, and that investments in mining made in
2011 will improve export revenues from this sector (African Economic Outlook 2012:4).
0
5
10
15
20
25
30
19
80
19
82
19
84
19
86
19
88
19
90
19
92
19
94
19
96
19
98
20
00
20
02
20
04
20
06
20
08
20
10
%
Oil imports/total exports
22
In recent years, shortages in foreign exchange have been a frequent problem, making it difficult
for Malawians to purchase imported goods and fuel. This was exacerbated by the withdrawal of
budgetary support from donor countries as a result of President Mutharika’s economic policies
in 2011. Following President Banda’s recent devaluation of the Kwacha and untying it from the
US Dollar, this situation is likely to improve, although consumers will bear the brunt of higher
prices until foreign aid flows resume (The Guardian 2012).
While the government has successfully kept inflation to single digits since 2007, in 2012 the
inflation rate increased from 10.3% in January to as high as 25.5% in 2012. This is largely
attributable to the devaluation of the Kwacha, which has resulted in headline inflation rates of
over 20% in the months following June 2012 (National Statistical Office 2012a). Soaring inflation
is a serious concern for Malawi’s poor, and is likely to negatively impact on poverty figures in
2012.
Youth unemployment and underemployment represent a significant vulnerability. Although
official statistics show that only 2.7 percent of those aged 15-24 years have no job, this does not
capture the real situation as one only has to work one hour a week to be classified as
“employed”. Underemployment is prevalent – particularly in the agricultural sector that
accounts for 80% of the labour force – and low wages result in high levels of working poverty
(African Economic Outlook 2012:2).
A shortage of skilled labour is largely attributable to low education levels and the effects of
HIV/AIDS (Europa 2012:761). While net school enrolment rates have increased to 83% and youth
literacy to 84% as a result of Malawi’s free primary education policy, it was implemented
without adequate investment in infrastructure or personnel and it looks unlikely that the
country will reach its MDG target of universal primary education. The HIV prevalence rate
amongst the 15-49 age group stood at 11% in 2010, down slightly from 12% in 2004 due to
increased awareness of the disease, improved reproductive health and child health
programmes, better diagnosis and universal access to treatment (African Economic Outlook
2012:11).
5.4. Likely impact of oil shocks on the macro-economy
Malawi’s economy is relatively low in its overall dependence on oil, but the road-dominated
transport sector is highly dependent on this energy resource and transport is crucial to trade and a
functioning economy. The fact that all oil is imported into Malawi means that oil shocks are likely to
have negative consequences in terms of the country’s balance of payments and currency as the
costs of imports and transport rise. At home, oil shocks are likely to drive further inflation, stifling
entrepreneurship and job creation as the costs of doing business increase. Higher costs of living
would make it more difficult for Malawians to make ends meet, and would drive more of them into
poverty. With a fiscal deficit, the government does not have the reserves to deal with any
humanitarian crises that may ensue, so survival will be largely dependent on donors. Considering the
extremely low rate of oil consumption per capita (0.2 barrels per person per year according to the
World Bank (2012)), the ratios of oil import expenditures to total imports and total exports are very
high. Without a significant increase in export revenues, Malawi will be unable to afford to spend
increasing amounts on oil for much longer, given the need for other critical imports such as
fertilisers, machinery, etc. Should oil prices continue their upward trajectory over the coming
23
decade, Malawi may at some point have to begin reducing its already low consumption of oil
products.
6. Society
This section provides an overview of several important challenges facing Malawian citizens that are
relevant to understanding their potential vulnerabilities to oil price and supply shocks. It starts with
an introduction to the extent of poverty and inequality in Malawi, before looking at food insecurity
more specifically as a symptom of this poverty. Thereafter, an overview of human settlement
patterns is provided, and issues of social cohesion are discussed. Much of the data in this section has
been sourced from the 2011 Integrated Household Survey, the results of which have recently been
released.
6.1. Poverty and inequality
Malawi’s national poverty rate is 50.7%, which means that around half of its population is classified
as poor. There has been a slight decrease of 2% in this figure since 2004/2005, although there has
also been a slight increase in the percentage classified as “ultra-poor” over the same period.
Approximately 25% of the population is classified as ultra-poor, meaning that they cannot afford to
meet minimum daily food requirements. Only 6% of the country’s poor live in cities, and 17% of
urban populations are classified as poor compared to 57% in rural areas (National Statistical Office
2012:204-207).
The extent of poverty is indicated by the poverty gap, which is the average consumption shortfall of
the population group relative to the poverty line. At a national level, the poor live on 19% less than
the poverty line, and the ultra-poor live on 25% less than the ultra-poverty line (National Statistical
Office 2012:211-213). The poverty gap and ultra-poverty gap are highest in rural areas, and poverty
is worse in the Southern regions of Malawi than the Central and Northern regions.
24
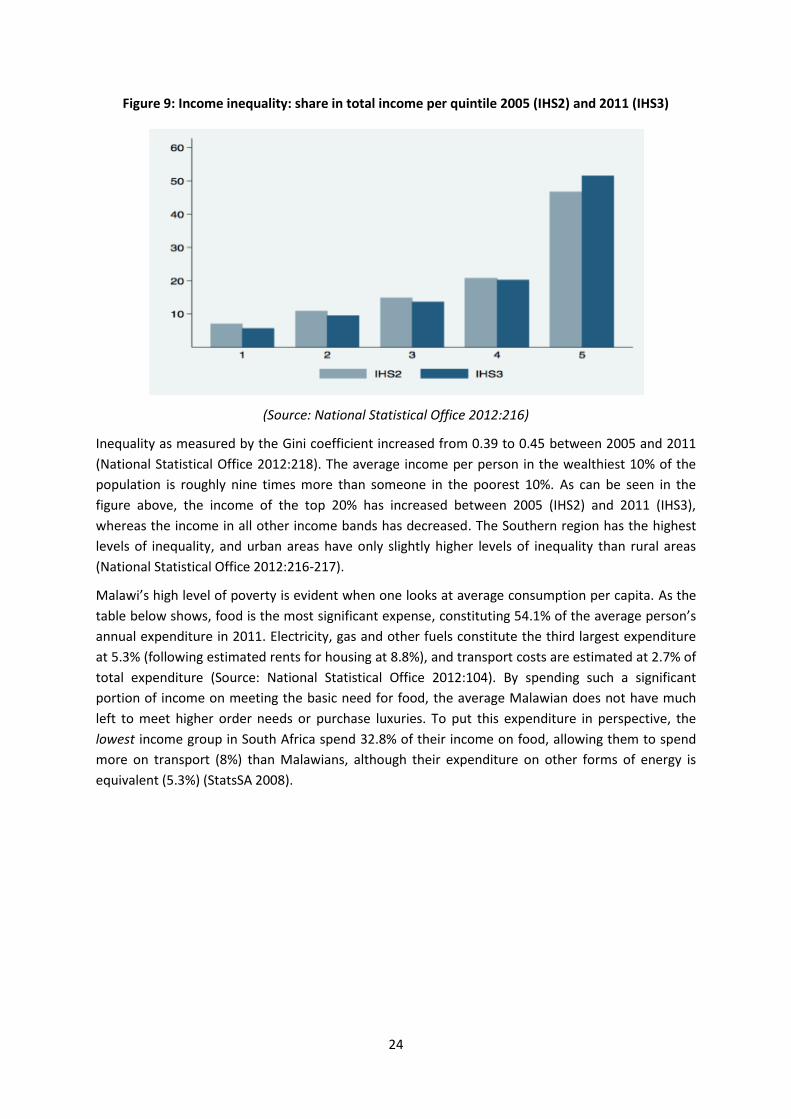
Figure 9: Income inequality: share in total income per quintile 2005 (IHS2) and 2011 (IHS3)
(Source: National Statistical Office 2012:216)
Inequality as measured by the Gini coefficient increased from 0.39 to 0.45 between 2005 and 2011
(National Statistical Office 2012:218). The average income per person in the wealthiest 10% of the
population is roughly nine times more than someone in the poorest 10%. As can be seen in the
figure above, the income of the top 20% has increased between 2005 (IHS2) and 2011 (IHS3),
whereas the income in all other income bands has decreased. The Southern region has the highest
levels of inequality, and urban areas have only slightly higher levels of inequality than rural areas
(National Statistical Office 2012:216-217).
Malawi’s high level of poverty is evident when one looks at average consumption per capita. As the
table below shows, food is the most significant expense, constituting 54.1% of the average person’s
annual expenditure in 2011. Electricity, gas and other fuels constitute the third largest expenditure
at 5.3% (following estimated rents for housing at 8.8%), and transport costs are estimated at 2.7% of
total expenditure (Source: National Statistical Office 2012:104). By spending such a significant
portion of income on meeting the basic need for food, the average Malawian does not have much
left to meet higher order needs or purchase luxuries. To put this expenditure in perspective, the
lowest income group in South Africa spend 32.8% of their income on food, allowing them to spend
more on transport (8%) than Malawians, although their expenditure on other forms of energy is
equivalent (5.3%) (StatsSA 2008).

25
Table 4: Mean consumption per person per year by type of consumption
Food 54.1%
Estimated rents for housing 8.8%
Electricity, gas, other fuels 5.3%
Phone & fax services 4.0%
Personal care 2.8%
Transport 2.7%
Clothing 2.4%
Alcohol 2.3%
Beverages 2.2%
Education 2.2%
Routine home maintenance 1.9%
Actual rents for housing 1.8%
Operation of vehicles 1.7%
Vehicles 1.2%
Vendors/Cafes/Restaurants 1.0%
Audio-visual 0.8%
Health out-patient 0.8%
Decorations, carpets 0.6%
Footwear 0.6%
Tools / equipment for home 0.5%
Appliances 0.4%
Health drugs 0.4%
Per capita textiles 0.3%
Dishes 0.2%
Health hospitalisation 0.2%
Newspapers, books, stationery 0.2%
Accommodation services 0.1%
Insurance 0.1%
Tobacco 0.1%
(Source: National Statistical Office 2012:104)
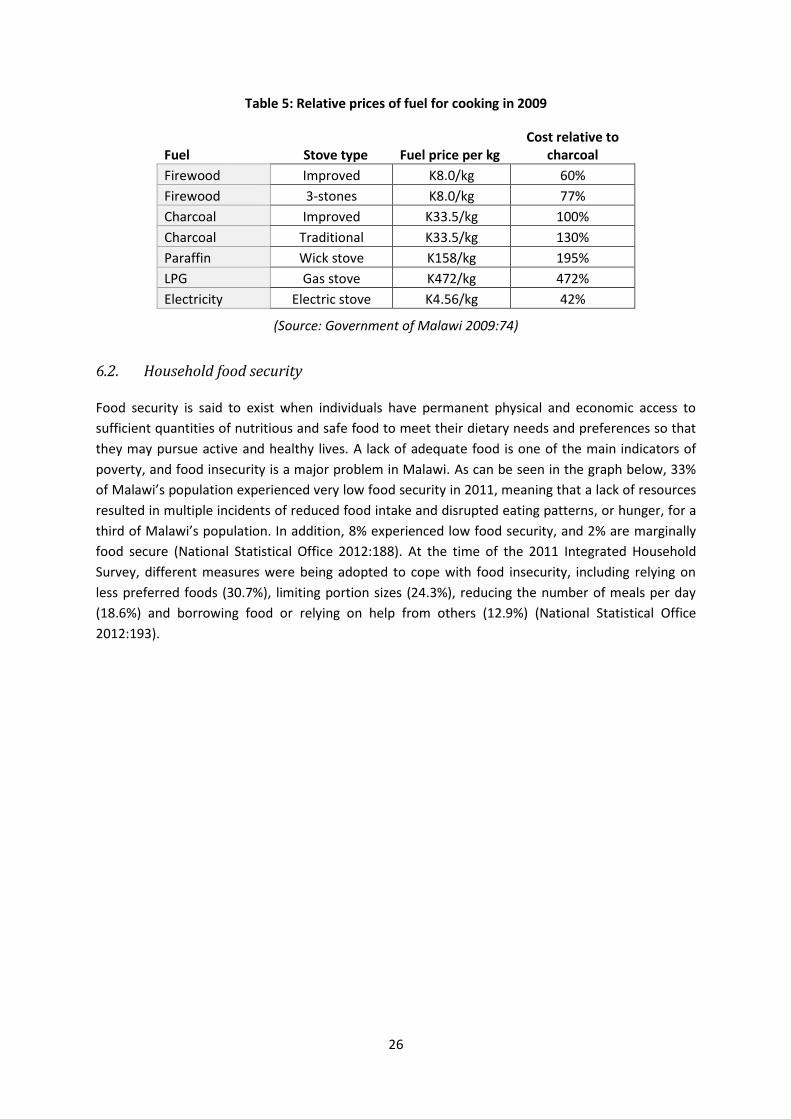
Low expenditure on energy is a function of suppressed demand and the availability of low cost
natural fuels in the form of firewood, charcoal and agricultural residues – not all of which are legal.
On average, households meet 98.1% of their energy needs from firewood, charcoal, agricultural
residues and dung, and fuels derived from oil – i.e. paraffin and LPG – constitute only 0.5%
Government of Malawi 2009:27). This is not surprising as LPG and paraffin cost 472% and 195% of
the cost of charcoal, whereas firewood costs between 60% and 77%. Electricity has the potential to
provide clean energy that costs only 42% of the cost of charcoal, but grid access is limited and this is
not currently an option for the majority of Malawians (Government of Malawi 2009:74). Oil shocks
are thus likely to have a relatively small impact on household energy costs or consumption.
26
Table 5: Relative prices of fuel for cooking in 2009
Fuel Stove type Fuel price per kg Cost relative to
charcoal
Firewood Improved K8.0/kg 60%
Firewood 3-stones K8.0/kg 77%
Charcoal Improved K33.5/kg 100%
Charcoal Traditional K33.5/kg 130%
Paraffin Wick stove K158/kg 195%
LPG Gas stove K472/kg 472%
Electricity Electric stove K4.56/kg 42%
(Source: Government of Malawi 2009:74)
6.2. Household food security
Food security is said to exist when individuals have permanent physical and economic access to
sufficient quantities of nutritious and safe food to meet their dietary needs and preferences so that
they may pursue active and healthy lives. A lack of adequate food is one of the main indicators of
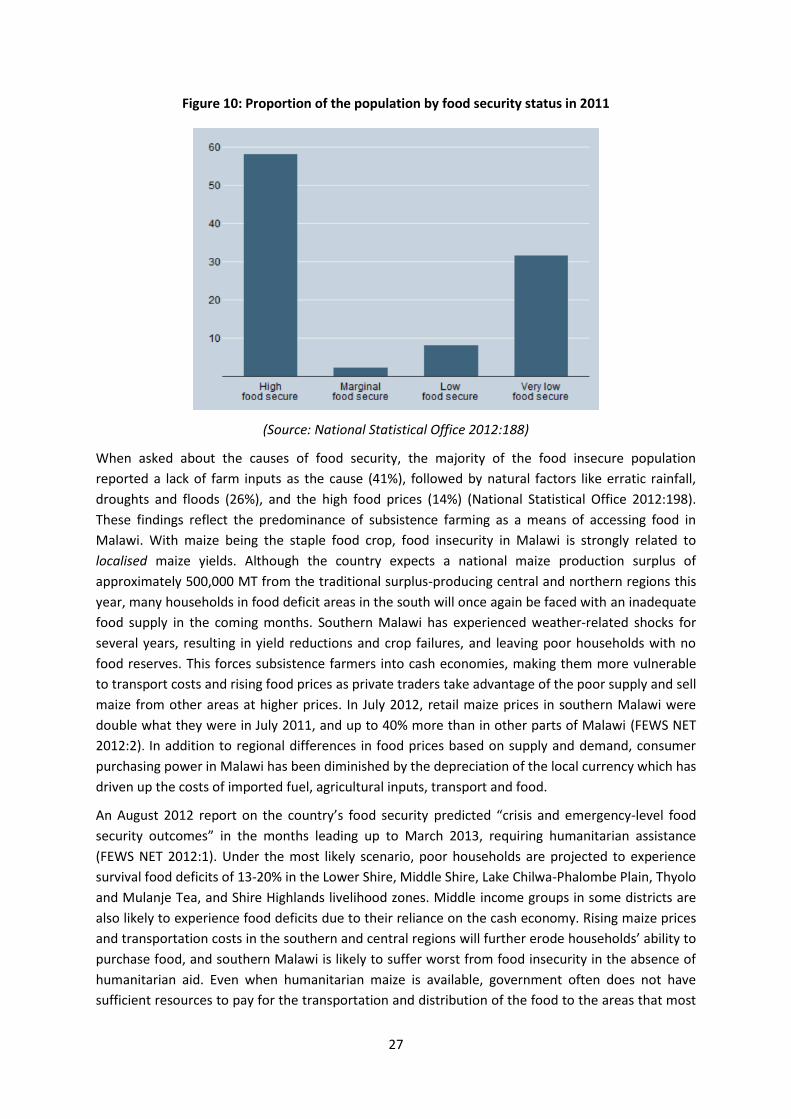
poverty, and food insecurity is a major problem in Malawi. As can be seen in the graph below, 33%
of Malawi’s population experienced very low food security in 2011, meaning that a lack of resources
resulted in multiple incidents of reduced food intake and disrupted eating patterns, or hunger, for a
third of Malawi’s population. In addition, 8% experienced low food security, and 2% are marginally
food secure (National Statistical Office 2012:188). At the time of the 2011 Integrated Household
Survey, different measures were being adopted to cope with food insecurity, including relying on
less preferred foods (30.7%), limiting portion sizes (24.3%), reducing the number of meals per day
(18.6%) and borrowing food or relying on help from others (12.9%) (National Statistical Office
2012:193).
27
Figure 10: Proportion of the population by food security status in 2011
(Source: National Statistical Office 2012:188)
When asked about the causes of food security, the majority of the food insecure population
reported a lack of farm inputs as the cause (41%), followed by natural factors like erratic rainfall,
droughts and floods (26%), and the high food prices (14%) (National Statistical Office 2012:198).
These findings reflect the predominance of subsistence farming as a means of accessing food in
Malawi. With maize being the staple food crop, food insecurity in Malawi is strongly related to
localised maize yields. Although the country expects a national maize production surplus of
approximately 500,000 MT from the traditional surplus-producing central and northern regions this
year, many households in food deficit areas in the south will once again be faced with an inadequate
food supply in the coming months. Southern Malawi has experienced weather-related shocks for
several years, resulting in yield reductions and crop failures, and leaving poor households with no
food reserves. This forces subsistence farmers into cash economies, making them more vulnerable
to transport costs and rising food prices as private traders take advantage of the poor supply and sell
maize from other areas at higher prices. In July 2012, retail maize prices in southern Malawi were
double what they were in July 2011, and up to 40% more than in other parts of Malawi (FEWS NET
2012:2). In addition to regional differences in food prices based on supply and demand, consumer
purchasing power in Malawi has been diminished by the depreciation of the local currency which has
driven up the costs of imported fuel, agricultural inputs, transport and food.
An August 2012 report on the country’s food security predicted “crisis and emergency-level food
security outcomes” in the months leading up to March 2013, requiring humanitarian assistance
(FEWS NET 2012:1). Under the most likely scenario, poor households are projected to experience
survival food deficits of 13-20% in the Lower Shire, Middle Shire, Lake Chilwa-Phalombe Plain, Thyolo
and Mulanje Tea, and Shire Highlands livelihood zones. Middle income groups in some districts are
also likely to experience food deficits due to their reliance on the cash economy. Rising maize prices
and transportation costs in the southern and central regions will further erode households’ ability to
purchase food, and southern Malawi is likely to suffer worst from food insecurity in the absence of
humanitarian aid. Even when humanitarian maize is available, government often does not have
sufficient resources to pay for the transportation and distribution of the food to the areas that most
28
need assistance (FEWS NET 2012:2). Future oil price or supply shocks would exacerbate these
problems.
6.3. Settlement patterns
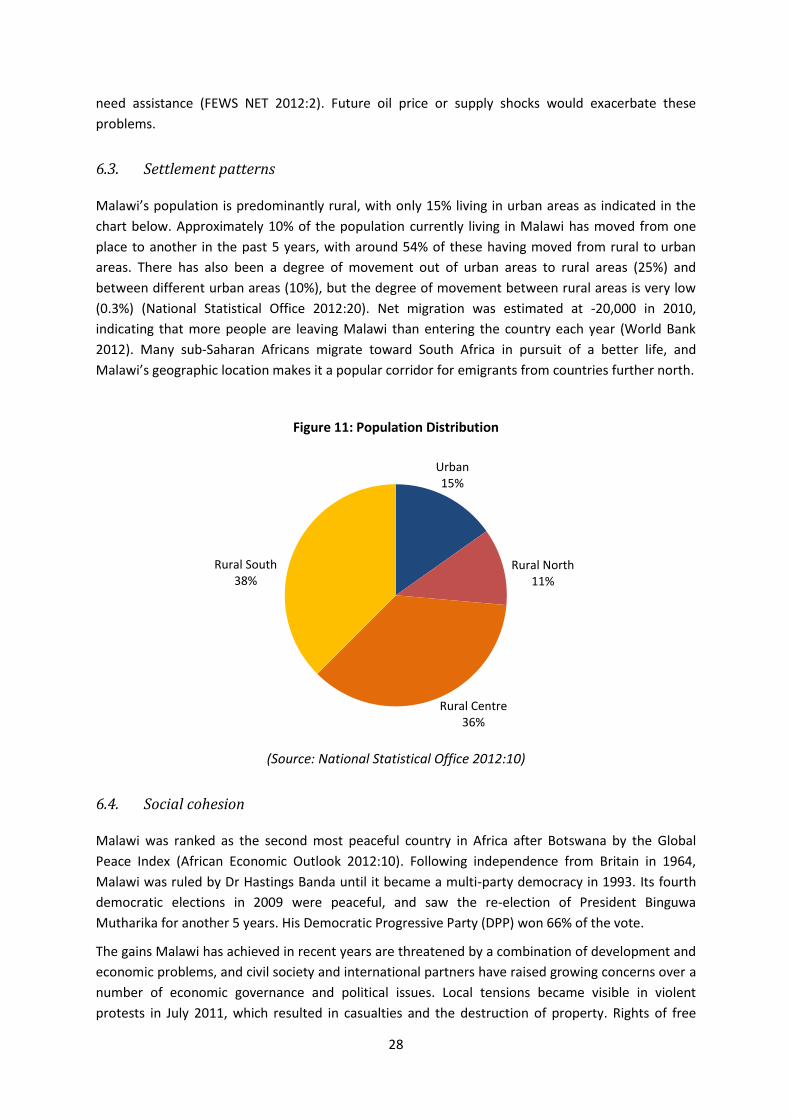
Malawi’s population is predominantly rural, with only 15% living in urban areas as indicated in the
chart below. Approximately 10% of the population currently living in Malawi has moved from one
place to another in the past 5 years, with around 54% of these having moved from rural to urban
areas. There has also been a degree of movement out of urban areas to rural areas (25%) and
between different urban areas (10%), but the degree of movement between rural areas is very low
(0.3%) (National Statistical Office 2012:20). Net migration was estimated at -20,000 in 2010,
indicating that more people are leaving Malawi than entering the country each year (World Bank
2012). Many sub-Saharan Africans migrate toward South Africa in pursuit of a better life, and
Malawi’s geographic location makes it a popular corridor for emigrants from countries further north.
Figure 11: Population Distribution
(Source: National Statistical Office 2012:10)
6.4. Social cohesion
Malawi was ranked as the second most peaceful country in Africa after Botswana by the Global
Peace Index (African Economic Outlook 2012:10). Following independence from Britain in 1964,
Malawi was ruled by Dr Hastings Banda until it became a multi-party democracy in 1993. Its fourth
democratic elections in 2009 were peaceful, and saw the re-election of President Binguwa
Mutharika for another 5 years. His Democratic Progressive Party (DPP) won 66% of the vote.
The gains Malawi has achieved in recent years are threatened by a combination of development and
economic problems, and civil society and international partners have raised growing concerns over a
number of economic governance and political issues. Local tensions became visible in violent
protests in July 2011, which resulted in casualties and the destruction of property. Rights of free
Urban 15%
Rural North 11%
Rural Centre 36%
Rural South 38%
29
speech and civil liberties were violated, and complaints of harassment and victimisation against the
government continued in the aftermath of the protests (African Economic Outlook 2012:10).
The protests were a manifestation of public outrage at corruption and economic decisions by
President Mutharika’s government which had resulted in the suspension of donor aid and shortages
of foreign exchange, impacting people on the ground in the form of a series of fuel shortages. The
IMF and local economic experts had repeatedly called on government to devalue the Malawian
Kwacha as a means of generating foreign exchange, but the government refused over concerns as to
the impact on costs of living. The President blamed the fuel shortages on private companies
responsible for the importation and distribution of fuel, who he claimed were more interested in
maximising profits than ensuring consistent supply. The establishment of a national oil company to
manage the purchasing of fuel and the construction of new oil storage facilities are expected to
reduce to the risk of future fuel shortages somewhat (Peak Oil 2011).
President Mutharika passed away in April 2012, and was succeeded by vice-president Joyce Banda.
She immediately instituted economic reform by devaluing the Kwacha by nearly 50% and untying it
from the dollar. In compliance with the IMF’s demands, the move was aimed at restoring
relationships with donor countries, boosting exports, improving the availability of foreign exchange
and shifting demand from imported products toward locally produced alternatives. In the wake of
the devaluation, prices of some basic items have increased by as much as 50%, and although fuel is
more readily available, prices have risen by 30%, pushing up the cost of public transport by around
40% (The Guardian 2012). Donors have responded with renewed pledges of support, but ordinary
Malawians will continue to suffer from higher costs of living until aid inflows resume.
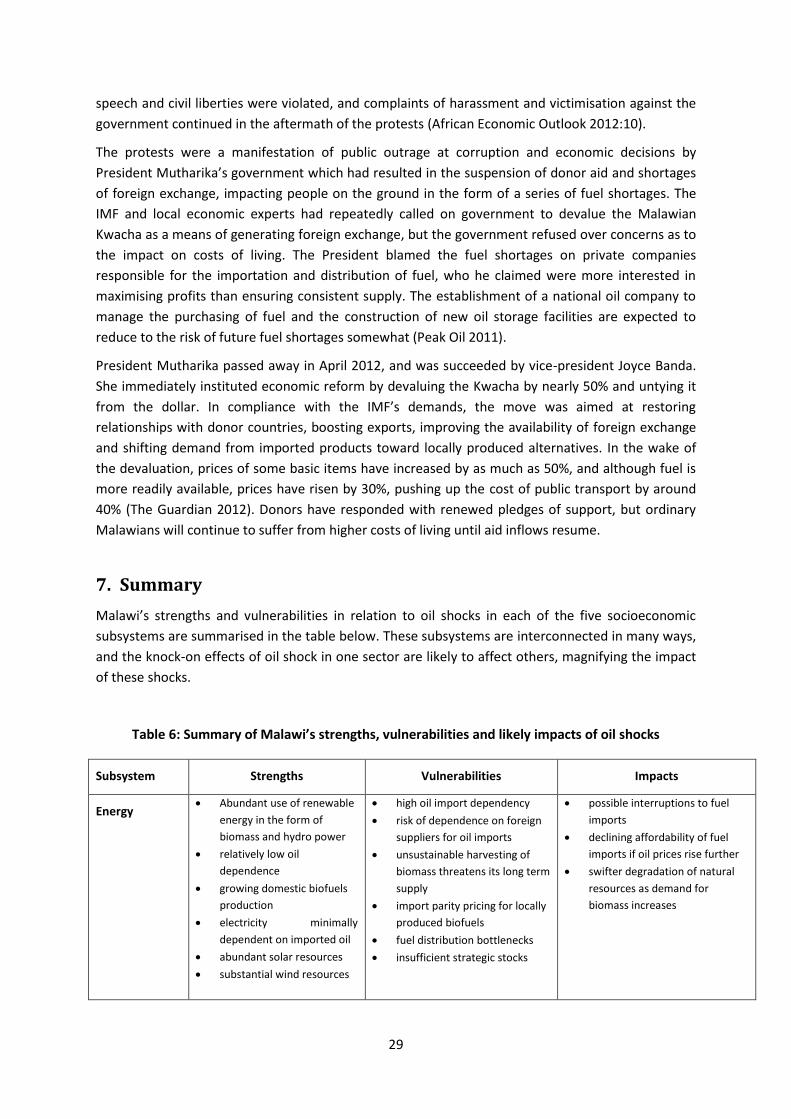
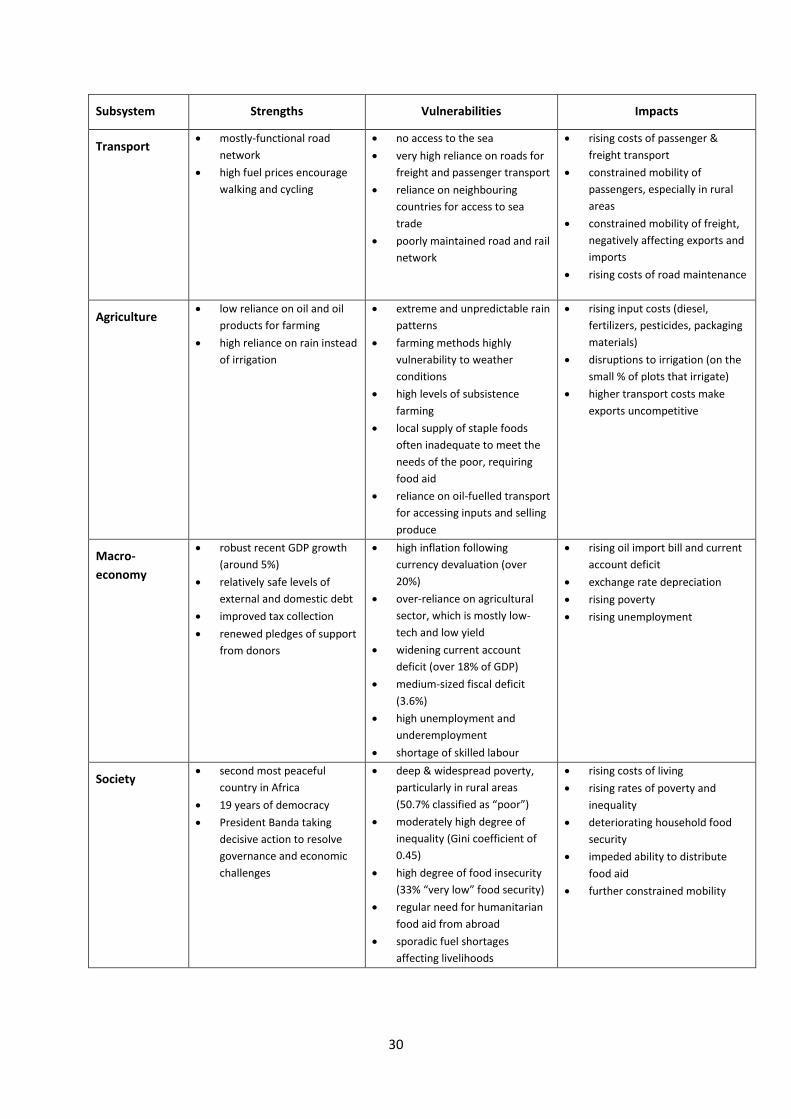
7. Summary
Malawi’s strengths and vulnerabilities in relation to oil shocks in each of the five socioeconomic
subsystems are summarised in the table below. These subsystems are interconnected in many ways,
and the knock-on effects of oil shock in one sector are likely to affect others, magnifying the impact
of these shocks.
Table 6: Summary of Malawi’s strengths, vulnerabilities and likely impacts of oil shocks
Subsystem Strengths Vulnerabilities Impacts
Energy Abundant use of renewable
energy in the form of
biomass and hydro power
relatively low oil
dependence
growing domestic biofuels
production
electricity minimally
dependent on imported oil
abundant solar resources
substantial wind resources
high oil import dependency
risk of dependence on foreign
suppliers for oil imports
unsustainable harvesting of
biomass threatens its long term
supply
import parity pricing for locally
produced biofuels
fuel distribution bottlenecks
insufficient strategic stocks
possible interruptions to fuel
imports
declining affordability of fuel
imports if oil prices rise further
swifter degradation of natural
resources as demand for
biomass increases
30
Subsystem Strengths Vulnerabilities Impacts
Transport mostly-functional road
network
high fuel prices encourage
walking and cycling
no access to the sea
very high reliance on roads for
freight and passenger transport
reliance on neighbouring
countries for access to sea
trade
poorly maintained road and rail
network
rising costs of passenger &
freight transport
constrained mobility of
passengers, especially in rural
areas
constrained mobility of freight,
negatively affecting exports and
imports
rising costs of road maintenance
Agriculture low reliance on oil and oil
products for farming
high reliance on rain instead
of irrigation
extreme and unpredictable rain
patterns
farming methods highly
vulnerability to weather
conditions
high levels of subsistence
farming
local supply of staple foods
often inadequate to meet the
needs of the poor, requiring
food aid
reliance on oil-fuelled transport
for accessing inputs and selling
produce
rising input costs (diesel,
fertilizers, pesticides, packaging
materials)
disruptions to irrigation (on the
small % of plots that irrigate)
higher transport costs make
exports uncompetitive
Macro-
economy
robust recent GDP growth
(around 5%)
relatively safe levels of
external and domestic debt
improved tax collection
renewed pledges of support
from donors
high inflation following
currency devaluation (over
20%)
over-reliance on agricultural
sector, which is mostly low-
tech and low yield
widening current account
deficit (over 18% of GDP)
medium-sized fiscal deficit
(3.6%)
high unemployment and
underemployment
shortage of skilled labour
rising oil import bill and current
account deficit
exchange rate depreciation
rising poverty
rising unemployment
Society second most peaceful
country in Africa
19 years of democracy
President Banda taking
decisive action to resolve
governance and economic
challenges
deep & widespread poverty,
particularly in rural areas
(50.7% classified as “poor”)
moderately high degree of
inequality (Gini coefficient of
0.45)
high degree of food insecurity
(33% “very low” food security)
regular need for humanitarian
food aid from abroad
sporadic fuel shortages
affecting livelihoods
rising costs of living
rising rates of poverty and
inequality
deteriorating household food
security
impeded ability to distribute
food aid
further constrained mobility
31
8. References
BP. 2011.Statistical Review of World Energy 2011. London: BP plc.
Chimwala, M. 2012. $8m jatropha-based biodiesel plant opens in Lilongwe. [Online]. Engineering
News.Available: www.engineeringnews(Accessed 22 October 2012).
Chimwala, M. 2012a. Malawi moves to build fuel reserves across three cities. Engineering
News.[Online]. Available: http://www.engineeringnews.co.za/article/malawi-fuel-2012-03-
30 (Accessed 11 November 2012).
Chimwala, M. 2012b. Malawi seeks to move ahead with wind project. Engineering News. [Online].
Available: http://www.engineeringnews.co.za/print-version/malawi-wind-2012-09-21
(Accessed 11 November 2012).
Chiyembekeza, C. 2012. Landlocked Malawi with many corridors. The Nation.[Online]. Available:
http://www.mwnation.com/business-news-the-nation/business-review/11592-landlocked-
malawi-with-many-corridors (Accessed 28 October 2012) .
DFID. 2012. Business Case: Malawi Agriculture Programme2011-2015. [Online].
Available:projects.dfid.gov.uk/iati/Document//3717092 (Accessed 12 November 2012).
EIA. 2012. International Energy Statistics. US Energy Information Administration. [Online]. Available:
http://www.eia.doe.gov/emeu/international/contents.html (Accessed 29 September 2012).
Ellis, F. & Manda, E. 2012. Seasonal food crises and policy responses: a narrative account of three
food security crises in Malawi. World Development, 40(7): 1407-1417.
Europa Regional Surveys of the World. 2012. Malawi: Physical and Social Geography. In Africa South
of the Sahara 2012. London: Routledge. 757-778.
Face of Malawi. 2012. Fuel shortage hits hard in Mzuzu [Online]. Available
http://www.faceofmalawi.com/2012/09/fuel-shortage-hits-hard-in-mzuzu/ (Accessed 12
November 2012).
Famine Early Warning Systems Network (FEWS NET). 2012. Malawi Food Security Outlook – August
2012 to March 2013. Lilongwe: FEWS NET.
Government of Malawi. 2009. Malawi Biomass Energy Strategy, 2009. Lilongwe: Government
Printer.
The Guardian. 2012. Malawians left counting rising cost of living following economic reform.
[Online]. Available: http://www.guardian.co.uk/global-
development/2012/may/25/malawians-counting-cost-economic-reform (Accessed 12
November 2012).
Khanje, T. 2012. ‘Malawi should have fuel reserves’. The Daily Times, 10 September.
Kojima, M. 2012. Oil price risks and pump price adjustments. [Online]. Available: http://www-
wds.worldbank.org/servlet/WDSContentServer/WDSP/IB/2012/10/15/000158349_2012101
5132748/Rendered/PDF/wps6227.pdf (Accessed 7 November 2012).
32
IRENA. 2012. Renewable Energy Country Profile: Malawi. [Online]. Available:
http://www.irena.org/REmaps/countryprofiles/africa/Malawi.pdf (Accessed 29 September
2012).
Masina, L. 2008. The great green fuel conversion. African Business, 344:70-71.
MERA. 2011. Renewable Energy Investment in Malawi. [Online]. Available:
http://www.naruc.org/international/Documents/14%20MALAWI-
%20RE%20Country%20Presentation%20March%202011.pdf (Accessed 29 September 2012).
MERA. 2010. 2009-2012 Strategic Plan. [Online]. Available:
http://www.meramalawi.mw/documents/2009_2012_strategic_plan.pdf (Accessed 29
September 2012).
Ministry of Agriculture and Food Security. 2011. Malawi Agricultural Sector Wide Approach: A
prioritised and harmonised Agricultural Development Agenda: 2011-2015. Lilongwe:
Government Printer.
National Statistical Office. 2005. Integrated Household Survey 2004-2005. Zomba: National Statistical
Office.
National Statistical Office. 2012. Integrated Household Survey 2010-2011 – Household Socio-
Economic Characteristics Report. Zomba: National Statistical Office.
National Statistical Office. 2012a. The Consumer Price Index – Time Series. [Online]. Available:
http://www.nso.malawi.net/index.php?option=com_content&view=article&id=156%3A-the-
consumer-price-index-time-series&catid=3&Itemid=37 (Accessed 12 November 2012).
Peak Oil. 2011. Malawi: Fuel shortages ignite violent nationwide protests. [Online]. Available:
http://peakoil.com/publicpolicy/malawi-fuel-shortages-ignite-violent-nationwide-protests/
(Accessed 12 November 2012).
PISCES. 2011. Laws and policies enabling the production of biofuels in Malawi. Available:
http://www.pisces.or.ke/sites/default/files/Pisces%20Working%20Brief%20No.%204%20Ma
lawi.pdf (Accessed 6 November 2012).
REEEP. 2012. Policy DB Details: Malawi (2012). [Online] Available:
http://www.reeep.org/index.php?id=9353&special=viewitem&cid=94 (Accessed 29
September 2012).
Reuters. 2012. Malawi says will not halt oil search in disputed lake. Available:
http://af.reuters.com/article/investingNews/idAFJOE87C05Y20120813 (Accessed 6
November 2012).
Roads Authority. 2010. The Roads Sector in Malawi. [Online]. Available:
https://www.afcap.org/Documents/The%20roads%20sector%20in%20Malawi.pdf (Accessed
29 September 2012).
Roads Authority. 2012. Quick Statistics. [Online].Available http://www.ra.org.mw/statistics.html
(Accessed 6 November 2012).
StatsSA. 2008. Income and Expenditure Survey 2005/2006. Pretoria. Statistics South Africa.
33
Sukali, Elvis. 2011. Malawi fuel shortages threaten village livelihoods. [Online].Available
http://www.oxfamblogs.org/southernafrica/?p=2677 (Accessed 12 November 2012).
Trading Economics. 2012. Agricultural machinery; tractors per 100 sq. km of arable land in Malawi.
[Online]. Available:http://www.tradingeconomics.com/malawi/agricultural-machinery-
tractors-per-100-sq-km-of-arable-land-wb-data.html (Accessed 12 November 2012).
United Nations. 2012. Cartographic Section. [Online]. Available:
http://www.un.org/Depts/Cartographic/english/htmain.htm (accessed 15 November 2012)
World Bank. 2013. World Databank. [Online]. Available:
http://databank.worldbank.org/data/home.aspx