oil spills in u.s. coastal waters: background,s3.amazonaws.com/zanran_storage/€¦ · and...
TRANSCRIPT

Congressional Research Service ˜ The Library of Congress
CRS Report for CongressReceived through the CRS Web
Order Code RL33705
Oil Spills in U.S. Coastal Waters: Background,Governance, and Issues for Congress
October 25, 2006
Jonathan L. RamseurEnvironmental Policy Analyst
Resources, Science, and Industry Division
Del
iver
ed b
yCQ
T OP
DOCS
ww
w.c
q.c
om

Oil Spills in U.S. Coastal Waters: Background, Governance, and Issues for Congress
Summary
During the past two decades, while U.S. oil imports and consumption havesteadily risen, oil spill incidents and the volume of oil spilled have not followed asimilar course. In general, the annual number and volume of oil spills have showndeclines — in some cases, dramatic declines. The 1989 Exxon Valdez spill inAlaskan waters played a large role in stimulating actions that contributed to thistrend, particularly the decrease in the annual spill volumes. The Exxon Valdez spillhighlighted the need for stronger legislation, inflamed public sentiment, and spurredCongress to enact comprehensive oil spill legislation, resulting in the Oil PollutionAct of 1990 (P.L. 101-380). This law expanded and clarified the authority of thefederal government and created new oil spill prevention and preparednessrequirements. Moreover, the 1990 legislation strengthened existing liabilityprovisions, providing a greater deterrent against spills. After 1990, spill volume fromoil tankers, the vessels that carry and have spilled the most oil, decreasedsignificantly.
Considering that U.S. oil consumption and oil imports have steadily increased,the trend of declining spill incidents and volume in past years is noteworthy. Yet,recent annual data indicate that the overall decline of annual spill events may havestopped. Both consumption and imports are projected to maintain upwardmovement, and the United States is expected to increase the proportion of itsimported oil. More oil-carrying vessels will be entering U.S. waters, and a higherpercentage of transported oil will likely travel by vessel. The threat of oil spills mayincrease if more oil is being transported into and around the nation. This increasedthreat raises the question of whether U.S. officials have the necessary resources athand to respond to a major spill. There is some concern that the favorable U.S. spillrecord has resulted in a loss of experienced personnel, capable of responding quicklyand effectively to a major oil spill. Moreover, the level of funding required torespond to such a spill, particularly its aftermath, may be currently inadequate,according to U.S. Coast Guard reports.
No oil spill is entirely benign. Even a relatively minor spill, depending on thetiming and location, can cause significant harm to individual organisms and entirepopulations. Marine mammals and bottom-dwelling species are especiallyvulnerable to a nearby spill. However, the effects of oil spills can vary greatly. Oilspills can cause impacts over a range of time scales, from only a few days to severalyears, or even decades in some cases.
This report reviews the history of oil spills, presents relevant data, and identifiesthe legal authorities governing oil spill prevention, response, and cleanup.
Del
iver
ed b
yCQ
T OP
DOCS
ww
w.c
q.c
om

Contents
Introduction . . . . . . . . . . . . . . . . . . . . . . . . . . . . . . . . . . . . . . . . . . . . . . . . . . . . . . 1
Background . . . . . . . . . . . . . . . . . . . . . . . . . . . . . . . . . . . . . . . . . . . . . . . . . . . . . . 2Oil Spills in U.S. Coastal Waters . . . . . . . . . . . . . . . . . . . . . . . . . . . . . . . . . . 2Impacts of Oil Spills in Aquatic Environments . . . . . . . . . . . . . . . . . . . . . . . 3
Acute Impacts . . . . . . . . . . . . . . . . . . . . . . . . . . . . . . . . . . . . . . . . . . . . 4Chronic Impacts . . . . . . . . . . . . . . . . . . . . . . . . . . . . . . . . . . . . . . . . . . . 4Ecosystem Recovery . . . . . . . . . . . . . . . . . . . . . . . . . . . . . . . . . . . . . . . 4
Economic Costs of Oil Spills . . . . . . . . . . . . . . . . . . . . . . . . . . . . . . . . . . . . . 5Cleanup Costs . . . . . . . . . . . . . . . . . . . . . . . . . . . . . . . . . . . . . . . . . . . . 5Natural Resources Damages . . . . . . . . . . . . . . . . . . . . . . . . . . . . . . . . . 5Other Economic Costs . . . . . . . . . . . . . . . . . . . . . . . . . . . . . . . . . . . . . . 6
Oil Spill Governance . . . . . . . . . . . . . . . . . . . . . . . . . . . . . . . . . . . . . . . . . . . . . . . 6Federal Authorities: Before and After the Exxon Valdez Spill . . . . . . . . . . . 7
Oil Pollution Act of 1990 . . . . . . . . . . . . . . . . . . . . . . . . . . . . . . . . . . . . 9Other Federal Laws . . . . . . . . . . . . . . . . . . . . . . . . . . . . . . . . . . . . . . . 14
International Conventions . . . . . . . . . . . . . . . . . . . . . . . . . . . . . . . . . . . . . . 15MARPOL 73/78 . . . . . . . . . . . . . . . . . . . . . . . . . . . . . . . . . . . . . . . . . . 16Intervention Convention . . . . . . . . . . . . . . . . . . . . . . . . . . . . . . . . . . . 16
Federal Agencies Responsibilities . . . . . . . . . . . . . . . . . . . . . . . . . . . . . . . . 17Federal Funding for the Oil Spill Liability Trust Fund . . . . . . . . . . . . . . . . 19State Laws . . . . . . . . . . . . . . . . . . . . . . . . . . . . . . . . . . . . . . . . . . . . . . . . . . 22
Threat of Future Oil Spills in U.S. Coastal Waters . . . . . . . . . . . . . . . . . . . . . . . 23Possibilities for Future Oil Spills . . . . . . . . . . . . . . . . . . . . . . . . . . . . . . . . . 23
U.S. Oil Imports and Possible Spills . . . . . . . . . . . . . . . . . . . . . . . . . . 24Domestic Oil Transportation and Possible Spills . . . . . . . . . . . . . . . . 26
Level of Preparedness . . . . . . . . . . . . . . . . . . . . . . . . . . . . . . . . . . . . . . . . . 27
Recent Legislative Activity . . . . . . . . . . . . . . . . . . . . . . . . . . . . . . . . . . . . . . . . . 28
Appendix: Additional Statistical Information Regarding Oil Spills . . . . . . . . . . 30Sources of Oil Inputs to U.S. Coastal Waters . . . . . . . . . . . . . . . . . . . . . . . 30Spills from Facilities and Pipelines . . . . . . . . . . . . . . . . . . . . . . . . . . . . . . . 31Spills from Oil Extraction Operations . . . . . . . . . . . . . . . . . . . . . . . . . . . . . 32
Del
iver
ed b
yCQ
T OP
DOCS
ww
w.c
q.c
om

List of Figures
Figure 1: Volume and Number of Oil Spills for Incidents Above 100 Gallons in U.S. Coastal Waters, 1973-2001 . . . . . . . . . . . . . . . . . . . . . . . . . . . . . . . . 2
Figure 2: Volume of Oil Spilled from Vessels into U.S. Coastal Waters, 1980-2001 . . . . . . . . . . . . . . . . . . . . . . . . . . . . . . . . . . . . . . . . . . . . . . . . . . . 3
Figure 3: Oil Spill Liability Trust Fund: Projected Annual Balances, FY2006-FY2014 . . . . . . . . . . . . . . . . . . . . . . . . . . . . . . . . . . . . . . . . . . . . . 20
Figure 4: U.S. Oil Imports and Consumption: Actual (1990-2005) and Projected (2010-2025) . . . . . . . . . . . . . . . . . . . . . . . . . . . . . . . . . . . . . . . . . 24
Figure 5: U.S. Imports by Mode of Transportation, 1995-2005 . . . . . . . . . . . . . 25Figure 6: Average Annual Distribution of U.S. Oil Imports, by Geographic
Region . . . . . . . . . . . . . . . . . . . . . . . . . . . . . . . . . . . . . . . . . . . . . . . . . . . . . 26Figure 7: Domestic Transportation of Crude Oil and Petroleum Products,
1990-2004 . . . . . . . . . . . . . . . . . . . . . . . . . . . . . . . . . . . . . . . . . . . . . . . . . . 27Figure A1. Percentage Contribution of Oil Inputs into North American
Coastal Waters, by Major Source Categories (based on average annual releases, 1990-1999) . . . . . . . . . . . . . . . . . . . . . . . . . . . . . . . . . . . . . . . . . . 30
Figure A2: Volume of Oil Spills into U.S. Coastal Waters from Facilities and Pipelines, 1980-2001 . . . . . . . . . . . . . . . . . . . . . . . . . . . . . . . . . . . . . . . 31
Figure A3: Annual Number of Spills to U.S. Waters from Facilities and Pipelines, 1980-2001 . . . . . . . . . . . . . . . . . . . . . . . . . . . . . . . . . . . . . . . . . . 32
Figure A4: Annual Oil Spill Volume for Spills Greater than 50 Gallons from Oil Exploration and Extraction Activities in the Federal Waters on the Outer Continental Shelf, 1985-2005 . . . . . . . . . . . . . . . . . . . . . . . . . 33
List of Tables
Table 1: Federal Agency Jurisdiction for Oil Spill Prevention and Preparedness Duties, by Source . . . . . . . . . . . . . . . . . . . . . . . . . . . . . . . . . . 18
Del
iver
ed b
yCQ
T OP
DOCS
ww
w.c
q.c
om

1 Note that the Exxon Valdez spill ranks only 35th for spill volume on the list of internationaltanker spills since 1967. See International Tanker Owners Pollution Federation Limited,Historical Data, at [http://www.itopf.com/stats.html]. 2 See National Research Council (NRC), Oil in the Sea III: Inputs, Fates, and Effects,National Academies of Science (hereinafter “NRC report”), February 2003, p. 11.3 In this report, “oil” refers to crude oil and petroleum products, including gasoline and otherfuels, unless stated otherwise.4 For the purposes of this report, “U.S. coastal waters” is defined broadly to encompass allwaters between the shore and the boundary of the U.S. exclusive economic zone (200nautical miles from shore). Note that in other documents, “coastal” may refer only to statewaters, but in this report, the term “coastal waters” includes state and federally regulatedwaters.
Oil Spills in U.S. Coastal Waters: Background, Governance, and Issues
for Congress
Introduction
Oil is the dominant source of energy in the United States, supplying the nationwith approximately 40% of its energy needs. Its use is widespread, providing fuelfor the transportation, industrial, and residential sectors. Vast quantities of oilcontinuously enter the country via vessel or pipeline and are then transported todestinations throughout the nation. With such widespread use and nonstopmovement, it is inevitable that some number of spills will occur. One continuingpolicy issue is whether the nation has the necessary resources and personnel in placeto respond to a major spill.
Several major U.S. oil spills have had lasting repercussions that transcended thelocal environmental and economic effects. The most notable example is the 1989Exxon Valdez spill, which released approximately 11 million gallons of crude oil intoPrince William Sound, Alaska. The Exxon Valdez spill — the largest and mostexpensive oil spill in U.S. waters to date1 — produced extensive consequencesbeyond Alaska. According to the National Academies of Science, the Exxon Valdezdisaster caused “fundamental changes in the way the U.S. public thought about oil,the oil industry, and the transport of petroleum products by tankers ... ‘big oil’ wassuddenly seen as a necessary evil, something to be feared and mistrusted.”2
This report focuses on oil spills3 in U.S. coastal waters.4 The first sectionhighlights background issues, including oil spill statistics and potentialenvironmental impacts. The second section discusses the legal framework thatgoverns oil spill prevention and response. The third section examines the threat ofD
eliv
ered
byCQ
T OP
DOCS
ww
w.c
q.c
om

CRS-2
5 P.L. 96-478, 33 U.S.C. 1901, et seq. These standards and the U.S. law are discussed laterin this report.
future oil spills in coastal waters and whether response personnel are prepared torespond to a major spill. The final section highlights legislative activity of the 109th
Congress.
Background
Oil Spills in U.S. Coastal Waters
While U.S. oil imports and consumption have steadily risen, oil spill incidentsand volume spilled have not followed a similar course (Figure 1). In general, oilspill events and the volume of oil released have declined over the past two decades;in some years, the declines have been dramatic.
Source: Prepared by CRS with data from the United States Coast Guard (USCG) Oil SpillCompendium, available at [http://www.uscg.mil/hq/g-cp/comrel/factfile/index.htm].
The decline of spill incidents is likely related, at least in part, to international oilpollution standards that went into effect in 1983. These new standards wereimplemented in the United States by the Act to Prevent Pollution from Ships.5 Thesubstantial drop in the annual spill volume is most attributable to the decline involume spilled by oil tankers and barges — the vessels that transport oil and havehistorically spilled the most oil. As shown in Figure 2, the volume of oil spilledfrom vessels in U.S. waters in the 1990s differed dramatically from the volumespilled in the 1980s. The Exxon Valdez spill of 1989 and the resulting Oil PollutionAct of 1990 (OPA) played key roles in the subsequent spill volume reduction. The1990 Act (discussed below) made comprehensive changes to U.S. oil pollution law
-
5,000,00010,000,000
15,000,00020,000,000
25,000,000
1973
1977
1981
1985
1989
1993
1997
2001
Gal
lon
s
-
1,000
2,000
3,000
4,000
Nu
mb
er of S
pills
Total Volume Spill Incidents
Figure 1: Volume and Number of Oil Spills for Incidents Above 100 Gallons in U.S. Coastal Waters, 1973-2001
Del
iver
ed b
yCQ
T OP
DOCS
ww
w.c
q.c
om

CRS-3
6 As of September 2006, Exxon has paid approximately $3 billion for the spill: $2 billionfor cleanup activities and $900 million in civil settlement (with a $100 million re-openerclause) for natural resource damages. A dispute over the amount of punitive damages is stillin the court system. This amount could be as high as $5 billion. See Exxon Valdez TrusteeOil Spill Trustee Council, at [http://www.evostc.state.ak.us/History/settlement_detail.htm].
7 NRC report, p. 4.
by expanding federal response authority and increasing spill liability. The high costsassociated with the Exxon Valdez spill,6 and the threat of broad liability imposed byOPA (in some scenarios, unlimited liability), have likely been the central drivers forthe spill volume decline seen in the 1990s.
Source: Prepared by CRS with data from the USCG Oil Spill Compendium.
The Appendix to this report contains additional information, including a furtherbreakdown of oil inputs in coastal waters by source category. The Appendix alsoprovides oil spill data and analysis specific to onshore facilities and pipelines, as wellas offshore oil extraction operations.
Impacts of Oil Spills in Aquatic Environments
No oil spill is entirely benign. Depending on timing and location, even arelatively minor spill can cause significant harm to individual organisms and entirepopulations.7 Oil spills can cause impacts over a range of time scales, from days toyears, or even decades for certain spills. Impacts are typically divided into acute(short-term) and chronic (long-term) effects. Both types are part of a complicatedand often controversial equation that is addressed after an oil spill: ecosystemrecovery.
-
2,000,000
4,000,000
6,000,000
8,000,000
10,000,000
12,000,000
14,000,000
19
80
19
82
19
84
19
86
19
88
19
90
19
92
19
94
19
96
19
98
20
00
Gal
lons
Tankers
Barges
Other Vessels
Figure 2: Volume of Oil Spilled from Vessels into U.S. Coastal Waters, 1980-2001
Del
iver
ed b
yCQ
T OP
DOCS
ww
w.c
q.c
om

CRS-4
8 These “sub-lethal” effects can occur at concentrations that are several orders of magnitudelower than concentrations that cause death. NRC report, p. 127.9 NRC report, p. 120.10 NRC report, p. 121.11 NRC report, p. 134.12 Emphasis added. NOAA, Prince William’s Oily Mess: A Tale of Recovery, (onlinedocument) at [http://www.oceanservice.noaa.gov].
Acute Impacts. Depending on the toxicity and concentration of the spill,acute exposure to oil spills can kill various organisms and cause the followingdebilitating (but not necessarily lethal) effects:8
! reduced reproduction,! stunted development,! impaired feeding mechanisms, and! decreased defense from disease.
In addition to the impacts to individual organisms, oil spills can lead to adisruption of the structure and function of the ecosystem. Certain habitats — suchas coral reefs, mangrove swamps, and salt marshes — are especially vulnerable,because the physical structure of the habitats depends upon living organisms. Thesepotential acute effects to individual organisms and marine ecosystems have been“unambiguously established” by laboratory studies and well-studied spills, such asthe Exxon Valdez.9
Chronic Impacts. Long-term, chronic exposure typically occurs fromcontinuous oil releases — leaking pipelines, offshore production discharges, and non-point sources (e.g., urban runoff). Although spills are normally associated with acuteimpacts, some oil spills have also demonstrated chronic exposure and effects.10
There is increasing evidence that chronic, low-level exposures to oil contaminantscan significantly affect the survival and reproductive success of marine birds andmammals.11 However, because of the complexity of factors, including a longer timeperiod and presence of other pollutants, determining the precise effects on speciesand ecosystems due to chronic oil exposure in a particular locale is difficult forscientists. As a result, studies involving chronic effects are often met with debate andsome controversy.
Ecosystem Recovery. Ecosystem recovery after an oil spill is difficult todefine, because interested parties often have differing opinions. At one end of thespectrum, local groups may demand that the ecosystem be returned to pre-spillconditions. However, according to the National Oceanographic AtmosphericAdministration (NOAA), scientists do not define recovery as a return to the preciseconditions that existed before the oil spill. Recovery, according to NOAA, is “theact, process or instance of bringing a habitat or ecosystem back to a normalcondition; or to save it from loss and restore it to usefulness.”12 This definitionleaves room for site-specific interpretation, which, in the case of the Exxon Valdezspill and cleanup, continues to generate considerable argument.
Del
iver
ed b
yCQ
T OP
DOCS
ww
w.c
q.c
om

CRS-5
13 The average cleanup cost is three times higher in the United States than in Europe (basedon 1997 data and excluding the Exxon Valdez costs). See, Etkin, Dagmar, “EstimatingCleanup Costs for Oil Spills,” paper presented at the 1999 International Oil SpillConference, 1999, citing data from the Oil Spill Intelligence Report International Oil SpillDatabase.14 This is primarily due to the fact that a spill of any size (e.g., in a sensitive area) willrequire that equipment and response experts be sent to the scene. See Etkin, Dagmar,“Estimating Cleanup Costs for Oil Spills,” paper presented at the 1999 International OilSpill Conference, 1999, p. 5.
Economic Costs of Oil Spills
The economic costs that can result from an oil spill can be broken into threecategories: cleanup expenses, natural resource damages, and the various economiclosses incurred by the affected community or individuals.
Cleanup Costs. The cleanup costs of an oil spill can vary greatly and areinfluenced by a mix of factors: location characteristics, oil type, and oil volume.Location is generally considered the most important factor because it involvesmultiple variables. Areas with less water movement, such as marshlands, willgenerally cost more to clean up than open water. Tourist destinations or sensitivehabitats, such as coral reefs, will likely require more stringent cleanup standards, thusincreasing the costs. The political and social culture at the spill site plays a part aswell. For instance, major oil spills, especially ones that affect shoreline ecosystems,are often met with extensive media coverage, placing pressure on parties to takeaction. Coupled with this pressure, authorities (federal or state) at these locationsmay require extensive oil spill response requirements, which can influence cleanupcost. The United States likely meets this description, because its average cleanupcost (per barrel of oil spilled) is considerably higher than in other parts of the world.13
The more persistent and viscous oil types, such as heavy crude, are moreexpensive to clean up. Gasoline and other lighter refined products may require onlyminimal cleanup action, because the spilled material will evaporate or disperserelatively quickly.
Compared with other factors, spill volume is less important. A major spill awayfrom shore will likely cost considerably less than a minor spill in a sensitive location.Certainly, the amount of oil spilled affects cleanup costs, because, all things beingequal, a larger spill will require a larger and more expensive cleanup effort.However, the relationship between cleanup costs and spill volume is not linear.Cleaning up a smaller spill is likely to cost more than a larger spill on a per-gallonbasis.14
Natural Resources Damages. This category of costs relates to theenvironmental impacts caused by an oil spill. Pursuant to OPA, the party responsiblefor an oil spill is liable for any loss of natural resources (fish, animals) and theservices provided by the resource (drinking water, recreation).
Del
iver
ed b
yCQ
T OP
DOCS
ww
w.c
q.c
om
CRS-6
15 See, for exampple, State of Ohio v. United States Department of the Interior, 880 F.2d432, 464 (D.C. Cir. 1989).16 Testimony of Rear Admiral Thomas Gilmour (U.S. Coast Guard), in U.S. Congress,House Committee on Transportation and Infrastructure Subcommittee on Coast Guard andMaritime Transportation, Implementation of the Oil Pollution Act, hearings, 109th Cong., 2nd
Sess., Apr. 27, 2006.
When a spill occurs, government representatives, known as trustees, conducta natural resource damage assessment to determine the extent of the harm. Naturalresource damage assessments have generated controversy in recent years, particularlyregarding the measurement of a resource’s passive-use value. A passive-use value(as opposed to a resource’s market value, such as commercial fishing or recreation)includes the preference of people who believe the resource should be protected forits own sake or preserved for future generations. Many have argued that includingpassive-use value in damage assessment leads to arbitrary or artificially highdamages. The counter-argument is that passive-use values must be included to assessthe full loss of a resource. This view has been affirmed in several court decisions.15
However, putting a precise dollar figure on the lost passive-use of a resource can bechallenging, and the primary method employed — contingent valuation — is oftencriticized. The contingent valuation method is essentially a survey in whichparticipants are asked, for example, how much they would pay (hypothetically) toprotect a resource. For more information on this method, see CRS Report RL30242,Natural Resources: Assessing Nonmarket Values through Contingent Valuation, byJoseph T. Breedlove and Ross W. Gorte.
Other Economic Costs. Oil spills can generate costs other than responseexpenses or damages to natural resources. An oil spill can disrupt business activitynear the spill, particularly businesses that count on the reputation of the localenvironment. For example, the local tourist industry may be affected. In some cases,a well-publicized oil spill can weaken the tourist industry near the spill site,regardless of the actual threat to human health created by the spill.
Local infrastructure and services can be disrupted by an oil spill. Port andharbor operations may be interrupted, altering the flow of trade goods. Power plantsthat use cooling water systems may need to temporarily cease operations. Forexample, the Salem Nuclear Plant — the second largest nuclear plant in the UnitedStates — was forced to halt activity due to a substantial oil spill (more than 250,000gallons) in the Delaware River in November 2004. The plant is seekingreimbursement for $57 million in lost profits.16
Oil Spill Governance
When the Exxon Valdez ran aground in March 1989, there were multiple federalstatutes, state statutes, and international conventions that dealt with oil discharges.The governing framework for oil spills in the United States remains a combinationof federal, state, and international authorities. Within this framework, several federalagencies have the authority to implement oil spill regulations. The framework and
Del
iver
ed b
yCQ
T OP
DOCS
ww
w.c
q.c
om

CRS-7
17 The official statutory name is the Federal Water Pollution Control Act, P.L. 92-500, asamended, codified at 33 U.S.C. 1251, et seq.18 P.L. 93-627, codified at 33 U.S.C. 1501, et seq.19 P.L. 93-153, codified at 43 U.S.C. 1651, et seq.20 P.L. 95-372, codified at 43 U.S.C. 1801, et seq.21 See EPA “National Contingency Plan Overview” at [http://www.epa.gov/oilspill/ncpover.htm].
primary federal funding process (the Oil Spill Liability Trust Fund) used to respondoil spills are described below.
Federal Authorities: Before and After the Exxon Valdez Spill
The following list highlights the primary federal authorities that were in effectwhen the Exxon Valdez spill occurred in 1989:
! Clean Water Act (1972):17 The Clean Water Act (CWA) representedthe broadest authority for addressing oil spills at the time of theExxon Valdez spill. Section 311 of the CWA establishedrequirements for oil spill reporting, response, and liability. The actalso created a fund (311 Fund), maintained by federalappropriations, that could be used for cleanup and natural resourcerestoration.
! Deepwater Port Act (1974):18 This statute addressed oil spills andliability issues at deepwater oil ports. The act also set up theDeepwater Port Fund to provide for prompt cleanup and compensatedamages above liability limits. The fund was financed by a per-gallon tax on oil transferred at a deepwater port.
! Trans-Alaska Pipeline Authorization Act (1973):19 This act coveredoil spills and liability relating to the Trans-Alaska Pipeline System(TAPS). Although the pipeline is constructed over land, spills fromit could reach coastal waters via inland rivers. The act created a trustfund, financed through a lessee fee, that could be used to respond tospills and damages from the pipeline.
! Outer Continental Shelf Lands Act Amendments (1978):20 This actestablished an oil spill liability structure and rules for oil extractionfacilities in federal offshore waters. With this legislation, Congresscreated the Offshore Pollution Fund, financed by a per-gallon fee onproduced oil, that could be used for oil spill cleanup and damages.
! National Oil and Hazardous Substances Pollution Contingency Plan(NCP): The NCP was first established in 1968, after U.S.policymakers observed the response to a 37-million-gallon oil tankerspill (Torrey Canyon) off the coast of England.21 The NCP containsthe federal government’s procedures for responding to oil spills and
Del
iver
ed b
yCQ
T OP
DOCS
ww
w.c
q.c
om

CRS-8
22 The NCP is codified at 40 CFR Part 300.23 See, for example, U.S. Congress, House Committee on Merchant Marine and Fisheries,Report accompanying H.R. 1465, Oil Pollution Prevention, Removal, Liability, andCompensation Act of 1989, 1989, H.Rept. 101-242, Part 2, 101st Cong., 1st sess., p. 32.24 The two agreements under consideration were the 1984 Protocols to the InternationalConvention on Civil Liability for Oil Pollution Damage and the Protocols to theInternational Fund for Compensation for Oil Pollution Damages. 25 A handful of other oil spills followed the Exxon Valdez in 1989 and 1990 (e.g.,the MegaBorg spilled 5 million gallons of oil in the Gulf of Mexico), further spurring congressionalaction.26 P.L. 101-380, primarily codified at U.S.C. 2701, et seq.
hazardous substance releases.22 Subsequent laws have amended theNCP, including the CWA in 1972 and the ComprehensiveEnvironmental Response, Compensation, and Liability Act(CERCLA or Superfund) in 1980.
After the Exxon Valdez spill, many observers23 described the above legalcollection as an ineffective patchwork. Arguably, each law had perceivedshortcomings (discussed below in the context of post-Exxon Valdez legislation), andnone provided comprehensive oil spill coverage.
For more than 15 years prior to the Exxon Valdez incident, Congress madeattempts to enact a unified oil pollution law. Several contentious issues produceddeadlocks, hindering the passage of legislation. One of the central points of debate,state preemption, dealt with whether a federal oil spill law should limit a state’sability to impose stricter requirements, particularly unlimited liability. Other liabilityquestions also generated debate. For example, if an oil spill occurred, should theowner of the cargo (i.e., oil) be held liable, as was the ship owner/operator? Anotherpoint of contention was whether oil-carrying vessels should be required to havedouble hulls. Although proponents argued that a second hull would help prevent oilspills, the shipping industry raised concern that implementing such a mandate woulddisrupt oil transportation and potentially affect the national economy. A final issueinvolved the interaction between domestic legislation (federal and state) andinternational measures. Some were concerned that if the United States became aparty to certain international agreements under consideration in the 1980s,24 theinternational standards would preempt federal and state laws, especially thoseestablishing liability limits. Proponents argued that these concerns were overstated,and stressed that joining the international agreements was especially important forthe United States because of the international nature of oil transportation andassociated pollution.
Following the 1989 Exxon Valdez spill, Members faced great pressure toovercome the disputes discussed above.25 The spill highlighted the inadequacies ofthe existing coverage and generated public outrage. The end result was the OilPollution Act of 1990 (OPA)26 — the first comprehensive law to specifically addressoil pollution to waterways and coastlines of the United States.
Del
iver
ed b
yCQ
T OP
DOCS
ww
w.c
q.c
om

CRS-9
27 See, for example, Wilkinson, Cynthia et al., “Slick Work: An Analysis of the Oil PollutionAct of 1990,” Journal of Energy, Natural Resources, and Environmental Law, 12 (1992),p. 190.28 See, Grumbles, Benjamin, and Manley, Joan, “The Oil Pollution Act of 1990: Legislationin the Wake of a Crisis,” Natural Resources and Environment, 10:2 (1995), p. 38.29 U.S. Congress, House Committee on Merchant Marine and Fisheries, Reportaccompanying H.R. 1465, Oil Pollution Prevention, Removal, Liability, and CompensationAct of 1989, 1989, H.Rept. 101-242, Part 2, 101st Cong., 1st sess., p. 84.30 OPA Section 1011.31 OPA Section 4202, amending Section 311(j) of the CWA.32 OPA Section 4201(b), amending Section 311(d)(2)(J) of the CWA.33 The response plan requirement is applicable only to an onshore facility that, because ofits location, could reasonably be expected to cause substantial harm to the environment bydischarging into navigable waters, adjoining shorelines, or the exclusive economic zone.
(continued...)
Oil Pollution Act of 1990. With the enactment of OPA on August 18, 1990,Congress consolidated the existing federal oil spill laws under one program. The1990 law expanded the existing liability provisions within the CWA and created newfree-standing requirements regarding oil spill prevention and response. Key OPAprovisions are discussed below.
Spill Response Authority. When responding to a spill, many considered thelines of responsibility under the pre-OPA regime to be unclear,27 with too muchreliance on spillers to perform proper cleanup.28 OPA strengthened and clarified thefederal government’s role in oil spill response and cleanup. OPA Section 4201amended Section 311(c) of the CWA to provide the President (delegated to theUSCG or EPA) with three options: perform cleanup immediately (“federalize” thespill), monitor the response efforts of the spiller, or direct the spiller’s cleanupactivities. The revised response authorities addressed concerns “that precious timewould be lost while waiting for the spiller to marshall its cleanup forces.”29
The federal government determines the level of cleanup required. Although thefederal government must consult with designated trustees of natural resources and thegovernor of the state affected by the spill, the decision that cleanup is completed andcan be ended rests with the federal government. States may require further work, butwithout the support of federal funding.30
National Contingency Plan. OPA expanded the role and breadth of theNCP. The 1990 law established a multi-layered planning and response system toimprove preparedness and response to spills in marine environments.31 Among otherthings, the act also required the President to establish procedures and standards (aspart of the NCP) for responding to worst-case oil spill scenarios.32
Tank Vessel and Facility Response Plans. As a component of theenhanced NCP, OPA amended the CWA to require that U.S. tank vessels, offshorefacilities, and certain onshore facilities33 prepare and submit oil spill response plans
Del
iver
ed b
yCQ
T OP
DOCS
ww
w.c
q.c
om

CRS-10
33 (...continued)CWA Section 311(j)(5)(iii). 34 OPA Section 4202, amending Section 311(j)(5)(E) of the CWA.35 U.S. Congress, House Committee on Merchant Marine and Fisheries, Reportaccompanying H.R. 1465, Oil Pollution Prevention, Removal, Liability, and CompensationAct of 1989, 1989, H.Rept. 101-242, Part 2, 101st Cong., 1st sess., p. 87. OPA Section 4202,amending Section 311(j)(5)(C)(iii) of the CWA. 36 Amendments Relating to the Oil Pollution Act of 1990, Title VII of Coast Guard andMaritime Transportation Act of 2004 (P.L. 108-293), codified at 33 U.S.C. 1321.37 Primarily the shipboard oil pollution emergency plans required by MARPOL 73/78,discussed later in this report.38 A study from the National Academy of Sciences reached this conclusion in 1999. SeeNational Research Council, Double hull Tanker Legislation: An Assessment of the OilPollution Act of 1990, National Academies of Science, 1999, p. 144.39 Opponents maintained that if water entered the space between hulls, the ship couldbecome unstable, hindering salvage and possibly capsizing. Wilkinson, Cynthia et al.,“Slick Work: An Analysis of the Oil Pollution Act of 1990,” Journal of Energy, NaturalResources, and Environmental Law, 12 (1992), p. 196.
to the relevant federal agency. In general, vessels and facilities are prohibited fromhandling, storing, or transporting oil if they do not have a plan approved by (orsubmitted to) the appropriate agency34 (see Table 1).
The plans should, among other things, identify how the owner or operator of avessel or facility would respond to a worst-case scenario spill. Congress did notintend for every vessel to have onboard all the personnel and equipment needed torespond to a worst-case spill, but vessels must have a plan and procedures to callupon — typically through a contractual relationship — the necessary equipment andpersonnel for responding to a worst-case spill.35
In 2004, Congress enacted an amendment requiring non-tank vessels (i.e., shipscarrying oil for their own fuel use) over 400 gross tons to prepare and submit a vesselresponse plan.36 Congress reasoned that many non-tank vessels have as much oilonboard as small tank vessels, thus presenting a comparable risk from an oil spill.Moreover, the international standards for oil spill prevention37 apply to tanker andnon-tanker vessels alike. Thus, the 2004 amendment brought the U.S. law more inline with international provisions.
Double-Hull Design for Vessels. The issue of double hulls receivedconsiderable debate for many years prior to OPA, and it was one of the stumblingblocks for unified oil spill legislation. Proponents maintained that double-hullconstruction provides extra protection if a vessel becomes damaged.38 However,opponents argued that a double-hulled vessel might cause stability problems if anaccident occurred, thus negating the benefits.39 Stakeholders also highlighted theimpacts that a double-hull requirement would entail for the shipping industry (e.g.,
Del
iver
ed b
yCQ
T OP
DOCS
ww
w.c
q.c
om

CRS-11
40 U.S. Congress, Conference Report accompanying H.R. 1465, Oil Pollution Act of 1990,1990, Conf.Rept. 101-653, 101st Cong., 2nd sess., pp. 140-141.41 OPA Section 4115, amending 46 U.S.C. 3703.42 This exception applied to many inland barges.43 Lightering is the process of transferring oil from a large vessel to a smaller vessel. Thiscommon practice occurs in designated areas that are typically many miles away from shore.44 The definition of “facility” is broadly worded and includes pipelines and motor vehicles.OPA Section 1001. 45 Under the pre-OPA regime (primarily the CWA), a discharge 12 miles beyond shore hadto affect the natural resources before liability attached. Under OPA Section 1002, thedischarge itself triggers liability. Wilkinson, Cynthia et al., “Slick Work: An Analysis ofthe Oil Pollution Act of 1990,” Journal of Energy, Natural Resources, and EnvironmentalLaw, 12 (1992), p. 201. 46 U.S. Congress, House Committee on Merchant Marine and Fisheries, Reportaccompanying H.R. 1465, Oil Pollution Prevention, Removal, Liability, and CompensationAct of 1989, 1989, H.Rept. 101-242, Part 2, 101st Cong., 1st sess., p. 31.47 OPA Section 1002(b)(1).
cost and time of retrofitting, ship availability).40 The OPA requirements for doublehulls reflected some of these concerns.
The act required new vessels carrying oil and operating in U.S. waters to havedouble hulls.41 However, OPA provided certain exceptions, depending on the sizeof the vessel (e.g., less than 5,000 gross tons)42 and its particular use (e.g.,lightering).43 For older vessels, OPA established a staggered retrofitting schedule,based on vessel age and size. Many of the age-based deadlines have already passed.By 2015 at the latest, the law requires that all oil-carrying vessels operating in U.S.waters have double hulls.
Liability Issues. OPA unified the liability provisions of existing oil spill law,creating a freestanding liability regime. Section 1002 states that responsible partiesare liable for any discharge of oil (or threat of discharge) from a vessel or facility44
to navigable waters, adjoining shorelines, or the exclusive economic zone45 of theUnited States (i.e., 200 miles beyond the shore).
Regarding the existing oil spill law prior to OPA, Congress recognized that“there is no comprehensive legislation in place that promptly and adequatelycompensates those who suffer other types of economic loss as a result of an oilpollution incident.”46 OPA broadened the scope of damages (i.e., costs) for whichan oil spiller would be liable. Under OPA, a responsible party is liable for allcleanup costs incurred, not only by a government entity, but also by a private party.47
In addition to cleanup costs, OPA significantly increased the range of liable damagesto include the following:
! injury to natural resources,! loss of personal property (and resultant economic losses),! loss of subsistence use of natural resources,
Del
iver
ed b
yCQ
T OP
DOCS
ww
w.c
q.c
om

CRS-12
48 OPA Section 1002(b)(2).49 Wilkinson, Cynthia et al., “Slick Work: An Analysis of the Oil Pollution Act of 1990,”Journal of Energy, Natural Resources, and Environmental Law, 12 (1992), p. 205.50 Section 107(b) of the Comprehensive Environmental Response, Compensation, andLiability Act (CERCLA, commonly known as Superfund), P.L. 96-510.51 In addition, liability limits are unavailable if the violation of a federal safety, construction,or operating requirement proximately caused the spill. Spillers must also report the incidentand cooperate with response officials to take advantage of the liability caps. OPA Section1004(c). 52 37,895 gross tons x $1,200/ton = $45.47 million. Vessel data from United States CoastGuard, Investigation into the Striking of Submerged Objects by the Tank Vessel Athos I inthe Delaware River on November 26, 2004 with a Major Discharge of Oil, January 2006,p. 4.53 Wilkinson, Cynthia et al., “Slick Work: An Analysis of the Oil Pollution Act of 1990,”Journal of Energy, Natural Resources, and Environmental Law, 12 (1992), p. 188.
! lost revenues resulting from destruction of property or naturalresource injury,
! lost profits resulting from property loss or natural resource injury;and
! costs of providing extra public services during or after spillresponse.48
OPA provided several defenses from liability: act of God, act of war, and act oromission of a third party. Although these defenses are more narrow than those foroil spills under the pre-OPA framework (primarily the CWA),49 they are similar tothose of the Superfund statute,50 established in 1980 for releases of hazardoussubstances.
Except for certain behavior, including acts of gross negligence or willfulmisconduct,51 OPA set liability limits (or caps) for cleanup costs and other damages.Liability limits for vessels are based on vessel carrying capacity, generally $1,200 pergross ton. As an example, the liability limit for the 2004 Athos tanker spill inDelaware River was approximately $45 million.52 Offshore facility liability is cappedat $75 million; onshore facilities and deepwater port liability is limited to $350million. These limits are much higher than under the pre-OPA liability structure.
OPA required the President to issue regulations to adjust the liability limits atleast every three years to take into account changes in the consumer price index(CPI). Despite this requirement, adjustments to liability limits were not made untilJuly 2006. The Coast Guard and Maritime Transportation Act of 2006 (P.L. 109-241) amended OPA, increasing limits to $1,900/gross ton for double-hulled vesselsand $3,000/gross ton for single-hulled vessels.
The Oil Spill Liability Trust Fund. Prior to OPA, federal funding for oilspill response was generally considered inadequate,53 and damage recovery was
Del
iver
ed b
yCQ
T OP
DOCS
ww
w.c
q.c
om

CRS-13
54 U.S. Congress, House Committee on Merchant Marine and Fisheries, Reportaccompanying H.R. 1465, Oil Pollution Prevention, Removal, Liability, and CompensationAct of 1989, 1989, H.Rept. 101-242, Part 2, 101st Cong., 1st sess., p. 35.55 Omnibus Budget Reconciliation Act of 1986 (P.L. 99-510).56 The CWA Section 311(k) revolving fund; the Deepwater Port Liability Fund; the Trans-Alaska Pipeline Liability Fund; and the Offshore Oil Pollution Compensation Fund.57 Omnibus Budget Reconciliation Act of 1989 (P.L. 101-239). Other revenue sources forthe fund include interest on the fund, cost recovery from the parties responsible for thespills, and any fines or civil penalties collected.
difficult for private parties.54 To help address these issues, Congress established theOil Spill Liability Trust Fund (OSLTF).
Pursuant to Executive Order (EO) 12777, the USCG created the NationalPollution Funds Center (NPFC) to manage the trust fund in 1991. The fund may beused for several purposes:
! prompt payment of costs for responding to and removing oil spills;
! payment of the costs incurred by the federal and state trustees ofnatural resources for assessing the injuries to natural resourcescaused by an oil spill, and developing and implementing the plansto restore or replace the injured natural resources;
! payment of parties’ claims for uncompensated removal costs, and foruncompensated damages (e.g., financial losses of fishermen, hotels,and beachfront businesses);
! payment for the net loss of government revenue, and for increasedpublic services by a state or its political subdivisions; and
! payment of federal administrative and operational costs, includingresearch and development, and $25 million per year for the CoastGuard’s operating expenses.
Although Congress created the OSLTF in 1986,55 Congress did not authorize itsuse or provide its funding until after the Exxon Valdez incident. In 1990, OPAprovided the statutory authorization necessary to put the fund in motion. ThroughOPA, Congress transferred other federal liability funds56 into the OSLTF. Incomplementary legislation, Congress imposed a 5-cent-per-barrel tax on the oilindustry to support the fund.57 Collection of this fee ceased on December 31, 1994,due to a sunset provision in the law. However, in April 2006, the tax resumed asrequired by the Energy Policy Act of 2005 (P.L. 109-58). The level of funding in thetrust fund is discussed below.
Financial Responsibility. To preserve the trust fund and ensure thatresponsible parties can be held accountable for oil spill cleanup and damages, OPArequires that vessels maintain evidence of financial responsibility (e.g., insurance).
Del
iver
ed b
yCQ
T OP
DOCS
ww
w.c
q.c
om

CRS-14
58 And in accordance with Executive Order 11735 (Aug. 3, 1973), granting EPA theauthority to regulate non-transportation-related onshore and offshore facilities. 59 U.S. EPA, “Oil Pollution Prevention: Non-Transportation Related Onshore and OffshoreFacilities,” Federal Register, vol. 38, no. 237 (Dec. 11, 1973), pp. 34164-34170.60 EPA offered several regulatory amendments after the 1973 rulemaking. Following OPAin 1991, the agency proposed substantial changes and clarifications that were not made finaluntil 2002. However, the effective date of the 2002 final rule has been extended four times;the current effective date is October 31, 2007.61 CWA Section 311(j)(1)(C).62 See 40 CFR Section 112.1.
The National Pollution Funds Center carries out this mandate by issuing Certificatesof Financial Responsibility (COFRs) to shipping vessel owners when ownersdemonstrate the ability to pay for oil spill cleanup and damages. In general, vesselsover 300 gross tons are required to have a valid COFR to operate in U.S. waters.
Other Federal Laws. Although OPA is the primary domestic legislation foroil spills, other federal laws contain provisions that relate to oil spills. Many of theseprovisions were in place before OPA. The following list is not all-inclusive, but ithighlights the main requirements authorized by laws other than OPA.
Clean Water Act. Section 311(j)(1) of the 1972 CWA called for regulationsto prevent the discharge of oil from vessels, onshore facilities, and offshore facilities.Pursuant to this statutory requirement,58 the EPA crafted regulations59 for spillprevention control and countermeasure (SPCC) plans in 1973, some of which arescheduled to go into effect October 31, 2007.60 SPCC plans address the “procedures,methods, and equipment and other requirements for equipment to preventdischarges.”61 The EPA’s SPCC plans apply only to non-transportation, onshorefacilities that exceed a certain oil storage capacity and that, in the event of a spill, canbe reasonably expected, because of their location, to produce an oil discharge thatwould reach navigable waters or adjoining shorelines of the United States.62 Unlikeother oil spill preparedness provisions, SPCC plans focus more on prevention thanon response activities, requiring, for example, secondary containment (e.g., dikes,berms) for oil-storage equipment.
Outer Continental Shelf Lands Act. The primary federal law governingoil development and operations in federal waters is the Outer Continental ShelfLands Act (OCSLA) of 1953 and its subsequent amendments. The OCSLA providedthe foundation for regulations (30 CFR Part 250) that are implemented by theMinerals Management Service (MMS). Sections of the MMS regulations address oilspill prevention and response issues by requiring that various equipment andprocedures be in place at offshore facilities. For more information, see CRS ReportRL33404, Offshore Oil and Gas Development: Legal Framework, by Jon O.Shimabukuro.
Pipeline Legislation. The U.S. pipeline network is extensive. Recentestimates indicate there are more than 33,000 miles of pipelines just in the Gulf ofD
eliv
ered
byCQ
T OP
DOCS
ww
w.c
q.c
om

CRS-15
63 See, for example, MMS Press Release from Feb. 2, 2005, at [http://www.mms.gov/ooc/press/2005/press0202.htm].64 For a comprehensive list of federal maritime legislation see USCG, Marine SafetyManual, Vol. IX (undated), Chapter 1, available at [http://www.uscg.mil/hq/g-m/nmc/pubs/msm/vol9.pdf].65 For example, the Rivers and Harbors Act of 1899, as amended (33 U.S.C. 401, et seq.),and the International Regulations for Preventing Collisions at Sea, as amended (33 U.S.C.1601, et seq.).66 P.L. 92-340, 33 U.S.C. 1221, et seq.67 P.L. 95-474, codified at 33 U.S.C. 1221-1232 and 46 U.S.C. 3701-3718.68 If a treaty is considered “self-executing,” domestic legislation implementing the treatyis not necessary. For more details on these issues, see CRS Report RL32528, InternationalLaw and Agreements: Their Effect Upon U.S. Law, by Michael John Garcia and ArthurTraldi.
Mexico.63 Moreover, U.S. inland pipelines are concentrated in coastal areas,particularly in the Gulf states, and these pipelines may have an impact on coastalwaters if spills reach waterways that empty into coastal waters.
Several laws govern oil pipelines. The Hazardous Liquid Pipeline Act of 1979(P.L. 96-129) granted authority to the Department of Transportation (DOT) toregulate various issues regarding oil spills from pipelines. Within the DOT, theOffice of Pipeline Safety (OPS) implements provisions concerning pipeline design,construction, operation and maintenance, and spill response planning. For furtherinformation on pipeline legislation, see CRS Report RL33347, Pipeline Safety andSecurity: Federal Programs, by Paul W. Parfomak.
Vessel Legislation. Several federal laws directly or indirectly deal with oilpollution from vessels.64 Laws concerning navigation reduce the possibilities ofvessel collision or hull breach by objects in the waterways.65 Other laws call forparticular vessel design standards. For example, the Ports and Waterways Safety Actof 1972,66 amended by the Port and Tanker Safety Act of 1978,67 called for specificconstruction and equipment design requirements for oil tankers. (As noted, OPAsubsequently amended this statute in 1990 by establishing a phased-in schedule fordouble-hulled tankers.) Congress enacted the 1970s legislation to coincide withinternational initiatives. In fact, many of the federal laws concerning vessel standardsand pollution control procedures were written to implement internationalconventions. These laws are discussed in the next section.
International Conventions
The relationship between international and domestic law can be complex. Ingeneral, international conventions (i.e., treaties), when signed by the United Statesand (if necessary) ratified by the Senate, are on equal footing with federal law.Parties to such conventions must often implement domestic legislation to carry outthe provisions outlined in the convention. Several of the federal laws governing oilspills were fashioned in this manner.68
Del
iver
ed b
yCQ
T OP
DOCS
ww
w.c
q.c
om

CRS-16
69 For convention texts and other materials, see [http://www.imo.org]. 70 The phrase “entry into force” signifies that the requisite number of nations have ratifiedthe convention or annex, thus making the agreed upon requirements binding for allparticipating nations. For more discussion of the procedures of international conventions,see the IMO website at [http://www.imo.org].71 All vessels of any type over 400 gross tons traveling over international waters must havea SOPEP approved by their flag state. See USCG VRP/SOPEP “FAQs” at[http://www.uscg.mil/vrp]. 72 USCG, 1997, Marine Safety Manual, Marine Environment Protection, Volume IX, p. 4-24.73 P.L. 96-478, 33 U.S.C. 1901, et seq.74 The Torrey Canyon, a Liberian-flagged tanker, spilled approximately 35 million gallons
(continued...)
International conventions have played an important role in developing consistentstandards for oil-carrying vessels from different nations. A primary player in thisregard is the International Maritime Organization (IMO), a body of the UnitedNations, which sets international maritime vessel safety and marine pollutionstandards. The Coast Guard represents the United States at IMO meetings.
Multiple international conventions concern vessels and their impact on themarine environment. The two conventions described below are the most relevant tooil pollution in coastal waters.
MARPOL 73/78. The IMO implements the 1973 International Convention forthe Prevention of Pollution from Ships, as modified by the Protocol of 1978(MARPOL 73/78).69 Vessels whose nations are signatories to MARPOL are subjectto its requirements, regardless of where they sail, and member nations are responsiblefor the vessels registered under their flag.
MARPOL 73/78 includes six annexes, each covering a different pollution type.Annex I (Prevention of Pollution by Oil) entered into force in 198370 and establishedrequirements for controlling oil discharges to sea. Annex I requires vessels to haveequipment that minimizes oil discharge, such as oil-water separators, and shipboardoil pollution emergency plans (SOPEPs). Although the SOPEP applicability issimilar to that of the vessel response plan (VRP) required by OPA,71 the purpose ofthe SOPEP is somewhat different. A SOPEP is intended to provide guidance to thevessel’s officers regarding proper onboard emergency procedures when an oil spilloccurs,72 whereas the VRP is more focused on responding to the spill itself.
The United States implements Annex I through the Act to Prevent Pollutionfrom Ships (APPS).73 APPS applies to all U.S.-flagged ships, irrespective oflocation, and to all foreign-flagged vessels in U.S. waters or at ports under U.S.jurisdiction. The USCG issues and enforces regulations necessary to carry out theAPPS provisions. The USCG inspection program is a key component of its oil spillprevention effort.
Intervention Convention. The 1967 Torrey Canyon spill off the coast ofGreat Britain was one of the first major spills to receive worldwide attention.74 The
Del
iver
ed b
yCQ
T OP
DOCS
ww
w.c
q.c
om

CRS-17
74 (...continued)of crude oil.75 P.L. 93-248 , 33 U.S.C. 1471, et seq.76 Most state waters extend 3 nautical miles (1 nautical mile = 6,076 feet, or 1.15 miles)from shore. Louisiana waters extend 3 imperial nautical miles (1 imperial nautical mile =6,080 feet). Texas and Gulf Coast of Florida waters extend 3 marine leagues (equating to9 nautical miles). See the MMS, OCS, website (“Definitions and Jurisdictions”) at[http://www.mms.gov/incidents/pollution.htm]. 77 The terms inland and coastal are defined in the National Contingency Plan (40 CFRSection 300.5). The coastal zone covers all waters subject to the tide, the Great Lakes, andall seaward waters (extending 200 nautical miles beyond shore). The inland zone covers allother U.S. waters. Spills in inland waters can potentially affect coastal waters andecosystems, particularly if the spill occurs in water systems near the coast. In fact, a fineline may separate specific inland and coastal waters (e.g., consider the nexus between a bay
(continued...)
incident raised many questions regarding oil spill response, particularly when dealingwith vessels from other nations. For example, the incident prompted debate overactions allowable if a nation’s waters and environment are threatened by a spill fromanother nation’s vessel. The 1969 International Convention Relating to Interventionon the High Seas in Cases of Oil Pollution Casualties (the Intervention Convention)sought to address these issues.
To implement this convention in the United States, Congress passed theIntervention on the High Seas Act of 1974.75 Under this act, if the USCG determinesthere to be a “grave and imminent danger to the coastline or related interests of theUnited States from pollution or threat of pollution of the sea by convention oil [i.e.,as defined in the convention],” the USCG can take action to “prevent, mitigate, oreliminate that danger.”
Federal Agencies Responsibilities
Unlike most countries, the United States shares jurisdiction over its territorialseas (0-12 nautical miles from shore) with its coastal states. The 1953 SubmergedLands Act (SLA) gave coastal states jurisdiction over the submerged lands, waters,and natural resources (e.g., oil deposits) located, in most cases, within three nauticalmiles off the coastline.76 The waters, seabed, and natural resources beyond the states’waters are exclusively federal, and extend to the edge of the exclusive economic zone(200 nautical miles from shore). However, the federal government maintains theauthority to regulate commerce, navigation, national defense, power production, andinternational affairs within state waters. For more discussion on state and federaljurisdictional issues, see CRS Report RL32912, Federal-State Maritime BoundaryIssues, by Laura Welles, Aaron M. Flynn, and Eugene H. Buck.
The oil spill legal framework involves implementation by multiple federalagencies. Agency responsibilities can be divided into two categories: (1) oil spillresponse and cleanup and (2) oil spill prevention/preparedness. Responsibility foroil spill response is determined by the location of the spill: the USCG has responseauthority in coastal waters, and the EPA responds to inland oil spills.77 As the
Del
iver
ed b
yCQ
T OP
DOCS
ww
w.c
q.c
om

CRS-18
77 (...continued)and a river).78 Executive Order (EO) 12777 (Oct. 18, 1991) delegates authorities pursuant to the OilPollution Act of 1990. This order was amended by EO 13286 (Mar. 5, 2003), whichreorganized duties in response to the creation of the Department of Homeland Security.79 There is only one deepwater port in U.S. coastal waters: the Louisiana Offshore Oil Port(LOOP).80 For further discussion on federal pipeline jurisdiction, see National Research Council,Improving the Safety of Marine Pipelines, National Academies of Science, 1994, pp. 86-89.
primary response authority in coastal waters, the USCG has the ultimate authority toensure that an oil spill is effectively removed and actions are taken to prevent furtherdischarge from the source. During response operations, the USCG coordinates theefforts of federal, state, and private parties.
Regarding oil spill prevention and preparedness duties, jurisdiction isdetermined by the potential sources (e.g., vessels, facilities, pipelines) of oil spills.A series of executive orders (EOs), coupled with memoranda of understanding(MOU), have established the various agency responsibilities.78 Table 1 identifies theagencies responsible for implementing prevention and preparedness regulations forthe potential sources of oil spills.
Table 1: Federal Agency Jurisdiction for Oil Spill Prevention andPreparedness Duties, by Source
Potential Source of Oil Spill Responsible Agency
Vessels USCG
Onshore, non-transportation facilities EPA
Onshore, transportation facilities USCG and Department of Transportation(DOT)
Deepwater ports79 USCG and DOT
Offshore facilities (oil/gas extraction) Minerals Management Service (MMS)within the Department of Interior
Offshore pipelines directly associatedwith oil extraction activities (i.e.,“production lines”)80
MMS
Offshore pipelines not directlyassociated with oil extractionactivities (i.e., “transmission lines”)
Office of Pipeline Safety (OPS) within theDOT
Inland pipelines OPS
Del
iver
ed b
yCQ
T OP
DOCS
ww
w.c
q.c
om

CRS-19
81 As required by OPA Section 4202(a), which amended CWA Section 311(j)(7), codifiedin 33 U.S.C. 1321(j)(7).82 Energy Policy Act of 2005 (P.L. 109-58). Congress also raised the ceiling from $1 billionto $2.7 billion for when the tax would temporarily expire. Under the original tax legislation(Omnibus Budget Reconciliation Act of 1989 (P.L. 101-239), the per-barrel tax would besuspended in any calendar quarter if the fund balance reached $1 billion, restarting again ifit dipped below that number. The 2005 act increased this threshold to $2.7 billion.83 Coast Guard and Maritime Transportation Act of 2006 (P.L. 109-241). 84 USCG, Report on the Oil Spill Liability Trust Fund, May 2005, p. 11.85 The President may issue a major disaster declaration under the Robert T. Stafford DisasterRelief and Emergency Assistance Act (the Stafford Act) and invoke federal authorities andresources, as occurred in response to Hurricane Katrina. For more on this issue, see CRSReport RL33053, Federal Stafford Act Disaster Assistance: Presidential Declarations,Eligible Activities, and Funding, by Keith Bea.86 The most recent publications from the NPFC, which manages the OSLTF, do not providean estimate because of this uncertainty. However, a background document that was offeredat an April 27, 2006, hearing stated, “the Coast Guard had estimated these costs couldexceed $800 million” (House Subcommittee on Coast Guard and Maritime Transportation,Hearing on the Implementation of the Oil Pollution Act). A recent discussion (Sept. 22,2006) with an NPFC official suggests this estimate is possibly overstated.
Prevention responsibilities include, among other things, assessing whetherfacilities or vessels have the necessary equipment in place. As discussed above,vessels may be required to have double hulls; facilities may need secondarycontainment. Preparedness duties involve oversight tasks, such as evaluating facilityand vessel response plans. In addition, OPA requires agencies to conduct internalexaminations to test preparedness.81 As part of this requirement, the USCG conductsSpills of National Significance (SONS) exercises to analyze the Coast Guard’s abilityto respond to a major oil spill.
Federal Funding for the Oil Spill Liability Trust Fund
In recent years, the level of funding for the trust fund has created some concern.Prior to two separate actions by the 109th Congress, the trust fund was particularlyvulnerable. In the first session, Congress reinstated the 5-cent-per-barrel tax on oil,thus providing a dedicated source of revenue for the trust fund.82 In the secondsession, Congress raised the vessel liability limits, thus requiring the responsibleparty to pay a greater proportion of the oil spill costs.83 Before these changes, fundmanagers projected the fund would be completely depleted by FY2009.84 With therecent legislation in effect, the most current projection indicates that the fund willreach $1 billion by FY2014, the year the tax is currently set to expire (Figure 3).However, this projection does not account for possible claims arising from oil spillsassociated with Hurricane Katrina. Although the federal response costs were coveredunder the Disaster Relief Fund,85 private parties can seek reimbursement from thetrust fund for cleanup or other costs (e.g., damage to property) that exceed theirliability limits. The possible number and value of these potential claims remainuncertain.86
Del
iver
ed b
yCQ
T OP
DOCS
ww
w.c
q.c
om

CRS-20
87 See U.S. Department of Homeland Security, U.S. Coast Guard, California SONS 2004:After Action Report, pp. 46 and A-7. 88 The Exxon Valdez has been renamed the Sea River Mediterranean, and its logistics canbe found at the USCG Port State Information Exchange database at [http://cgmix.uscg.mil/PSIX/].89 This assumes that the owner/operator can take advantage of the liability limits providedby OPA (e.g., obeyed relevant regulations and did not act with “gross negligence or willfulmisconduct “). OPA Section 1004(c). 90 Except for emergency funds available to federal officials, the trust fund distributes moniesthrough a claims process. Persons who have incurred cleanup costs or suffered damagesfrom an oil spill may submit a claim for reimbursement from the trust fund. This includesresponsible parties who have reached their respective liability limits. For more details on
(continued...)
Source: Prepared by CRS with data from the National Pollution Funds Center (as of Aug. 17, 2006).
Note: The projections assume there will not be any claims associated with spills caused by HurricaneKatrina.
Regardless of the possible Katrina-related claims, and even considering thesubstantial enhancements made by the 109th Congress, the trust fund remainsvulnerable to a major spill. After conducting the two most recent Spills of NationalSignificance (SONS) exercises (in 2002 and 2004), the Coast Guard observed thata major spill can exceed the available resources in the trust fund.87 As a referencepoint, the Exxon Valdez spill tallied approximately $2 billion in cleanup costs and $1billion in natural resource damages. If an accidental oil spill from a vessel matchingthe size of the Exxon Valdez (95,000 gross tons)88 were to occur, the vessel liability(under the new limits) would be capped at either $285 million (single-hull) or $181million (double hull).89 Cleanup costs and damages in excess of the liability limitscould be covered by the trust fund.90 OPA Section 900191 established per-incident
0
200
400
600
800
1000
1200
2006 2007 2008 2009 2010 2011 2012 2013 2014
Mil
lio
ns
of
Do
llar
s
Figure 3: Oil Spill Liability Trust Fund: Projected Annual Balances, FY2006-FY2014
Del
iver
ed b
yCQ
T OP
DOCS
ww
w.c
q.c
om

CRS-21
90 (...continued)this process, see the National Pollution Fund Center’s website at [http://www.uscg.mil/npfc/About%20Us/claims_adjudication.htm].91 Codified in 26 U.S.C. 9509.92 The Bush Administration maintained an analogous view of the “polluter pays” principlein the context of whether or not to reinstate the Superfund tax on the chemical and oilindustry. See CRS Report RL31410, Superfund Taxes or General Revenues: FutureFunding Issues for the Superfund Program, by Jonathan L. Ramseur, Mark Reisch, andJames E. McCarthy.
expenditure caps: no more than $1 billion (or the maximum amount available in thefund) for all eligible costs, and no more than $500 million for natural resourcedamages. The fund currently has about $637 million and is projected to have slightlymore than $1 billion by 2014 (see Figure 3). Thus, a major spill, particularly one ina sensitive environment, could threaten the viability of the fund, possibly depletingit entirely.
There are several options that Congress might consider to address thispossibility. First, Congress could maintain the status quo. If a major oil spilldepleted the fund, Congress could replenish the fund through the appropriationsprocess. Thus, general treasury revenues would finance a (possibly significant)portion of the spill response and natural resource restoration. Second, Congresscould increase the 5-cent-per-barrel oil tax to more quickly raise the fund’s balancecloser to its ceiling of $2.7 billion. A fully funded OSLTF would be more capableof absorbing the costs in excess of a spiller’s liability limit. Third, Congress couldfurther increase the liability limits for vessels, so that the responsible party would berequired to pay a greater portion of the total spill cost before accessing trust funddollars.
The above options spotlight a central consideration for policymakers: whoshould pay for the costs associated with a major, accidental oil spill? The first optionspreads the costs among all taxpayers. Some groups may contend this conflicts withthe “polluter pays” principle. However, there are two interpretations of this principle.The broader view holds that the relevant industry should bear the environmental coststhat may develop during the course of business. A different interpretation of the“polluter pays” principle finds that only the responsible party should pay. One withsuch a view might conclude that the second option is overreaching and unfair,because it spreads the costs across the entire industry instead of on the actualresponsible party.92
There are likely many economic policy arguments both for and against anadditional per-barrel tax on oil. For instance, some groups may claim that anadditional oil barrel tax will be reflected in higher energy costs (gasoline, homeheating oil) for consumers, which could disproportionately affect lower-incomehouseholds. (In general, these types of tax policy debates are beyond the scope ofthis report.) However, policymakers might consider whether any negativeconsequences from an additional tax on industry would outweigh the potentialbenefits of allocating the costs to the oil industry.
Del
iver
ed b
yCQ
T OP
DOCS
ww
w.c
q.c
om

CRS-22
93 CRS Report (out-of-print), Liability Provisions in State Oil Spill Laws: A Brief Summary,Oct. 1, 1990.94 In fact, one argument against preemption was that existing requirements under particularstate laws would be diminished or negated entirely. See Benjamin Grumbles and JoanManley, “The Oil Pollution Act of 1990: Legislation in the Wake of a Crisis,” NaturalResources and Environment, 10:2 (1995), p. 38. 95 U.S. Congress, Conference Report accompanying H.R. 1465, Oil Pollution Act of 1990,1990, Conf.Rept. 101-653, 101st Cong., 2nd sess., p. 122.96 Ray v. Atlantic Richfield, 435 U.S. 151 (1978).97 United States v. Locke, 529 U.S. 89 (2000).
The third option would help preserve the trust fund by increasing the liabilitylimit of the spiller. Setting liability limits is a challenge because lawmakers mustapportion the risk of a costly, accidental spill fairly between the responsible party andthe trust fund. The shipping industry would likely argue that a further increase wouldbe disruptive due to the cost of maintaining additional financial assurance.Considering that the limits were increased substantially in July 2006, this optionmight be the least feasible.
State Laws
Prior to the passage of OPA in 1990, 28 states had oil spill liability laws, 19 ofwhich imposed unlimited liability.93 During the 15 years prior to OPA’s passage, theissue of whether or not to preempt state liability laws was perhaps the primaryobstacle to enacting unified oil spill legislation. Proponents of preemption arguedthat differing state laws — particularly the various levels of liability — frustrate theshipping industry and are contrary to the goal of comprehensive federal legislation.Preemption opponents maintained that states should be allowed (as with most otherfederal environmental statutes) to set stiffer standards regarding liability,compensation, and cleanup.94 In the aftermath of the Exxon Valdez spill, the scalestipped to the side of anti-preemption. According to OPA Section 1018 (referred toas a “savings clause”), the act will not preempt any state from imposing additionalliability or requirements with respect to the discharge of oil or related responseactivity (e.g., cleanup standards).
There was some concern that the language of OPA’s savings clause would allowstates to regulate matters typically reserved for the federal government, such as oiltanker construction. To address this issue, the conference report stated that thesavings clause would not disturb a 1978 Supreme Court decision that dealt with theintersection of federal and state authority to regulate the shipping industry.95 In thatcase, the Court invalidated a Washington State law that had attempted to govern oiltanker design, size, and movement in Puget Sound.96
Regardless of the clarification in the conference report, the line between federaland state jurisdiction continues to be tested. In 2000, the Supreme Court struck downa Washington State rule calling for various personnel requirements, such as training,on oil tankers.97 Similarly, in July 2006, a federal district court in MassachusettsD
eliv
ered
byCQ
T OP
DOCS
ww
w.c
q.c
om

CRS-23
98 United States v. Massachusetts, 440 F. Supp. 2d 24 (D. Mass. 2006).99 Energy Information Administration (EIA), Annual Energy Outlook 2006 (hereinafter EIA2006 Report), February 2006, p. 6, at [http://www.eia.doe.gov/oiaf/aeo/pdf/0383(2006).pdf].100 EIA 2006 Report, p. 11.101 The increase in U.S. oil consumption may have started even earlier. The EIA historicaldata only go back to 1981. EIA online petroleum statistics, “Total Crude and PetroleumProducts Supplied,” (historical data), at [http://www.eia.doe.gov].102 See USCG Oil Spill Compendium.
ruled against a state law that would govern logistics, such as tanker design, personnelqualifications, and navigation.98
Threat of Future Oil Spills in U.S. Coastal Waters
This section examines the threat of future oil spills in coastal waters byassessing the possibilities for such spills, including spill location and oil type (crudeversus refined product) and the nation’s level of preparedness (or readiness) forresponding to a major spill.
Possibilities for Future Oil Spills
Oil is expected to remain the dominant source of energy in the United States forat least the next several decades.99 Oil consumption is expected to increase: theDepartment of Energy estimates that daily petroleum consumption in the UnitedStates will rise from 20.76 million gallons to 27.57 million gallons by 2030 (Figure4).100 With this steady rise in oil consumption, more oil will be transported from thewell (domestic or international) to the refinery, and ultimately to the consumer. Theincreased oil transportation suggests that the possibilities for oil spills may increase.
Nonetheless, a greater potential for spills does not necessarily correspond witha higher spill frequency. U.S. oil consumption has been steadily rising for at leasttwo decades,101 during which time the number of oil spills in coastal waters hasdeclined (see Figure 1). However, the most recent annual data suggest that thedecline has halted, as annual numbers have remained fairly consistent. Between 1997and 2001 (the most recent five-year span for which data are available), the annualnumber of spills in coastal waters from all combined sources remained consistent,averaging 393 incidents per year.102 Assuming other variables (e.g., level ofprevention and preparedness) remain constant, the annual numbers of spills may takean upward turn.
Del
iver
ed b
yCQ
T OP
DOCS
ww
w.c
q.c
om

CRS-24
103 Barring a few exceptions, single-hull vessels over 5,000 gross tons may not operate inU.S. waters after January 1, 2010. Single-hull vessels below 5,000 gross tons (chieflybarges) and other previously excepted vessels (e.g., lightering vessels or those upgradedwith double-sides or bottoms) must have double hulls by January 1, 2015. OPA Section4115 (codified at 46 U.S.C. 3703a).104 See, for example, National Research Council, Improving the Safety of Marine Pipelines,National Academies of Science, 1994, p. 45, and Epstein, Paul (editor), Oil: A Life CycleAnalysis of its Health and Environmental Impacts, Harvard Medical School’s Center forHealth and the Global Environment, March 2002, p. 21.
Source: Prepared by CRS with data from the following: actual import data (1990-2005) from EnergyInformation Administration (EIA) online statistics, at [http://www.eia.doe.gov], and projected importdata (2010-2025) and all consumption data from EIA Annual Energy Outlook 2006 (tables 11 and 91,respectively).
However, these other variables are not constant and are likely to play a role inthe oil spill equation. Oil vessel upgrades (i.e., double hulls) are still ongoing: twoimportant deadlines, 2010 and 2015,103 will yield a higher percentage of double-hulled vessels in U.S. waters. These improvements should help keep the number ofspills low. On the other hand, the nation’s oil pipeline infrastructure is old, and insome (perhaps many) areas, pipelines are operating well beyond their intendedservice life.104 The United States will obtain its oil from a combination of domesticand foreign sources. The ratio of this mix and the method of its delivery could playa role in the number and volume of oil spills in the coming years. The followingsections discuss this delivery system and its implications for oil spills in greaterdetail.
U.S. Oil Imports and Possible Spills. The volume and proportion ofimported oil, compared with oil produced domestically, may play a role in thefrequency and location of oil spills. Transportation of oil into the United States fromforeign nations has steadily risen and is projected to continue increasing (Figure 4).
0
2,000,000
4,000,000
6,000,000
8,000,000
10,000,000
1990 1995 2000 2005 2010 2015 2020 2025
Thou
sand
s of
Bar
rels
Imports Consumption
Figure 4: U.S. Oil Imports and Consumption: Actual (1990-2005) and Projected (2010-2025)
Del
iver
ed b
yCQ
T OP
DOCS
ww
w.c
q.c
om

CRS-25
105 Approximately 16% of total U.S. oil imports come from Canada. Energy InformationAssociation, Petroleum Statistics, U.S. Imports by Country of Origin, available at[http://www.eia.doe.gov]. 106 Although most crude oil (62%) enters the United States through the Gulf, most of thepetroleum products (70%) enter through ports on the east coast. EIA online statistics(Imports by Area of Entry), available at [http://www.eia.doe.gov].107 USCG Spill Compendium, Cumulative Data And Graphics For Oil Spills (1973-2001),at [http://www.uscg.mil/hq/g-cp/comrel/factfile/index.htm].
-
1,000,000
2,000,000
3,000,000
4,000,000
5,000,000
6,000,00019
95
1996
1997
1998
1999
2000
2001
2002
2003
2004
2005
Th
ou
san
ds
of
Bar
rels
Pipeline Imports
Vessel Imports
Figure 5: U.S. Imports by Mode of Transportation, 1995-2005
Oil imports are expected to increase, not only in volume but also in proportion todomestically produced oil. Most of this increase will be reflected in increased tankvessel traffic. Only Canada delivers oil by pipeline to the United States. AlthoughCanada is the leading single source of U.S. oil imports,105 the vast majority of U.S.oil imports arrive via vessel. (See Figure 5.)
Source: Prepared by CRS with data from EIA online statistics (U.S. Imports by Country of Origin),at [http://www.eia.doe.gov].
Notes: Pipeline imports represent imports from Canada; vessel imports are from all other nations.
Most of the U.S. oil imports (55%) arrive via the Gulf Coast (Figure 6).106 Ofthe oil spills within the Coast Guard’s jurisdiction (i.e., marine and coastal areas),approximately 50% of the incidents and the volume spilled have occurred in the Gulfof Mexico and its shoreline states.107 The Gulf will likely remain an area of specialattention, because the number of vessels arriving with oil will increase in comingyears.
Del
iver
ed b
yCQ
T OP
DOCS
ww
w.c
q.c
om

CRS-26
108 Note that using this unit of measure is different from using volume alone. With thismeasure, distance traveled is as important a factor as volume. 109 Alaskan crude oil production yielded 647,309 barrels in 1990 but declined to 315,420barrels by 2005 (EIA website, Petroleum, “Crude Oil Production”). 110 The total value increased from 873 billion ton miles in 2000 to 903 billion ton miles in2004.111 The degree of increase for oil transportation within the continental United States isuncertai, because the segregated data are not readily available.
Source: Prepared by CRS with data from EIA online statistics (Imports by Area of Entry), availablevia [http://www.eia.doe.gov].
Note: The above reflects an average of the years 2000-2005.
Domestic Oil Transportation and Possible Spills. Although U.S.imports and consumption increased over the past 15 years, total domestictransportation of crude oil and petroleum products (measured in billions of tonmiles)108 declined by 16% during this time (Figure 7). At first glance, thisinformation appears incongruous; however, further analysis reveals that the overalldecline is attributable to a 50% decrease in Alaskan oil production that has occurredover the past 15 years.109 Alaskan oil travels long distances via pipeline (acrossAlaska) and vessel (to the West Coast of the United States) and has historicallyaccounted for a significant percentage of oil in domestic transportation. Therefore,the production of Alaskan oil and its distance traveled will have a strong influenceon the overall measure of domestic transportation of oil.
In recent years, total domestic transportation has shown a modest increase(Figure 7). Although the total increase is relatively small,110 transportation for thecontinental United States is likely increasing more substantially, considering thecontext of a continuous decline from Alaskan oil production.111 As mentioned
East Coast24%
Midwest9%
Gulf Coast55%
Rocky Mountains
3%
West Coast9%
Figure 6: Average Annual Distribution of U.S. Oil Imports, by Geographic Region
Del
iver
ed b
yCQ
T OP
DOCS
ww
w.c
q.c
om

CRS-27
112 The California SONS 2004 was conducted in April 2004 and was the fourth SONSexercise performed by the USCG. The purpose of the SONS exercises is to ensure andevaluate the readiness of personnel to respond to a major oil spill. The 2004 SONS exercisewas the largest to date and the first international SONS (involving Mexico).113 U.S. Department of Homeland Security, U.S. Coast Guard, California SONS 2004: AfterAction Report, September 2004, p. 46.
previously, an increase in oil transportation will not necessarily yield more oil spills,but it may increase the possibilities for spills to occur.
Source: Prepared by CRS with data from Association of Oil Pipelines, Shifts in PetroleumTransportation, June 2006, available at [http://www.aopl.org].
Level of Preparedness
Although many consider the United States’ spill record over the last 15 years,particularly for major spills, to have been favorable, the absence of a major spillraises at least one issue. Because the nation has not been forced to respond to amajor oil spill for such a long period, some have voiced concern that the nation mighthave lost the expertise and institutional knowledge necessary for quick and effectiveresponse action. The USCG found evidence to support this concern after the 2004Spill of National Significance (SONS) exercise.112 The After Action Reportconcluded:
Oil spill response personnel did not appear to have even a basic knowledge of theequipment required to support salvage or spill cleanup operations.... There wasa shortage of personnel with experience to fill key positions. Many middle-levelspill management staff had never worked a large spill and some had never beeninvolved in an exercise. As a result, some issues and complex processes uniqueto spill response were not effectively addressed.113
0.0
200.0
400.0
600.0
800.0
1000.0
1200.0
1990
1996
1998
2000
2002
2004
Bil
lio
ns
of
To
n M
iles
Pipelines
Water Carriers
Total Transported
Figure 7: Domestic Transportation of Crude Oil and Petroleum Products, 1990-2004
Del
iver
ed b
yCQ
T OP
DOCS
ww
w.c
q.c
om

CRS-28
Congress might consider oversight to monitor this situation as the USCGconducts periodic SONS exercises. The next national exercise is scheduled for June2007.
Recent Legislative Activity
From 1990 to the 109th Congress, oil spill issues received relatively littlecongressional attention, most likely because a major spill (more than 1 milliongallons) has not had an impact on the nation’s shores and sensitive natural resourcessince 1990. However, the 109th Congress enacted two important provisions affectingcleanup funding and liability. In addition, members introduced several bills thatwould address or include provisions concerning oil pollution issues.
! P.L. 109-58, H.R. 6, The Energy Policy Act of 2005: Thiscomprehensive energy legislation was introduced by RepresentativeBarton on April 18, 2005. The final version included a provision toreinstate the 5-cent-per-barrel tax on domestic and imported oil thathad expired on December 31, 1994. As with the original tax, itprovides direct funding to the OSLTF but would be suspended forany period in which the fund’s quarterly balance exceeded $2.7billion (the original suspension trigger was $1 billion). H.R. 6 wassigned by the President August on 8, 2005.
! P.L. 109-241, H.R. 889, The Coast Guard and MaritimeTransportation Act of 2006: This legislation, introduced byRepresentative Young on February 17, 2005, included languagefrom H.R. 1412 (the Delaware River Protection Act) that proposedto increase the oil spill liability limits for vessels under OPA. Thefinal version of H.R. 889, which was signed into law on July 12,2006, increased limits to $1,900/gross ton for double-hulled vesselsand $3,000/gross ton for single-hulled vessels.
! S. 2023: Senator Inhofe introduced S. 2023 on November 16, 2005.The current version of the bill would require a biennial audit ofOSLTF monies distributed by the National Pollution Funds Center,the federal entity in charge of managing the fund. In addition, thefederal agencies that receive funding from the OSLTF would berequired to submit an annual report describing how the money wasspent. S. 2023 was reported out of the Committee on Environmentand Public Works on June 29, 2006 (S.Rept. 109-272).
! H.R. 4724: Representative Inslee introduced this bill on February 8,2006. It would require specific personnel and equipmentrequirements when oil tankers transfer oil to other tankers orfacilities. The bill has not received committee action.
! S. 2440: Senator Cantwell introduced legislation on March 16, 2006,that would strengthen the current prevention, response, and spill
Del
iver
ed b
yCQ
T OP
DOCS
ww
w.c
q.c
om

CRS-29
tracking duties of the USCG. The bill has not received committeeaction.
! H.R. 5782: Representative Young offered a bill on July 13, 2006,that would strengthen the requirements for pipeline operators. Thebill has not received committee action. For more information on thislegislation and other pipeline governance issues, see CRS ReportRL33347, Pipeline Safety and Security: Federal Programs, by PaulW. Parfomak.
Del
iver
ed b
yCQ
T OP
DOCS
ww
w.c
q.c
om

CRS-30
114 NRC report, pp. 67-88.115 The NRC report (p. 69) estimates that natural seeps off North America release 47 milliongallons of oil each year (converted from tonnes).116 NRC report, p. 2.
Appendix: Additional Statistical Information Regarding Oil Spills
Sources of Oil Inputs to U.S. Coastal Waters
Oil enters the coastal waters of the United States from a wide variety of sources.These sources comprise four major categories: natural seeps, oil consumption, oiltransportation, and oil extraction.114 The majority of oil inputs are from natural seeps— geologic openings on the ocean floor. (See Figure A1.) Well-known naturalseeps are found in the Gulf of Mexico and off the coast of southern California,regions with extensive oil exploration and production. Although the seeps releaselarge volumes of oil each year,115 the surrounding ecosystem can adapt, and eventhrive, because the rate of release is relatively slow.116
Source: Prepared by the Congressional Research Service (CRS) with data from the NationalResearch Council (NRC) of the National Academies of Science, 2003, Oil in the Sea III: Inputs,Fates, and Effects, p. 69.
Releases associated with petroleum consumption activities account for the vastmajority of oil introduced to the coastal environment through human behavior.Rivers and man-made conveyances, such as storm-water drains, receive oil from
Oil Consumption33%
Natural Seeps62%Oil
Transportation4%
Oil Extraction1%
Figure A1. Percentage Contribution of Oil Inputs into North American Coastal Waters, by Major Source Categories (based on average annual releases,
1990-1999)
Del
iver
ed b
yCQ
T OP
DOCS
ww
w.c
q.c
om

CRS-31
117 The range of uncertainty of land-based runoff is substantial, from a minimum estimateof 5.6 million gallons to 588 million gallons (based on average, annual releases from 1990-1999). NRC report, pp. 69, 87.
numerous non-point sources (e.g., urban runoff) and carry the oil to coastal waters.These sources are frequent and widespread, but their rates of release are relativelyslow and occur over a long period of time. Moreover, both the quantitative value andthe environmental fate of these sources are poorly understood.117
Oil transportation and oil extraction represent, on an annual average basis, aminor input to coastal waters. (See Figure A1.) Unlike the other categories, whichgenerally release oil at a slow rate over a wider geographic area, transportation andextraction releases can occur as major spills. Statistics for oil vessel transportationare provided in Figure 2 at the beginning of this report. Spills from oil extractionoperations are discussed later in this Appendix.
Spills from Facilities and Pipelines
As Figure A2 shows, the volume of oil spills from facilities and pipelines hasdeclined since the 1980s. Over the most recent five-year span of data (1997-2001),pipeline spill volume was especially low (compared with previous years), averagingonly 68,000 gallons of spilled oil per year; during the first five-year span (1980-1984), the average annual pipeline spill volume was 2.5 million gallons.
Source: Prepared by CRS with data from USCG Oil Spill Compendium.
Note: The above USCG data includes incidents from land-based facilities and pipelines, as well asoil industry facilities and pipelines in state (nearshore) and federal (offshore) waters.
The number of spills from pipelines in U.S. waters began to decline in the mid-1980s, averaging 32 spills per year from 1997 through 2001 (Figure A3). The trend
-500,000
1,000,0001,500,0002,000,0002,500,0003,000,0003,500,0004,000,0004,500,000
1980
1982
1984
1986
1988
1990
1992
1994
1996
1998
2000
Gal
lon
s
Facilities Pipelines
Figure A2: Volume of Oil Spills into U.S. Coastal Waters from Facilities and Pipelines, 1980-2001
Del
iver
ed b
yCQ
T OP
DOCS
ww
w.c
q.c
om
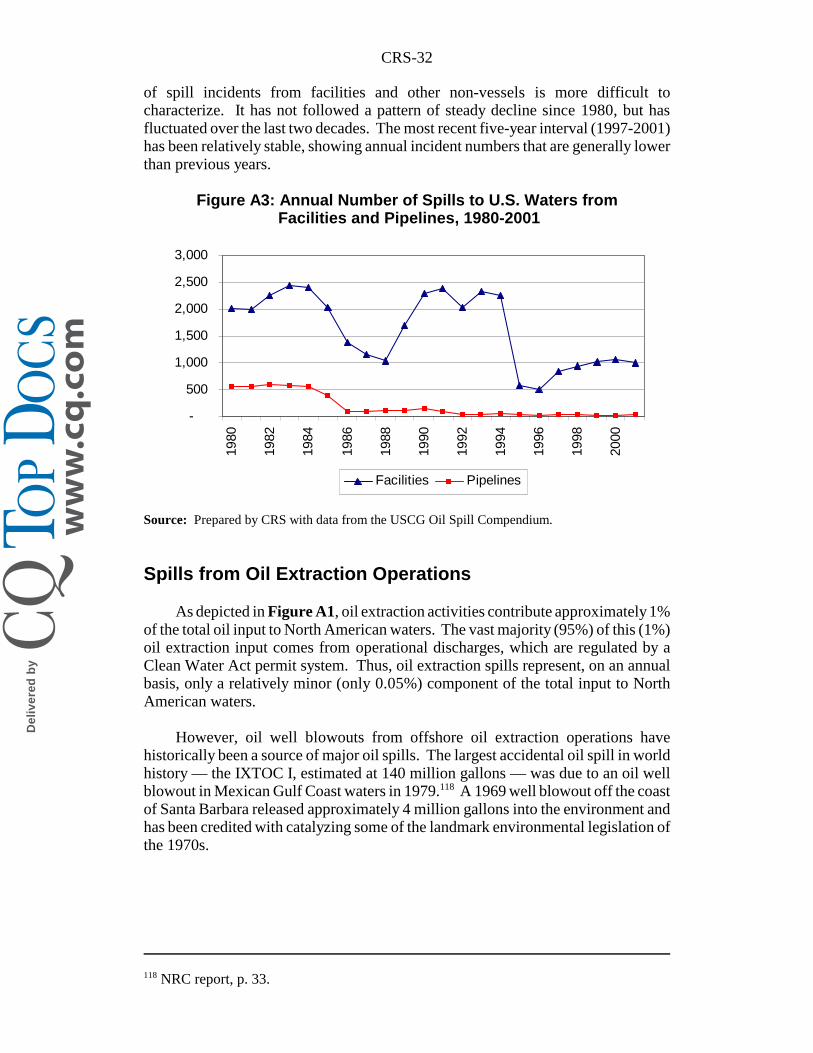
CRS-32
118 NRC report, p. 33.
of spill incidents from facilities and other non-vessels is more difficult tocharacterize. It has not followed a pattern of steady decline since 1980, but hasfluctuated over the last two decades. The most recent five-year interval (1997-2001)has been relatively stable, showing annual incident numbers that are generally lowerthan previous years.
Source: Prepared by CRS with data from the USCG Oil Spill Compendium.
Spills from Oil Extraction Operations
As depicted in Figure A1, oil extraction activities contribute approximately 1%of the total oil input to North American waters. The vast majority (95%) of this (1%)oil extraction input comes from operational discharges, which are regulated by aClean Water Act permit system. Thus, oil extraction spills represent, on an annualbasis, only a relatively minor (only 0.05%) component of the total input to NorthAmerican waters.
However, oil well blowouts from offshore oil extraction operations havehistorically been a source of major oil spills. The largest accidental oil spill in worldhistory — the IXTOC I, estimated at 140 million gallons — was due to an oil wellblowout in Mexican Gulf Coast waters in 1979.118 A 1969 well blowout off the coastof Santa Barbara released approximately 4 million gallons into the environment andhas been credited with catalyzing some of the landmark environmental legislation ofthe 1970s.
-
500
1,000
1,500
2,000
2,500
3,000
1980
1982
1984
1986
1988
1990
1992
1994
1996
1998
2000
Facilities Pipelines
Figure A3: Annual Number of Spills to U.S. Waters from Facilities and Pipelines, 1980-2001
Del
iver
ed b
yCQ
T OP
DOCS
ww
w.c
q.c
om

CRS-33
119 Federal waters extend 200 nautical miles from shore but do not include the watersadjacent to shore that are under state control (as discussed earlier in this report).120 The MMS, in the U.S. Department of Interior, is the federal agency responsible formanaging the oil and gas resources on the outer continental shelf.121 1,000 barrels = 42,000 gallons. 122 The annual crude oil production in the Gulf of Mexico (the primary source of offshorecrude oil) increased by 112% from 1981 to 2001. Energy Information Administration,Crude Oil Production statistics, at [http://www.eia.doe.gov/].
The spill record for offshore platforms in federal waters119 was noteworthyduring the 1980s and 1990s. According to the Minerals Management Service(MMS)120 oil spill database, there were no oil spills over 1,000 barrels121 fromfederally regulated offshore facilities between 1981 and 2001 (Figure A4). Thiseffort was achieved in the context of increasing oil production on the outercontinental shelf (OCS).122
Source: Prepared by CRS with data from the Minerals Management Service (MMS) spill database,at [http://www.mms.gov/incidents/pollution.htm].
Note: The MMS database includes spills from chemicals (e.g., methanol), but the above only includesspills of crude oil and petroleum products.
Since 2002, there have been six offshore facility spills in federal waters over1,000 barrels, the largest estimated at 2,000 barrels (84,000 gallons). Annual spillvolumes from offshore facilities in federal waters have increased in recent years(Figure A4). Part of the recent increase in facility spill volume is attributable to a
-100,000200,000300,000400,000500,000600,000700,000800,000900,000
1985
1987
1989
1991
1993
1995
1997
1999
2001
2003
2005
Gal
lon
s
OCS Pipelines OCS Facilities
Figure A4: Annual Oil Spill Volume for Spills Greater than 50 Gallons from Oil Exploration and Extraction Activities in the Federal Waters
on the Outer Continental Shelf, 1985-2005
Del
iver
ed b
yCQ
T OP
DOCS
ww
w.c
q.c
om

CRS-34
123 Per Aug. 15, 2006, telephone conversation with MMS official.124 MMS Oil Spill database, at [http://www.mms.gov/incidents/pollution.htm]. 125 NRC report, p. 193.126 NRC report, p. 38.
more comprehensive reporting regime. For example, tanks or machines with oil thatare lost at sea during hurricanes are now counted as spills.123
As Figure A4 indicates, there were several years in which offshore pipelinescontributed a relatively minor (or zero) spill volume. However, periodic large spillsgenerated the vast majority of the spill volume from offshore operations between1985 and 2000. For example, in 1988, there was only one pipeline spill over 1,000barrels, but that one incident released 15,576 barrels into the environment (654,192gallons).
The vast majority of the offshore spills in federal waters have taken place in theGulf of Mexico. In fact, there have been only four spills greater than 50 barrels(2,100 gallons) in the Pacific Region since 1985, none occurring after 1996.124
Although Figure A4 and the above discussion pertain only to federal waters,there are numerous platforms and pipelines in state waters as well. The majority ofthe oil extraction operations are located in state waters off the coast of Louisiana andTexas. The precise volume and incident frequency in state waters are difficult todetermine. The NRC report describes the data as “generally lacking,”125 but thereport estimates that oil spills from operations in state waters account for twice theoil discharges of activities in federal waters.126 This estimate is noteworthyconsidering that spills in state waters present a potentially greater threat to the moresensitive shoreline environments.
Del
iver
ed b
yCQ
T OP
DOCS
ww
w.c
q.c
om