oilvoice magazine - edition 42 - september 2015
DESCRIPTION
August has been another interesting month within our industry with some highs and somelows. We saw oil price go down into the low 40s, the largest field discovered in the NorthSea in 10 years approved for development, and plenty money exchanging hands in both exploration and production deals.But what are people talking about?- One can imagine that the main topics over a pint are currently dominated by the possibility of China heading into a recession, and the large amount of refugees gaining or trying to gain access into the Eurozone. Why not add some oil production statistics into the conversation mix instead by checking out Euan Mearns incredibly interesting article in this month’s magazine on “Oil Production Vital Statistics August 2015”.This is just one of many entertaining and informative articles in this month’s OilVoice Magazine. And if that doesn’t excite you or fulfil your desire to learn something new then check out the OilVoice Training Page for more details on a wide range of courses that will be run from now until November.TRANSCRIPT

Edition Forty Two - September 2015
OPEC's Gigantic Blunder
The oil price: how low is low?
Sunset for oil? You must be kidding, surely?


Issue 42 –August 2015
OilVoice Acorn House 381 Midsummer Blvd Milton Keynes MK9 3HP Tel: +44 207 993 5991 Email: [email protected] Advertising/Sponsorship Mark Phillips Email: [email protected] Tel: +44 207 993 5991 Social Network
Google+
Linked In
Read on your iPad You can open PDF documents, such as a PDF attached to an email, with iBooks.
Adam Marmaras
Manager, Technical Director
August has been another interesting month
within our industry with some highs and some
lows. We saw oil price go down into the low
40s, the largest field discovered in the North
Sea in 10 years approved for development,
and plenty money exchanging hands in both
exploration and production deals.
But what are people talking about?- One can
imagine that the main topics over a pint are
currently dominated by the possibility of China
heading into a recession, and the large
amount of refugees gaining or trying to gain
access into the Eurozone. Why not add some
oil production statistics into the conversation
mix instead by checking out Euan Mearns
incredibly interesting article in this month’s
magazine on “Oil Production Vital Statistics
August 2015”.
This is just one of many entertaining and
informative articles in this month’s OilVoice
Magazine. And if that doesn’t excite you or
fulfil your desire to learn something new then
check out the OilVoice Training Page for more
details on a wide range of courses that will be
run from now until November.
See you next month!
Adam Marmaras
Managing Director OilVoice

Let’s turn on the light.Look more closely at your basement with NEOS and discover what might be lurking below. Through multi-physics
imaging, NEOS maps variations in basement topography, composition and faulting, any of which can affect field
locations, EUR, or the level and BTU content of production. By illuminating your basement and seeing below the
shale, you’ll better understand thermal regimes and pinpoint where to drill for optimal recovery and economics.
Some of the world’s leading geoscientists are making brighter decisions with NEOS. Be the next.
Above, Below and Beyond neosgeo.com
YOUR BASEMENT IS FULLOF DARK SECRETS.
5
5
Table of Contents
OPEC's Gigantic Blunder by Euan Mearns
6
Sunset For Oil? You Must Be Kidding, Surely? by John Richardson
12
The North Sea isn't dead, it's just resting. by Stephen A. Brown
17
When Will Oil Prices Turn Around? by Art Berman
20
What is the price of oil telling us? by Kurt Cobb
30
Oil Prices: Why We Are Where We Are Today by John Richardson
33
The Oil Price: how low is low? by Euan Mearns
35
How Did the Oil & Gas Majors Perform in Early 2015? by Mark Young
40
Tullow Oil boss Heavey predicts oil price will hit $75 a barrel by year end by John Mulligan
44

6
6
OPEC's Gigantic Blunder
Written by Euan Mearns from Energy Matters With WTI falling below $40 and perhaps heading for $20, one needs to wonder if
OPEC's strategy is working out as planned? Why are they following this course and
what are their goals? The face value explanation, accepted by many, is that OPEC is
protecting market share especially against rampant supply growth in the OECD,
namely in the US LTO (light tight oil) patch. This post examines how OPEC's market
share has evolved with time and with past swings in the oil price.
This turned out to be more complex than expected. But scrutiny of the data shows
that following each of the three oil shocks since 1965 (Figure 1) OPEC market share
AND oil price fell (Figure 3). The most recent trend follows the 2008-2014 highs and I
believe it is this observation that is driving current behaviour.
Had OPEC decided to sacrifice about 5% market share they could have maintained
price above $100 per barrel for years to come in which time the US shale bonanza
may have burned out. It seems that OPEC may have made a colossal error that
threatens to de-stabilise their member countries. This post originally appeared on
the Energy Matters blog.
Figure 1 OPEC market
share is simply OPEC
production / global
production. It is very
difficult to make sense of
the data from this plot. In
Figure 2 the variables are
cross plotted against
each other which does
enable some sense to be
made. Shock 1 = Yom
Kippur, Shock 2 = Iranian
revolution and Shock 3 =
peak cheap conventional
oil.

7
7
Figure 2 This chart cross plots the two variables shown in Figure 1. It should be
obvious that there is no overall correlation between OPEC market share and price.
The chart is a time series that needs to be read in a counter clockwise direction
beginning in 1965. The arrow 2014 to today is conceptual since I do not have the BP
C+C+NGL YTD data available. The arrow shows a very slight increase in OPEC
share since their production has risen this year. The trends are summarised in
Figure 3. The picture is clouded by the 2008/09 crash. These years are labelled 08
(8) to 14 (4). See text for further details.
Cross plotting market share against price produces a curious pattern which is a time
series that describes different market behaviour for different time segments (Figures
2 and 3). To read the plot you have to begin in 1965 and work your way around in a
counter clockwise direction. Note that by 1992-2003 the market had almost gone full
circle. The period 1965 to 2003 is marked by two major events - the Yom Kippur war
and the Iranian revolution that was followed by the Iran-Iraq war. Combined, these
two shocks sent the oil price over $100 / bbl. The period 1979 to 2003 may be
viewed as one of relaxation and adjustment back to the starting point. Post 2003 a
new ball game began with a plateau in cheap conventional oil production. Using pre-
2003 behaviour to predict what might happen now is likely a major mistake!

8
8
OPEC's market share has varied enormously from a high of 51.2% in 1973 that
coincided with low price and a low of 27.6% in 1985 that coincided with an
intermediate price of $60 / bbl.
Figure 3 Summary of the trends evident in Figure 2.
There are three periods when OPEC enjoyed rising market share. The first, 1965 to
1973 had essentially flat prices. The second, 1985 to 1992 saw market share rising
against a backdrop of falling price. The third, 2004 to 2014 saw OPEC market share
increase marginally against a backdrop of rapidly rising prices.
The three cycles of rising market share are cancelled by three cycles of falling
market share AND falling price. Each of these cycles occur after oil price shocks and
OPEC therefore found itself in the early stage of such a cycle in 2014.
If one looks at prior falling share cycles, 1974 to 1978 was not that bad for OPEC.
They lost 5% market share and the oil price shed $5. The second falling share cycle,
1979 to 1985, saw market share fall 18% (39% in relative terms) and price fall by

9
9
$45. This was truly a bad period for OPEC and I dare say it is this that Saudi Arabia
wants to avoid this time. This period also witnessed global oil demand in decline as
the global economy adjusted to the sharply higher oil price. Hence at this time OPEC
were getting a smaller share of a smaller pie. The third falling share cycle, 2008-
2014 has seen market share fall a trivial 2.5% and price fall about $8 from record
highs. And in this period most OPEC countries have been pumping at capacity and
at record combined levels over 36 M bpd C+C+NGL. 2008-2014 has been an
amazing pink patch for OPEC, too good to be true and too good to last.
Have OPEC just made a gigantic blunder?
Has the current OPEC strategy of flooding the market with their cheap oil turned out
as planned or has it turned into a gigantic blunder? Figure 4 shows schematically
three scenarios and alternative courses that may have been followed. The first is
where we were heading. With the flood of oil that has come to market in 2015
combined with weak demand it is likely that OPEC would have had to cut production
incrementally to have maintained the trajectory of slowly falling share and price.
Scenario 2 shows what might have happened with a continuation of recent policy of
supporting price. Trimming 4 M bpd from production (5% share) incrementally may
have maintained prices of $100 / bbl. Scenario 3 shows what has come to pass and
where we are heading.
Figure 4 Three
conceptual scenarios
for different courses of
action that OPEC may
have followed.

10
10
I think it is safe to presume that, with the benefit of hindsight, OPEC's preference
would be within the vicinity of the 2008-2014 cluster. At present it therefore looks like
OPEC have made a gigantic blunder. Their actions can only be vindicated if they do
manage to break the back of the US LTO producers and other OECD and non-
OECD producers like Gazprom and to some time soon end up with significantly
increased share and price. Since OPEC is already pumping flat out, the only way to
significantly increase share is if global production falls. This would herald another
global recession since GDP and oil consumption are generally correlated.
Had OPEC pursued option 2 they may have benefited from unpredictable global
events working in their favour. In choosing option 3 they now appear to have elected
economic suicide for many members. I'm sure that was not the intention.
What happens next? I believe that OPEC and Russia will hang tough for a while yet,
until at least US oil linked debts are re-determined at the end of the third quarter. The
outcome of that is in itself uncertain. While most predict a blood bath in the LTO
patch, and I am not disagreeing that this is likely, strategic events are unpredictable.
There is much hubris involved on both sides. Will the USA really sit back and watch
its shale industry get kicked into the long grass?
Near term I think it likely we see WTI flirt with $20 and Brent below $30. At that point
the global oil industry will be on its knees, including OPEC, the OECD and Russia.
Russia may then either join or form an alliance with OPEC and we then see
production cuts, incrementally up to 4 Mbpd and the price rise back towards that
magic $100 / bbl number. I think it is safe to say that the oil industry and global
economy are equally focussed on stability as they are price and many will be asking
what was the point? Meanwhile, in an increasingly meta-stable world, events may
sweep all this into oblivion.
Finally, a concluding thought. Had OPEC defended price as opposed to share they
may have seen production fall by 5 M bpd and a price close to $100 maintained. The
current course of defending 36 M bpd may take the oil price down to $20.

11
11
32 M bpd @ $100 is worth $1168 billion per year
36 M bpd @ $20 is worth $263 billion per year
The difference of $905 billion per year could make this one of the costliest blunders
of all time.
Figure 5 The notional value of OPEC production calculated by multiplying daily
production by price by 365.
All data from the 2015 BP Statistical Review.
View more quality content from
Energy Matters

12
12
Sunset For Oil? You Must Be Kidding, Surely?
Written by John Richardson from ICIS SURE, you can very easily argue that the oil industry is many, many decades away
from going down the same path as the coal industry, where, in countries such as the
US, it is going bankrupt.
The biggest case for oil's longevity is its role in transportation, it is altogether from
different coal, which has mainly lost out to cleaner-burning natural gas in power
generation. Coal does not have any role in the transportation sector, with the
exception of just about only China where they turn coal into diesel and gasoline. And
even China makes most of its transportation fuels from crude.
(By the way, I will look at natural gas in a separate blog post as the arguments
around its future are a little different).
And for over one hundred years now, oil has been tightly bound into global
transportation. This has left us with billions of dollars' worth infrastructure investment
in pipelines and refineries etc. that would have to be replaced at an enormous cost if
you were to make a significant switch from gasoline and diesel to, say, natural gas or
battery-powered vehicles.
This is assuming, of course, that it is even worth considering replacing all this
infrastructure. Before this can even be thought about, we would have to find
alternatives to oil in transportation that a.) We could produce in the enormous
volumes needed and b.) At a cost that makes global economic sense.
Here are a couple of other objections to the idea that oil is anywhere close to being a
sunset industry, and I am sure you can think of many more:
What about all the jobs that would be lost in the oil industry. What would you
do with all these people?

13
13
And how would the innovators overcome political resistance from the oil and
autos companies that benefit so enormously from the hydrocarbons-driven
global economy? 'Big Oil' in the US will not role-over and die. Of course not.
Neither will the petro-states of the Middle East, Africa and elsewhere, which
rely hugely on oil for the very economic survival.
The above arguments took me just a few minutes to summarise because they are
part of our shared understanding. We all know them, probably as well as we know
the old nursery rhymes we were taught in school.
But shared understanding isn't the always the same as the truth, as we have found
out with China very recently. The shared understanding on China was that its
economy would never suffer a serious, long-term downward correction. This has
been proved wrong.
And with oil, where there is an economic will there might just be a way, as a
Financial Times interview with Bill Gates in June of this year indicated:
As a parting shot Mr Gates compared the search for renewable technologies with the
early days of the technology industry and predicted that some investors would make
a lot of money by backing companies that would one day be successful.
'If I came and talked to you about software in the late 1970s, I would tell you: 'Hey,
somebody's going to make a lot of money. Now there's a tonne of software
companies whose names will never be remembered. . . If you happened to pick
Microsoft, Apple or Google, you would have made lots of money.'
Mr Gates, in the same article, urged governments to switch more resources from
subsidising renewable energy into basic research. At present, government subsidies
amounted to more than $100 billion with only $6 billion a year being invested in
renewable energy R&D, he said.
Hence, his belief is that if this happens major new global companies will emerge
from nowhere, just as Google did from 1998 onwards.
One the examples of new technologies that he gave is something called solar-
chemical power. If successful, this technology would actually piggy-back on oil
pipelines and gasoline tanks inside existing cars So there potentially goes the

14
14
infrastructure objection to the 'Sunset for Oil' theory.
And what if we can find ways of storing electricity much more effectively? This would
make both solar and wind power and electric cars much more viable. Research here
includes looking at ways of using capacitors, or electrical fields to store power.
Another way to go could be to replace today's lithium-ion batteries with, say,
magnesium-ion batteries.
Here is another 'what if'. What if another new technology - Driverless cars - really
takes off? This could reduce the volume of traffic on the roads by as much as 90%
as most of us would be want to rent or lease a car, per ride, than actually own one.
I also mentioned above how the autos companies would fight against the end of oil.
But if driverless cars really do take hold, auto companies as we know them might not
even be around anymore. Luis Martinez of the International Transport Forum, a
division of the OECD, told The Economist:
The value in carmaking will shift from hardware to software and from products to
services. That would shake existing carmakers, just as smartphones upended Nokia
and Kodak. Already, high-tech newcomers such as Google, Uber and Tesla are
muscling in.
Bill Gates is backing his words with his money: He plans to double his investment in
renewable energy research from $1bn and $2bn over the next five years.
'No disrespect to Mr Gates as he is a brilliant man, but this is chickenfeed in terms of
the overall money that will be needed to replace oil,' I can here you say.
True, but Mr Gates and others like him have the economic will to make these
relatively small investments because they sense there has been a huge change in
the political will. Thus, the returns on their investments could be equally big.
The climate change debate is essentially over, whether you like it or not.
Governments the world over believe that humans are the cause of climate change.
So they will be taking a close look at numbers such as these, which were
published in an IMF report released in May of this year:

15
15
Post-tax fossil fuel subsidies are dramatically higher than previously
estimated—$4.9 trillion (6.5% of global GDP) in 2013, and projected to reach
$5.3 trillion (6.5% of global GDP) in 2015.
Post-tax subsidies are large and pervasive in both advanced and developing
economies and among oil-producing and non-oil-producing countries alike.
The fiscal, environmental, and welfare impacts of energy subsidy reform are
potentially enormous. Eliminating post-tax subsidies in 2015 could raise
government revenue by $2.9 trillion (3.6% of global GDP), cut global CO2
emissions by more than 20%, and cut pre-mature air pollution deaths by more
than half. After allowing for the higher energy costs faced by consumers, this
action would raise global economic welfare by $1.8 trillion (2.2% of global
GDP).
So much therefore for the argument that moving away from oil would be too
damaging for the global economy.
You can instead easily make the opposite argument that the shift would create many
new jobs in new industries, whilst also potentially reducing the enormous economic
costs of climate change, if by shifting from oil, in transportation and everything else,
we can minimise the rise in global temperatures.
This shift might also limit the human cost of climate change that right now is set to be
mainly borne by the world's poorest people as they often live in equatorial regions. It
is these equatorial, or tropical, regions that are most at risk from rising sea levels and
droughts.
Do you still dismiss all of this as nonsense? So be it, but the move away from an oil-
driven global economy could happen a lot quicker than many people think. It is a
scenario that any oil or chemicals company planner with a 20 or even ten-year
horizon must consider.
And here's the thing: As we move towards a potentially ex-oil economy, what will this
mean for the demand growth for oil over the next five years, if you only think in
much-shorter timeframes?
View more quality content from
ICIS

*Replica of original published data
Landmark
Joining up the exploration process
Unlocking a region’s full hydrocarbon potential requires a comprehensive understanding of subsurface structure. The Neftex Regional Frameworks Module delivers unique, isochronous depth grids for key stratigraphic surfaces, bringing vital insight into mega-regional depth structure trends.
As the first Neftex offering deliverable in Landmark’s DecisionSpace® Geosciences software, the module provides a robust framework into which proprietary data can be dynamically added. This forms a powerful basis for essential play analysis on a regional scale.
Support faster, more integrated exploration
Contact us today: Website: www.neftex.com Halliburton I Landmark: www.landmarksoftware.com Email: [email protected] Tel: +44 (0)1235 442699 LinkedIn: linkedin.com/company/Neftex Neftex • 97 Jubilee Avenue • OX14 4RW • UK

17
17
The North Sea isn't dead, it's just resting.
Written by Stephen A. Brown from The Steam Oil Production Company Ltd
I wrote before about my calculations of the breakeven point for some recent and
some upcoming North Sea projects, but time marches on and cost estimates and
reserve estimates change so I thought it worth updating the picture.
I am doing this calculation with publicly available data, so I doubt that I will have
been able to make a truly accurate calculation, or one that matches company's
internal estimates, or even the published CPR estimates. Part of that will be down to
data availability and part will be down to the methodology I chose. For simplicity, I
discount the production profile and the operating costs, but I don't bother discounting
the capital costs as it is only rarely that I can lay my hands on how those capital
costs are phased. That means the breakeven price I calculate will be higher than it
should be, but my method has the virtue that I can apply it to projects where the only
data I have is a production profile (check out the Environmental Statements for those
if there isn't a CPR) and a total capital cost; operating costs can always be estimated
at 4% of capex per annum.
The other consequence of that simplification is that it sets the bar a little higher than
just making a return that is equal to the theoretical cost of capital, so I could make a
case that the breakeven value I calculate is more realistic, if you think of it as a
hurdle oil price for the project. But the main reason I do it the way I do is so that I can
do the calculation for as many projects as possible.
So here is an updated chart with the projects ranked by breakeven price. A few
investments that made sense when the oil price was $110/bbl aren't looking quite so
good now, but we don't know to what extent the operators of those projects can add
incremental reserves or squeeze some costs out of the system. It is very hard to

18
18
change the cost of something you have already built or are in the middle of building,
but a few extra barrels could help some of those projects a lot. For clarity, these are
pseudo-project economics not company economics which can often look a lot better
(or worse) depending on acquisition or farm-in or farm-out arrangements.
At today's price of just under $50/bbl it is hard to see any new project getting off the
blocks, and with the long run price now under $70/bbl it will be a brave company or
financier that pulls the trigger on a project. But I firmly believe that those will be the
companies or financiers that will reap rewards in the long run. BP, LASMO et al
sanctioned the Andrew development project on a day when the oil price had fallen to
$12/bbl, they reaped the rewards in lower costs during construction and higher oil
prices when the field actually came on stream; but on the day that the final
investment decision was taken the outlook couldn't have been bleaker.

19
19
Getting a development project across that final investment decision hurdle will, in
many cases, require a radical rethink of what the project looks like and how the
project gets implemented. That is just what we did on the Andrew project, we took
six months out to reshape the project before we went for the final investment
decision, the plant had been designed to produce 45,000 bbls/day, but with the
horizontal wells we had planned the well capacity was quite a bit better so we
debottlenecked the plant before we built it and realised we could handle nearly
60,000 bbls/day. The structural engineers did their bit too, when they established
that we could securely fasten the platform to the seabed with 12 piles not the original
16 we had planned.
That is the kind of process which can drive costs out of a project but the best way to
drive down the breakeven cost per barrel is to find a way to squeeze (or steam) more
barrels out of the field. Engineering ingenuity runs out of road eventually and
pressuring your contractors only goes so far (if it goes anywhere at all).
Finding a way to produce the extra barrels that will make MER:UK (that's Maximising
Economic Recovery in the UK for those who don't read the Wood report every day) a
reality will take innovation and fortitude, cutting costs will
take ingenuity and collaboration, but we have the capability to do that in the UKCS,
of that I am sure.
That's why I say the North Sea isn't dead, it's just resting. Sadly, I'm afraid that
Norwegian Blue's a goner.
View more quality content from
The Steam Oil Production Company Ltd

20
20
When Will Oil Prices Turn Around?
Written by Art Berman from The Petroleum Truth Report Look for some good news about oil prices this week...maybe.
EIA releases its Short-Term Energy Outlook (STEO) on Tuesday (August 11) and
IEA publishes its August Oil Market Report (OMR) on Wednesday (August 12). I
hope to see a small increase in world demand and relatively flat supply. That will
bring the market somewhat closer to balance and prices may increase or, at least,
stop falling.
Meanwhile, the view among most analysts is grim. On Monday, The Wall Street
Journal's Money & Investing headline read 'No Relief in Sight for Crude: Oil's
Malaise could last for years.' In late September, Bloomberg wrote, 'Oil Warning: The
Crash Could Be the Worst in More Than 45 Years.' As recently as mid-June,
analysts were confident that oil prices were rebounding toward 'normal' because
both Brent and WTI had risen from low $40- to low-$60 levels.
When many were celebrating a return to higher prices, I warned that prices would
fall. Now, when most are proclaiming lower oil prices ahead, I am looking for a
bottom to the price slump.
Don't get me wrong: this is not going to be anything dramatic but, if I'm right, it will
add another month of data that suggests flattening production and increasing
demand.
I have not changed my view that we have crossed a boundary and things are
fundamentally different than before. My colleague Rune Likvern published a post
today that details the key reasons why this substantive market shift has occurred.
As I wrote in late June, the world is a fundamentally different place post-the 2008
Financial Collapse and some markets, including oil, no longer respond as they did
before. This is a function of even more massive debt than prior to the Collapse and
monetary policies that have sustained artificially low interest rates for 6 years. Cheap
money has fostered the expansion of oil and other commodity supplies beyond the

21
21
weakened global economy's capacity to absorb them. Also, the anticipated de-
leveraging of debt has not occurred.
Market Fundamentals
So, where are we today?
Oil prices have fallen about 25% from May and June highs (Figure 1). The
exuberance of rising prices in March and April has given way to a view that prices
may continue to fall and may remain low for years or decades.
Figure 1. Crude oil spot prices, January 1-August 3, 2015. Source: EIA and Labyrinth
Consulting Services, Inc.
WTI futures closed at $43.87 on Friday, August 7, almost at the previous low during
this price cycle of $43.39 on March 17. Brent futures closed at $48.61 on August 7,
still a few dollars above its previous low of $45.13 on January 13.
It seems reasonable that oil prices may have fallen to or at least near some natural

22
22
bottom.
Traders are looking for hope that tight oil production will decline. IEA data showed
that U.S. production fell 50,000 bopd in June (Figure 2). Assuming that OPEC over-
production is partly aimed at reducing U.S. tight oil production, that process seems to
have finally begun, albeit in a small way so far.
Figure 2. IEA top producers monthly liquids production change, June 2015. IEA and
Labyrinth Consulting Services, Inc.
The problem continues to be over-supply coming mostly from OPEC whose
production increased 340,000 bpd in June (Figure 2).
Although there are positive indicators for demand growth for gasoline in the U.S. and
China, production growth has continued to outpace increases in demand. The
production surplus (supply minus demand) in the second quarter 2015 grew more
than 1 million bpd compared to the first quarter (Figure 3).

23
23
Figure 3. World liquids production surplus or deficit comparison, EIA vs. IEA. Source:
EIA, IEA and Labyrinth Consulting Services, Inc.
That is what must change in order for prices to turn around. The fact that IEA and
EIA estimates vary by almost 700,000 bpd shows that there is considerable
uncertainty in the data.
We may get better resolution by using EIA monthly data rather than IEA quarterly
data. EIA shows that the production surplus in June declined 1.2 million bpd
compared to May to 1.9 million bpd (Figure 4).

24
24
Figure 4. World liquids production, consumption and relative production surplus or
deficit. Source: EIA and Labyrinth Consulting Services, Inc.
This is because world demand reached a new high of 93.86 million bpd, an increase
of 1.3 million bpd over May. Another month of demand growth and slowing
production growth might go a long way towards turning prices around.
Second Quarter 2015 Earnings
Pessimism increased about oil prices last week as second quarter earnings for U.S.
E&P companies were released. Many tight oil producers including Pioneer, Whiting
and Devon announced higher production guidance for 2015. Others, however,
like EOG andSouthwestern Energy said they would continue to show restraint in
production until prices improved.
Despite ongoing macho declarations from tight oil company executives that they
are winning the war against Saudi Arabia and OPEC, the truth is that second quarter
results were pretty awful, and that is good for oil prices because it may signal falling
future production.
25
25
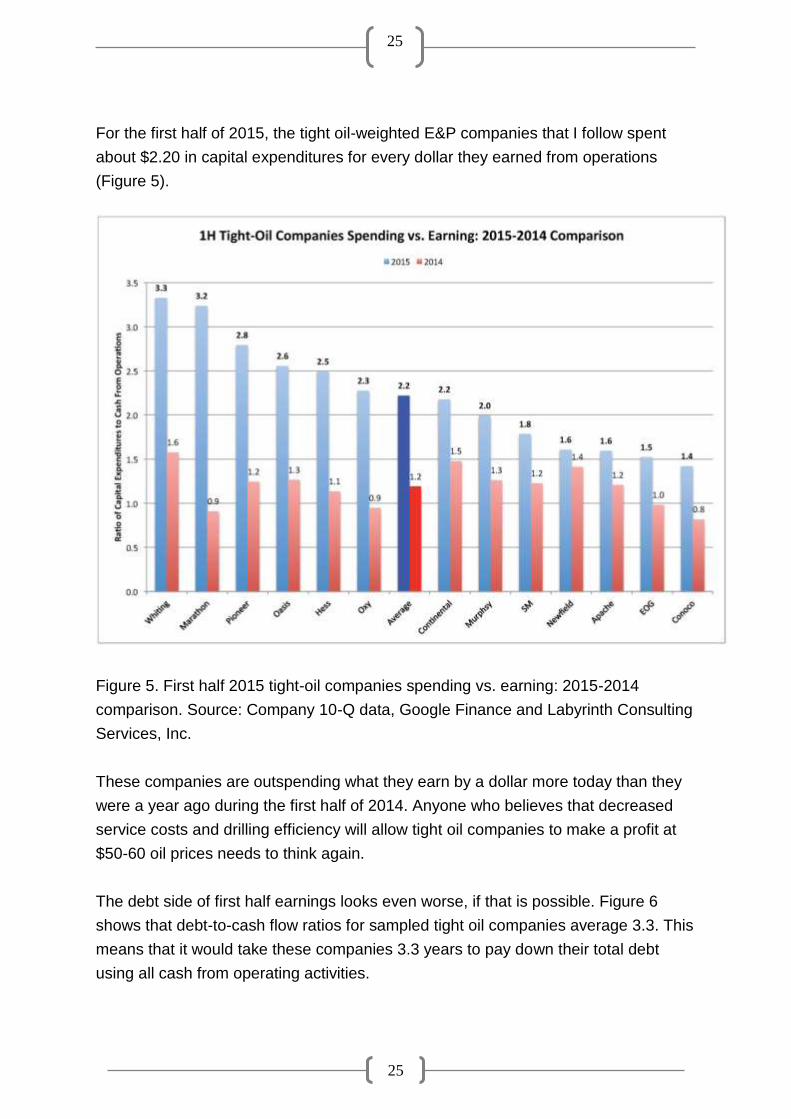
For the first half of 2015, the tight oil-weighted E&P companies that I follow spent
about $2.20 in capital expenditures for every dollar they earned from operations
(Figure 5).
Figure 5. First half 2015 tight-oil companies spending vs. earning: 2015-2014
comparison. Source: Company 10-Q data, Google Finance and Labyrinth Consulting
Services, Inc.
These companies are outspending what they earn by a dollar more today than they
were a year ago during the first half of 2014. Anyone who believes that decreased
service costs and drilling efficiency will allow tight oil companies to make a profit at
$50-60 oil prices needs to think again.
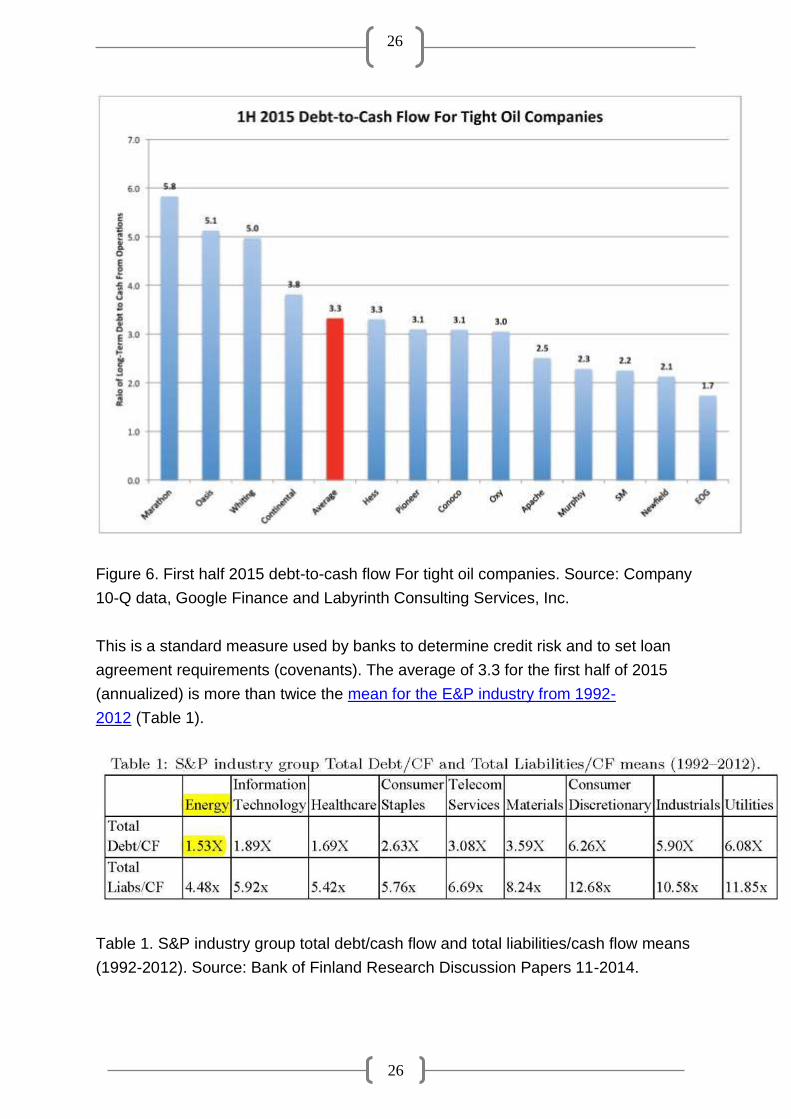
The debt side of first half earnings looks even worse, if that is possible. Figure 6
shows that debt-to-cash flow ratios for sampled tight oil companies average 3.3. This
means that it would take these companies 3.3 years to pay down their total debt
using all cash from operating activities.
26
26
Figure 6. First half 2015 debt-to-cash flow For tight oil companies. Source: Company
10-Q data, Google Finance and Labyrinth Consulting Services, Inc.
This is a standard measure used by banks to determine credit risk and to set loan
agreement requirements (covenants). The average of 3.3 for the first half of 2015
(annualized) is more than twice the mean for the E&P industry from 1992-
2012 (Table 1).
Table 1. S&P industry group total debt/cash flow and total liabilities/cash flow means
(1992-2012). Source: Bank of Finland Research Discussion Papers 11-2014.

27
27
This has profound implications for debt re-determinations that will happen during the
third quarter of this year. It means that most of the companies shown in Figure 6 with
debt-to-cash flow ratios above 2.0 may have considerably less access to revolving
credit lines going forward. That equals more limited capability to drill and complete
wells.
At the same time, favorable hedge positions, that allow companies to realize prices
higher than current spot markets pay, will begin to expire in coming months. The
drop in value for long-dated futures contracts since oil prices slumped in July means
that tight oil companies are unable to hedge much above current low prices.
My colleague Euan Mearns recently did a forecast for U.S. tight oil plays and
concluded that production from the Eagle Ford, Bakken and Permian would decline
by about 830,000 bopd by the end of 2015. His estimate assumed that rig counts
had stabilized but tight oil horizontal rig counts have increased 20 during the last 4
weeks.
The EIA forecasts approximately 390,000 bopd of production decline by year-end
(Figure 7).

28
28
Figure 7. EIA U.S. crude oil production and forecast, 2015-2016. Source: EIA and
Labyrinth Consulting Services, Inc.
What It Means
The significance of these production forecasts and the second quarter earnings
reports is that U.S. tight oil production will decline. The fact that production has
remained strong despite a 60% decrease in the tight oil rig count has incorrectly lead
some analysts to conclude that production will not fall because of the ingenuity and
efficiency of U.S. producers.
It takes time for production to decline because there are months of lag between the
beginning of drilling and first production, and more months of lag before production
data is released. Also, many of the rigs that were released were drilling marginal
locations that didn't contribute much to overall production-the 80-20 rule. And, there
is the inventory of uncompleted wells that are unaffected by rig count.
Will a decline of 400,000 to 800,000 bopd in U.S. tight oil production make a
difference in the global market balance? Obviously, it depends on what other
producers do but it is certainly important to OPEC's strategy of gaining market share
from unconventional producers.
OPEC is producing more than half of the world production surplus and has the
capacity to cut production by the entire amount of the surplus. This will not happen
until its goals are achieved but Saudi Foreign Minister al-Jubeir will meet with
Russian Foreign Minister Sergei Lavrov August 11 in Moscow to discuss global
energy markets and other topics. EIA will release its STEO on the same day and IEA
will release its OMR the next day.
I am hopeful that something positive will emerge that will at least help to stop the
decline in oil prices.
View more quality content from
The Petroleum Truth Report

PICK A WINNERFOR THESE CHALLENGINGTIMES
Stay ahead of the game, and don’t wait for partners to show you the value in your assets! Find out more at
ikonscience.com/jifi
With the industry’s current focus on cost control, it is remarkable that more and more forward-thinking oil & gas companies are stepping up to invest in Ikon Science’s revolutionary RokDoc Ji-Fi®, a new tool to build reliable seismically-driven geological models. Ji-Fi breaks the mold of traditional workflows and opens up a whole new realm of possibilities. The cost/benefit of Ji-Fi is so compelling it redefines how customers leverage data and knowledge to drive success in their exploration, development and production activities.
The Present And Future Of GeoPrediction
ikonscience.com
C
M
Y
CM
MY
CY
CMY
K
Ji-Fi A4.pdf 1 20/05/2015 08:05:25

30
30
What is the price of oil telling us?
Written by Kurt Cobb from Resource Insights Market fundamentalists tell us that prices convey information. Yet, while our barbers
and hairdressers might be able to give us an extended account of why their prices
have changed in the last few years, commodities such as oil--which reached a six-
year low last week--stand mute. To fill that silence, many people are only too eager
to speak for oil. And, they have been speaking volumes. So much information in that
one price!
First, as prices fell last year when OPEC refused to cut its oil production in the face
of slowing world demand, the industry kept saying that it could continue to produce
from American tight oil fields at around $80 a barrel and be profitable. Then, as
prices fell further,the industry and its consultants assured everyone that while growth
in tight oil production would slow, it would still be profitable for the vast majority of
wells planned.
Petroleum geologist and consultant Art Berman is probably the best representative
from the skeptical camp. For many years Berman has been pointing to the high cost
of getting fracked oil out of the ground. And, those costs led to negative free cash
flow for most tight oil operators for several years in a row--that is, they spent
considerably more cash than they took in, making up the balance with debt and
stock issuance. Not surprisingly, the operators took that money and kept drilling as
fast as they could.
It was a recipe for oversupply and a crash, one that is now threatening the solvency
of many fracking-dependent U.S. oil companies.
As if to the rescue, the giant consulting firm Deloitte called a bottom in the oil
price when U.S. futures prices hit $48 a barrel on February 4--a little prematurely it
seems. Friday's price for September futures on the NYMEX closed at $42.50.
Not to worry. Two major international oil companies, Chevron and Exxon, declared
back in December that $40-a-barrel oil won't be a problem for them. One of the

31
31
sources cited was Exxon CEO Rex Tillerson whose company has had trouble
replacing its oil reserves for more than a decade at much higher average prices. In
fact, oil majors have been cutting exploration budgets since early 2014 when oil
prices were still hovering above $100.
It seemed as if the message that the price of oil was sending from about the middle
of last year until just recently was going unheeded by American oil producers. U.S.
oil production kept rising despite dramatically falling prices. But when production
growth finally stopped in June, there was hope that less supply would be weighing
on prices, and predictions abounded that the price would go higher.
The reasoning behind this call was that continuing economic growth worldwide would
combine with stagnating growth in oil supplies to squeeze the market enough to
move prices up.
While low oil prices were supposed to 'spur the global economy' according the the
International Monetary Fund, The Economist magazine took a more measured view.
It also looked at the decline in employment and investment in oil which had
previously been booming.
High-cost oil from the Canadian tar sands is also taking a significant hit as
investment is slashed in the face of low prices.
With the recent renewed slump in oil prices, the industry is trotting out the same kind
of stories it trotted out when oil was around $80 and then $60. Oil at $30 a barrel will
be no problem for a special breed of drillers in the Bakken Formation of North
Dakota, we are told. If you actually read the story, it is stating the obvious: That
break-even prices vary from well to well. And, the writer refers to 'realized' prices, not
the NYMEX futures price. It turns out that because Bakken lacks pipelines for
transporting oil, it must use oil trains. That's expensive.
So, those buying oil from North Dakota take the freight costs into account. The
average realized price on Friday $28.75 for the type of oil extracted from Bakken's
deep shales in North Dakota. While wells that are already drilled often produce
regardless of price because those who operate them must pay back debt, it is
doubtful that very many new wells would be profitable at this price. And, it is worth
noting those investing their capital do not as a rule seek to break even. A break-even
proposition usually sends them looking elsewhere to invest their money.

32
32
Beyond this, there is a broader consideration. And, it is something which very few
people seem to be talking about when it comes to all the information that is
supposed to be conveyed by the oil price.
As the world's central energy commodity, oil is a good indicator of economic activity.
With the nearly universal conviction that the previous bounce in oil prices to around
$60 signaled a stronger economy and thus stronger oil demand, logic would dictate
that we now consider the opposite: That the new slide in oil prices is signaling new
weakness in the world economy. If so, it's the kind that ought to frighten even the
optimists this time.
Having said all this, it might be wise to take any day's price reports in the same way
as the low or high temperatures on a particular day. A cool morning in summer does
not mean winter is right around the corner. Nor does a hot day in mid-winter spell the
end of the season. What's more important is to look at the overall picture to see if the
season is changing--or even more important, if the climate itself has shifted, both
literally and metaphorically.
That takes a lot more analysis than the daily market reports can provide and than
most people--even those whose job it is to follow markets--have patience for.
In that regard the long view suggests that the acute investment slump in oil which is
unfolding will lead to tight supplies in a few years (because of all the wells that are
not going to be drilled to replace the depletion from existing wells). That would set us
up for a price spike at some point as it takes a considerable amount of time to ramp
up new drilling after a long period of decline.
All this assumes that the current seeming weakness in the economy doesn't morph
into something that would cause a long-term economic decline or stagnation which
would keep oil prices low for a much longer period.
View more quality content from
Resource Insights

33
33
Oil Prices: Why We Are Where We Are Today
Written by John Richardson from ICIS
TWO months ago, when I was delivering a training course, people responded with
deep scepticism when I suggested that oil-price stability at around $65 a barrel
wouldn't be sustained during the second half of the year. And when I suggested the
price would soon fall to below $50 a barrel, the reaction of the audience was even
more disbelieving.
It continues. Only last week, when I suggested that there was no reason why crude
might not fall below $40 a barrel later this year, the reaction of several chemical
industry contacts was again, 'Surely not?'
So why have I maintained my bearish view on crude? Here are my five main
reasons:
1. Oil markets, for too many years now, haven't followed the fundamental laws of
supply and demand. Vast quantities of easy economic stimulus money flowed
into futures-market speculation, creating the need by these speculators,
because of their positions, to constantly talk-up up the price of oil to ensure
that it stayed in the region $100 a barrel. It didn't matter if the facts didn't
actually fit their story. All that mattered was that they convinced enough of the
people for enough of the time that their story was right.
2. Easy stimulus money also flowed into oil-supply investments, particularly in
the US, regardless of the signs as early as in 2011 that global demand would
not be sufficiently strong to absorb these new supplies.
3. And the problem is that we are talking about truly vast new supplies of both oil
and gas during a period when the global economy is a lot weaker than many
people had expected.
4. US shale-oil producers, for the time being at least, continue to maintain high
levels of output. This is partly because, as I first argued last October, a few

34
34
cents profit on each barrel of oil is better than no cents at all if you are trying
to pay-back your debts. The cost efficiency of the shale process is
also constantly improving.
5. The Saudis are playing the long game in order to maintain market share -
hence, June saw another record level of production. Saudi Arabia also knows
that global oil consumption growth is likely to slow very dramatically because
of climate-change concerns.They don't want to end up being forced to leave
their most valuable national asset in the ground, and so they intend to pump
as hard as they can for as long as they can.
Why did prices recover from February onwards to a high for Brent of $69.39 a barrel
on 5 May? This was again because of futures markets. A large number of
speculators gambled that supply was about to tighten, even though the evidence had
yet to emerge of significantly tighter supply.
Throughout this rally, it always felt as if it was only a matter of time until this
expectation was proven to be unfounded. That time has now arrived as we also
prepare for a sharp increase, rather than decrease, in supply because of the Iranian
nuclear deal.
Global demand is also getting weaker, mainly because of events in China.
Yesterday, for instance, it was announced that the final Caixin/Markit China
Manufacturing Purchasing Managers' Index for July had dropped to 47.8 from 49.4 in
June. This was the lowest in two years.
Nobody can predict geopolitics. But other than an unforeseen major geopolitical
event, it is hard to see how crude will not continue to fall over the next few months as
it continues to its return to its long-term historic average price of $30 a barrel. And as
this process unfolds, prices could well dip below $30 a barrel.
View more quality content from
ICIS

35
35
The Oil Price: how low is low?
Written by Euan Mearns from Energy Matters With West Texas Intermediate (WTI) and Brent close to their January 2015 lows
some readers are wondering how these lows compare with historic lows when the oil
price is adjusted for inflation (deflated). BP just happen to provide an oil price series
that is adjusted for inflation (Figure 1). The data are annual averages and based on
Brent since 1984. Annual averages conceal the extreme swings in price that tend to
be short lived. At time of writing WTI front month future contract was $44.42 and
Brent front month future was $49.92.

36
36
Figure 1 The blue line gives the annual average oil price (Brent since 1984) in
money of the day and the red line adjusted for inflation expressed in $2014. Three
large spikes in the oil price are evident in the 1860s, 1970s and 2010s. It is notable
that the magnitude of each spike is similar, of the order $100 to $120 (adjusted to
2014 $). The 1860s and 1970s spikes were followed by long bear markets for the oil
price, lasting for 110 years in the case of 1864 to 1973.
To understand what was going on 1861 to 1973 I suggest readers read The Prize:
The Epic Quest for Oil Money and Power that earned author Daniel Yergin the
Pulitzer Prize. It is a tremendous read. Most of us are however, more interested in
how today's prices compare with recent slumps, most notably the slump of 1986 and
1998 (Figure 2).
Figure 2 The main events, Acts 1 to 6, are described briefly below.

37
37
To get straight to the point. Brent will need to fall below $30 to match the lows seen
in 1986 and to below $20 to match the lows seen in 1998. WTI in particular is trading
close to its support level of $43.39 marked on 17 March 2015. If traders push the
price below that level then the price could fall a lot lower for a brief period. At the
fundamental level, supply and demand need to be rebalanced and the main problem
is over-supply of LTO from the USA and of OPEC crude depending upon which way
one views the problem. The recent price action since September 2014 has been
brutal on producers but not yet brutal enough to remove the 3 million bpd over
supply from the system. I do not believe that the white knight of increased demand is
about to gallop over the hill and therefore see a risk of substantially lower price in the
months ahead. Colleague Arthur Berman has a somewhat more upbeat perspective.
Historic Fundamentals
The large scale structure of oil price history is shaped by supply and demand driven
by both political dimensions and industry action and innovation. The main landmarks
are:
1. The 1973 Yom Kippur war followed by the 1974 oil embargo. The amount of crude
withheld from market by OPEC was relatively small (Figure 3) but was sufficient to
cause the first oil price shock.
Figure 3 Oil
exports for selected
OPEC countries
based on BP 2014.

38
38
2. The 1979 Iranian Revolution followed by the 1980 Iran-Iraq war led to the second
oil shock. The price reaction at this time did not reflect the fundamentals of supply
and demand and gravity soon took over sending the price down again in the years
that followed together with OPEC market share.
3. The 1986 slump was caused by OPEC reasserting its authority and trying to
reclaim market share that led to a prolonged bear market that culminated in 1998
when the world was awash in oil.
4. The low point since the first oil shock was marked by $10 oil (money of the day) in
1998. I remember it well since I was running an oil related business at that time. This
heralded in a new era for the industry that went through a massive restructuring with
many household names being swallowed up by the super-majors.
5. The commodities bull run that began around 2002 that lasted to 2008 or 2014
depending upon one's perspective had complex reasons from a perceived peak in
conventional oil production, the Chinese industrial revolution, expansion of debt, zero
interest rate policy (ZIRP) and bubblenomics. Rune Likvern gives a good account of
the links between the oil price and economic policies.
6. The 2008 financial crash brought an end to phase 1 of the bull run that was re-
inflated by OPEC cutting supply and QE blowing more liquidity into the bubble until
2014.
Rune argues that an end to QE in the USA is implicated in recent global currency
adjustments and the rout of the oil price and that is surely part of the story. But the
OPEC policy of maintaining market share and over supply of either LTO or OPEC
crude have also played a prominent role in Act 7 that is still being played out and still
has a way to run before a new market equilibrium is reached.
View more quality content from
Energy Matters

SUPPORTING THE DEVELOPMENT OF NATURAL RESOURCES
rpsgroup.com/energy [email protected]
Operations Support | Technical Studies | Advisory Services Project HSE & Risk Management | Training
40
40
How Did the Oil & Gas Majors Perform in Early 2015?
Written by Mark Young from Evaluate Energy
As Q2 results continue to flood in, Evaluate Energy has reviewed the performance of
the world's oil and gas majors - BP, Chevron, ConocoPhillips, ExxonMobil, Royal
Dutch Shell and Total - to gauge the impact of the price collapse of late 2014 on their
respective starts to 2015, with the main focus on their upstream earnings, production
and capital expenditures.
Earnings Down, Production Slightly Up
Predictably, in terms of unadjusted earnings (see note 1) in the upstream sector, the
start to 2015 has not been the six month period the majors will have hoped for. The
fall in prices saw all six companies report lower quarterly earnings in Q1 and Q2 than
their respective average quarterly earnings from 2014, with half of the group
recording upstream losses in Q2; BP's Q2 earnings were impacted by a loss of over
$10 billion related to the Gulf of Mexico spill response, whilst Chevron - remarkably
recording its first unadjusted upstream quarterly loss in since Q4 2001 - and
ConocoPhillips both suffered impairment charges to account for their own upstream
losses in Q2.
Production was a different story, however, with all companies apart from Shell
averaging a slightly higher rate over the first six months of 2015 compared with the
full year 2014.

41
41
All companies did record a slightly lower average production rate in Q2 2015
compared to Q1 2015, but, with Shell's acquisition of BG in the pipeline, all the
majors are looking at the prospect of higher production than they had in 2014 as we
enter the latter half of the year.
Capital Expenditure Cuts
E&P capital expenditure budgets were the first thing that many companies adjusted
when faced with the prospect of prolonged lower commodity prices - but the majors
did not cut as drastically as everybody else.
In a quick study of 60 U.S. listed companies (see note 2) that cut upstream capex
spends in Q1 2015 compared with the average spend per quarter in 2014, the
average cut was around 33%, with some companies slashing upstream capex by
nearly 80% compared to last year's average quarterly spend. In contrast, Total
bucked the trend and spent more in Q1 compared to 2014's quarterly average, whilst
the other 5 majors average only a 20% cut between them. Moving into Q2, 53 of the
60 U.S. companies continued to drop capex spends from Q1 levels at an average of
32%. As for the majors, ConocoPhillips - the only company of the 6 not to have a
refining sector to bolster its overall earnings by taking advantage of lower raw

42
42
material costs - was the only one that continued to significantly drop its spending,
whilst BP, Chevron, ExxonMobil and Shell all maintained Q1 levels and Total
dropped spending from its high Q1 outlay. For Total, this means its 2015 average
quarterly spend is now back in line with average 2014 levels.
Of course, it's not easy to pull the plug on large-scale projects, which tend to be the
domain of the majors, and capital will be committed to them regardless of price
movement. While this dynamic will have played some role in the majors not cutting
their spending as much as smaller companies, the apparent lack in reaction by the
majors compared to the rest of the industry does stand out.
However, should commodity prices continue to drop or fail to rebound any time soon,
it wouldn't be the greatest of surprises to eventually see the majors cut their
spending more deeply.
Notes
1. The term 'unadjusted earnings' used throughout refers to income including the
impact of non-recurring items, such as impairments, legal or restructuring
charges, as well as gains or losses on asset sales. Apart from BP, all majors
report this item for the upstream segment on a post-tax basis. BP reports this
item on a pre-tax basis.

43
43
2. The 60 U.S. listed companies that dropped capex in Q1 2015 compared to
average 2014: Abraxas Petroleum Corp., Anadarko Petroleum Corp., Antero
Resources Corp., Apache Corp., Approach Resources Inc., Atlas Resource
Partners L.P., Bill Barrett Corp., Bonanza Creek Energy Inc., Breitburn Energy
Partners L.P., Cabot Oil & Gas Corp., California Resources Corp., Callon
Petroleum Co., Carrizo Oil & Gas Inc., Chesapeake Energy Corp., Cimarex
Energy Co., Clayton Williams Energy Inc., Comstock Resources Inc.,
CONSOL Energy Inc., Denbury Resources Inc., Devon Energy Corp.,
Diamondback Energy Inc., Emerald Oil Inc., Enerplus Corp., EOG Resources
Inc., EP Energy Corp., EV Energy Partners L.P., Freeport-McMoRan Inc.,
Goodrich Petroleum Corp., Gulfport Energy Corp., Halcon Resources Corp.,
Hess Corp., Laredo Petroleum Inc., Linn Energy LLC., LRR Energy L.P.,
Marathon Oil Corp., Matador Resources Co., Memorial Production Partners
L.P., Murphy Oil Corp., Noble Energy Inc., Northern Oil & Gas Inc., Oasis
Petroleum Inc., Parsley Energy Inc., Penn Virginia Corp., PetroQuest Energy
Inc., Pioneer Natural Resources Co., QEP Resources Inc., Rex Energy Corp.,
Rice Energy Inc., Rosetta Resources Inc., RSP Permian Inc., Sanchez
Energy Corp., SandRidge Energy Inc., SM Energy Co., Southwestern Energy
Co., Stone Energy Corp., Swift Energy Co., Ultra Petroleum Corp., Unit Corp.,
W & T Offshore Inc., Warren Resources Inc.
3. Upstream capex in this study excludes the impact of any asset dispositions.
All data here is taken from the Evaluate Energy database, which provides Evaluate
Energy subscribers with over 25 years' coverage of the world's biggest and most
significant oil and gas companies. Evaluate Energy also has a mergers &
acquisitions database, covering all E&P asset, corporate and farm-in deals back to
2008, as well as refinery, LNG, midstream and oil service sector deals. For more on
Evaluate Energy and its products, please download our brochure.
View more quality content from
Evaluate Energy

44
44
Tullow Oil boss Heavey predicts oil price will hit $75 a barrel by year end
Written by John Mulligan from Independent.ie
Tullow Oil boss Aidan Heavey has predicted that oil prices will level off about $75 a
barrel this year but insisted the industry can still make money if prices were to keep
falling.
'The oil industry is very robust. We've made money at $20 a barrel, at $15 and at
$30,' the told the Irish Independent. 'The industry is geared towards adjusting itself,
whatever the oil environment is.'
He was speaking as Tullow Oil announced that first-half results that were broadly in
line with expectations, as revenue fell 35pc to $820m and pre-tax losses narrowed to
$10m from $29m. Its net loss was $68m - much better than analysts expected. It was
helped by lower exploration write-downs. It will spend a total of between $200m and
$250m this year on exploration. Tullow, whose primary operational focus is in Africa,
has been re-engineering its business in light of the oil price slump. It's cutting $500m
(€453m) in costs over the next three years and has reduced staff numbers.
The price of Brent Crude - an industry benchmark - has fallen about 50pc in the past
year and is now hovering around $50 a barrel. Shares in Tullow have fallen about
70pc in the same period, raising speculation that it could become a takeover target.
'The problem today is that you don't have a stabilised commodity prices worldwide,'
said Mr Heavey.
'Unless you get stability in there, companies like ourselves do exactly what we have
just done and reset the business to be competitive in a low oil price environment.'
He said Tullow's first-half results don't reflect the impact of its cost cutting, which will
become more fully evident in the current half and next year.

45
45
'We have completed a major cost-cutting exercise and restructured our financial
facilities. We've focused on the really high margin-producing assets and hedged
them to secure them,' he added.
Tullow's main asset is the Jubilee field off Ghana, where it's also progressing
another major offshore project due to come on stream in 2016. Tullow is active in
countries including Kenya.
Indo Business
View more quality content from
Independent.ie