oiv statistical report on world vitiviniculture · moldova 137 140 140 140 140 2.1% inde 127 128...
TRANSCRIPT
2018 World Vitiviniculture Situation
OIV Statistical Report on World
Vitiviniculture
2 © OIV Statistical Report on World Vitiviniculture
Introduction
This report has been prepared by the Statistics department of the International Organisation of Vine and Wine (OIV) under the supervision of Director General Jean-Marie Aurand.
This annual statistics reports provides data on the world’s vitiviniculture situation in the year 2017. It presents an overview on the global and country information on vines, grapes and wine.
The different sections in this report are notably focused on presenting the rate of production and consumption, as well as the degree of balance between these sectors in the wine market.
These data collected annually confirm the OIV’s commitment to providing timely and accurate information towards the improvement of the vitiviniculture sector.
Abbreviationskha thousand of hectares
mha million of hectares
kt thousand of tons
mt million of tons
khl thousand of hectoliters
mhl million of hectoliters
bn billion
€ euros
3© OIV Statistical Report on World Vitiviniculture
This report includes sections on:• I. Surface Area
• II. Grape production
• III. Wine production
• IV. Wine consumption
• V. International wine trade
The data published in this report have been harmonized with those available to the United Nations Food and Agriculture Organization (FAO).
We have derived these data from a variety of sources. In hierarchical order of importance these sources are:- data obtained from questionnaires completed by Member States - data from public sources, such as national statistical agencies - data from the European Commission
Readers are welcome to use the information provided in the following pages, but are requested to cite OIV as the source.
For technical inquiries please contact [email protected]. For media inquiries please contact [email protected].
4 © OIV Statistical Report on World Vitiviniculture
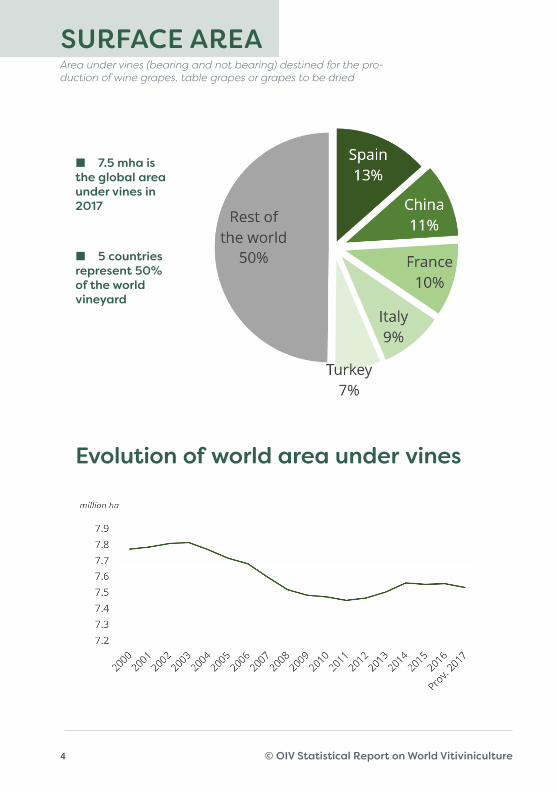
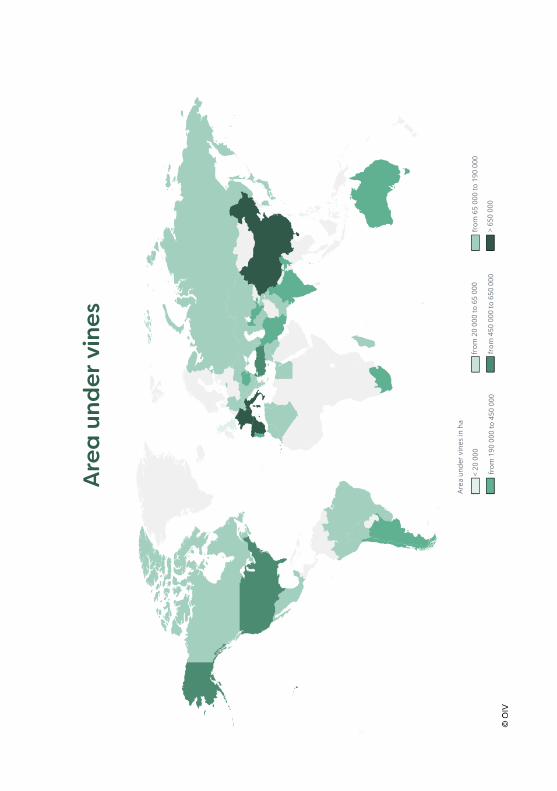
SURFACE AREAArea under vines (bearing and not bearing) destined for the pro-duction of wine grapes, table grapes or grapes to be dried
Evolution of world area under vines
⬛ 7.5 mha is the global area under vines in 2017
⬛ 5 countries represent 50% of the world vineyard
5© OIV Statistical Report on World Vitiviniculture
SURFACE AREAArea under vines destined for the production of wine grapes, table
grapes or grapes to be dried, both bearing and not bearing
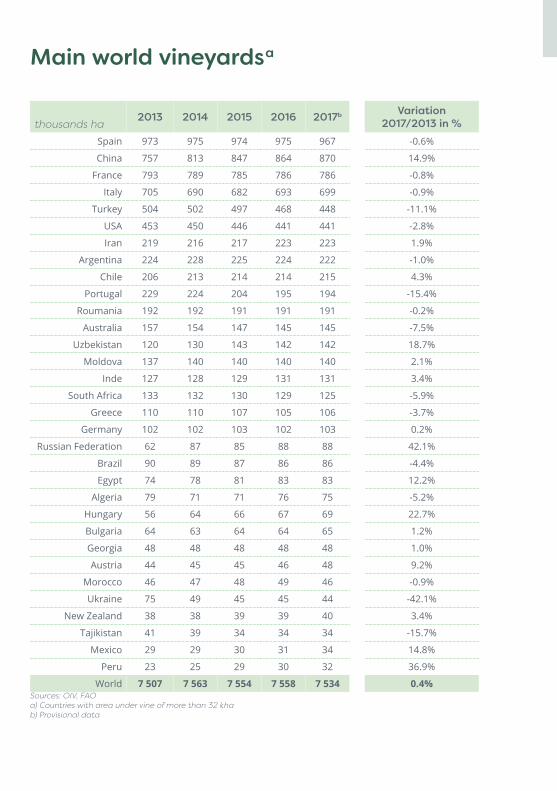
Main world vineyards a
thousands ha2013 2014 2015 2016 2017b Variation
2017/2013 in %
Spain 973 975 974 975 967 -0.6%
China 757 813 847 864 870 14.9%
France 793 789 785 786 786 -0.8%
Italy 705 690 682 693 699 -0.9%
Turkey 504 502 497 468 448 -11.1%
USA 453 450 446 441 441 -2.8%
Iran 219 216 217 223 223 1.9%
Argentina 224 228 225 224 222 -1.0%
Chile 206 213 214 214 215 4.3%
Portugal 229 224 204 195 194 -15.4%
Roumania 192 192 191 191 191 -0.2%
Australia 157 154 147 145 145 -7.5%
Uzbekistan 120 130 143 142 142 18.7%
Moldova 137 140 140 140 140 2.1%
Inde 127 128 129 131 131 3.4%
South Africa 133 132 130 129 125 -5.9%
Greece 110 110 107 105 106 -3.7%
Germany 102 102 103 102 103 0.2%
Russian Federation 62 87 85 88 88 42.1%
Brazil 90 89 87 86 86 -4.4%
Egypt 74 78 81 83 83 12.2%
Algeria 79 71 71 76 75 -5.2%
Hungary 56 64 66 67 69 22.7%
Bulgaria 64 63 64 64 65 1.2%
Georgia 48 48 48 48 48 1.0%
Austria 44 45 45 46 48 9.2%
Morocco 46 47 48 49 46 -0.9%
Ukraine 75 49 45 45 44 -42.1%
New Zealand 38 38 39 39 40 3.4%
Tajikistan 41 39 34 34 34 -15.7%
Mexico 29 29 30 31 34 14.8%
Peru 23 25 29 30 32 36.9%
World 7 507 7 563 7 554 7 558 7 534 0.4%Sources: OIV, FAO a) Countries with area under vine of more than 32 kha b) Provisional data
Are
a u
nder
vin
es
Area
und
er v
ines
in h
a
< 20
000
> 65
0 00
0fr
om 1
90 0
00 to
450
000
from
65
000
to 1
90 0
00fr
om 2
0 00
0 to
65
000
from
450
000
to 6
50 0
00

8 © OIV Statistical Report on World Vitiviniculture
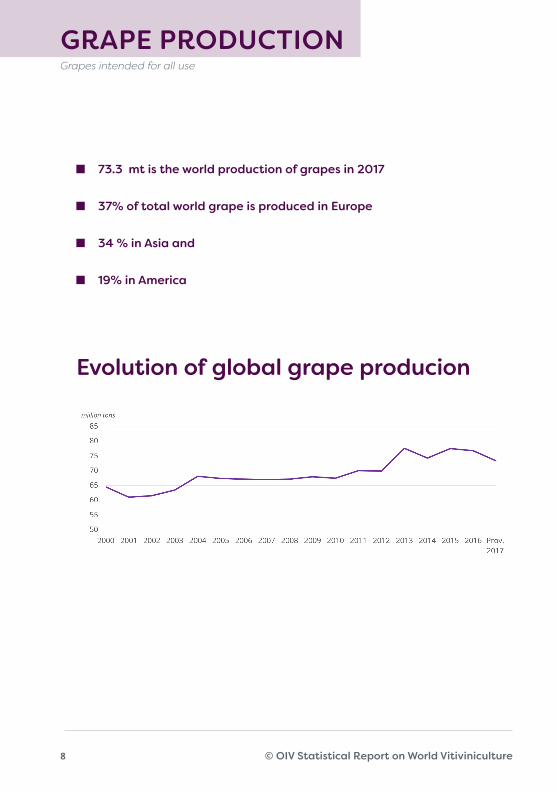
GRAPE PRODUCTIONGrapes intended for all use
Evolution of global grape producion
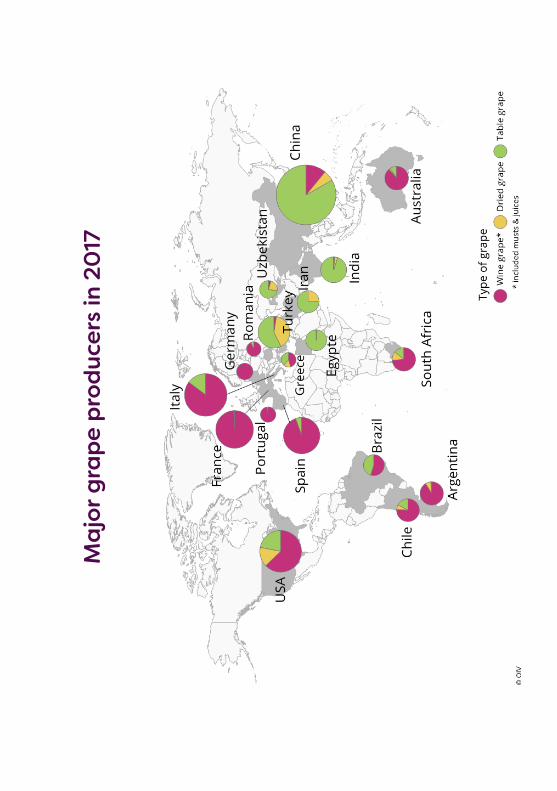
⬛ 73.3 mt is the world production of grapes in 2017
⬛ 37% of total world grape is produced in Europe
⬛ 34 % in Asia and
⬛ 19% in America
9© OIV Statistical Report on World Vitiviniculture
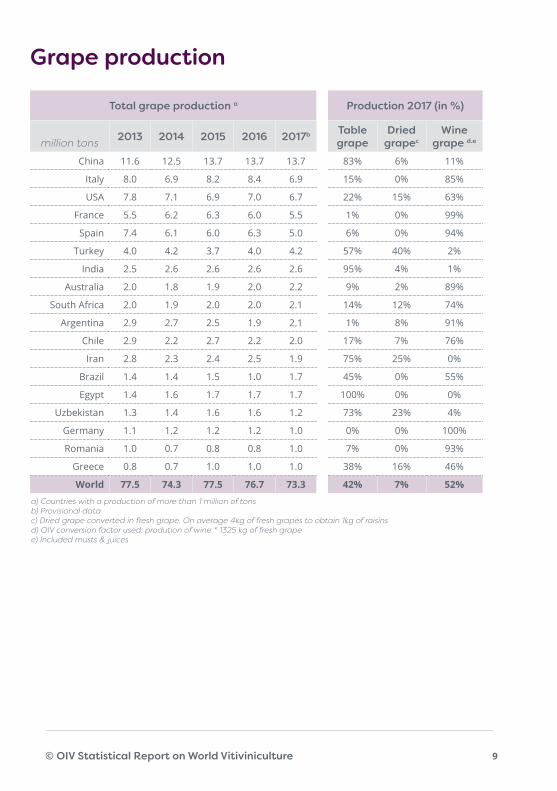
Grape production
Total grape production a Production 2017 (in %)
million tons 2013 2014 2015 2016 2017b Table grape
Dried grapec
Wine grape d.e
China 11.6 12.5 13.7 13.7 13.7 83% 6% 11%
Italy 8.0 6.9 8.2 8.4 6.9 15% 0% 85%
USA 7.8 7.1 6.9 7.0 6.7 22% 15% 63%
France 5.5 6.2 6.3 6.0 5.5 1% 0% 99%
Spain 7.4 6.1 6.0 6.3 5.0 6% 0% 94%
Turkey 4.0 4.2 3.7 4.0 4.2 57% 40% 2%
India 2.5 2.6 2.6 2.6 2.6 95% 4% 1%
Australia 2.0 1.8 1.9 2.0 2.2 9% 2% 89%
South Africa 2.0 1.9 2.0 2.0 2.1 14% 12% 74%
Argentina 2.9 2.7 2.5 1.9 2.1 1% 8% 91%
Chile 2.9 2.2 2.7 2.2 2.0 17% 7% 76%
Iran 2.8 2.3 2.4 2.5 1.9 75% 25% 0%
Brazil 1.4 1.4 1.5 1.0 1.7 45% 0% 55%
Egypt 1.4 1.6 1.7 1.7 1.7 100% 0% 0%
Uzbekistan 1.3 1.4 1.6 1.6 1.2 73% 23% 4%
Germany 1.1 1.2 1.2 1.2 1.0 0% 0% 100%
Romania 1.0 0.7 0.8 0.8 1.0 7% 0% 93%
Greece 0.8 0.7 1.0 1.0 1.0 38% 16% 46%
World 77.5 74.3 77.5 76.7 73.3 42% 7% 52%a) Countries with a production of more than 1 million of tons b) Provisional data c) Dried grape converted in fresh grape. On average 4kg of fresh grapes to obtain 1kg of raisins d) OIV conversion factor used: prodution of wine * 1325 kg of fresh grape e) Included musts & juices
10 © OIV Statistical Report on World Vitiviniculture
GRAPE PRODUCTIONGrapes intended for all use
Maj
or g
rap
e p
rod
ucer
s in
20
17

12 © OIV Statistical Report on World Vitiviniculture
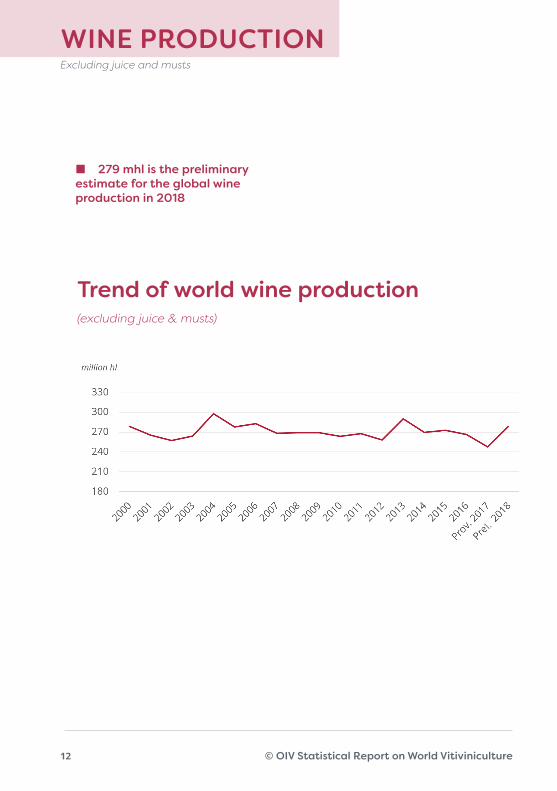
WINE PRODUCTIONExcluding juice and musts
Trend of world wine production (excluding juice & musts)
⬛ 279 mhl is the preliminary estimate for the global wine production in 2018
l.
13© OIV Statistical Report on World Vitiviniculture
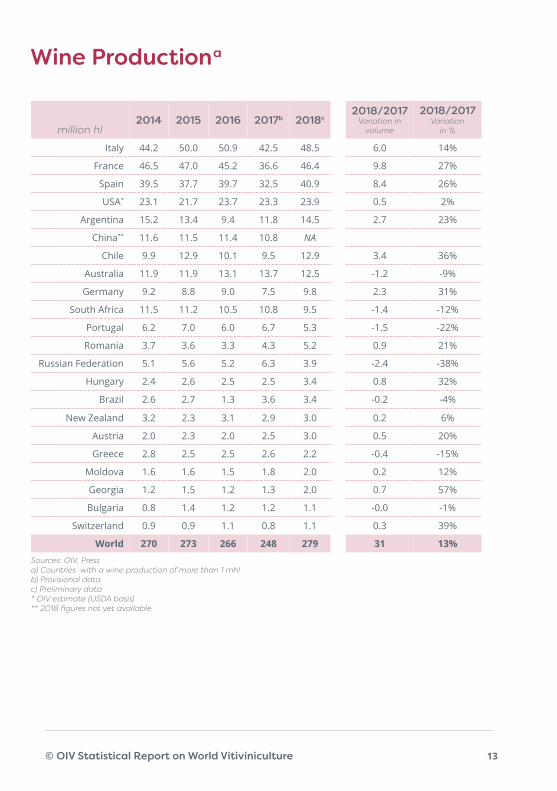
Wine Production a
million hl2014 2015 2016 2017b 2018c
2018/2017 Variation in
volume
2018/2017 Variation
in %
Italy 44.2 50.0 50.9 42.5 48.5 6.0 14%
France 46.5 47.0 45.2 36.6 46.4 9.8 27%
Spain 39.5 37.7 39.7 32.5 40.9 8.4 26%
USA* 23.1 21.7 23.7 23.3 23.9 0.5 2%
Argentina 15.2 13.4 9.4 11.8 14.5 2.7 23%
China** 11.6 11.5 11.4 10.8 NA
Chile 9.9 12.9 10.1 9.5 12.9 3.4 36%
Australia 11.9 11.9 13.1 13.7 12.5 -1.2 -9%
Germany 9.2 8.8 9.0 7.5 9.8 2.3 31%
South Africa 11.5 11.2 10.5 10.8 9.5 -1.4 -12%
Portugal 6.2 7.0 6.0 6.7 5.3 -1.5 -22%
Romania 3.7 3.6 3.3 4.3 5.2 0.9 21%
Russian Federation 5.1 5.6 5.2 6.3 3.9 -2.4 -38%
Hungary 2.4 2.6 2.5 2.5 3.4 0.8 32%
Brazil 2.6 2.7 1.3 3.6 3.4 -0.2 -4%
New Zealand 3.2 2.3 3.1 2.9 3.0 0.2 6%
Austria 2.0 2.3 2.0 2.5 3.0 0.5 20%
Greece 2.8 2.5 2.5 2.6 2.2 -0.4 -15%
Moldova 1.6 1.6 1.5 1.8 2.0 0.2 12%
Georgia 1.2 1.5 1.2 1.3 2.0 0.7 57%
Bulgaria 0.8 1.4 1.2 1.2 1.1 -0.0 -1%
Switzerland 0.9 0.9 1.1 0.8 1.1 0.3 39%
World 270 273 266 248 279 31 13%Sources: OIV, Press a) Countries with a wine production of more than 1 mhl b) Provisional data c) Preliminary data * OIV estimate (USDA basis) ** 2018 figures not yet available
14 © OIV Statistical Report on World Vitiviniculture
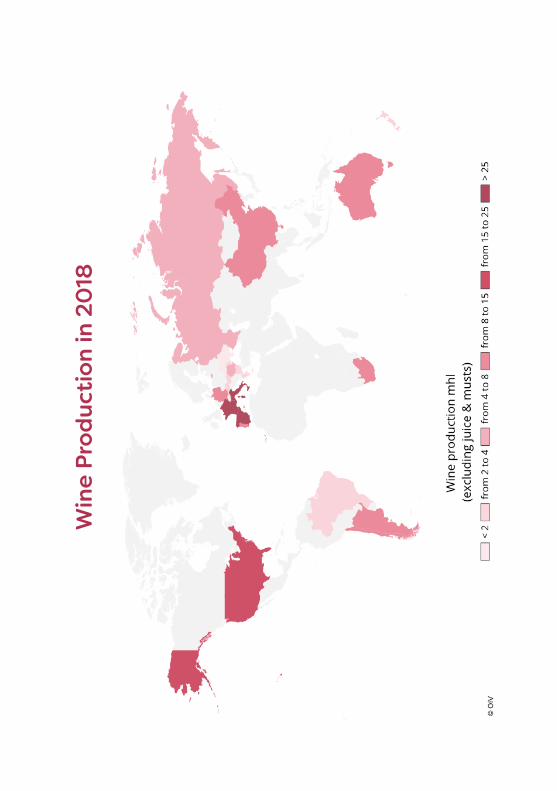
WINE PRODUCTIONExcluding juice and musts
Win
e Pr
oduc
tion
in 2
018

16 © OIV Statistical Report on World Vitiviniculture
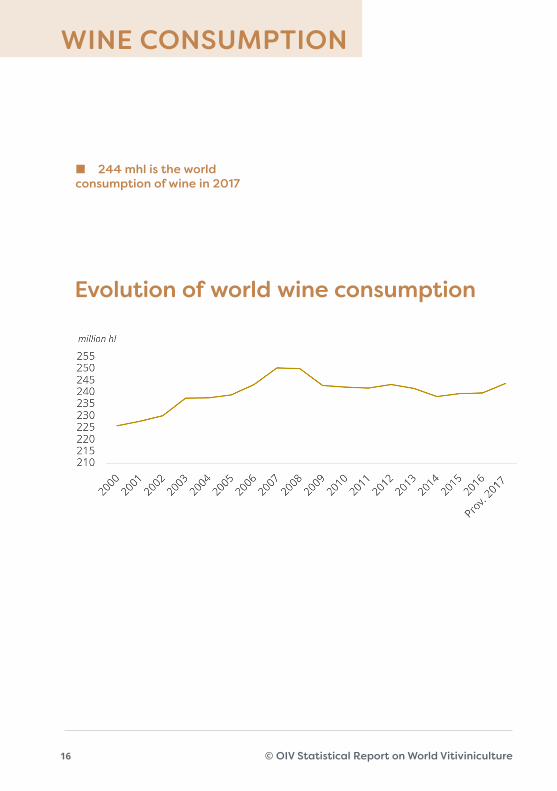
WINE CONSUMPTION
Evolution of world wine consumption
⬛ 244 mhl is the world consumption of wine in 2017
17© OIV Statistical Report on World Vitiviniculture
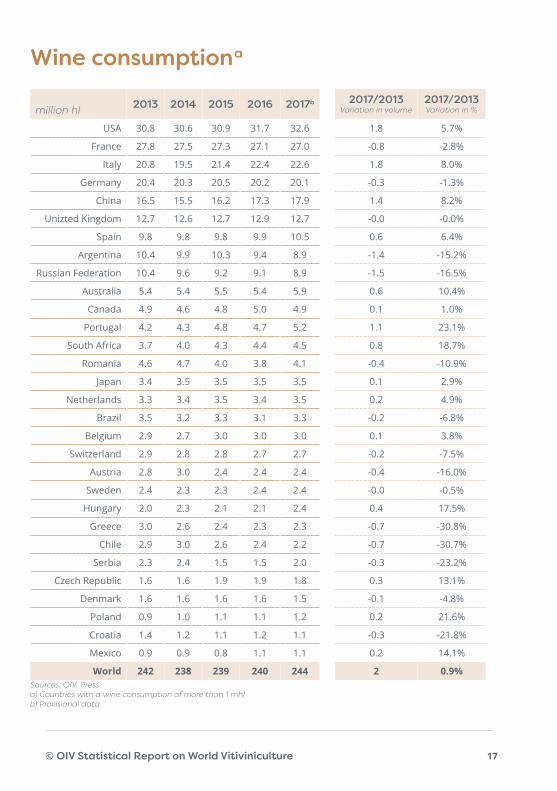
Wine consumption a
million hl 2013 2014 2015 2016 2017b 2017/2013 Variation in volume
2017/2013 Variation in %
USA 30.8 30.6 30.9 31.7 32.6 1.8 5.7%
France 27.8 27.5 27.3 27.1 27.0 -0.8 -2.8%
Italy 20.8 19.5 21.4 22.4 22.6 1.8 8.0%
Germany 20.4 20.3 20.5 20.2 20.1 -0.3 -1.3%
China 16.5 15.5 16.2 17.3 17.9 1.4 8.2%
Unizted Kingdom 12.7 12.6 12.7 12.9 12.7 -0.0 -0.0%
Spain 9.8 9.8 9.8 9.9 10.5 0.6 6.4%
Argentina 10.4 9.9 10.3 9.4 8.9 -1.4 -15.2%
Russian Federation 10.4 9.6 9.2 9.1 8.9 -1.5 -16.5%
Australia 5.4 5.4 5.5 5.4 5.9 0.6 10.4%
Canada 4.9 4.6 4.8 5.0 4.9 0.1 1.0%
Portugal 4.2 4.3 4.8 4.7 5.2 1.1 23.1%
South Africa 3.7 4.0 4.3 4.4 4.5 0.8 18.7%
Romania 4.6 4.7 4.0 3.8 4.1 -0.4 -10.9%
Japan 3.4 3.5 3.5 3.5 3.5 0.1 2.9%
Netherlands 3.3 3.4 3.5 3.4 3.5 0.2 4.9%
Brazil 3.5 3.2 3.3 3.1 3.3 -0.2 -6.8%
Belgium 2.9 2.7 3.0 3.0 3.0 0.1 3.8%
Switzerland 2.9 2.8 2.8 2.7 2.7 -0.2 -7.5%
Austria 2.8 3.0 2.4 2.4 2.4 -0.4 -16.0%
Sweden 2.4 2.3 2.3 2.4 2.4 -0.0 -0.5%
Hungary 2.0 2.3 2.1 2.1 2.4 0.4 17.5%
Greece 3.0 2.6 2.4 2.3 2.3 -0.7 -30.8%
Chile 2.9 3.0 2.6 2.4 2.2 -0.7 -30.7%
Serbia 2.3 2.4 1.5 1.5 2.0 -0.3 -23.2%
Czech Republic 1.6 1.6 1.9 1.9 1.8 0.3 13.1%
Denmark 1.6 1.6 1.6 1.6 1.5 -0.1 -4.8%
Poland 0.9 1.0 1.1 1.1 1.2 0.2 21.6%
Croatia 1.4 1.2 1.1 1.2 1.1 -0.3 -21.8%
Mexico 0.9 0.9 0.8 1.1 1.1 0.2 14.1%
World 242 238 239 240 244 2 0.9%Sources: OIV, Press a) Countries with a wine consumption of more than 1 mhlb) Provisional data
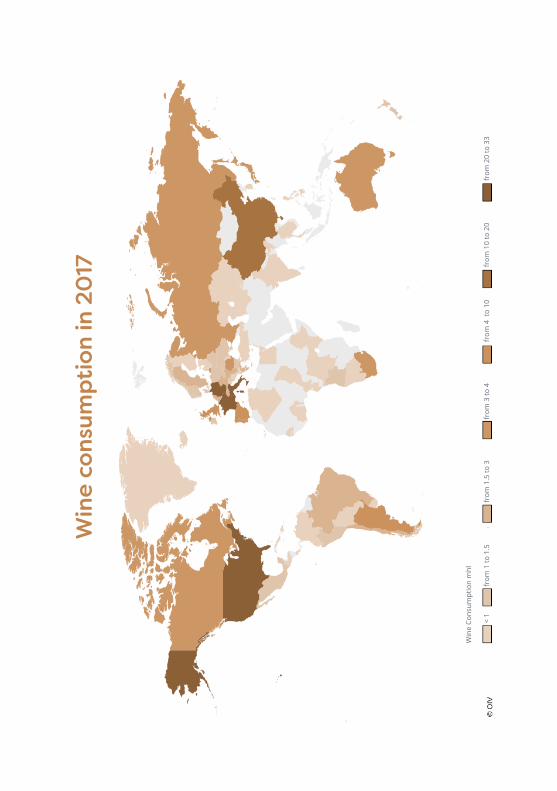
Win
e co
nsum
ptio
n in
20
17
from
1 to
1.5
from
1.5
to 3
from
3 to
4fr
om 4
to
10fr
om 1
0 to
20
from
20
to 3
3<
1
Win
e Co
nsum
ptio
n m
hl

20 © OIV Statistical Report on World Vitiviniculture
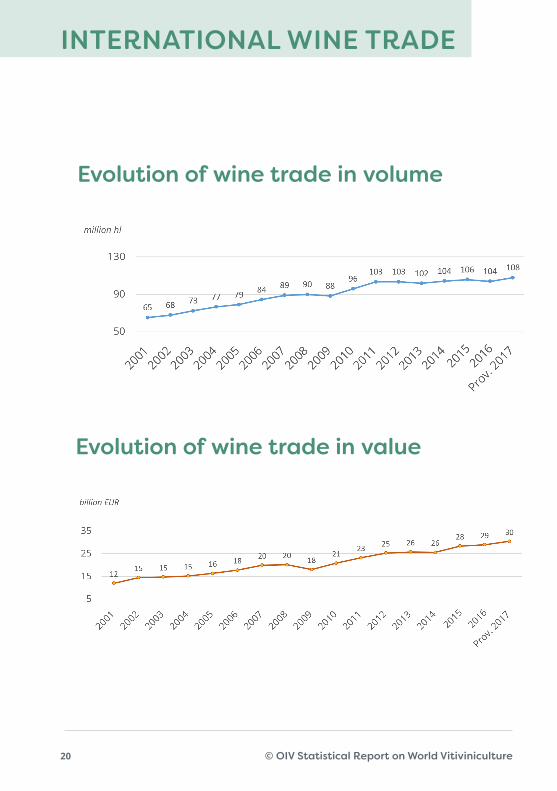
INTERNATIONAL WINE TRADE
Evolution of wine trade in volume
Evolution of wine trade in value
21© OIV Statistical Report on World Vitiviniculture
INTERNATIONAL WINE TRADE
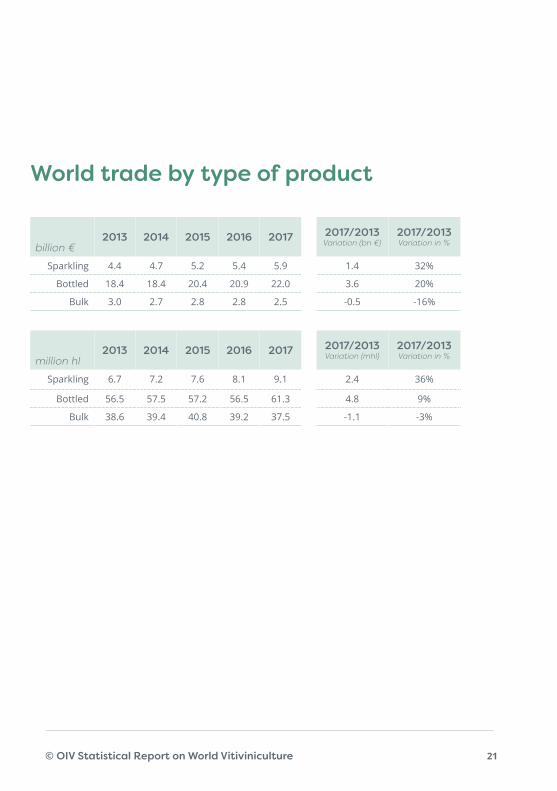
World trade by type of product
billion €2013 2014 2015 2016 2017 2017/2013
Variation (bn €)2017/2013 Variation in %
Sparkling 4.4 4.7 5.2 5.4 5.9 1.4 32%
Bottled 18.4 18.4 20.4 20.9 22.0 3.6 20%
Bulk 3.0 2.7 2.8 2.8 2.5 -0.5 -16%
million hl2013 2014 2015 2016 2017 2017/2013
Variation (mhl)2017/2013 Variation in %
Sparkling 6.7 7.2 7.6 8.1 9.1 2.4 36%
Bottled 56.5 57.5 57.2 56.5 61.3 4.8 9%
Bulk 38.6 39.4 40.8 39.2 37.5 -1.1 -3%
22 © OIV Statistical Report on World Vitiviniculture
INTERNATIONAL WINE TRADE
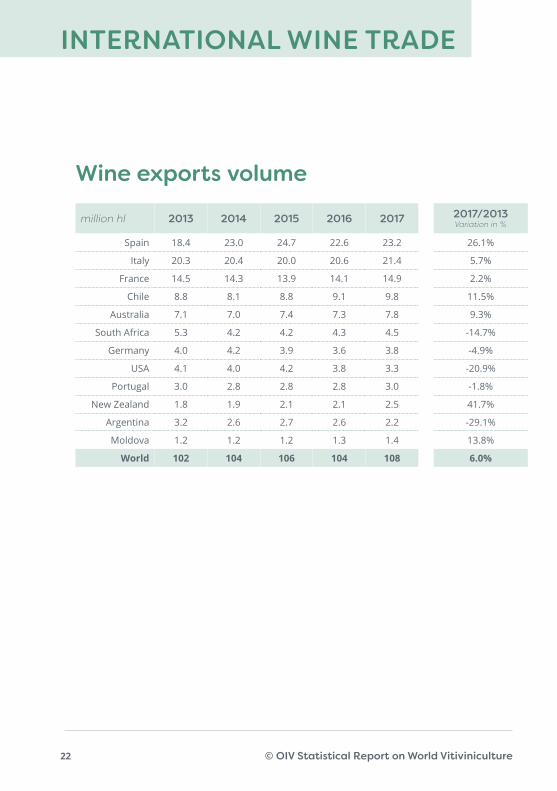
Wine exports volume
million hl 2013 2014 2015 2016 2017 2017/2013 Variation in %
Spain 18.4 23.0 24.7 22.6 23.2 26.1%
Italy 20.3 20.4 20.0 20.6 21.4 5.7%
France 14.5 14.3 13.9 14.1 14.9 2.2%
Chile 8.8 8.1 8.8 9.1 9.8 11.5%
Australia 7.1 7.0 7.4 7.3 7.8 9.3%
South Africa 5.3 4.2 4.2 4.3 4.5 -14.7%
Germany 4.0 4.2 3.9 3.6 3.8 -4.9%
USA 4.1 4.0 4.2 3.8 3.3 -20.9%
Portugal 3.0 2.8 2.8 2.8 3.0 -1.8%
New Zealand 1.8 1.9 2.1 2.1 2.5 41.7%
Argentina 3.2 2.6 2.7 2.6 2.2 -29.1%
Moldova 1.2 1.2 1.2 1.3 1.4 13.8%
World 102 104 106 104 108 6.0%
23© OIV Statistical Report on World Vitiviniculture
INTERNATIONAL WINE TRADE
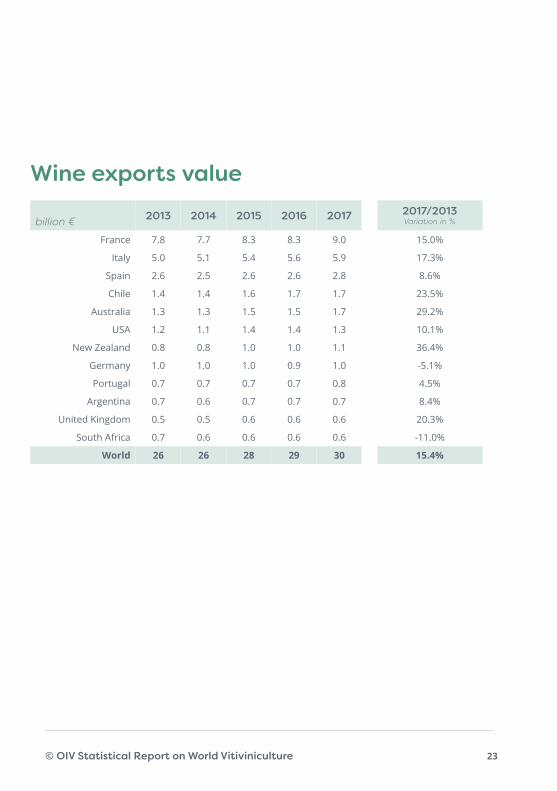
billion € 2013 2014 2015 2016 2017 2017/2013 Variation in %
France 7.8 7.7 8.3 8.3 9.0 15.0%
Italy 5.0 5.1 5.4 5.6 5.9 17.3%
Spain 2.6 2.5 2.6 2.6 2.8 8.6%
Chile 1.4 1.4 1.6 1.7 1.7 23.5%
Australia 1.3 1.3 1.5 1.5 1.7 29.2%
USA 1.2 1.1 1.4 1.4 1.3 10.1%
New Zealand 0.8 0.8 1.0 1.0 1.1 36.4%
Germany 1.0 1.0 1.0 0.9 1.0 -5.1%
Portugal 0.7 0.7 0.7 0.7 0.8 4.5%
Argentina 0.7 0.6 0.7 0.7 0.7 8.4%
United Kingdom 0.5 0.5 0.6 0.6 0.6 20.3%
South Africa 0.7 0.6 0.6 0.6 0.6 -11.0%
World 26 26 28 29 30 15.4%
Wine exports value
24 © OIV Statistical Report on World Vitiviniculture
INTERNATIONAL WINE TRADE
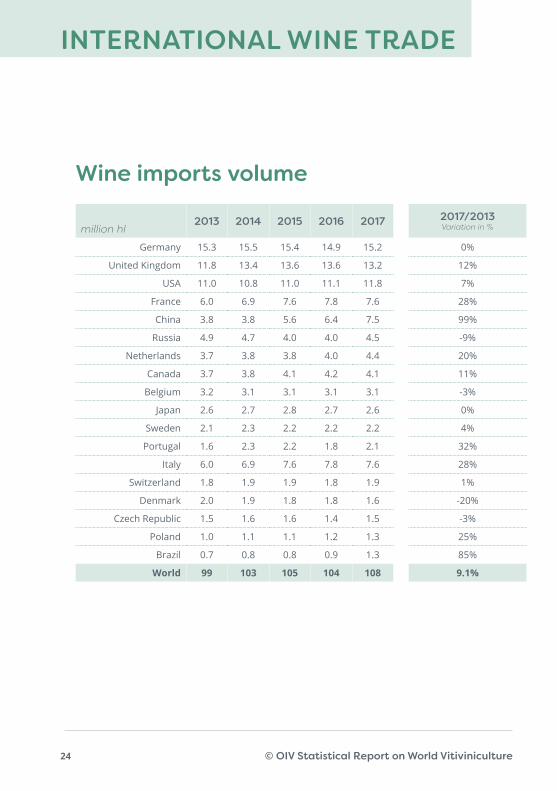
Wine imports volume
million hl2013 2014 2015 2016 2017 2017/2013
Variation in %
Germany 15.3 15.5 15.4 14.9 15.2 0%
United Kingdom 11.8 13.4 13.6 13.6 13.2 12%
USA 11.0 10.8 11.0 11.1 11.8 7%
France 6.0 6.9 7.6 7.8 7.6 28%
China 3.8 3.8 5.6 6.4 7.5 99%
Russia 4.9 4.7 4.0 4.0 4.5 -9%
Netherlands 3.7 3.8 3.8 4.0 4.4 20%
Canada 3.7 3.8 4.1 4.2 4.1 11%
Belgium 3.2 3.1 3.1 3.1 3.1 -3%
Japan 2.6 2.7 2.8 2.7 2.6 0%
Sweden 2.1 2.3 2.2 2.2 2.2 4%
Portugal 1.6 2.3 2.2 1.8 2.1 32%
Italy 6.0 6.9 7.6 7.8 7.6 28%
Switzerland 1.8 1.9 1.9 1.8 1.9 1%
Denmark 2.0 1.9 1.8 1.8 1.6 -20%
Czech Republic 1.5 1.6 1.6 1.4 1.5 -3%
Poland 1.0 1.1 1.1 1.2 1.3 25%
Brazil 0.7 0.8 0.8 0.9 1.3 85%
World 99 103 105 104 108 9.1%
25© OIV Statistical Report on World Vitiviniculture
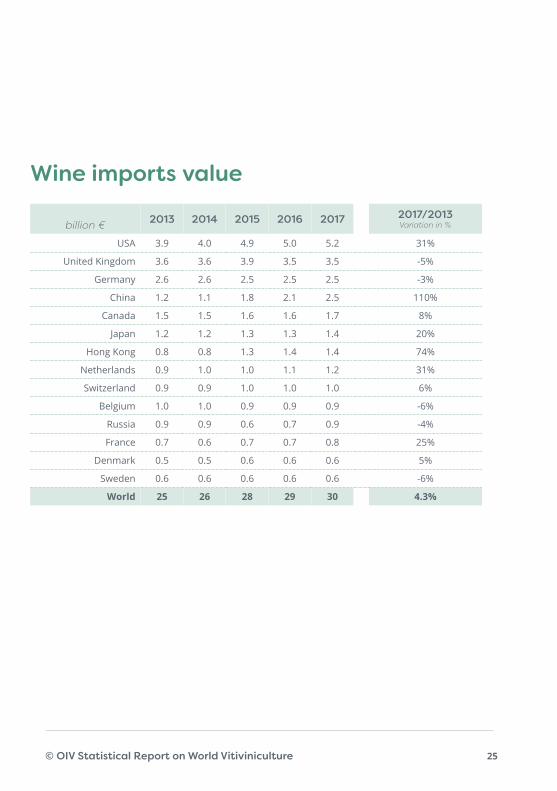
billion € 2013 2014 2015 2016 2017 2017/2013 Variation in %
USA 3.9 4.0 4.9 5.0 5.2 31%
United Kingdom 3.6 3.6 3.9 3.5 3.5 -5%
Germany 2.6 2.6 2.5 2.5 2.5 -3%
China 1.2 1.1 1.8 2.1 2.5 110%
Canada 1.5 1.5 1.6 1.6 1.7 8%
Japan 1.2 1.2 1.3 1.3 1.4 20%
Hong Kong 0.8 0.8 1.3 1.4 1.4 74%
Netherlands 0.9 1.0 1.0 1.1 1.2 31%
Switzerland 0.9 0.9 1.0 1.0 1.0 6%
Belgium 1.0 1.0 0.9 0.9 0.9 -6%
Russia 0.9 0.9 0.6 0.7 0.9 -4%
France 0.7 0.6 0.7 0.7 0.8 25%
Denmark 0.5 0.5 0.6 0.6 0.6 5%
Sweden 0.6 0.6 0.6 0.6 0.6 -6%
World 25 26 28 29 30 4.3%
Wine imports value
26 © OIV Statistical Report on World Vitiviniculture
International Organisation of Vine and Wine18. rue d’Aguesseau
75008 Parishttp://www.oiv.int
Tel. +33 1 44 94 80 80
Follow us: