oklahoma monthly climate summary …climate.ok.gov/summaries/monthly/2006/mcs_september_2006.pdfof...
TRANSCRIPT

Copyright © 2006 Board of Regents of the University of Oklahoma. Oklahoma Monthly Climate Summary|�
Things were not looking good for September, following the scorcher of a summer Oklahoma endured in 2006. Fortune smiled upon the state, however, and provided the 10th coolest September on record, just in time to halt a slew of triple-digit temperatures. The cool weather also stopped 2006’s march towards the warmest year on record, dropping the January-September period to the 2nd warmest since 1895. Drought conditions were alleviated somewhat, especially in the southwest and east central sections, where rainfall amounts between 3-6 inches were common. Other areas, including the northwestern one-third of the state, were extremely dry once again. The month finished as the 39th driest on record, averaged statewide. Several bouts with severe weather were punctuated by the return of tornadoes with two touchdowns of weak twisters in Pushmataha County. Those two F0 tornadoes were the first to strike Oklahoma since June 21.
Precipitation
The statewide average precipitation total fell more than an inch below normal. North central Oklahoma was the hardest hit at barely under an inch, the 12th driest September for that region. Most areas of the state were 1-3 inches below normal for the
month. Apache led the state at over six inches of precipitation, with Freedom bringing up the rear at less than one-third of an inch. The year-to-date precipitation total still lags well behind normal with a deficit of more than eight inches, enough to rank as the 11th driest January-September on record.
Temperature
Oklahoma temperatures were 2-4 degrees below normal over much of the state during September, an even three degrees below normal averaged statewide. The Panhandle spent much of the month behind meandering cold fronts to finish over 4 degrees below normal, the 3rd coolest September on record for that region. The southwest was nearly four degrees below normal as well, the 7th coolest on record. The Mesonet site at Kenton recorded the coolest reading of the month with a 35-degree mark on the 28th. The warmest reading, 98 degrees, occurred at Newport on the 22nd.
OKLAHOMA MONTHLY CLIMATE SUMMARY
SEPTEMBER 2006
September 2006 Statewide ExtremesDescription Extreme Station Date
High Temperature 98ºF Newport Sep 22Low Temperature 35ºF Kenton Sep 28High Precipitation 6.07 in. ApacheLow Precipitation 0.31 in. Freedom
The Oklahoma Climatological Survey has moved to its new home in the National Weather Center
WE’VE MOVED
Our new address:120 David L. Boren Blvd., Suite 2900Norman, OK 73072-7305

Copyright © 2006 Board of Regents of the University of Oklahoma. Oklahoma Monthly Climate Summary|2
September Daily Highlights
September 1-4: A rainy beginning to September, a narrow band of showers and storms settled in the northwest ahead of an approaching cold front on the 1st. The 2nd was cloudy and cool as a widespread rain fell across the state, with high temperatures a good 10-20 degrees below normal. The cool weather continued for the next couple of days. Low temperatures dropped into the 40s in the Panhandle, but still managed to remain in the 70s in southeastern Oklahoma. High temperatures also modified somewhat, but remained more than 10 degrees below normal.
September 5-8: The next several days were almost autumnal under the influence of the surface high pressure system that built in following the cold front. High temperatures were in the 70s and 80s, and lows dropped predominantly into the 50s and 60s.
September 9--11: More rain on the 9th as another cold front approached the state. Amounts were light, but Beaver had a heaver storm dump well over an inch of rain on that location. Stronger storms, some severe, were in store for the state on the 10th and 11th. Hail to the size of golf balls fell in Roger Mills County, while winds gusted to 60 mph in several locations. High temperatures managed to return to seasonal averages by the 11th, rising into the 80s and 90s.
September 12-16: Strong northerly winds ushered in much cooler air on the 12th. High temperatures struggled into the 70s under cloudy skies and surface high pressure. A pleasantly cool night followed on the 13th with calm winds and lows in the 40s and 50s. The state began a slow warm up the next couple of days. Strong southerly winds in lieu of an approaching cold front pumped moisture up from the Gulf of Mexico which kept low temperatures in the 60s and 70s, while highs once again soared into the 90s. The winds at times gusted to over 40 mph in western Oklahoma, and over 30 mph in the remainder of the state.
September 17-18: Storms fired along a cold front moving through the state early on the 17th and spread southeastward. Oklahoma City broke its record for rainfall on the 17th, and Apache had over four inches. Three-inch amounts were recorded in southwestern and northeastern locations. High temperatures that day occurred soon after midnight, and remained in the 60s and 70s for the remainder of the day. Skies cleared from west to east on the 18th. Temperatures rebounded into the 70s and 80s later that day.
September 19-20: The 19th began clear and crisp with lows in the 40s and 50s. A beautiful afternoon followed under surface high pressure. High temperatures rose into the 70s and low 80s. Winds kicked up from the south later that night which allowed low temperatures to remain in the upper 50s and low 60s. Clouds increased due to an approaching upper-level storm, which also kicked up winds from the south at over 40 mph. Temperatures rose into the 80s.
September 2006 Statewide StatisticsTemperature
Average Depart. Rank (1892-2006)
Month (Sep) 69.4ºF -3.0ºF 10th Coolest
Year-to-Date(Jan-Sep)
65.9ºF 2.9ºF 2nd Warmest
Precipitation
Total Depart. Rank (1892-2006)
Month (Sep) 2.29 in. -1.52 in. 39th Driest
Year-to-Date(Jan-Sep)
19.99 in. -8.48 in. 11th Driest
Depart. = Departure from 30-year normal
September 21-23: The strong upper-level storm continued its march towards the state on the 18th. Non-thunderstorm related winds with gusts to over 60 mph struck in the west, and strong to severe thunderstorms fired later that day in the east. Two tornadoes touched down in Pushmataha County, but caused only minor damage. Both twisters were rated F0 in intensity. More severe storms ignited on the 22nd and 23rd in eastern Oklahoma, touched off by a slow-moving frontal system. Reports of severe winds and large hail were common with the storms. Throughout this three-day period, the southeastern one-third of the state reported a good general rainfall of 1-3 inches.
September 24-30: The 24th turned out clear and cool following the cold front’s passage. Lows dropped to the 40s and 50s, and rebounded into the low- to mid-70s, which marked the coolest high temperatures across the state since May. The low temperatures the following morning dropped into the 30s and low 40s statewide, marking it as the coolest morning since May as well. A slow warm up after that, the high temperatures crept into the 80s and then 90s by month’s end. Plenty of sunshine and light winds greeted Oklahoma on the 30th.

Copyright © 2006 Board of Regents of the University of Oklahoma. Oklahoma Monthly Climate Summary|�
September 2006 Severe Weather
Significant Tornadoes (F2 or greater)No significant tornadoes reported in the state.
Hail (2 inches in diameter or greater)No significant hail reported in the state.
FloodingNo flooding events reported in state.
Wind Gusts (70 mph or greater)Speed (m.p.h.) Location County Day
73 Webbers Falls Muskogee 23
Record Event Report
Description Day Location Record Previous Record Year
Daily Maximum Rainfall 17 Oklahoma City 2.49 inches 1.42 inches 1936

Copyright © 2006 Board of Regents of the University of Oklahoma. Oklahoma Monthly Climate Summary|�
September 2006 Observed Precipitation
September 2006 Departure from Normal Precipitation

Copyright © 2006 Board of Regents of the University of Oklahoma. Oklahoma Monthly Climate Summary|�
September 2006 Percent of Normal Precipitation
September 2006 Average Soil Moisture at 2�cm

Copyright © 2006 Board of Regents of the University of Oklahoma. Oklahoma Monthly Climate Summary|6
September 2006 Average Temperature
September 2006 Departure from Normal Temperature
Copyright © 2006 Board of Regents of the University of Oklahoma. Oklahoma Monthly Climate Summary|7
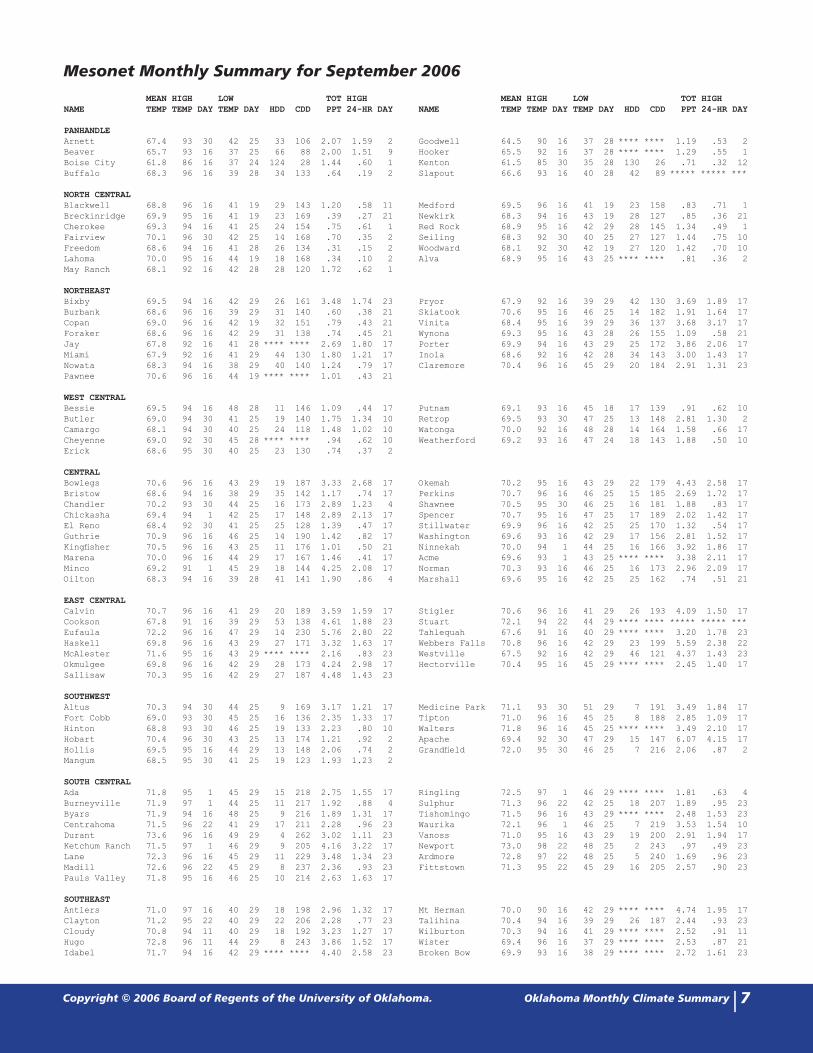
Mesonet Monthly Summary for September 2006 MEAN HIGH LOW TOT HIGH MEAN HIGH LOW TOT HIGHNAME TEMP TEMP DAY TEMP DAY HDD CDD PPT 24-HR DAY NAME TEMP TEMP DAY TEMP DAY HDD CDD PPT 24-HR DAY
PANHANDLE Arnett 67.4 93 30 42 25 33 106 2.07 1.59 2 Goodwell 64.5 90 16 37 28 **** **** 1.19 .53 2Beaver 65.7 93 16 37 25 66 88 2.00 1.51 9 Hooker 65.5 92 16 37 28 **** **** 1.29 .55 1Boise City 61.8 86 16 37 24 124 28 1.44 .60 1 Kenton 61.5 85 30 35 28 130 26 .71 .32 12Buffalo 68.3 96 16 39 28 34 133 .64 .19 2 Slapout 66.6 93 16 40 28 42 89 ***** ***** ***
NORTH CENTRAL Blackwell 68.8 96 16 41 19 29 143 1.20 .58 11 Medford 69.5 96 16 41 19 23 158 .83 .71 1Breckinridge 69.9 95 16 41 19 23 169 .39 .27 21 Newkirk 68.3 94 16 43 19 28 127 .85 .36 21Cherokee 69.3 94 16 41 25 24 154 .75 .61 1 Red Rock 68.9 95 16 42 29 28 145 1.34 .49 1Fairview 70.1 96 30 42 25 14 168 .70 .35 2 Seiling 68.3 92 30 40 25 27 127 1.44 .75 10Freedom 68.6 94 16 41 28 26 134 .31 .15 2 Woodward 68.1 92 30 42 19 27 120 1.42 .70 10Lahoma 70.0 95 16 44 19 18 168 .34 .10 2 Alva 68.9 95 16 43 25 **** **** .81 .36 2May Ranch 68.1 92 16 42 28 28 120 1.72 .62 1
NORTHEAST Bixby 69.5 94 16 42 29 26 161 3.48 1.74 23 Pryor 67.9 92 16 39 29 42 130 3.69 1.89 17Burbank 68.6 96 16 39 29 31 140 .60 .38 21 Skiatook 70.6 95 16 46 25 14 182 1.91 1.64 17Copan 69.0 96 16 42 19 32 151 .79 .43 21 Vinita 68.4 95 16 39 29 36 137 3.68 3.17 17Foraker 68.6 96 16 42 29 31 138 .74 .45 21 Wynona 69.3 95 16 43 28 26 155 1.09 .58 21Jay 67.8 92 16 41 28 **** **** 2.69 1.80 17 Porter 69.9 94 16 43 29 25 172 3.86 2.06 17Miami 67.9 92 16 41 29 44 130 1.80 1.21 17 Inola 68.6 92 16 42 28 34 143 3.00 1.43 17Nowata 68.3 94 16 38 29 40 140 1.24 .79 17 Claremore 70.4 96 16 45 29 20 184 2.91 1.31 23Pawnee 70.6 96 16 44 19 **** **** 1.01 .43 21
WEST CENTRAL Bessie 69.5 94 16 48 28 11 146 1.09 .44 17 Putnam 69.1 93 16 45 18 17 139 .91 .62 10Butler 69.0 94 30 41 25 19 140 1.75 1.34 10 Retrop 69.5 93 30 47 25 13 148 2.81 1.30 2Camargo 68.1 94 30 40 25 24 118 1.48 1.02 10 Watonga 70.0 92 16 48 28 14 164 1.58 .66 17Cheyenne 69.0 92 30 45 28 **** **** .94 .62 10 Weatherford 69.2 93 16 47 24 18 143 1.88 .50 10Erick 68.6 95 30 40 25 23 130 .74 .37 2
CENTRAL Bowlegs 70.6 96 16 43 29 19 187 3.33 2.68 17 Okemah 70.2 95 16 43 29 22 179 4.43 2.58 17Bristow 68.6 94 16 38 29 35 142 1.17 .74 17 Perkins 70.7 96 16 46 25 15 185 2.69 1.72 17Chandler 70.2 93 30 44 25 16 173 2.89 1.23 4 Shawnee 70.5 95 30 46 25 16 181 1.88 .83 17Chickasha 69.4 94 1 42 25 17 148 2.89 2.13 17 Spencer 70.7 95 16 47 25 17 189 2.02 1.42 17El Reno 68.4 92 30 41 25 25 128 1.39 .47 17 Stillwater 69.9 96 16 42 25 25 170 1.32 .54 17Guthrie 70.9 96 16 46 25 14 190 1.42 .82 17 Washington 69.6 93 16 42 29 17 156 2.81 1.52 17Kingfisher 70.5 96 16 43 25 11 176 1.01 .50 21 Ninnekah 70.0 94 1 44 25 16 166 3.92 1.86 17Marena 70.0 96 16 44 29 17 167 1.46 .41 17 Acme 69.6 93 1 43 25 **** **** 3.38 2.11 17Minco 69.2 91 1 45 29 18 144 4.25 2.08 17 Norman 70.3 93 16 46 25 16 173 2.96 2.09 17Oilton 68.3 94 16 39 28 41 141 1.90 .86 4 Marshall 69.6 95 16 42 25 25 162 .74 .51 21
EAST CENTRAL Calvin 70.7 96 16 41 29 20 189 3.59 1.59 17 Stigler 70.6 96 16 41 29 26 193 4.09 1.50 17Cookson 67.8 91 16 39 29 53 138 4.61 1.88 23 Stuart 72.1 94 22 44 29 **** **** ***** ***** ***Eufaula 72.2 96 16 47 29 14 230 5.76 2.80 22 Tahlequah 67.6 91 16 40 29 **** **** 3.20 1.78 23Haskell 69.8 96 16 43 29 27 171 3.32 1.63 17 Webbers Falls 70.8 96 16 42 29 23 199 5.59 2.38 22McAlester 71.6 95 16 43 29 **** **** 2.16 .83 23 Westville 67.5 92 16 42 29 46 121 4.37 1.43 23Okmulgee 69.8 96 16 42 29 28 173 4.24 2.98 17 Hectorville 70.4 95 16 45 29 **** **** 2.45 1.40 17Sallisaw 70.3 95 16 42 29 27 187 4.48 1.43 23
SOUTHWEST Altus 70.3 94 30 44 25 9 169 3.17 1.21 17 Medicine Park 71.1 93 30 51 29 7 191 3.49 1.84 17Fort Cobb 69.0 93 30 45 25 16 136 2.35 1.33 17 Tipton 71.0 96 16 45 25 8 188 2.85 1.09 17Hinton 68.8 93 30 46 25 19 133 2.23 .80 10 Walters 71.8 96 16 45 25 **** **** 3.49 2.10 17Hobart 70.4 96 30 43 25 13 174 1.21 .92 2 Apache 69.4 92 30 47 29 15 147 6.07 4.15 17Hollis 69.5 95 16 44 29 13 148 2.06 .74 2 Grandfield 72.0 95 30 46 25 7 216 2.06 .87 2Mangum 68.5 95 30 41 25 19 123 1.93 1.23 2
SOUTH CENTRAL Ada 71.8 95 1 45 29 15 218 2.75 1.55 17 Ringling 72.5 97 1 46 29 **** **** 1.81 .63 4Burneyville 71.9 97 1 44 25 11 217 1.92 .88 4 Sulphur 71.3 96 22 42 25 18 207 1.89 .95 23Byars 71.9 94 16 48 25 9 216 1.89 1.31 17 Tishomingo 71.5 96 16 43 29 **** **** 2.48 1.53 23Centrahoma 71.5 96 22 41 29 17 211 2.28 .96 23 Waurika 72.1 96 1 46 25 7 219 3.53 1.54 10Durant 73.6 96 16 49 29 4 262 3.02 1.11 23 Vanoss 71.0 95 16 43 29 19 200 2.91 1.94 17Ketchum Ranch 71.5 97 1 46 29 9 205 4.16 3.22 17 Newport 73.0 98 22 48 25 2 243 .97 .49 23Lane 72.3 96 16 45 29 11 229 3.48 1.34 23 Ardmore 72.8 97 22 48 25 5 240 1.69 .96 23Madill 72.6 96 22 45 29 8 237 2.36 .93 23 Fittstown 71.3 95 22 45 29 16 205 2.57 .90 23Pauls Valley 71.8 95 16 46 25 10 214 2.63 1.63 17
SOUTHEAST Antlers 71.0 97 16 40 29 18 198 2.96 1.32 17 Mt Herman 70.0 90 16 42 29 **** **** 4.74 1.95 17Clayton 71.2 95 22 40 29 22 206 2.28 .77 23 Talihina 70.4 94 16 39 29 26 187 2.44 .93 23Cloudy 70.8 94 11 40 29 18 192 3.23 1.27 17 Wilburton 70.3 94 16 41 29 **** **** 2.52 .91 11Hugo 72.8 96 11 44 29 8 243 3.86 1.52 17 Wister 69.4 96 16 37 29 **** **** 2.53 .87 21Idabel 71.7 94 16 42 29 **** **** 4.40 2.58 23 Broken Bow 69.9 93 16 38 29 **** **** 2.72 1.61 23

Copyright © 2006 Board of Regents of the University of Oklahoma. Oklahoma Monthly Climate Summary|�
200� and 2006 Statewide Precipitation Monthly Totals vs. Normal
September 2006 Mesonet Precipitation Comparison
0.00
1.00
2.00
3.00
4.00
5.00
6.00
7.00
8.00
JAN FEB MAR APR MAY JUN JUL AUG SEP OCT NOV DEC
Mo
nth
ly P
recip
ita
tio
n (
inch
es)
2006 Precipitation
2005 Precipitation
1971-2000 Normal
Climate DivisionPrecipitation
(inches)Departure from Normal (inches) Rank since 1895
Wettest on Record (Year)
Driest on Record (Year) Sep-05
Panhandle 1.33 -0.55 43rd Driest 4.57 (1985) 0.05 (1956) 0.68
North Central 0.93 -2.20 12th Driest 7.08 (1945) 0.04 (2000) 1.06
Northeast 2.17 -2.61 26th Driest 12.42 (1986) 0.13 (1948) 2.41
West Central 1.46 -1.57 27th Driest 8.64 (1986) 0.02 (2000) 1.44
Central 2.39 -1.72 42nd Driest 10.68 (1945) 0.19 (1956) 2.16
East Central 3.99 -0.97 54th Wettest 10.40 (1970) 0.23 (1948) 1.92
Southwest 2.81 -0.58 48th Wettest 8.68 (1936) 0.00 (1898) 2.75
South Central 2.49 -1.85 47th Driest 9.98 (1936) 0.00 (1909) 2.45
Southeast 3.24 -1.33 54th Driest 11.75 (1974) 0.29 (1948) 3.17
Statewide 2.29 -1.52 39th Driest 7.86 (1945) 0.27 (1956) 1.99

Copyright © 2006 Board of Regents of the University of Oklahoma. Oklahoma Monthly Climate Summary|�
200� and 2006 Statewide Temperature Monthly Averages vs. Normal
September 2006 Mesonet Temperature Comparison
25
30
35
40
45
50
55
60
65
70
75
80
85
90
JAN FEB MAR APR MAY JUN JUL AUG SEP OCT NOV DEC
Me
an
Te
mp
era
ture
(d
eg
ree
s F
)
2006 Temperature
2005 Temperature
1971-2000 Normal
.
Climate DivisionAverage Temp
(F)Departure from
Normal (F) Rank since 1895Hottest on
Record (Year)Coldest on
Record (Year) Sep-05 (F)
Panhandle 65.2 -4.2 3rd Coolest 76.2 (1931) 62.4 (1974) 74.4
North Central 69.0 -3.1 12th Coolest 80.8 (1931) 64.0 (1974) 76.3
Northeast 69.0 -2.7 15th Coolest 79.1 (1931) 63.4 (1974) 76.2
West Central 69.2 -2.7 15th Coolest 80.4 (1931) 64.4 (1974) 76.6
Central 69.9 -2.9 13th Coolest 81.3 (1931) 65.0 (1974) 77.2
East Central 70.0 -2.7 10th Coolest 80.5 (1939) 65.1 (1974) 78.3
Southwest 70.0 -3.7 7th Coolest 81.2 (1931) 66.4 (1974) 78.3
South Central 72.0 -2.1 21st Coolest 81.3 (1998) 66.3 (1974) 80.5
Southeast 70.8 -2.3 17th Coolest 81.2 (1939) 65.9 (1974) 78.8
Statewide 69.4 -3.0 10th Coolest 79.8 (1931) 64.7 (1974) 77.4

Copyright © 2006 Board of Regents of the University of Oklahoma. Oklahoma Monthly Climate Summary|�0
Mesonet Extremes for September 2006
Climate Division
High Temp
(F) Day Station
Low Temp
(F) Day Station
High Monthly Rainfall (inches) Station
High Daily
Rainfall (inches) Day Station
Panhandle 96 16th Buffalo 35 28th Kenton 2.07 Arnett 1.59 2nd Arnett
North Central 96 30th Fairview 40 25th Seiling 1.72 May Ranch 0.75 10th Seiling
Northeast 96 16th Burbank 38 29th Nowata 3.86 Porter 3.17 17th Vinita
West Central 95 30th Erick 40 25th Camargo 2.81 Retrop 1.34 10th Butler
Central 96 16th Perkins 38 29th Bristow 4.43 Okemah 2.68 17th Bowlegs
East Central 96 16th Webbers Falls 39 29th Cookson 5.76 Eufaula 2.98 17th Okmulgee
Southwest 96 16th Tipton 41 25th Mangum 6.07 Apache 4.15 17th Apache
South Central 98 22nd Newport 41 29th Centrahoma 4.16 Ketchum Ranch 3.22 17th Ketchum Ranch
Southeast 97 16th Antlers 37 29th Wister 4.74 Mt Herman 2.58 23rd Idabel
Statewide 98 22nd Newport 35 28th Kenton 6.07 Apache 4.15 17th Apache

Copyright © 2006 Board of Regents of the University of Oklahoma. Oklahoma Monthly Climate Summary|��
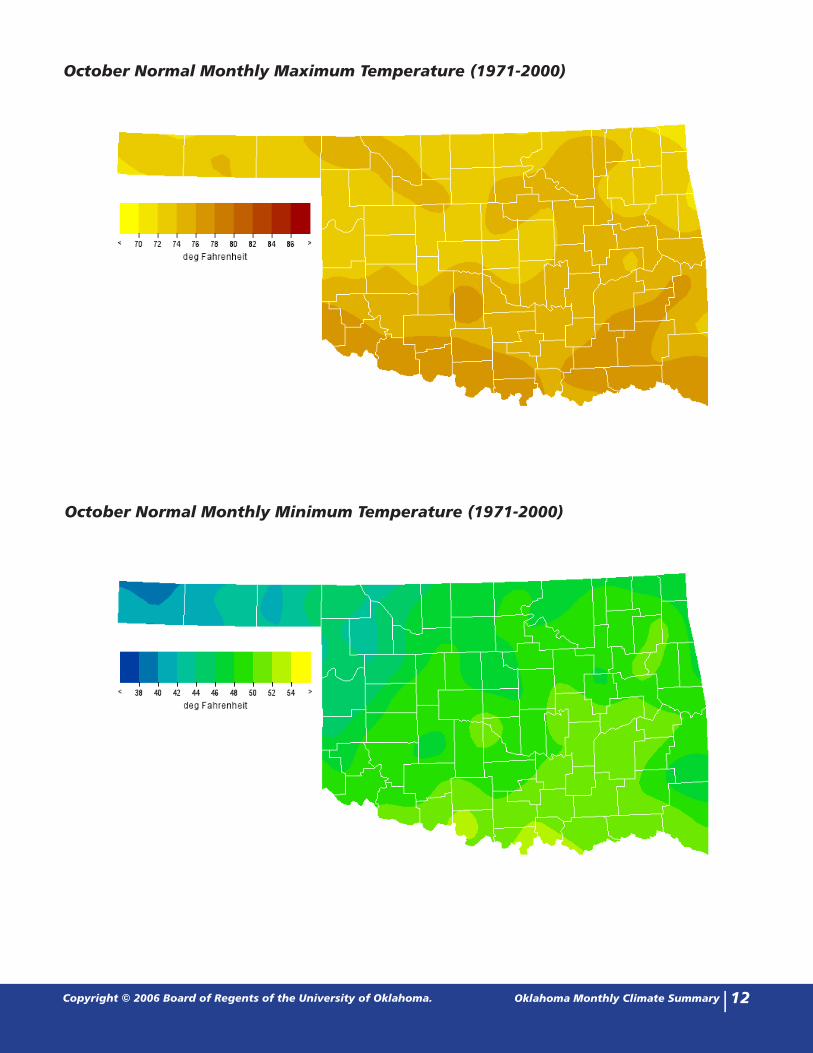
October typically brings Oklahoma some of its most pleasant weather. Days are usually pleasantly warm and nights typically are refreshingly cool. On the occasions that the weather does turn nasty, however, the result too often is flood, as October seems to be a favored time for extreme precipitation events. The year’s tenth month is Oklahoma’s 6th warmest and 4th wettest, according to the most recently compiled statewide normals. From 1971 through 2000, the period from which current normals of temperature and precipitation were calculated, Oklahoma’s October average temperature was 62.0 degrees Fahrenheit and the average reporting station received a monthly precipitation of 3.38 inches.
TemperatureMean: 62.0 degreesWarmest October: 1963, 70.7 degreesCoolest October: 1974, 65.4 degreesWarmest location: Waurika, 66.3 degreesCoolest Location: Turpin, 56.6 degreesHottest recorded: 110 degrees, Waukomis, October 2, 1898Coldest recorded: 6 degrees, Kenton, October 30, 1993
October is given to wide extremes of precipitation. The larger monthly figures are usually impacted by one or two very large events. Remnants of tropical storms or hurricanes, usually from the Gulf of Mexico, but occasionally originating in the Pacific Ocean, occasionally bring widespread heavy rains to the state during October. At other times, mid-latitude storm systems have stalled over the state and, taking advantage of moisture borne from the Gulf by the prevailing southerly winds, produced prodigious amounts of rain. In many other years, October is virtually without rain. Monthly precipitation totals include a statewide-averaged high of 11.32 inches in 1941, the largest total ever recorded for Oklahoma (any month), and a low of 0.14 inch, attained in 1952. The remnants of Hurricane Norma provided enough rain over a three-day period in October 1981 to give Madill the greatest monthly precipitation total (25.80 inches) ever recorded at a recognized reporting station in Oklahoma (all months). A thoroughly extra-tropical thunderstorm system inundated Enid with 15.68 inches of rain in about 12 hours (12 inches in just 3 hours) on October 11, 1973. That total, reported the following morning, is the state’s greatest 24-hour precipitation in any month, as measured at an official reporting station.
PrecipitationMean: 3.38 inchesWettest Year: 1941, 11.32 inchesDriest Year: 1917 and 1952, 0.14 inchesWettest location: Smithville, 6.22 inchesDriest location: Kenton, 0.99 inchesMost recorded: 25.80 inches, Madill, 1981
The normal precipitation pattern across Oklahoma in October returns to its familiar configuration with eastern stations receiving substantially more rainfall than those in the west. Normal monthly precipitation across the state during October ranges from 6.22 inches at Smithville to 0.99 inches at Kenton. Snowfall is not common during October, but Regnier, Kenton, and Boise City each average receiving about one inch of snow during the month. Those averages were inflated by a freak snowstorm on October 25 and 26, 1997 that dropped 15 inches of snow on Kenton. As many as 15,000 head of cattle across the panhandle died during that snowstorm.
TornadoesAverage October Tornadoes: 2Most: 27 (1998)
Severe thunderstorms, apart from the floods, historically have been little more than footnotes in October for most of the state’s history. However, recent occurrences have altered that notion somewhat. Reasonably comprehensive and well-documented tornado records in the state date from 1950. During those 54 years, 123 October tornadoes have been identified in Oklahoma, an average of 2.3 per year. There were no October tornadoes reported during 23 of those years. However, 25 tornadoes were reported in the state on October 4, 1998 and 19 more were reported on October 9, 2001. Those two days account for over one-third of the tornadoes reported (and confirmed) within the state in October during that 54-year period. The state’s monthly total of 27 tornadoes during October 1998 represents the most tornadoes ever reported within any state during an October.
October Climatological Outlook
Copyright © 2006 Board of Regents of the University of Oklahoma. Oklahoma Monthly Climate Summary|�2
October Normal Monthly Maximum Temperature (��7�-2000)
October Normal Monthly Minimum Temperature (��7�-2000)

Copyright © 2006 Board of Regents of the University of Oklahoma. Oklahoma Monthly Climate Summary|��
October Normal Precipitation (��7�-2000)
October �, 2006 Soil Moisture Conditions at 2�cm

Copyright © 2006 Board of Regents of the University of Oklahoma. Oklahoma Monthly Climate Summary|��
October 2006 Drought Indices

Copyright © 2006 Board of Regents of the University of Oklahoma. Oklahoma Monthly Climate Summary|��
October 2006 U.S. Precipitation Forecast
October 2006 U.S. Temperature Forecast

Copyright © 2006 Board of Regents of the University of Oklahoma. Oklahoma Monthly Climate Summary|�6
Oklahoma Climate Divisions
October Climate Normals
Climate Division Max. Temperature (∞F) Min. Temperature (∞F) Avg. Temperature (∞F) Precipitation (inches)
1 73.70 42.90 58.30 1.49
2 73.50 46.50 60.00 2.66
3 73.80 48.70 61.30 3.62
4 73.70 47.20 60.50 2.47
5 74.40 49.30 61.80 3.64
6 74.50 50.00 62.30 4.19
7 75.80 48.90 62.30 2.99
8 76.10 50.80 63.50 4.17
9 76.10 49.50 62.80 4.98
Statewide 74.60 48.30 61.50 3.48

Copyright © 2006 Board of Regents of the University of Oklahoma. Oklahoma Monthly Climate Summary|�7
Interpretation Information
Mean Daily Temperature: Calculated from an average of the daily maximum and minimum temperatures. Daily averages are summed for each day, and then divided by the number of valid data points – typically the number of days in the month. Although this may differ from the “true” daily average, it is consistent with historical methods of observation and comparable to the normals and extremes for stations and regions of the state.
Degree Days: Degree Days are calculated each day of the month for which there is a temperature report and the mean temperature for the day is less than (Heating Degree Days) or greater than (Cooling Degree Days) 65 degrees. Daily values are summed to arrive at a monthly total. HDD/CDD are qualitative measures of how much heating/cooling was required to maintain a comfortable indoor temperature. Missing observations may result in an artificially high or low value.
Severe Weather Reports: Only the most significant events are listed. Tornadoes of F2 or greater strength (on the 0-5 Fujita scale), hail of two inches diameter or greater, and wind speeds of 70 miles per hour or above are listed. National Weather Service defines storms as severe when they produce a tornado, hail of three-quarters inch or greater, or wind speeds above 57 miles per hour (50 knots). For additional reports, contact the Oklahoma Climatological Survey, Storm Prediction Center, or your local National Weather Service forecast office.
Soil Moisture: The soil moisture variable displayed is the Fractional Water Index (FWI), measured at a depth of 25 cm. This unitless value ranges from very dry soil having a value of 0, to saturated soils having a value of 1.
Additional Resources
Sunrise / Sunset tablesU.S. Naval Observatory: http://aa.usno.navy.mil/data
Severe Storm ReportsStorm Prediction Center: http://spc.noaa.gov/climo/
National Climatic Data Center (more than about 4-5 months old):http://www4.ncdc.noaa.gov/cgi-win/wwcgi.dll?wwEvent~Storms
Seasonal OutlooksClimate Prediction Center: http://www.cpc.ncep.noaa.gov/products/OUTLOOKS_index.html
Climate Calendars and other local weather and climate informationOklahoma Climatological Survey: http://climate.ocs.ou.edu or http://www.ocs.ou.edu/E-mail ([email protected]) or telephone (405/325-2541)
Oklahoma Climatological Survey is the State Climate Office for Oklahoma
Dr. Ken C. Crawford, Director and State Climatologist
Editor
Gary D. McManus, Climatologist
Contributors
Gary D. McManusMark A. Shafer, Director of Climate
InformationDerek S. Arndt, Assistant State Climatologist
Howard Johnson, Associate State Climatologist (Ret.)
Design
Stdrovia Blackburn, Graphic Design ManagerKelly Stokes, Administration/Graphics
For more information, contact:
Oklahoma Climatological SurveyThe University of Oklahoma
120 David L. Boren Blvd., Suite 2900Norman, OK 73072-7305
tel: 405-325-2541fax: 405-325-2550
e-mail: [email protected]://www.ocs.ou.edu