oklahoma oil and gas production: its components and … · oklahoma geology notes • v. 65, no. 1...
TRANSCRIPT

4 Oklahoma Geology Notes • v. 65, no. 1 • Spring 2005
INTRODUCTION
The outlook for Oklahoma’s oil and gas industry has neverbeen brighter. Rising global demand for oil, especially in de-veloping countries, is reducing the world’s spare productioncapacity and driving prices upward; for 5 years the averageState price has been $30 per barrel, and recently much higher.Increasing demand for natural gas, combined with a flat pro-duction curve in the U.S., has kept the average price in Okla-homa above $4.00 per thousand cubic feet for the sameperiod (Claxton, 2004). Volatility will persist and short-livedprice slumps remain possible, but average prices for both oiland gas should remain high in the long term.
With higher prices come opportunities, and now theOklahoma oil and gas industry must identify the opportuni-ties. For oil, new discoveries with potential for a Statewideimpact are unlikely, making the most promising course in-creased recovery in existing fields. For natural gas—now theState’s largest energy resource—several options are open.Important discoveries are still being made, with the additionof new reservoirs in existing fields and infill drilling in low-permeability reservoirs being major components of newproduction. Of critical importance is continued develop-ment of myriad unconventional reservoirs, including deepand tight gas sands and shales, as well as the most active playin the State: coalbed methane.
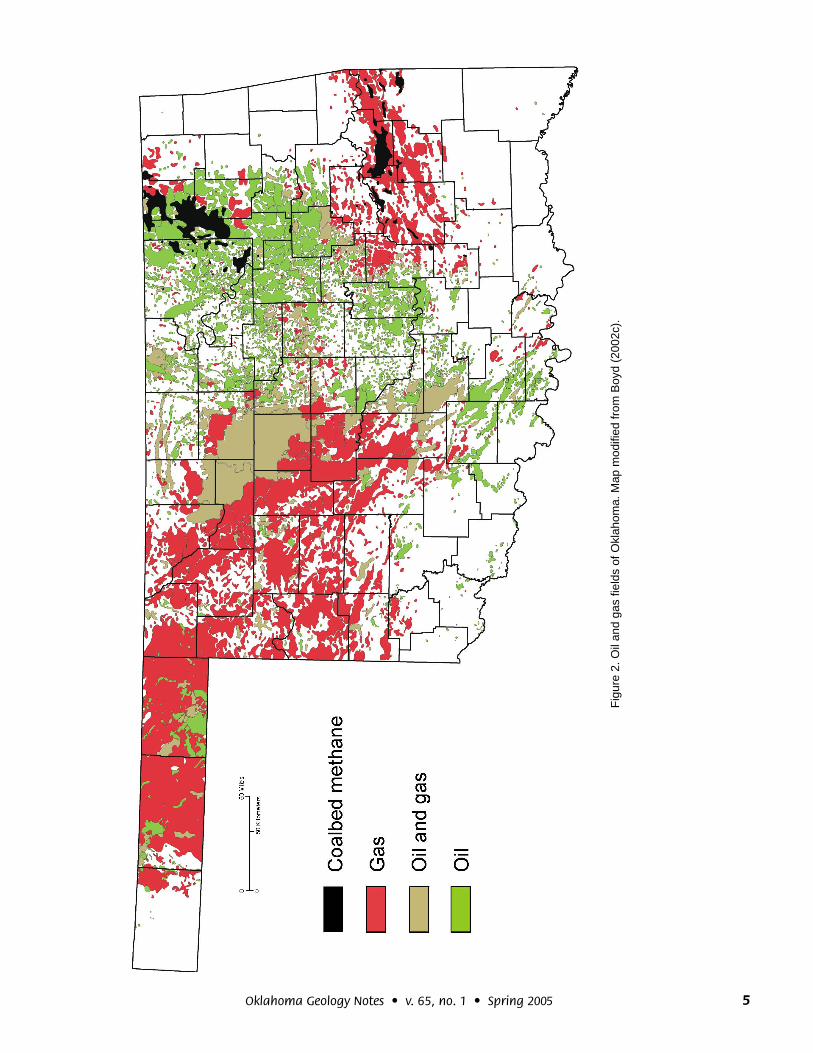
For more than a century, Oklahoma has produced oil andnatural gas as a fortuitous result of encompassing most ofthe Anadarko, Arkoma, and Ardmore-Marietta geologic ba-sins and associated shelves (Fig. 1). Oil and gas are producedthroughout most of the State, with the only large unproduc-tive areas at the geographic corners: the tip of the Panhan-dle, the Ozark Uplift, the Ouachita Uplift, and the WichitaUplift (Fig. 2).
In common practice, production is assigned to a majorgeologic province, based on the volumes reported by county.Although county lines seldom follow geologic boundaries,
Oklahoma Oil and Gas Production:Its Components and Long-Term Outlook
Dan T. BoydOklahoma Geological Survey
NOTE: Most data cited in this paper are from the IHS Energy Group, currentthrough October 2004 (see IHS Energy, 2004). Total production reported forOklahoma in the IHS database—including about 3 billion barrels of oil from “un-known” reservoirs—is 12.7 billion barrels; total gas production—including about2 trillion cubic feet from “unknown” reservoirs—is 77 trillion cubic feet. Unfortu-nately, all databases have been affected by poor State records, especially forthe industry’s early years, and the totals above are roughly 2 billion barrels and17 trillion cubic feet less than State tax records indicate as actual cumulativeproduction (see Claxton, 2004). (All volumes combine condensate with oil andassociated with non-associated gas.)
Figure 1. Major geologic provinces of Oklahoma.Modified from Northcutt and Campbell (1995).
5Oklahoma Geology Notes • v. 65, no. 1 • Spring 2005
Fig
ure
2. O
il an
d ga
s fie
lds
of O
klah
oma.
Map
mod
ified
from
Boy
d (2
002c
).
6 Oklahoma Geology Notes • v. 65, no. 1 • Spring 2005
county reports do help track sources of Oklahoma’s oil andgas. (The Anadarko Basin and Shelf are combined, and theArdmore and Marietta Basins are merged with the WichitaUplift into the Southern Oklahoma Foldbelt.)
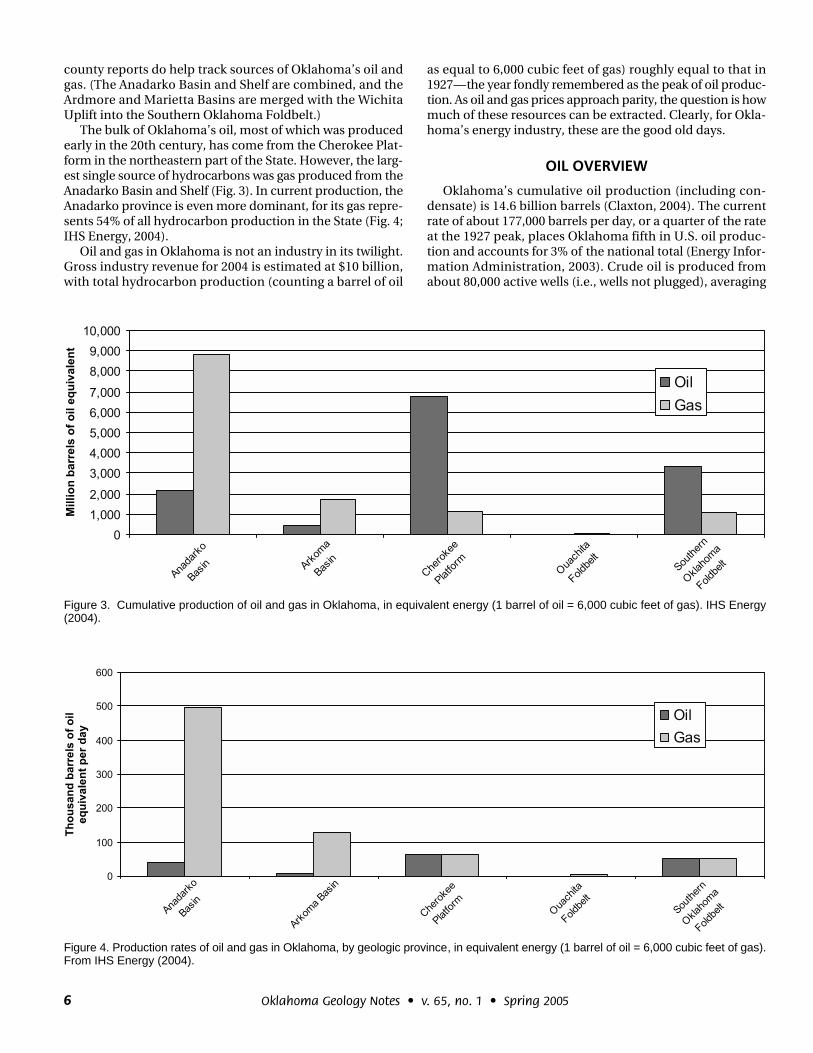
The bulk of Oklahoma’s oil, most of which was producedearly in the 20th century, has come from the Cherokee Plat-form in the northeastern part of the State. However, the larg-est single source of hydrocarbons was gas produced from theAnadarko Basin and Shelf (Fig. 3). In current production, theAnadarko province is even more dominant, for its gas repre-sents 54% of all hydrocarbon production in the State (Fig. 4;IHS Energy, 2004).
Oil and gas in Oklahoma is not an industry in its twilight.Gross industry revenue for 2004 is estimated at $10 billion,with total hydrocarbon production (counting a barrel of oil
as equal to 6,000 cubic feet of gas) roughly equal to that in1927—the year fondly remembered as the peak of oil produc-tion. As oil and gas prices approach parity, the question is howmuch of these resources can be extracted. Clearly, for Okla-homa’s energy industry, these are the good old days.
OIL OVERVIEW
Oklahoma’s cumulative oil production (including con-densate) is 14.6 billion barrels (Claxton, 2004). The currentrate of about 177,000 barrels per day, or a quarter of the rateat the 1927 peak, places Oklahoma fifth in U.S. oil produc-tion and accounts for 3% of the national total (Energy Infor-mation Administration, 2003). Crude oil is produced fromabout 80,000 active wells (i.e., wells not plugged), averaging
Figure 3. Cumulative production of oil and gas in Oklahoma, in equivalent energy (1 barrel of oil = 6,000 cubic feet of gas). IHS Energy(2004).
Figure 4. Production rates of oil and gas in Oklahoma, by geologic province, in equivalent energy (1 barrel of oil = 6,000 cubic feet of gas).From IHS Energy (2004).

7Oklahoma Geology Notes • v. 65, no. 1 • Spring 2005
2.2 barrels per day, in about 1,900 fields. Wells produce fromthousands of named reservoirs, but fewer than 300 have 10or more completed wells (Boyd, 2002a).
Over the last century Oklahoma’s oil production has hadmany ups and downs. The last major increase came duringthe boom years of the late 1970s and early 1980s. Unfortu-nately, few discoveries of that period were significant, andnone has recovered more than 15 million barrels (MMB).The bulk of the incremental oil produced during the boomwas accelerated production—oil that would have been pro-duced anyway (Boyd, 2002b). Since the last peak, in 1984,production has continuously declined. The decline was es-
pecially steep immediately after the boom, but over the last10 years the curve has flattened to about 3.1% per year, for anannual loss of about 5,000 barrels per day since 1994 (Fig. 5).
Much of Oklahoma’s oil has come from its 27 major oilfields, “major” defined here as having produced more than100 MMB (Fig. 6). The median discovery date for the majorsis 1923, with the latest (Postle) being found in 1958 (Interna-tional Oil Scouts Association, 2001). Although major fieldsrepresent only 1% of the total, they account for almost twothirds of cumulative production (Fig. 7).
Bartlesville-Dewey Field, the largest and oldest of the ma-jor fields (discovered in 1897), illustrates the maturity of
Figure 6. Petroleum provinces and major oil fields(recovery >100 million barrels). Modified from North-cutt and Campbell (1995) and Boyd (2002c).
Figure 5. History of oil production (including condensate) in Oklahoma. From Claxton (2004).

8 Oklahoma Geology Notes • v. 65, no. 1 • Spring 2005
Oklahoma’s oil production. The field covers parts of ninetownships and has produced 1.5 billion barrels of oil (BBO),but it is now producing only 700 barrels per day (Fig. 8; IHSEnergy, 2004). Major fields still account for 41% of Oklaho-ma’s daily oil production, but most now comes from numer-ous smaller accumulations scattered throughout the State(Fig. 2), and much of it through secondary-recovery projects(e.g., water-flooding).
The largest oil producer in the State is now Sho-Vel-TumField, making 14% of total production and more than fourtimes that of the second largest—the Golden Trend. One rea-
son for its rank is that in Oklahoma oil and gas fields are de-fined geographically. Sho-Vel-Tum is a consolidation of 42previously defined fields producing from a large structuralcomplex that has focused oil migration over a wide area.That helped form hundreds of structural-stratigraphic trapsthat are stacked in more than 60 named reservoirs at depthsfrom 400 ft to >10,000 ft (IHS Energy, 2004).
The complexity of Sho-Vel-Tum and its wide variety ofreservoirs and isolated traps has maintained development ata rate of more than 120 wells per year for the last 10 years.Also, numerous secondary-recovery projects have kept
Figure 7. Cumulative oil production in Oklahoma (fields with recovery >100 million barrels). IHS Energy (2004).
Figure 8. Daily oil production in Oklahoma fields with recovery >100 million barrels. From IHS Energy (2004).

9Oklahoma Geology Notes • v. 65, no. 1 • Spring 2005
many older wells active. Not coincidentally, Sho-Vel-Tum isboth the largest producing field and also has the most activewells. Correlation of active-well numbers with production(Figs. 8, 9), although good, is imperfect due to differences infield age and the initiation of secondary-recovery programs.
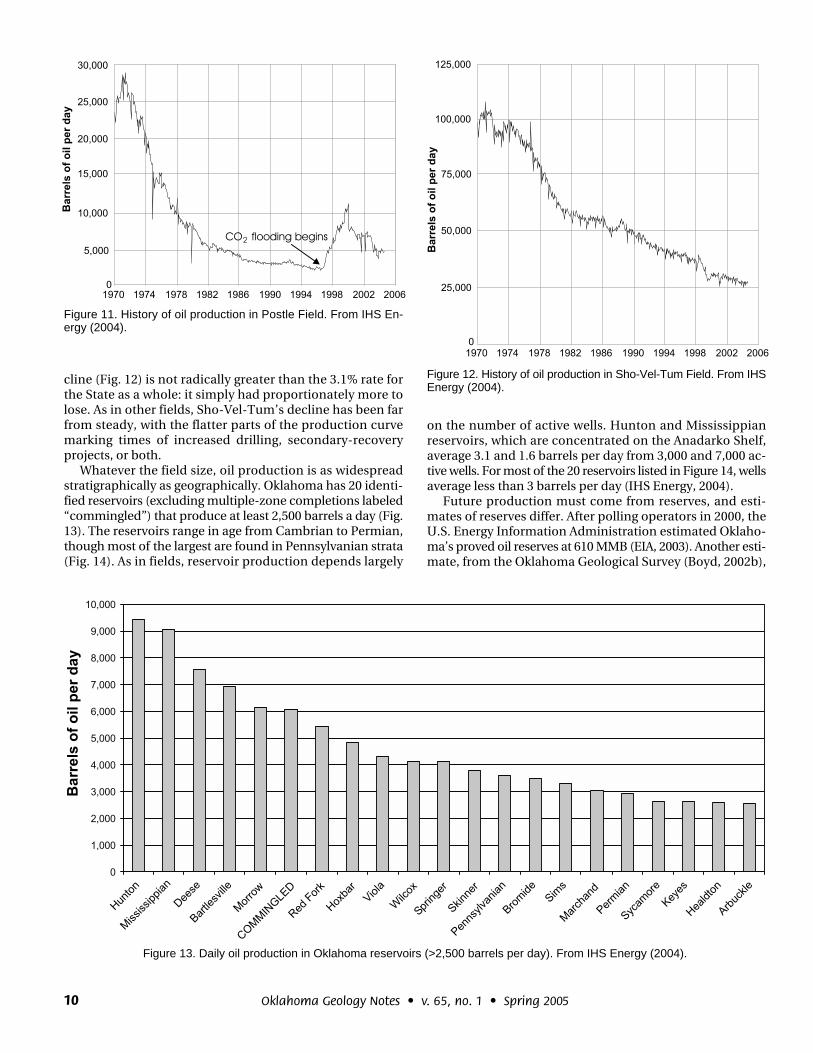
An example is Postle Field, one of the State’s smaller ma-jor fields, located in the Panhandle. It is the only major fieldthat has markedly increased production over the last 10years (Fig. 10). This is the result of an enhanced recoveryproject initiated by Mobil Oil involving the injection of car-
bon dioxide into Morrow-age reservoirs. The project beganin 1996, and by 1999 had boosted average well production to16 barrels a day (Southwell, 2004) and overall field produc-tion by 8,000 barrels per day (Fig. 11). In 2004 this madePostle the fifth largest oil-producing field in the State (IHSEnergy, 2004). Since 1999, production has declined sharply,but the field is still producing at roughly double its rate of 10years ago.
Of all the major fields, production from Sho-Vel-Tum hasfallen the most over the last 10 years, but its 4.5% rate of de-
Figure 9. Active wells in nine Oklahoma oil fields with recovery >500 million barrels, or >4,000 barrels per day. From IHS Energy (2004).Compare with Figure 10.
Figure 10. Changes in production rate in nine Oklahoma oil fields (recovery >500 million barrels, or >4,000 barrels per day) between 1994and 2003. From IHS Energy (2004). Compare with Figure 9.
10 Oklahoma Geology Notes • v. 65, no. 1 • Spring 2005
cline (Fig. 12) is not radically greater than the 3.1% rate forthe State as a whole: it simply had proportionately more tolose. As in other fields, Sho-Vel-Tum’s decline has been farfrom steady, with the flatter parts of the production curvemarking times of increased drilling, secondary-recoveryprojects, or both.
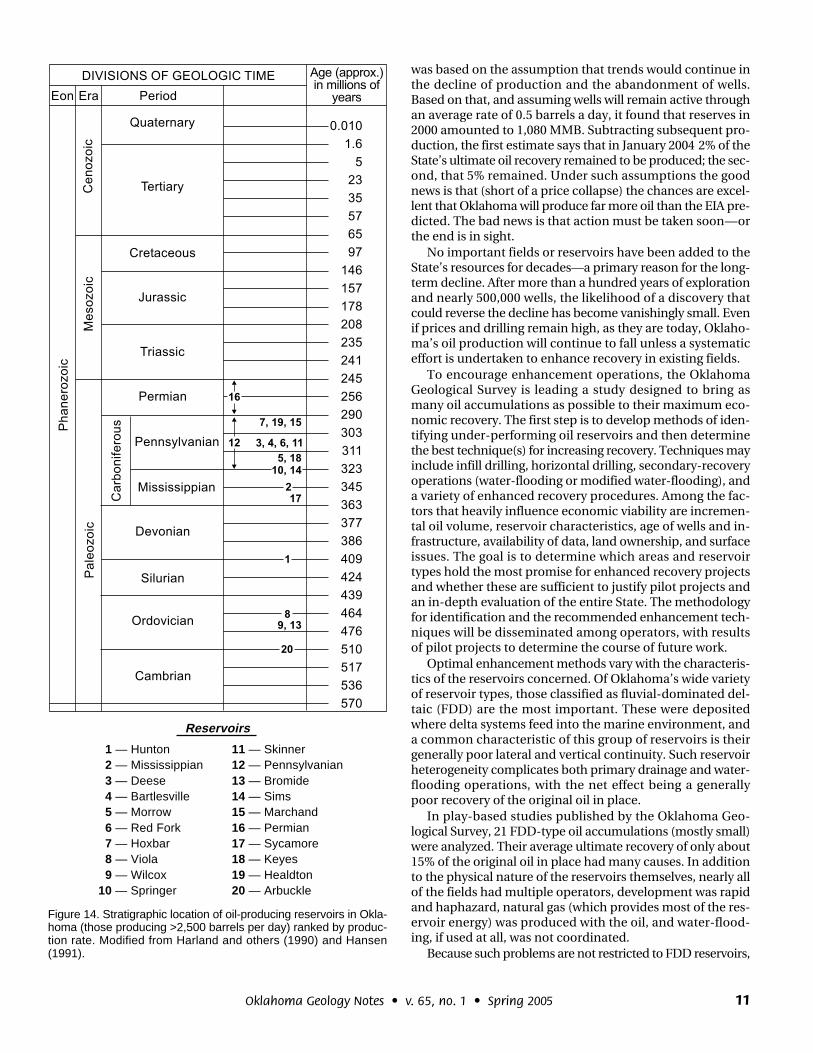
Whatever the field size, oil production is as widespreadstratigraphically as geographically. Oklahoma has 20 identi-fied reservoirs (excluding multiple-zone completions labeled“commingled”) that produce at least 2,500 barrels a day (Fig.13). The reservoirs range in age from Cambrian to Permian,though most of the largest are found in Pennsylvanian strata(Fig. 14). As in fields, reservoir production depends largely
on the number of active wells. Hunton and Mississippianreservoirs, which are concentrated on the Anadarko Shelf,average 3.1 and 1.6 barrels per day from 3,000 and 7,000 ac-tive wells. For most of the 20 reservoirs listed in Figure 14, wellsaverage less than 3 barrels per day (IHS Energy, 2004).
Future production must come from reserves, and esti-mates of reserves differ. After polling operators in 2000, theU.S. Energy Information Administration estimated Oklaho-ma’s proved oil reserves at 610 MMB (EIA, 2003). Another esti-mate, from the Oklahoma Geological Survey (Boyd, 2002b),
Figure 11. History of oil production in Postle Field. From IHS En-ergy (2004).
Figure 12. History of oil production in Sho-Vel-Tum Field. From IHSEnergy (2004).
Figure 13. Daily oil production in Oklahoma reservoirs (>2,500 barrels per day). From IHS Energy (2004).
11Oklahoma Geology Notes • v. 65, no. 1 • Spring 2005
was based on the assumption that trends would continue inthe decline of production and the abandonment of wells.Based on that, and assuming wells will remain active throughan average rate of 0.5 barrels a day, it found that reserves in2000 amounted to 1,080 MMB. Subtracting subsequent pro-duction, the first estimate says that in January 2004 2% of theState’s ultimate oil recovery remained to be produced; the sec-ond, that 5% remained. Under such assumptions the goodnews is that (short of a price collapse) the chances are excel-lent that Oklahoma will produce far more oil than the EIA pre-dicted. The bad news is that action must be taken soon—orthe end is in sight.
No important fields or reservoirs have been added to theState’s resources for decades—a primary reason for the long-term decline. After more than a hundred years of explorationand nearly 500,000 wells, the likelihood of a discovery thatcould reverse the decline has become vanishingly small. Evenif prices and drilling remain high, as they are today, Oklaho-ma’s oil production will continue to fall unless a systematiceffort is undertaken to enhance recovery in existing fields.
To encourage enhancement operations, the OklahomaGeological Survey is leading a study designed to bring asmany oil accumulations as possible to their maximum eco-nomic recovery. The first step is to develop methods of iden-tifying under-performing oil reservoirs and then determinethe best technique(s) for increasing recovery. Techniques mayinclude infill drilling, horizontal drilling, secondary-recoveryoperations (water-flooding or modified water-flooding), anda variety of enhanced recovery procedures. Among the fac-tors that heavily influence economic viability are incremen-tal oil volume, reservoir characteristics, age of wells and in-frastructure, availability of data, land ownership, and surfaceissues. The goal is to determine which areas and reservoirtypes hold the most promise for enhanced recovery projectsand whether these are sufficient to justify pilot projects andan in-depth evaluation of the entire State. The methodologyfor identification and the recommended enhancement tech-niques will be disseminated among operators, with resultsof pilot projects to determine the course of future work.
Optimal enhancement methods vary with the characteris-tics of the reservoirs concerned. Of Oklahoma’s wide varietyof reservoir types, those classified as fluvial-dominated del-taic (FDD) are the most important. These were depositedwhere delta systems feed into the marine environment, anda common characteristic of this group of reservoirs is theirgenerally poor lateral and vertical continuity. Such reservoirheterogeneity complicates both primary drainage and water-flooding operations, with the net effect being a generallypoor recovery of the original oil in place.
In play-based studies published by the Oklahoma Geo-logical Survey, 21 FDD-type oil accumulations (mostly small)were analyzed. Their average ultimate recovery of only about15% of the original oil in place had many causes. In additionto the physical nature of the reservoirs themselves, nearly allof the fields had multiple operators, development was rapidand haphazard, natural gas (which provides most of the res-ervoir energy) was produced with the oil, and water-flood-ing, if used at all, was not coordinated.
Because such problems are not restricted to FDD reservoirs,
Figure 14. Stratigraphic location of oil-producing reservoirs in Okla-homa (those producing >2,500 barrels per day) ranked by produc-tion rate. Modified from Harland and others (1990) and Hansen(1991).
Reservoirs
1 — Hunton 2 — Mississippian 3 — Deese 4 — Bartlesville 5 — Morrow 6 — Red Fork 7 — Hoxbar 8 — Viola 9 — Wilcox10 — Springer
11 — Skinner12 — Pennsylvanian13 — Bromide14 — Sims15 — Marchand16 — Permian17 — Sycamore18 — Keyes19 — Healdton20 — Arbuckle
12 Oklahoma Geology Notes • v. 65, no. 1 • Spring 2005
and because large fields are amalgamations of many smalleraccumulations, the same problems and the same low recov-ery are likely common. As cumulative recovery approaches15 billion barrels, using an optimistic average ultimate re-covery of 33%, the total oil volume still residing in Oklahomareservoirs is at least 30 billion barrels. Given that the recov-ery percentage in the fields studied was less than half this,the oil still in the ground is certainly very much more.
By any analysis the oil remaining in Oklahoma reservoirsis very large, and almost all of it has been mapped. The pro-portion that is theoretically recoverable will vary from fieldto field, but without doubt the total is in the billions of bar-rels. The only question is how much of this can be recoveredeconomically, and where.
GAS OVERVIEW
Oklahoma’s cumulative natural-gas production (includ-ing associated gas) at the end of 2004 was 93.8 trillion cubic ft(TCF). The current production rate, 4.3 billion cubic ft (BCF)per day, is 70% of the 1990 peak rate (Claxton, 2004). Thisplaces Oklahoma third (after Texas and Louisiana) in U.S.gas production, with an 8% share of the national total (En-ergy Information Administration, 2004). About 62,000 gaswells have been drilled in the State. Current productioncomes from 31,000 wells in about 1,400 fields and hundredsof named reservoirs (Boyd, 2002c; Claxton, 2004).
For lack of an early market, large-scale production of theState’s natural gas began much later than for oil. Large dis-coveries and high demand made oil the primary exploratoryobjective in the State, with most operators viewing gas as anuisance or a drilling hazard. Because oil almost always con-tains associated gas, in its earliest years the industry reliedon small accumulations associated with shallow oil fields onthe Cherokee Platform. Most of the largest gas fields werediscovered in the first half of the 20th century, but none were
close to a big city. As a result most of the fields were not fullydeveloped, nor their size appreciated, until much later whendemand grew and gas-targeted drilling increased.
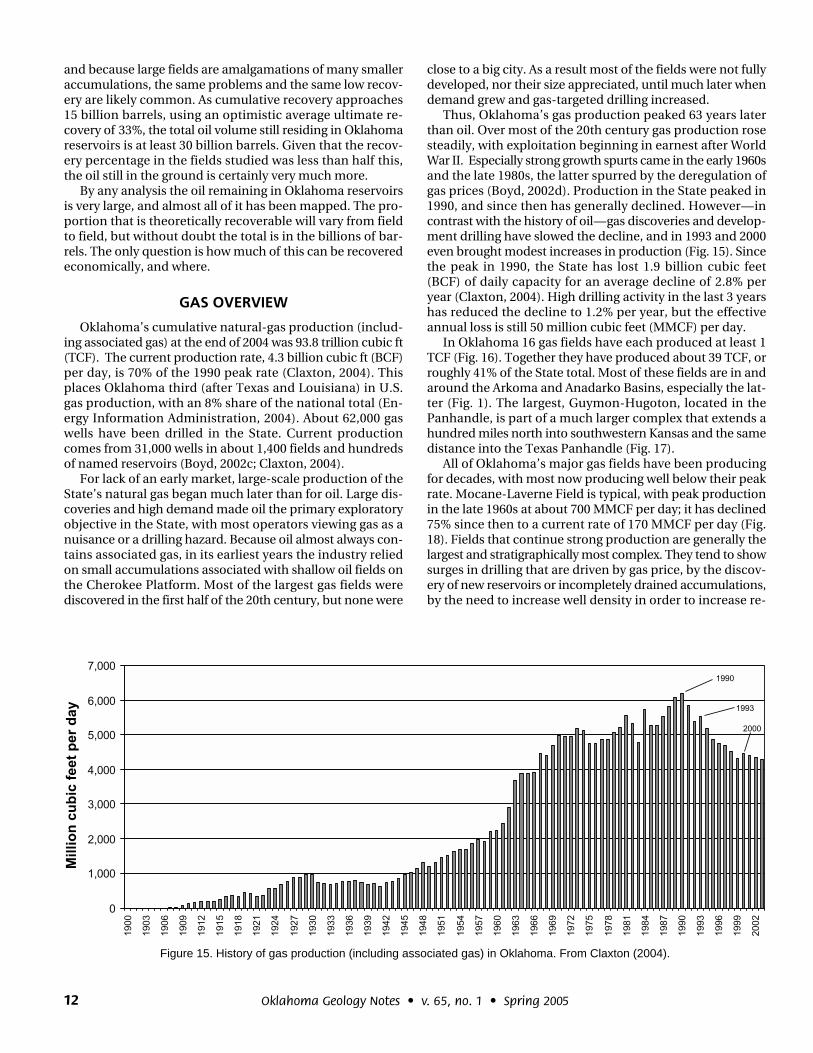
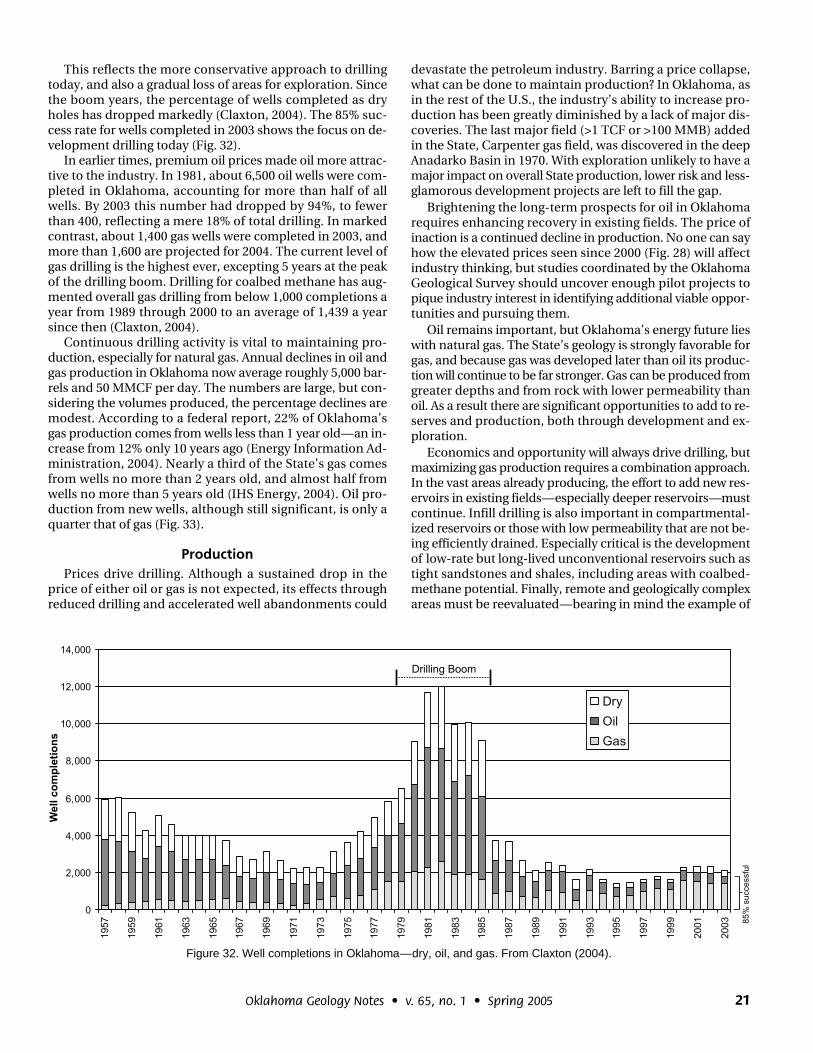
Thus, Oklahoma’s gas production peaked 63 years laterthan oil. Over most of the 20th century gas production rosesteadily, with exploitation beginning in earnest after WorldWar II. Especially strong growth spurts came in the early 1960sand the late 1980s, the latter spurred by the deregulation ofgas prices (Boyd, 2002d). Production in the State peaked in1990, and since then has generally declined. However—incontrast with the history of oil—gas discoveries and develop-ment drilling have slowed the decline, and in 1993 and 2000even brought modest increases in production (Fig. 15). Sincethe peak in 1990, the State has lost 1.9 billion cubic feet(BCF) of daily capacity for an average decline of 2.8% peryear (Claxton, 2004). High drilling activity in the last 3 yearshas reduced the decline to 1.2% per year, but the effectiveannual loss is still 50 million cubic feet (MMCF) per day.
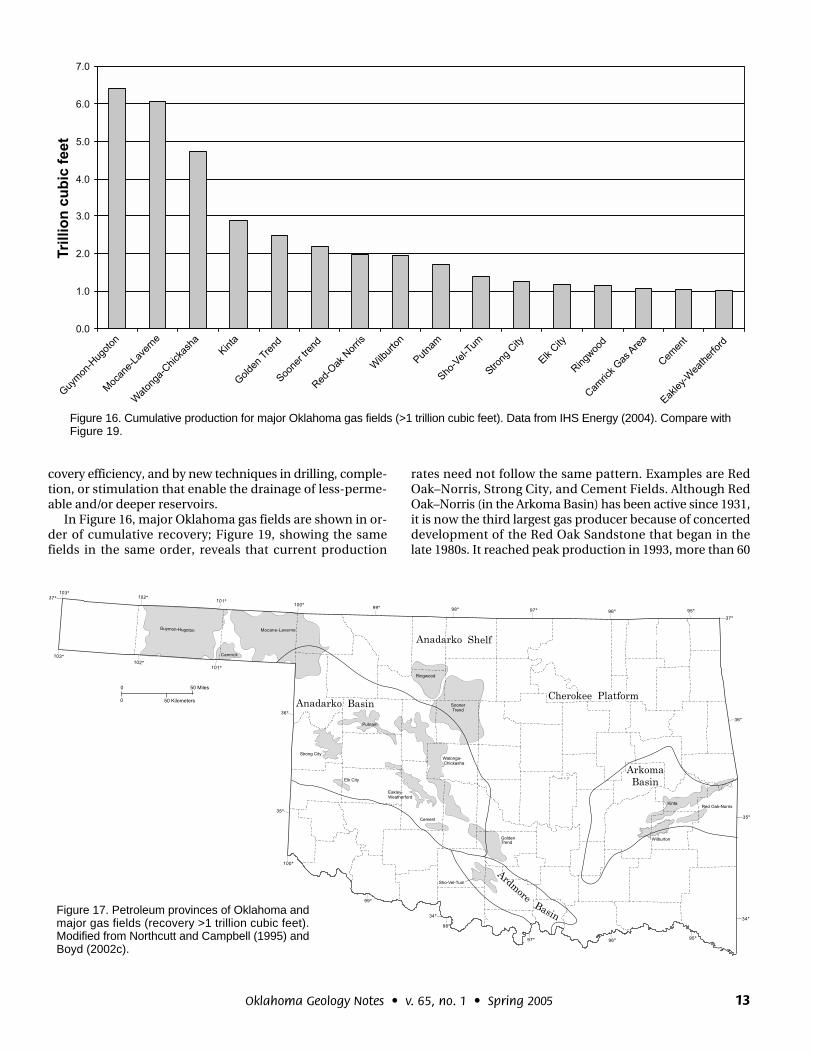
In Oklahoma 16 gas fields have each produced at least 1TCF (Fig. 16). Together they have produced about 39 TCF, orroughly 41% of the State total. Most of these fields are in andaround the Arkoma and Anadarko Basins, especially the lat-ter (Fig. 1). The largest, Guymon-Hugoton, located in thePanhandle, is part of a much larger complex that extends ahundred miles north into southwestern Kansas and the samedistance into the Texas Panhandle (Fig. 17).
All of Oklahoma’s major gas fields have been producingfor decades, with most now producing well below their peakrate. Mocane-Laverne Field is typical, with peak productionin the late 1960s at about 700 MMCF per day; it has declined75% since then to a current rate of 170 MMCF per day (Fig.18). Fields that continue strong production are generally thelargest and stratigraphically most complex. They tend to showsurges in drilling that are driven by gas price, by the discov-ery of new reservoirs or incompletely drained accumulations,by the need to increase well density in order to increase re-
Figure 15. History of gas production (including associated gas) in Oklahoma. From Claxton (2004).
13Oklahoma Geology Notes • v. 65, no. 1 • Spring 2005
covery efficiency, and by new techniques in drilling, comple-tion, or stimulation that enable the drainage of less-perme-able and/or deeper reservoirs.
In Figure 16, major Oklahoma gas fields are shown in or-der of cumulative recovery; Figure 19, showing the samefields in the same order, reveals that current production
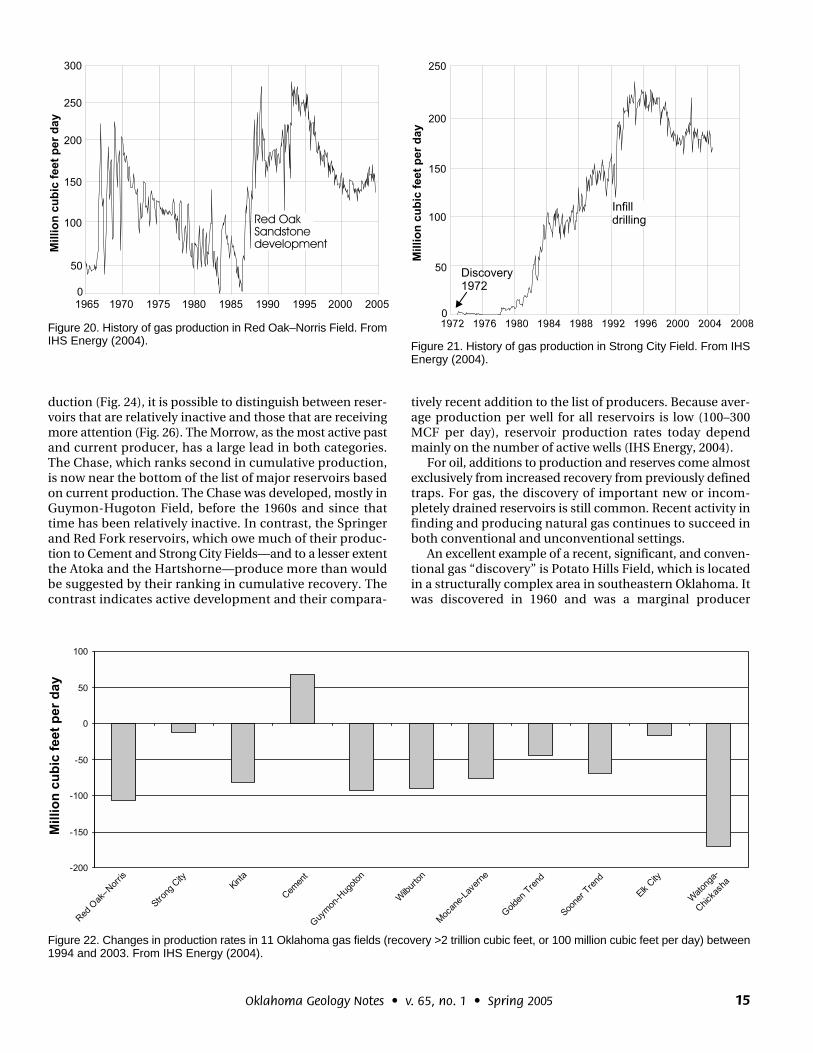
rates need not follow the same pattern. Examples are RedOak–Norris, Strong City, and Cement Fields. Although RedOak–Norris (in the Arkoma Basin) has been active since 1931,it is now the third largest gas producer because of concerteddevelopment of the Red Oak Sandstone that began in thelate 1980s. It reached peak production in 1993, more than 60
Figure 16. Cumulative production for major Oklahoma gas fields (>1 trillion cubic feet). Data from IHS Energy (2004). Compare withFigure 19.
Figure 17. Petroleum provinces of Oklahoma andmajor gas fields (recovery >1 trillion cubic feet).Modified from Northcutt and Campbell (1995) andBoyd (2002c).

14 Oklahoma Geology Notes • v. 65, no. 1 • Spring 2005
years after it first produced gas (Fig. 20). Today its 521 wellsproduce >150 MMCF per day, equaling its rate in 1970 (IHSEnergy, 2004).
Strong City Field is also producing gas faster than mightbe expected from its cumulative recovery. The field—in thecenter of the Anadarko Basin and producing primarily fromthe Red Fork Sandstone—was discovered relatively late, in1972. Active development began in the late 1970s on 640-acre well-spacing (one well per section), a spacing later de-termined, because of the generally low permeability of thesandstone, to be too wide for efficient drainage of the reser-voir. Increasing the well spacing to 160 acres in the late 1980s
and the early 1990s quadrupled the number of producingwells and pushed the field to peak production in 1994 (Fig.21). Although production has since declined, the field’s 814active wells are still capable of almost 200 MMCF per day(IHS Energy, 2004).
Of the largest Oklahoma gas fields (those with >2 TCF re-covery or 100 MMCF per day), only Cement Field is produc-ing more now than 10 years ago. For some, like Strong Cityand Elk City, the decline has been very small. However, in 2003Cement actually produced 70 MMCF per day more than in1994 (Fig. 22). Cement’s first gas well was drilled in 1920, butthroughout most of its history it has produced mainly oil. Gasproduction was generally below 10 MMCF per day until thelate 1980s, but then, with the advent of 3D seismic techniques,development of deep and structurally complex gas reservoirsbegan in earnest. Many of the most productive wells werecompleted in the Springer stratigraphic interval, where wellswith recoveries greater than 10 BCF are common. These con-tributed to three large production spikes, the latest onebriefly peaking in 2002 at almost 200 MMCF per day (Fig. 23;IHS Energy, 2004).
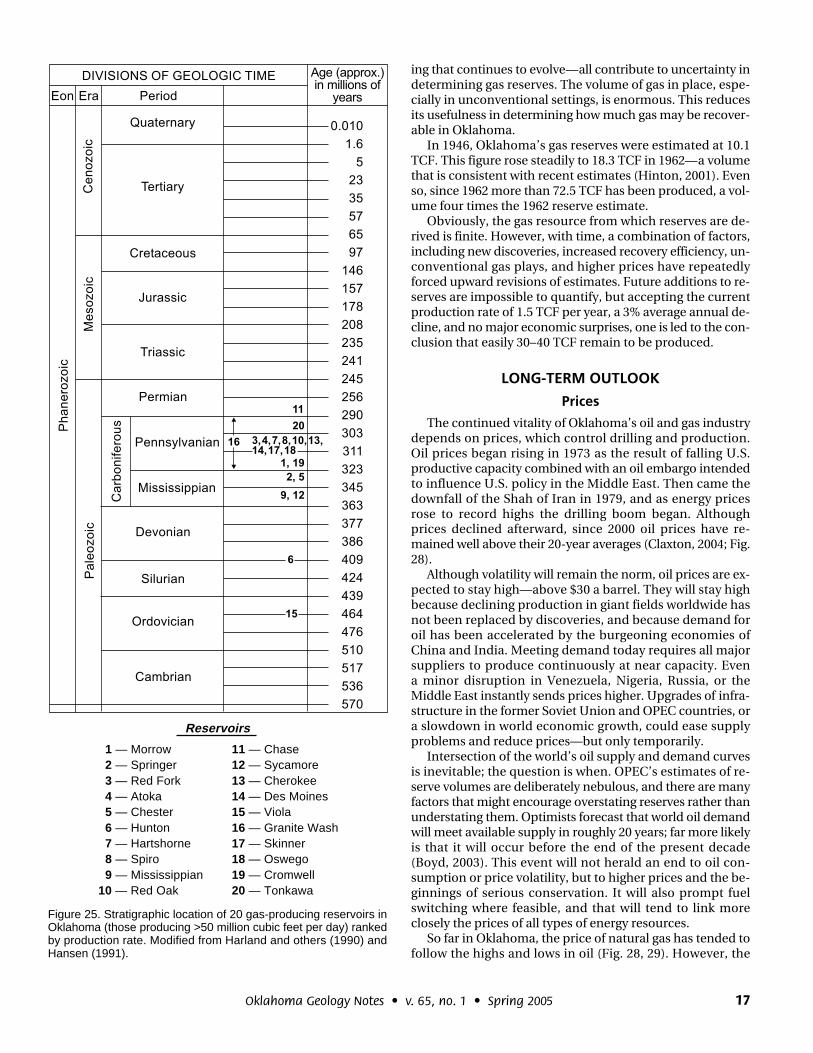
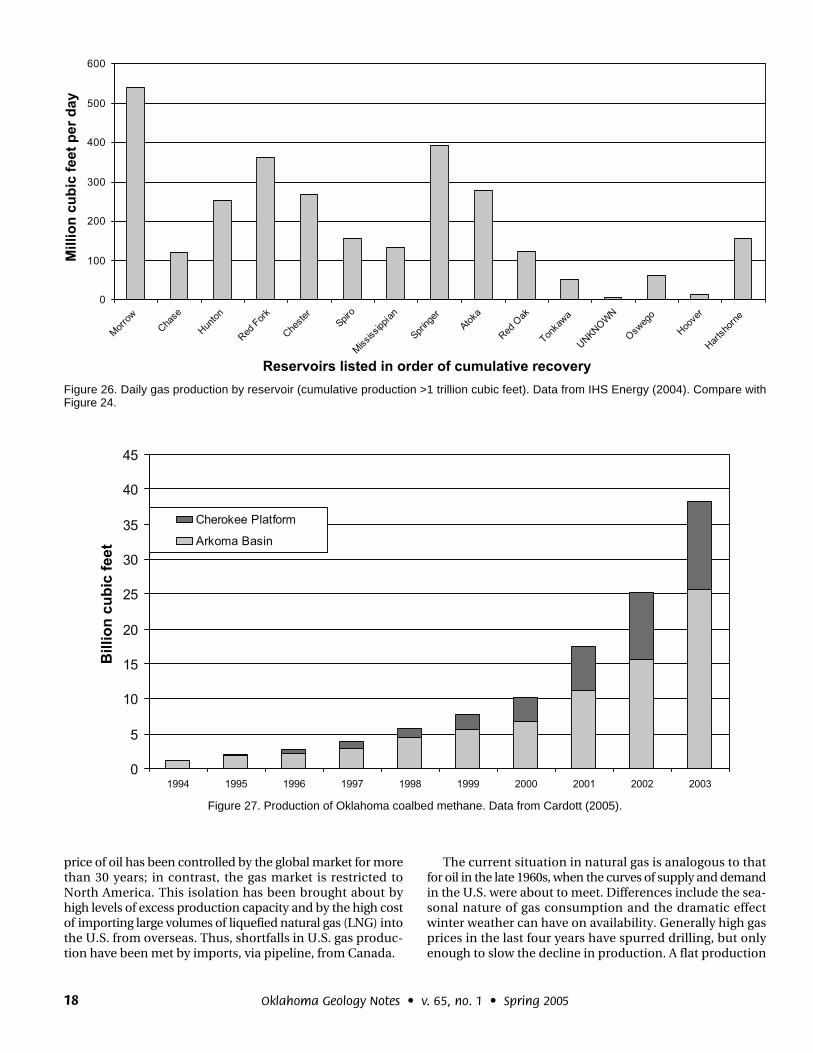
Gas production in Oklahoma is widespread not only geo-graphically (Fig. 2) but also stratigraphically (Figs. 24, 25). Incumulative production, reservoirs identified as “Morrow” havebeen the most prolific producers. The Morrow, mainly in theAnadarko Basin and Shelf, has produced about 13.5 TCFin Oklahoma and 8 TCF in the Texas Panhandle. Its recorddwarfs the production from the next largest Oklahoma reser-voir, the Chase, which has produced 6.0 TCF. Other leadinggas-producing reservoirs (IHS Energy, 2004) are the Hunton(5.5 TCF), Red Fork (4.7 TCF), and Chester (4.4 TCF).
In any setting, the exploitation of a resource may be ac-tive—or relatively inactive. If current reservoir productionrates are plotted in the same order as their cumulative pro-
Figure 18. History of gas production in Mocane-Laverne Field.From IHS Energy (2004).
Figure 19. Daily production of major Oklahoma gas fields (recovery >1 trillion cubic feet). From IHS Energy (2004). Compare with Figure 16.
15Oklahoma Geology Notes • v. 65, no. 1 • Spring 2005
duction (Fig. 24), it is possible to distinguish between reser-voirs that are relatively inactive and those that are receivingmore attention (Fig. 26). The Morrow, as the most active pastand current producer, has a large lead in both categories.The Chase, which ranks second in cumulative production,is now near the bottom of the list of major reservoirs basedon current production. The Chase was developed, mostly inGuymon-Hugoton Field, before the 1960s and since thattime has been relatively inactive. In contrast, the Springerand Red Fork reservoirs, which owe much of their produc-tion to Cement and Strong City Fields—and to a lesser extentthe Atoka and the Hartshorne—produce more than wouldbe suggested by their ranking in cumulative recovery. Thecontrast indicates active development and their compara-
tively recent addition to the list of producers. Because aver-age production per well for all reservoirs is low (100–300MCF per day), reservoir production rates today dependmainly on the number of active wells (IHS Energy, 2004).
For oil, additions to production and reserves come almostexclusively from increased recovery from previously definedtraps. For gas, the discovery of important new or incom-pletely drained reservoirs is still common. Recent activity infinding and producing natural gas continues to succeed inboth conventional and unconventional settings.
An excellent example of a recent, significant, and conven-tional gas “discovery” is Potato Hills Field, which is locatedin a structurally complex area in southeastern Oklahoma. Itwas discovered in 1960 and was a marginal producer
Figure 20. History of gas production in Red Oak–Norris Field. FromIHS Energy (2004). Figure 21. History of gas production in Strong City Field. From IHS
Energy (2004).
Figure 22. Changes in production rates in 11 Oklahoma gas fields (recovery >2 trillion cubic feet, or 100 million cubic feet per day) between1994 and 2003. From IHS Energy (2004).

16 Oklahoma Geology Notes • v. 65, no. 1 • Spring 2005
through January 1987, when it went off production aftermaking less than 1 BCF of gas. The area was inactive until1997, when a well drilled in the same section as a 1961 dryhole established production in the Jackfork Sandstone. Sincereturning to production in late 1998, the field has produced146 BCF of gas (IHS Energy, 2004) and eventually is likely toproduce 175–200 BCF. The production added from PotatoHills Field is among the most notable in decades, almostsinglehandedly accounting for the rise in overall State pro-duction in 2000. Although notable discoveries have becomeincreasingly rare, Potato Hills shows that Oklahoma’s poten-tial for gas, even in areas that have already seen considerabledrilling, is still far from fully defined.
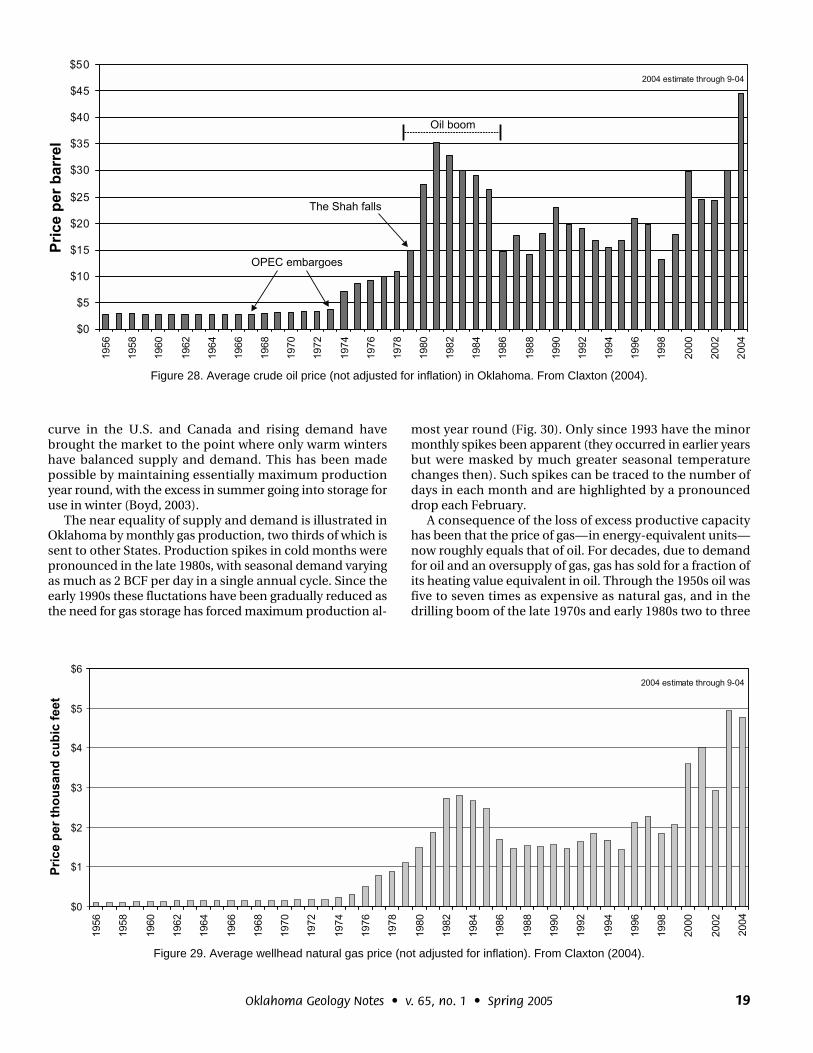
COALBED METHANEProduction of coalbed methane was first recorded in
Oklahoma in 1989 and is now by far the most active play inthe State, accounting for a third of gas-well drilling and aquarter of all wells (IHS Energy, 2004). As a gas resource it isconsidered unconventional, because coal acts as both reser-voir and source rock (Boyd, 2002d).
Since first production, 3,500 wells have been completed,and new ones are being added at a rate of about two per day(Cardott, 2004). Its stabilized production rate is typically low(50–100 MCF per day), but coalbed-methane wells are notedfor their long life and modest decline. Geologic risk is low be-cause of the number of times the objective coals have beenpenetrated by deeper wells, and relatively shallow, low-costcoalbed-methane wells are suited to the small operators thatpredominate in Oklahoma.
The numerous thin coals of the Desmoinesian Series(Middle Pennsylvanian) are the primary objective of Okla-homa’s coalbed-methane activity. Prospective areas are vast,with those already under production covering parts of 15counties on the eastern margin of the Cherokee Platformand the northern half of the Arkoma Basin (Figs. 1, 2). At theend of 2003, cumulative production—two thirds from theArkoma Basin—totaled 116 BCF. Annual production, whichcontinues to rise sharply, should exceed 50 BCF in 2004 (Car-dott, 2005; Fig. 27). Continued development ensures that coal-bed methane’s share of State hydrocarbon production willrise markedly in coming years.
GAS RESERVESWhether gas is coalbed methane or conventional, defin-
ing a range of reserves is difficult. Gas can exist at greaterdepths than oil and can flow through lower-permeabilityrock than oil. Thus, wider stratigraphic intervals and largergeographic areas are open to gas exploration. Fluctuatingprices, advances in technology, and a geologic understand-
Figure 23. History of gas production in Cement Field. From IHS En-ergy (2004).
Figure 24. Cumulative production of leading gas reservoirs (recovery >1 trillion cubic feet). Data from IHS Energy (2004). Comparewith Figure 26.
17Oklahoma Geology Notes • v. 65, no. 1 • Spring 2005
Figure 25. Stratigraphic location of 20 gas-producing reservoirs inOklahoma (those producing >50 million cubic feet per day) rankedby production rate. Modified from Harland and others (1990) andHansen (1991).
ing that continues to evolve—all contribute to uncertainty indetermining gas reserves. The volume of gas in place, espe-cially in unconventional settings, is enormous. This reducesits usefulness in determining how much gas may be recover-able in Oklahoma.
In 1946, Oklahoma’s gas reserves were estimated at 10.1TCF. This figure rose steadily to 18.3 TCF in 1962—a volumethat is consistent with recent estimates (Hinton, 2001). Evenso, since 1962 more than 72.5 TCF has been produced, a vol-ume four times the 1962 reserve estimate.
Obviously, the gas resource from which reserves are de-rived is finite. However, with time, a combination of factors,including new discoveries, increased recovery efficiency, un-conventional gas plays, and higher prices have repeatedlyforced upward revisions of estimates. Future additions to re-serves are impossible to quantify, but accepting the currentproduction rate of 1.5 TCF per year, a 3% average annual de-cline, and no major economic surprises, one is led to the con-clusion that easily 30–40 TCF remain to be produced.
LONG-TERM OUTLOOK
Prices
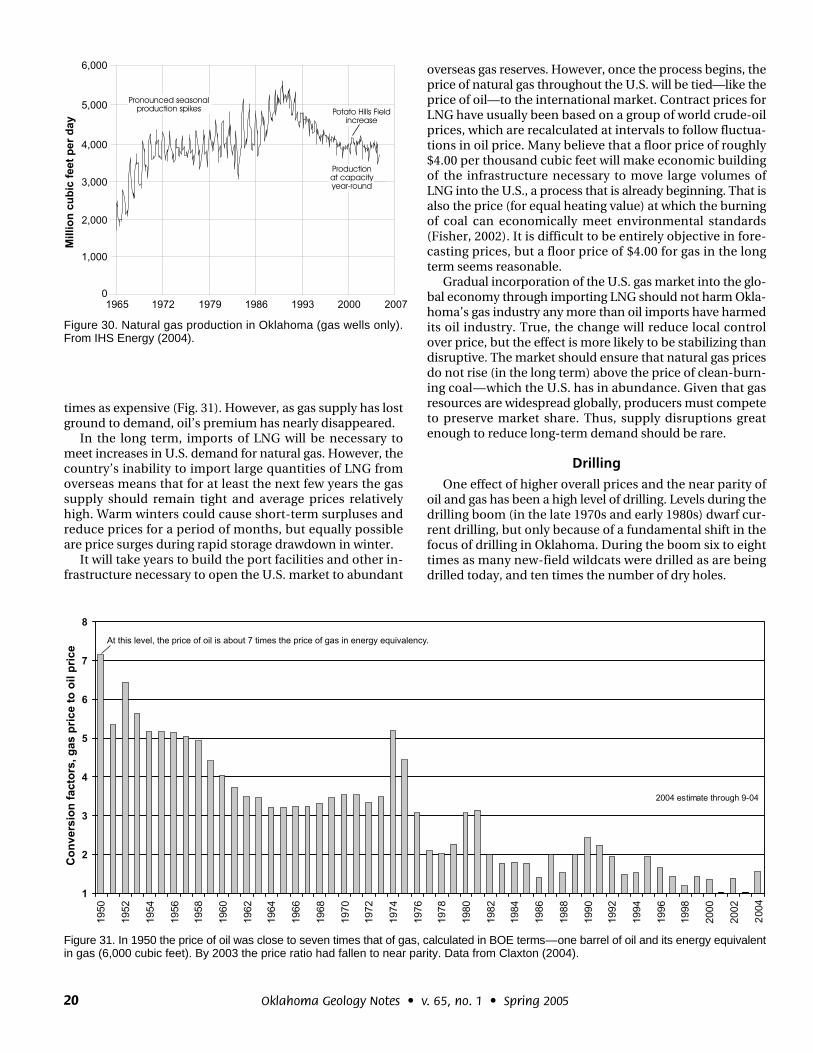
The continued vitality of Oklahoma’s oil and gas industrydepends on prices, which control drilling and production.Oil prices began rising in 1973 as the result of falling U.S.productive capacity combined with an oil embargo intendedto influence U.S. policy in the Middle East. Then came thedownfall of the Shah of Iran in 1979, and as energy pricesrose to record highs the drilling boom began. Althoughprices declined afterward, since 2000 oil prices have re-mained well above their 20-year averages (Claxton, 2004; Fig.28).
Although volatility will remain the norm, oil prices are ex-pected to stay high—above $30 a barrel. They will stay highbecause declining production in giant fields worldwide hasnot been replaced by discoveries, and because demand foroil has been accelerated by the burgeoning economies ofChina and India. Meeting demand today requires all majorsuppliers to produce continuously at near capacity. Evena minor disruption in Venezuela, Nigeria, Russia, or theMiddle East instantly sends prices higher. Upgrades of infra-structure in the former Soviet Union and OPEC countries, ora slowdown in world economic growth, could ease supplyproblems and reduce prices—but only temporarily.
Intersection of the world’s oil supply and demand curvesis inevitable; the question is when. OPEC’s estimates of re-serve volumes are deliberately nebulous, and there are manyfactors that might encourage overstating reserves rather thanunderstating them. Optimists forecast that world oil demandwill meet available supply in roughly 20 years; far more likelyis that it will occur before the end of the present decade(Boyd, 2003). This event will not herald an end to oil con-sumption or price volatility, but to higher prices and the be-ginnings of serious conservation. It will also prompt fuelswitching where feasible, and that will tend to link moreclosely the prices of all types of energy resources.
So far in Oklahoma, the price of natural gas has tended tofollow the highs and lows in oil (Fig. 28, 29). However, the
Reservoirs
1 — Morrow 2 — Springer 3 — Red Fork 4 — Atoka 5 — Chester 6 — Hunton 7 — Hartshorne 8 — Spiro 9 — Mississippian10 — Red Oak
11 — Chase12 — Sycamore13 — Cherokee14 — Des Moines15 — Viola16 — Granite Wash17 — Skinner18 — Oswego19 — Cromwell20 — Tonkawa
18 Oklahoma Geology Notes • v. 65, no. 1 • Spring 2005
price of oil has been controlled by the global market for morethan 30 years; in contrast, the gas market is restricted toNorth America. This isolation has been brought about byhigh levels of excess production capacity and by the high costof importing large volumes of liquefied natural gas (LNG) intothe U.S. from overseas. Thus, shortfalls in U.S. gas produc-tion have been met by imports, via pipeline, from Canada.
The current situation in natural gas is analogous to thatfor oil in the late 1960s, when the curves of supply and demandin the U.S. were about to meet. Differences include the sea-sonal nature of gas consumption and the dramatic effectwinter weather can have on availability. Generally high gasprices in the last four years have spurred drilling, but onlyenough to slow the decline in production. A flat production
Figure 26. Daily gas production by reservoir (cumulative production >1 trillion cubic feet). Data from IHS Energy (2004). Compare withFigure 24.
Figure 27. Production of Oklahoma coalbed methane. Data from Cardott (2005).
19Oklahoma Geology Notes • v. 65, no. 1 • Spring 2005
curve in the U.S. and Canada and rising demand havebrought the market to the point where only warm wintershave balanced supply and demand. This has been madepossible by maintaining essentially maximum productionyear round, with the excess in summer going into storage foruse in winter (Boyd, 2003).
The near equality of supply and demand is illustrated inOklahoma by monthly gas production, two thirds of which issent to other States. Production spikes in cold months werepronounced in the late 1980s, with seasonal demand varyingas much as 2 BCF per day in a single annual cycle. Since theearly 1990s these fluctations have been gradually reduced asthe need for gas storage has forced maximum production al-
most year round (Fig. 30). Only since 1993 have the minormonthly spikes been apparent (they occurred in earlier yearsbut were masked by much greater seasonal temperaturechanges then). Such spikes can be traced to the number ofdays in each month and are highlighted by a pronounceddrop each February.
A consequence of the loss of excess productive capacityhas been that the price of gas—in energy-equivalent units—now roughly equals that of oil. For decades, due to demandfor oil and an oversupply of gas, gas has sold for a fraction ofits heating value equivalent in oil. Through the 1950s oil wasfive to seven times as expensive as natural gas, and in thedrilling boom of the late 1970s and early 1980s two to three
Figure 28. Average crude oil price (not adjusted for inflation) in Oklahoma. From Claxton (2004).
Figure 29. Average wellhead natural gas price (not adjusted for inflation). From Claxton (2004).
20 Oklahoma Geology Notes • v. 65, no. 1 • Spring 2005
times as expensive (Fig. 31). However, as gas supply has lostground to demand, oil’s premium has nearly disappeared.
In the long term, imports of LNG will be necessary tomeet increases in U.S. demand for natural gas. However, thecountry’s inability to import large quantities of LNG fromoverseas means that for at least the next few years the gassupply should remain tight and average prices relativelyhigh. Warm winters could cause short-term surpluses andreduce prices for a period of months, but equally possibleare price surges during rapid storage drawdown in winter.
It will take years to build the port facilities and other in-frastructure necessary to open the U.S. market to abundant
overseas gas reserves. However, once the process begins, theprice of natural gas throughout the U.S. will be tied—like theprice of oil—to the international market. Contract prices forLNG have usually been based on a group of world crude-oilprices, which are recalculated at intervals to follow fluctua-tions in oil price. Many believe that a floor price of roughly$4.00 per thousand cubic feet will make economic buildingof the infrastructure necessary to move large volumes ofLNG into the U.S., a process that is already beginning. That isalso the price (for equal heating value) at which the burningof coal can economically meet environmental standards(Fisher, 2002). It is difficult to be entirely objective in fore-casting prices, but a floor price of $4.00 for gas in the longterm seems reasonable.
Gradual incorporation of the U.S. gas market into the glo-bal economy through importing LNG should not harm Okla-homa’s gas industry any more than oil imports have harmedits oil industry. True, the change will reduce local controlover price, but the effect is more likely to be stabilizing thandisruptive. The market should ensure that natural gas pricesdo not rise (in the long term) above the price of clean-burn-ing coal—which the U.S. has in abundance. Given that gasresources are widespread globally, producers must competeto preserve market share. Thus, supply disruptions greatenough to reduce long-term demand should be rare.
DrillingOne effect of higher overall prices and the near parity of
oil and gas has been a high level of drilling. Levels during thedrilling boom (in the late 1970s and early 1980s) dwarf cur-rent drilling, but only because of a fundamental shift in thefocus of drilling in Oklahoma. During the boom six to eighttimes as many new-field wildcats were drilled as are beingdrilled today, and ten times the number of dry holes.
Figure 30. Natural gas production in Oklahoma (gas wells only).From IHS Energy (2004).
Figure 31. In 1950 the price of oil was close to seven times that of gas, calculated in BOE terms—one barrel of oil and its energy equivalentin gas (6,000 cubic feet). By 2003 the price ratio had fallen to near parity. Data from Claxton (2004).
21Oklahoma Geology Notes • v. 65, no. 1 • Spring 2005
This reflects the more conservative approach to drillingtoday, and also a gradual loss of areas for exploration. Sincethe boom years, the percentage of wells completed as dryholes has dropped markedly (Claxton, 2004). The 85% suc-cess rate for wells completed in 2003 shows the focus on de-velopment drilling today (Fig. 32).
In earlier times, premium oil prices made oil more attrac-tive to the industry. In 1981, about 6,500 oil wells were com-pleted in Oklahoma, accounting for more than half of allwells. By 2003 this number had dropped by 94%, to fewerthan 400, reflecting a mere 18% of total drilling. In markedcontrast, about 1,400 gas wells were completed in 2003, andmore than 1,600 are projected for 2004. The current level ofgas drilling is the highest ever, excepting 5 years at the peakof the drilling boom. Drilling for coalbed methane has aug-mented overall gas drilling from below 1,000 completions ayear from 1989 through 2000 to an average of 1,439 a yearsince then (Claxton, 2004).
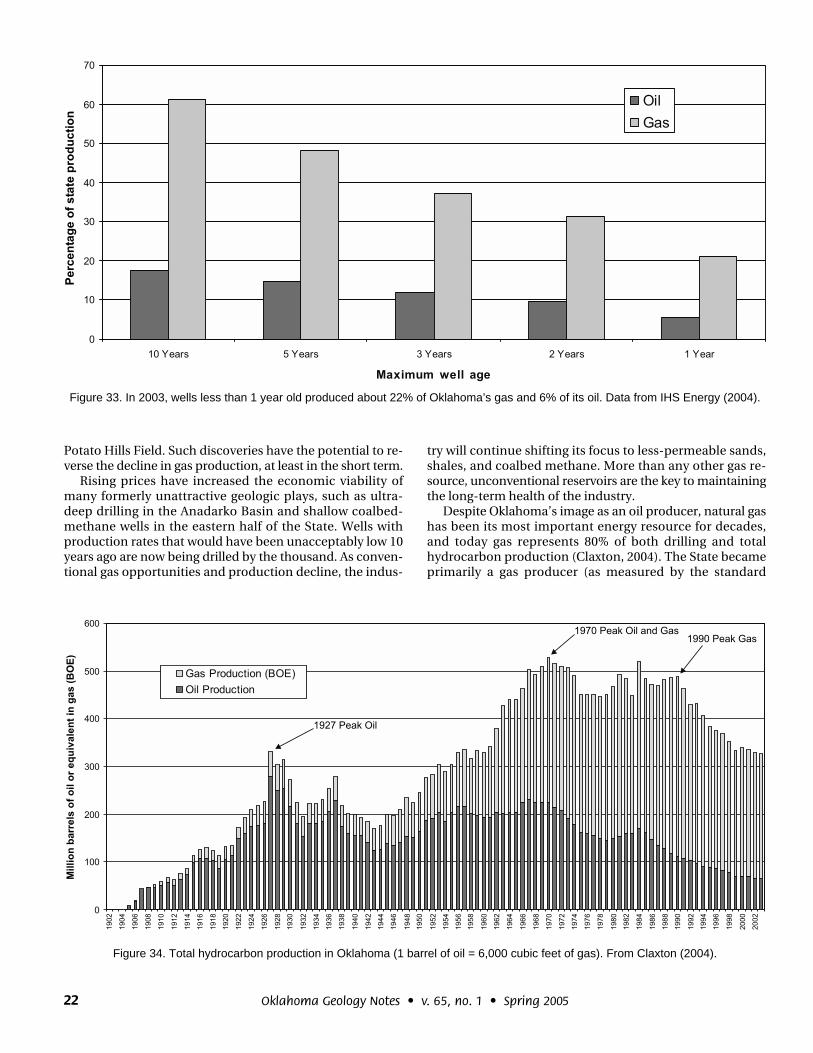
Continuous drilling activity is vital to maintaining pro-duction, especially for natural gas. Annual declines in oil andgas production in Oklahoma now average roughly 5,000 bar-rels and 50 MMCF per day. The numbers are large, but con-sidering the volumes produced, the percentage declines aremodest. According to a federal report, 22% of Oklahoma’sgas production comes from wells less than 1 year old—an in-crease from 12% only 10 years ago (Energy Information Ad-ministration, 2004). Nearly a third of the State’s gas comesfrom wells no more than 2 years old, and almost half fromwells no more than 5 years old (IHS Energy, 2004). Oil pro-duction from new wells, although still significant, is only aquarter that of gas (Fig. 33).
ProductionPrices drive drilling. Although a sustained drop in the
price of either oil or gas is not expected, its effects throughreduced drilling and accelerated well abandonments could
devastate the petroleum industry. Barring a price collapse,what can be done to maintain production? In Oklahoma, asin the rest of the U.S., the industry’s ability to increase pro-duction has been greatly diminished by a lack of major dis-coveries. The last major field (>1 TCF or >100 MMB) addedin the State, Carpenter gas field, was discovered in the deepAnadarko Basin in 1970. With exploration unlikely to have amajor impact on overall State production, lower risk and less-glamorous development projects are left to fill the gap.
Brightening the long-term prospects for oil in Oklahomarequires enhancing recovery in existing fields. The price ofinaction is a continued decline in production. No one can sayhow the elevated prices seen since 2000 (Fig. 28) will affectindustry thinking, but studies coordinated by the OklahomaGeological Survey should uncover enough pilot projects topique industry interest in identifying additional viable oppor-tunities and pursuing them.
Oil remains important, but Oklahoma’s energy future lieswith natural gas. The State’s geology is strongly favorable forgas, and because gas was developed later than oil its produc-tion will continue to be far stronger. Gas can be produced fromgreater depths and from rock with lower permeability thanoil. As a result there are significant opportunities to add to re-serves and production, both through development and ex-ploration.
Economics and opportunity will always drive drilling, butmaximizing gas production requires a combination approach.In the vast areas already producing, the effort to add new res-ervoirs in existing fields—especially deeper reservoirs—mustcontinue. Infill drilling is also important in compartmental-ized reservoirs or those with low permeability that are not be-ing efficiently drained. Especially critical is the developmentof low-rate but long-lived unconventional reservoirs such astight sandstones and shales, including areas with coalbed-methane potential. Finally, remote and geologically complexareas must be reevaluated—bearing in mind the example of
Figure 32. Well completions in Oklahoma—dry, oil, and gas. From Claxton (2004).
22 Oklahoma Geology Notes • v. 65, no. 1 • Spring 2005
Potato Hills Field. Such discoveries have the potential to re-verse the decline in gas production, at least in the short term.
Rising prices have increased the economic viability ofmany formerly unattractive geologic plays, such as ultra-deep drilling in the Anadarko Basin and shallow coalbed-methane wells in the eastern half of the State. Wells withproduction rates that would have been unacceptably low 10years ago are now being drilled by the thousand. As conven-tional gas opportunities and production decline, the indus-
try will continue shifting its focus to less-permeable sands,shales, and coalbed methane. More than any other gas re-source, unconventional reservoirs are the key to maintainingthe long-term health of the industry.
Despite Oklahoma’s image as an oil producer, natural gashas been its most important energy resource for decades,and today gas represents 80% of both drilling and totalhydrocarbon production (Claxton, 2004). The State becameprimarily a gas producer (as measured by the standard
Figure 33. In 2003, wells less than 1 year old produced about 22% of Oklahoma’s gas and 6% of its oil. Data from IHS Energy (2004).
Figure 34. Total hydrocarbon production in Oklahoma (1 barrel of oil = 6,000 cubic feet of gas). From Claxton (2004).

23Oklahoma Geology Notes • v. 65, no. 1 • Spring 2005
equivalent energy) in 1963, and in 2000 cumulative gas pro-duction exceeded cumulative oil even though oil productionbegan before statehood.
If oil and natural gas are combined (with the usual con-version, denoted as BOE for Barrels of Oil Equivalency), the1927 peak in Oklahoma’s oil production (333 MMBOE) is re-vealed as only an intermediate high in overall hydrocarbonproduction (Fig. 34). The all-time combined production highof 527 MMBOE came in 1970, a figure approached in 1984with 518 MMBOE. From this perspective it is clear that theindustry in Oklahoma is not in its twilight, but will remainvery strong for decades.
Oil and gas satisfy the great bulk of energy demand in theU.S. and the rest of the world, and no alternative source is insight which can change that (Boyd, 2003). Demand is risingwith the growth of world economies, and the federal govern-ment has predicted that for the next 20 years petroleum’sshare of the global market will actually increase (Energy In-formation Administration, 2003). Use of oil will be cappedwhen production reaches capacity, but global natural-gasreserves are enormous and remain largely untapped. InNorth America, the construction of facilities for importingLNG will enable overseas reserves to meet the growing U.S.demand for decades (Boyd, 2003). Meanwhile, an increas-ingly tight supply of world oil and domestic gas means thatthe long-term outlook for prices has never been stronger. Aslong as this situation continues, the economics for oil andgas projects will be excellent and activity will remain high. InOklahoma, the challenge is to identify and exploit the myriadof oil and gas opportunities that have become economicallyviable in this environment.
ACKNOWLEDGMENTS
Most of the data presented here were furnished by Petro-leum Information/Dwights LLC dba IHS Energy Group, allrights reserved. Without its excellent database, which wasprovided to the Oklahoma Geological Survey free of charge,this report could not have been completed.
REFERENCES CITEDBoyd, D. T., 2002a, Map of Oklahoma oil and gas production (by res-
ervoir age): Oklahoma Geological Survey Map GM-38, 1 sheet,scale 1:500,000.
————2002b, Oklahoma oil: past, present, and future: OklahomaGeology Notes, v. 62, no. 3, p. 97–106.
————2002c, Map of Oklahoma oil and gas fields (distinguishedby GOR and conventional gas vs. coalbed methane: OklahomaGeological Survey Map GM-36, 1 sheet, scale 1:500,000.
————2002d, Oklahoma natural gas: past, present, and future:Oklahoma Geology Notes, v. 62, no. 4, p. 143–155.
————2003, Oklahoma oil, natural gas, and our place in the bigpicture: Oklahoma Geology Notes, v. 63, no. 1, p. 4–30.
Cardott, B. J., 2004, Personal communication: Oklahoma GeologicalSurvey, Norman, Oklahoma.
————2005, Coalbed-methane activity in Oklahoma, 2004 up-date, in Cardott, B. J. (ed.), Unconventional energy resources inthe southern Midcontinent, 2004 symposium: Oklahoma Geo-logical Survey Circular 110, p. 69–81.
Claxton, Larry (ed.), 2004, Oil and gas information: Oklahoma Cor-poration Commission, 2003 report on crude oil and natural gasactivity within the State of Oklahoma; accessed October 2004 athttp://www.occ.state.ok.us/Divisions/OG/AnnualReports/\2004%20OIL%20AND%20GAS%20REPORT.pdf
————2005, Personal communication, oil and gas information:Oklahoma Corporation Commission.
Energy Information Administration, 2003, U.S. and global petro-leum information: Accessed December 2004 at http://www.eia.doe.gov/pub/oil_gas/natural_gas/data_publications/\crude_oil_natural_gas_reserves/current/pdf/ch3.pdf
————2004, Natural gas productive capacity for the lower-48states 1985–2003: Accessed October 2004 at http://www.eia.doe.gov/pub/oil_gas/natural_gas/analysis_publications/\ngcap2003/ngcap2003.html
Fisher, W. L., 2002, Domestic natural gas: the coming methaneeconomy: Geotimes, v. 47, no. 11 (November), p. 20–22.
Hansen, W. R. (ed.), 1991, Suggestions to authors of the reports ofthe United States Geological Survey (7th edition): U.S. Govern-ment Printing Office, Washington, D.C., p. 59.
Harland, W. B.; Armstrong, R. L.; Cox, A. V.; Craig, L. E.; Smith, A. G.;and Smith, D. G., 1990, A geologic time scale: Cambridge Univer-sity Press, Cambridge, England, 263 p.
Hinton, David (ed.), 2001, Petroleum profile: Oklahoma: U.S. De-partment of Energy, Energy Information Administration; ac-cessed October 2004 at http://tonto.eia.doe.gov/oog/info/state/ok.html
IHS Energy, 2004, Data supplied by Petroleum Information/Dwights LLC dba IHS Energy Group, October 1, 2004. All rightsreserved.
International Oil Scouts Association, Marilyn Lay, (ed.), 2001, An-nual review of oil and gas production by fields in the UnitedStates and Canada, v. 70, p. 173–221.
Northcutt, R. A.; and Campbell, J. A., 1995, Geologic provinces ofOklahoma: Oklahoma Geological Survey Open-File Report 5-95,scale 1:750,000.
Southwell, John, 2004, Personal communication: Celero Energy,Midland, Texas.