oklahoma seat belt observation studyohso.ok.gov/websites/ohso/images/surveys/2019 oklahoma seat...
TRANSCRIPT

SEAT BELT OBSERVATION STUDY Summer 2019
Robert D. Delano, Ph.D. Professor
Dean Findley, Ph.D. Assistant Professor
University of Central Oklahoma College of Education and Professional Studies
Department of Adult Education and Safety Sciences Industrial Safety Program
100 N. University Dr., HES 200A Edmond, Oklahoma 73034
September 2019
This report was prepared for the Oklahoma Highway Safety Office in cooperation with the National Highway Traffic Safety Administration, U.S. Department of Transportation and/or Federal Highway Administration. The conclusions and opinions expressed in this report are those of the University of Central Oklahoma, College of Education and Professional Studies, Department of Adult Education and Safety Sciences, Industrial Safety Program, and do not necessarily represent those of the State of Oklahoma, the Oklahoma Highway Safety Office, the U.S. Department of Transportation, or any other agency of the State or Federal Government.

TABLE OF CONTENTS
Page Number
Executive Summary ........................................................................................................................................................ ii Introduction ....................................................................................................................................................................... 1 Study Methodology ......................................................................................................................................................... 1 Results of the Survey ..................................................................................................................................................... 11 Summary and Recommendations ............................................................................................................................ 14 References ........................................................................................................................................................................ 16 Appendix A: Seat Belt Observation Sites ............................................................................................................... 17
LIST OF TABLES Table 1: Oklahoma’s Average Vehicle Crash-Related Fatalities by County 2010-2014 ........................... 2 Table 2: Population and Measure of Size and Probability of Selection, by Stratum,
for County Selection ...................................................................................................................................... 5 Table 3: Seat Belt Use Codes and Definitions ................................................................................................ 10 Table 4: Estimate of Seat Belt Use in Oklahoma: Summer 2019 ............................................................... 11
Table 5: Estimate of Seat Belt Use in Oklahoma by County: Summer 2019 .............................................. 12 Table 6: Estimate of Seat Belt Use by Occupant and Vehicle Type: Summer 2019 ................................. 13

ii
2019 EXECUTIVE SUMMARY The 2019 Oklahoma statewide survey of safety belt use was conducted in 19 counties at 299 observation sites during June and July. This was the third year using a resampling of the counties and roads based on the initial observational survey design which was first used in 2012 and is fully compliant with NHTSA guidelines. In 2019, 37,812 drivers and front-seat outboard passengers were observed. In only 34 (0.09%) cases were the surveyors unable to determine if the occupant was restrained. Overall, 84.7% of people were restrained compared to 85.6%, 86.9%, 86.6%, 84.4%, 86.3%, and 83.6% in the most recent previous surveys. There were significant variations in usage rates across regions of the state, by road type, by vehicle type, and by individual counties.
Estimate of Seat Belt Use in Oklahoma Summer 2019
Number of Observations
Weighted Estimate
(PERCENT)
Standard Error
(PERCENT)
Confidence Interval*
(PERCENT)
Statewide 37,778 84.7 1.2 +/- 2.3
Regions
West 12,345 86.6 0.4 +/- 0.8
Northeast 18,204 84.7 1.9 +/- 3.7
Southeast 7,228 75.2 1.2 +/- 2.3
Roadway Type**
S1100 Primary Roads 2,788 88.8 4.2 +/- 8.2
S1200 Secondary Roads 9,043 78.1 3.8 +/- 7.4
S1400 Local and Rural 25,947 85.3 0.7 +/- 1.3 * Based on a 95 percent confidence level, the actual belt use for each category shown in the table is the estimated percentage use + or – the standard error (S.E.) multiplied by 1.96. Standard errors were calculated using SPSS v25 Complex Samples Module. ** S1100 Primary Roads are generally divided, limited access highways within the interstate system. S1200 roads are main arteries in the State Highway or County Highway system. They have one or more lanes of traffic in each direction and often have a local name and a route number. S1400 Roads are paved, non-arterial streets, roads, or byways that usually have a single lane of traffic in each direction.

1
Seat Belt Observation Study - 2019
OKLAHOMA SEAT BELT OBSERVATION STUDY SUMMER 2019
INTRODUCTION In the spring of 2019, the Industrial Safety Program at the University of Central Oklahoma (UCO) contracted with the Oklahoma Highway Safety Office (OHSO) to perform the 2019 Oklahoma Seat Belt Observation Study. The Oklahoma law requiring automobile drivers and front-seat passengers to buckle up became effective February 1, 1987. It was amended on February 1, 1989 to require drivers and front-seat passengers of pickup trucks and vans to also wear seat belts. Until the enactment of House Bill 1443 in 1997, Oklahoma's law permitted only "secondary enforcement,” which meant an unbelted driver could be ticketed only after being stopped for another traffic violation. The 1997 law now permitted primary enforcement, meaning a law enforcement officer could issue a citation solely for failure to buckle up. Oklahoma, along with 33 other states, the District of Columbia, Guam, the Northern Mariana Islands, Puerto Rico and the Virgin Islands, currently have primary seat belt laws for front seat occupants (Governors Highway Safety Association, 2019). On April 2012, a survey design was approved by NHTSA. This design was used from 2012-2016, consistent with NHTSA guidelines. For 2017, however, NHTSA required all states to re-sample their observation sites to keep up with changing demographics, road construction, and related changes that occur over time. As a result, the 2019 survey (which will be used until 2021) uses this resampled set of observation locations. The 2019 survey included 299 observation sites, resulting in 37,812 drivers and front-seat outboard passengers being observed for safety belt use. In 34 cases the surveyors were unable to determine whether or not the occupant was restrained leaving an effective sample size of 37,778 for further analysis. This report presents the results of the summer 2019 survey and makes some comparisons to recent statewide surveys. STUDY METHODOLOGY This section describes the process used to sample and allocate sites for observation and procedures for observation and data collection, weighting and data analysis, and observer selection and training. Survey findings are presented following the discussion of the study methodology.
Sample Design The Oklahoma research design conforms to the requirements of the NHTSA “Uniform Criteria” and will generate annual estimates of occupant restraint use for adults and children using booster seats in the front seats of passenger vehicles. Oklahoma intends to update the sample of data collection sites every five years in order to have survey results that reflect geographic areas with more than 85% of crash-related fatalities. The sample design was provided to Oklahoma under a consultant agreement with Dr. William Bommer of California State University, Fresno. The design approach

2
Seat Belt Observation Study - 2019
includes a stratified systematic probability proportioned to size (PPS) sample of data collection sites and is described below:
1. All 77 counties in Oklahoma were listed in descending order of the average number of motor vehicle crash-related fatalities for the period of 2010 to 2014. Fatality Analysis Reporting System (FARS) data were used to determine the average number of crash-related fatalities per county. It was determined that 46 counties accounted for at least 85% of Oklahoma’s total crash-related fatalities. These 46 counties comprise the sample frame and will be represented by a subsample of counties. (See Table 1).
2. The counties were stratified according to geographical region into three strata, and 19
counties were selected. Seven counties were selected with PPS from the stratum region 1 (Western Oklahoma); 7 counties were selected PPS from the stratum region 2 (Northeastern Oklahoma) and 5 counties were selected PPS from the stratum region 3 (Southeastern Oklahoma). This represents the first stage of sample selection (See Table 2).
3. Road segments were selected randomly and with PPS from all segments in the sampled counties. Depending on the county, a number of road segments were identified for selection: (15 counties had 15 road segments selected, the two largest counties had 30 selected road segments, and the two smallest counties had 7 selected road segments. A random, systematic sample of road segments was selected PPS to road segment length within each sampled county. This represents the first stage of sample selection since the road type was not stratified. This process resulted in the selection of 299 road segments (15 counties x 15 sites per county + 2 counties x 30 sites per county + 2 counties x 7 sites per county). Additional sites were also selected to use as alternates.
4. Based on past experience with the Oklahoma Annual Seat Belt Use Study, it is expected
there will be an adequate sample size to yield an error rate of less than 2.5%. In the event there is a standard error greater than 2.5%, more data will be collected from existing sites.
5. Additional stages of selection were and will be used to determine, travel direction, lane, and vehicles to be observed, at random and with known probability, as appropriate under the NHTSA Uniform Criteria.
Table 1 – Oklahoma’s Average Vehicle Crash-Related Fatalities by County 2010-2014
County Average fatality
counts for 5 years
Fatality percentage within
the state Cumulative fatality
percentage
Oklahoma 77.4 11.2 11.2 Tulsa 66.6 9.6 20.8 Payne 18 2.6 23.4 Grady 16.6 2.4 25.8

3
Seat Belt Observation Study - 2019
Canadian 16.2 2.3 28.2 Creek 16 2.3 30.5 Cleveland 15.6 2.3 32.7 Pottawatomie 15 2.2 34.9 Comanche 14 2 36.9 Rogers 14 2 38.9 Carter 13.6 2 40.9 Mayes 13.2 1.9 42.8 Muskogee 13.2 1.9 44.7 Wagoner 13.2 1.9 46.6 Delaware 12.8 1.9 48.5 Caddo 12.4 1.8 50.3 Okmulgee 12.2 1.8 52 Lincoln 12 1.7 53.8 McCurtain 11.8 1.7 55.5 Bryan 10.8 1.6 57 McClain 10.8 1.6 58.6 Garvin 10.4 1.5 60.1 Logan 9 1.3 61.4 Osage 9 1.3 62.7 Ottawa 8.8 1.3 64 Le Flore 8.6 1.2 65.2 Pittsburg 8.6 1.2 66.5 Sequoyah 8.6 1.2 67.7 Stephens 8.6 1.2 69 Garfield 8.2 1.2 70.1 Kay 8 1.2 71.3 Custer 7.8 1.1 72.4 Cherokee 7.6 1.1 73.5 Pontotoc 7.4 1.1 74.6 Craig 7.3 1 75.6 McIntosh 7 1 76.7 Seminole 6.8 1 77.6 Noble 6 0.9 78.5 Woodward 6 0.9 79.4 Atoka 5.8 0.8 80.2 Beckham 5.8 0.8 81 Pushmataha 5.8 0.8 81.9 Murray 5.6 0.8 82.7 Washington 5.6 0.8 83.5 Marshall 5.4 0.8 84.3 Kingfisher 5.2 0.8 85 Washita 5.2 0.8 85.8
Table 1 Continued

4
Seat Belt Observation Study - 2019
Blaine 5 0.7 86.5 Texas 5 0.7 87.2 Nowata 4.8 0.7 87.9 Love 4.6 0.7 88.6 Beaver 4.4 0.6 89.2 Choctaw 4.4 0.6 89.9 Pawnee 4.4 0.6 90.5 Roger Mills 4.4 0.6 91.1 Kiowa 4 0.6 91.7 Adair 3.8 0.5 92.3 Major 3.8 0.5 92.8 Grant 3.6 0.5 93.3 Haskell 3.6 0.5 93.9 Hughes 3.4 0.5 94.3 Okfuskee 3.4 0.5 94.8 Dewey 3.2 0.5 95.3 Ellis 3.2 0.5 95.8 Woods 3.2 0.5 96.2 Johnston 3 0.4 96.7 Cimarron 2.7 0.4 97 Harmon 2.5 0.4 97.4 Jackson 2.4 0.3 97.8 Latimer 2.4 0.3 98.1 Cotton 2.3 0.3 98.4 Jefferson 2.2 0.3 98.7 Greer 2 0.3 99 Harper 2 0.3 99.3 Alfalfa 1.6 0.2 99.6 Coal 1.6 0.2 99.8 Tillman 1.5 0.2 100
Sample Size and Precision
A standard error of less than 2.5% for the seat belt use estimates is required by the Final Rule requiring seatbelts issued by NHTSA. Since 1999, Oklahoma has conducted the Oklahoma Annual Seat Belt Use Study, and has historically obtained standard errors below this threshold. Therefore, since the current design is expected to yield a comparable sample size to previous surveys, and the sampling process is identical, the precision objective should be achieved. In the event that the precision objective is not met, additional observations will be taken starting with sites having the fewest observations. New data will be added to existing data until the desired precision is achieved.
Table 1 Continued

5
Seat Belt Observation Study - 2019
County Selection
Table 1 lists the counties and their average number of motor vehicle crash-related fatalities for the period 2010-2014 as reported in the Fatality Analysis Reporting System (FARS). Of these 77 counties, 46 counties accounted for 85.0% of the total fatalities and represented the first stage of sampling. Then, 46 counties were stratified into three groups according to their geographic region (Northeast, Southeast, and West). From these strata, 7 counties were selected from the larger Northeast and Southeast regions and 5 counties from the smaller Southeastern region. These 19 counties were selected PPS as the first stage of sampling. The sampled counties, their measure of size (MOS), and probabilities of selection are shown in Table 2.
Table 2 - Population and Measure of Size and Probability of Selection, by Stratum, for
County Selection
Strata County (ID#) County
Road Miles Region Road Miles Total
Final Probabilities of Selection
Region 1: West
Oklahoma (109) 5505.48
22076.28
1.00* Comanche (31) 3055.98 1.00* Garfield (47) 2768.98 1.00* Canadian (17) 2630.45 0.979151* Cleveland (27) 2568.12 0.955949* Logan (83) 2074.19 0.77209* McClain (87) 1294.16 0.481734 Beckham (9) 319.96 0.119101 Caddo (15) 289.21 0.107655* Grady (51) 266.34 0.099142 Carter (19) 244.5 0.091012 Garvin (49) 240.21 0.089415 Custer (39) 224.67 0.083631 Woodward (153) 184.17 0.068555 Stephens (137) 180.76 0.067286 Kingfisher (73) 122.91 0.045752 Murray (99) 106.19 0.039528
Region 2: Northeast
Osage (113) 4945.47
18266.85
1.00* Tulsa (143) 4235.3 1.00* Creek (37) 2828.59 1.00* Rogers (131) 2377.79 1.00* Wagoner (145) 1786.09 1.00* Lincoln (81) 275.36 0.263048* Mayes (97) 264.5 0.252674

6
Seat Belt Observation Study - 2019
Noble (103) 260.13 0.248499 Delaware (41) 228.84 0.218608 Payne (119) 223.26 0.213278* Kay (71) 221.29 0.211396 Ottawa (115) 203.38 0.194286 Craig (35) 159.99 0.152836 Cherokee (21) 154.53 0.147621 Washington (147) 102.33 0.097755
Region 3: Southeast
Pottawatomie (125) 2257.67
6785.29
1.00* Sequoyah (135) 1719.72 1.00* Le Flore (79) 352.81 0.376947 Pittsburg (121) 305.39 0.326283 Muskogee (101) 270.71 0.28923* McCurtain (89) 270.44 0.288942 Pushmataha (127) 245.54 0.262338 Bryan (13) 241.78 0.258321 Seminole (133) 231.42 0.247252* McIntosh (91) 217.34 0.232209 Atoka (5) 199.08 0.2127 Okmulgee (111) 190.43 0.203458 Pontotoc (123) 170.07 0.181705* Marshall (95) 112.89 0.120613
Note: * Denotes counties selected
Sampling Note: 30 sites from Tulsa and Oklahoma counties based on population, 7 sites from Seminole and Caddo.
15 sites from all other.
Within each stratum, counties were selected with probability proportional to size with the MOS being road miles. Let 𝑔 = 1,2, … 𝐺 be the first stage strata, 𝑣𝑔𝑐 be road miles for county 𝑐 in stratum 𝑔, 𝑣𝑔 = ∑ 𝑣𝑔𝑐𝑎𝑙𝑙 𝑐 𝑖𝑛 𝑔 be the total road miles for all counties in first stage stratum 𝑔. Then PSU inclusion probability is: 𝜋𝑔𝑐 = 𝑛𝑔𝑣𝑔𝑐/𝑣𝑔, here 𝑛𝑔is the PSU sample size for first stage stratum 𝑔 that was allocated. If a county was selected with certainty (i.e., its MOS was equal to or exceeded 𝑣𝑔/𝑛𝑔), it was set aside as a certainty selection and the probabilities of selection were recalculated for the remaining counties in the stratum. This was repeated and the certainty selections were identified successively until no county’s MOS was equal to or exceeded the recalculated 𝑣𝑔/𝑛𝑔. The total road miles of the stratum was then recalculated again, as well as the probabilities of selection for the remaining counties, until no more counties were selected with certainty for the second stratum.
After all certainty counties were identified, a sampling interval (I) was calculated as the total (i.e., remaining) road length across all counties not selected with certainty within the region divided by the number of counties still needed to be selected within each region. A random start (RS) was selected between 0 and the calculated sampling interval (I), which determines the first county
Table 2 Continued

7
Seat Belt Observation Study - 2019
selected. Subsequent counties selected were determined by adding multiples of I to the RS until the desired number of counties was selected and/or the end of the sorted list was reached. Road Segment Selection
After the 19 sampled counties were selected, the road segments needed to be selected. To do this, we ordered the counties by their miles of paved roads. Thirty road segments were selected PPS from the largest two counties, 15 road segments were selected with PPS from each of the next 15 sized counties, and 7 segments were selected with PPS from the smallest two counties. Oklahoma employed the Census TIGER data for the selection of road segments. Oklahoma exercised the available exclusion option and removed rural local roads in counties that are not within Metropolitan Statistical Areas (MSAs), and other non-public roads, unnamed roads, unpaved roads, vehicular trails, access ramps, cul-de-sacs, traffic circles, and service drives from the dataset. The list of eligible road segments within each selected county was sorted by segment length to obtain an ordered list. Road segments were selected with PPS using road length as the MOS. A sampling interval (I) was calculated as the total length across all remaining road segments within the county divided by the number of road segments to select within each county (i.e. 15). A random start (RS) was selected between 0 and the calculated I, which determined the first road segment selected. Subsequent road segments selected were determined by adding multiples of I to the RS until the desired number of road segments was selected and/or the end of the sorted list was reached.
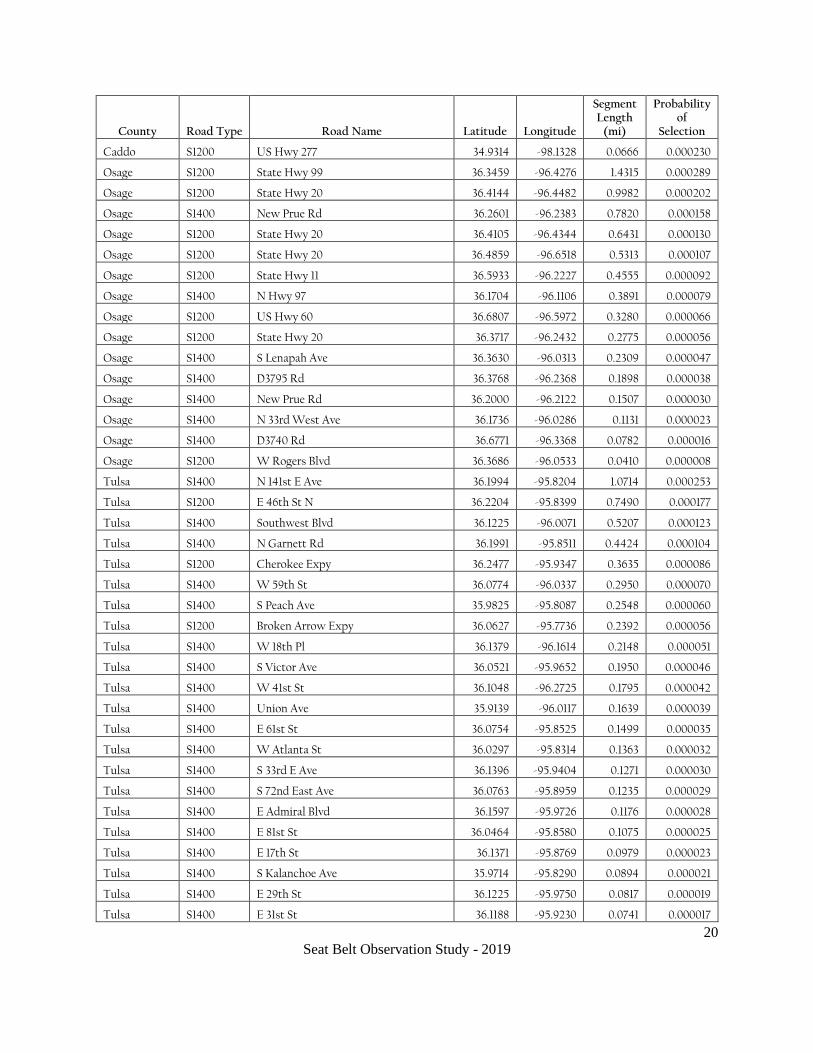
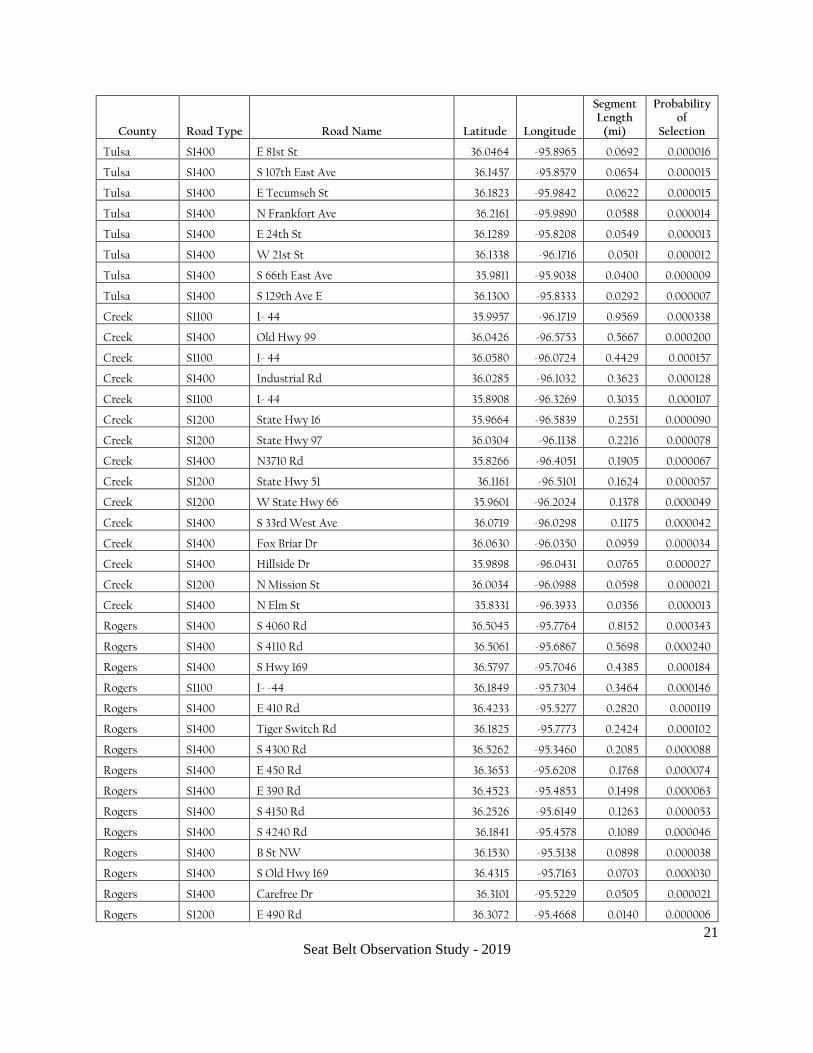
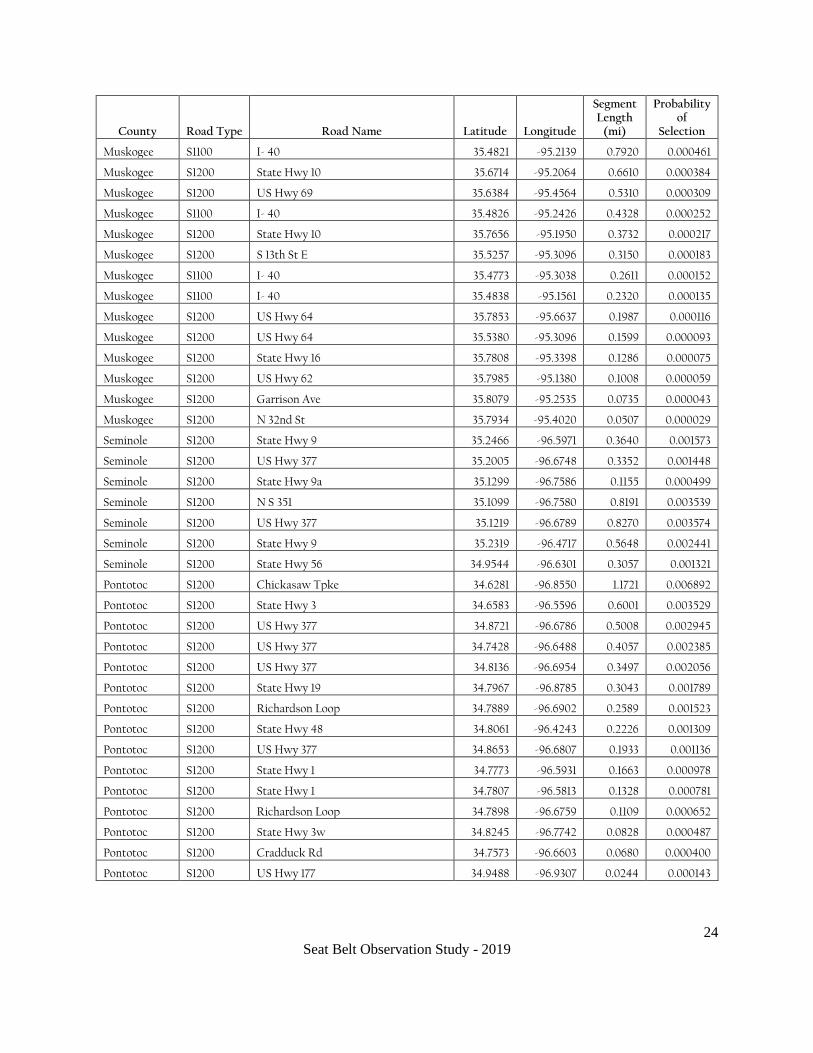
Appendix A presents the selected road segments within each county and their probabilities of selection.
Reserve Sample
In the event that an original road segment is permanently unavailable, a reserve road segment will be used. The reserve road segment sample consists of two additional road segments per original road segment selected, resulting in a reserve sample of 598 road segments. These approrporiate reserve segments were identified and selected as the road segments immediately preceding and immediately following the original road segment actually selected, and thus are implicitly stratified by segment length to correspond to the original road segment actually selected. With this in mind, for the purposes of data weighting, the reserve road segment inherits all probabilities of selection and weighting components up to and including the road segment stage of selection from the original road segment actually selected. Probabilites and weights for any subsequent stages of selection (e.g., the sampling of vehicles) will be determined by the reserve road segment itself.

8
Seat Belt Observation Study - 2019
Observation and Data Collection Procedures
Site Selection Road segments were mapped according to the latitude and longitude of their midpoints. The selected road segment was identified by an intersection or interchange that occurred within or just beyond the segment. If there was no intersection or interchange within the segment, then any point on that road could be used for observation. Data collection sites were selected so that traffic would be moving during the observation period, therefore, sites were assigned to locations within the segment that were approximately 50 yards from any controlled intersections. For interstate highways, data collection will occur on a ramp carrying traffic that is exiting the highway. The observed direction of travel was randomly selected for each road segment. The locations of the data collection sites were described on Site Assignment Sheets for each county and maps were developed to aid the Data Collectors and Quality Control (QC) Monitors in traveling to the assigned locations. Training Oklahoma recruited and hired Data Collectors for the survey. Oklahoma also utilized a QC Monitor to monitor and review the Data Collectors. The criteria used in selecting observers and QC Monitors required that each hold a valid driver’s license, and be able to maintain the assigned schedule and research protocol for the observations. Each observer was trained on the types of vehicles to count, how to record the belted/not belted occupants, and other information necessary to complete their assignment. They also were provided an observer manual with specific instructions regarding the process for collecting data as well as a troubleshooting guide. The training session provided the observers with information on: (1) identifying eligible vehicles; (2) counting procedures for limited access roads; and, (3) completing the observation record sheet. The training session also included explicit directions on counting an improperly used shoulder belt as "not using" and determining the number of lanes to be observed when volume traffic was high. During the survey period, on-site audits were conducted to ensure compliance and quality data collection by all observers. Data Collector and QC Monitor training was conducted at the University of Central Oklahoma (UCO) in May 2019. Training included classroom lecture and field exercises. At the conclusion of the training, the Data Collectors and the QC Monitor were given a quiz to ensure that they understood the survey terminology, the data collection protocols, and reporting requirements.

9
Seat Belt Observation Study - 2019
QC Monitor training focused on their specific duties. These included conducting site visits to various Data Collectors at a minimum of 15 sites (or 5% of all sites) and reviewing the field protocol during the visit. The QC Monitor was also available during the survey to respond to questions and offer assistance to Data Collectors as needed. Observation Periods and Quality Control All seat belt and booster seat use observations were conducted during weekdays and weekends between 7:00 a.m. and 8:00 p.m. The schedule included rush hour (before 9:30 AM and after 3:30 PM) and non-rush hour observations. Data collection was conducted for 60 minutes at each site. Start times were staggered to ensure that a representative number of weekday/weekend/ rush hour/non-rush hour sites were included. Maps showing the location of all observation sites and Site Assignment Sheets were provided to the Data Collectors and QC Monitor. These indicated the observed road name and the crossroad included within the road segment (or nearest crossroad). Sites within relatively close geographic proximity were assigned as data collection clusters. Data Collection All passenger vehicles, including vehicles weighing less than 10,000 pounds, were eligible for observation. A cover sheet was designed to allow for documentation of descriptive site information, including: date, site location, site number, alternate site data, assigned traffic flow, number of lanes available and observed, start and end times for observations, and weather conditions. This cover sheet was completed by the Data Collector at each site. The observation form was used to record seat belt use by drivers and front seat passengers. Additional observation forms were used when more than 40 vehicles were observed at a site. The forms were labeled as 1 of 2, and 2 of 2, etc. The data collector observed as many lanes of traffic as he/she could comfortably monitor. Only one direction of traffic was observed at any given site. Observations were made of all drivers and right front seat occupants including children. The right front seat occupants excluded from this study were child passengers who were traveling in child seats with harness straps. The codes in Table 3 were used to record seat belt use.

10
Seat Belt Observation Study - 2019
Table 3 - Seat Belt Use Codes and Definitions
Code Meaning Definition
Y Yes, belted The shoulder belt is in front of the person’s shoulder.
N No, unbelted The shoulder belt is not in front of the person’s shoulder.
U Unknown It cannot reasonably be determined whether the driver or right front passenger is belted.
NP No passenger There is no right front passenger present.
According to the codes above, both a vacancy for the right front passenger or a child, restrained in a car seat with harnesses would be coded as NP since we do not observe harnessed children in this study. Alternate Sites and Rescheduling When a site is temporarily unavailable due to a crash, road construction, or inclement weather, data collection would be rescheduled for a similar time of day and type of week day. In the event that the site is permanently unworkable (such as being located within a gated community), then an alternate site, selected as part of the reserve sample, would be used as a permanent replacement. The two alternates for each site would be clearly identified and listed on the Site Assignment Sheet. Data Collectors would pick one of the reserve sites at random. If the selected reserve was also permanently unworkable, then the Data Collector would use the other reserve site. Quality Control Procedures The QC Monitor made visits to at least 5% of the data collection sites. During these visits, the QC Monitor first evaluated the Data Collector’s performance from a distance (if possible), and then worked alongside the Data Collector. The QC Monitor ensured that the Data Collector was following all survey protocol including: completing the cover sheet and observation forms, and making accurate observations of seat belt use. The QC Monitor prepared a site visit report highlighting any problems with data collection site locations and Data Collector performance. In the event it was discovered that a Data Collector had falsified data, the Data Collector would be replaced by a back-up Data Collector. The back-up Data Collector would revisit all sites proven to be or suspected to be falsified and recollect all data.
11
Seat Belt Observation Study - 2019
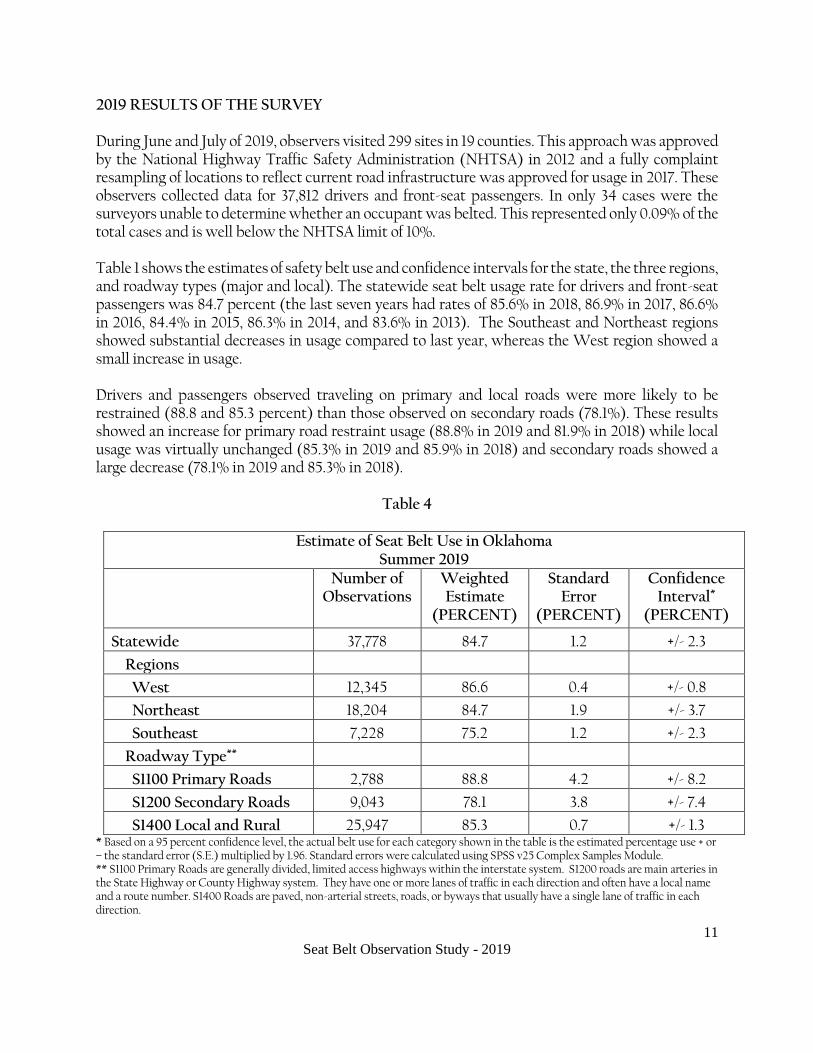
2019 RESULTS OF THE SURVEY During June and July of 2019, observers visited 299 sites in 19 counties. This approach was approved by the National Highway Traffic Safety Administration (NHTSA) in 2012 and a fully complaint resampling of locations to reflect current road infrastructure was approved for usage in 2017. These observers collected data for 37,812 drivers and front-seat passengers. In only 34 cases were the surveyors unable to determine whether an occupant was belted. This represented only 0.09% of the total cases and is well below the NHTSA limit of 10%. Table 1 shows the estimates of safety belt use and confidence intervals for the state, the three regions, and roadway types (major and local). The statewide seat belt usage rate for drivers and front-seat passengers was 84.7 percent (the last seven years had rates of 85.6% in 2018, 86.9% in 2017, 86.6% in 2016, 84.4% in 2015, 86.3% in 2014, and 83.6% in 2013). The Southeast and Northeast regions showed substantial decreases in usage compared to last year, whereas the West region showed a small increase in usage. Drivers and passengers observed traveling on primary and local roads were more likely to be restrained (88.8 and 85.3 percent) than those observed on secondary roads (78.1%). These results showed an increase for primary road restraint usage (88.8% in 2019 and 81.9% in 2018) while local usage was virtually unchanged (85.3% in 2019 and 85.9% in 2018) and secondary roads showed a large decrease (78.1% in 2019 and 85.3% in 2018).
Table 4
Estimate of Seat Belt Use in Oklahoma Summer 2019
Number of Observations
Weighted Estimate
(PERCENT)
Standard Error
(PERCENT)
Confidence Interval*
(PERCENT)
Statewide 37,778 84.7 1.2 +/- 2.3
Regions
West 12,345 86.6 0.4 +/- 0.8
Northeast 18,204 84.7 1.9 +/- 3.7
Southeast 7,228 75.2 1.2 +/- 2.3
Roadway Type**
S1100 Primary Roads 2,788 88.8 4.2 +/- 8.2
S1200 Secondary Roads 9,043 78.1 3.8 +/- 7.4
S1400 Local and Rural 25,947 85.3 0.7 +/- 1.3 * Based on a 95 percent confidence level, the actual belt use for each category shown in the table is the estimated percentage use + or – the standard error (S.E.) multiplied by 1.96. Standard errors were calculated using SPSS v25 Complex Samples Module. ** S1100 Primary Roads are generally divided, limited access highways within the interstate system. S1200 roads are main arteries in the State Highway or County Highway system. They have one or more lanes of traffic in each direction and often have a local name and a route number. S1400 Roads are paved, non-arterial streets, roads, or byways that usually have a single lane of traffic in each direction.

12
Seat Belt Observation Study - 2019
Although the breakdown by region is useful for targeting problem areas for seat belt use, an examination of the differences among sampled counties within the regions provides further insights (Table 5). Since the variation among counties within a region can be substantial, a comparison of county data provides more specific information that can be used for targeted media campaigns and enhanced enforcement in areas where seat belt usage is lowest. The five sampled counties with the lowest seat belt compliance rate for 2019 include: 2019
Sequoyah County 68.6%
Seminole County 69.6%
Wagoner County 69.9%
Osage County 70.2%
Caddo County 72.6% On the other hand, the five sampled counties with the highest seat belt usage rates for 2019 include: 2019
Rogers County 93.6%
Creek County 90.0%
Cleveland County 88.8%
Logan County 87.5%
Canadian County 86.7%
Table 5 Estimate of Seat Belt Use in Oklahoma by County: Summer 2019
Percent
Weighted Combined
Regions
West 86.6
Cleveland 88.8
Logan 87.5
Canadian 86.7
Oklahoma 86.3
Garfield 84.7
Comanche 80.7
Caddo 72.6
Northeast 84.7

13
Seat Belt Observation Study - 2019
Table 5 Estimate of Seat Belt Use in Oklahoma by County: Summer 2019
Percent
Rogers 93.6
Creek 90.0
Payne 85.8
Tulsa 85.7
Lincoln 83.2
Osage 70.2
Wagoner 69.9
Southeast 75.2
Pottawatomie 80.5
Muskogee 76.0
Pontotoc 73.4
Seminole 69.6
Sequoyah 68.6
In addition to examining restraint usage on a regional basis, the Oklahoma survey also examines usage rates by occupant type and vehicle type. The results of these analyses are provided in Table 6.
Table 6. Seat Belt Use by Occupant and Vehicle Type in Oklahoma Summer 2019
Number of Observations
Weighted Estimate
(PERCENT)
Standard Error
(PERCENT)
Confidence Interval*
(PERCENT)
Statewide 37,778 84.7 1.2 +/- 2.3
Occupant Type
Driver 30,670 84.6 1.1 +/- 2.2
Front Seat Passenger 7,108 85.2 1.8 +/- 3.5
Vehicle Type
Car/SUV 26,766 87.0 1.0 +/- 1.9
Pickup Truck 11,012 76.8 1.7 +/- 3.4

14
Seat Belt Observation Study - 2019
Table 6 shows that there is a small gap between drivers and their passengers (84.6% versus 85.2%). The direction of this gap is consistent with other recent Oklahoma surveys, but the difference is not statistically meaningful in 2019. More importantly, however, Table 6 also reveals a large gap between drivers of pickup trucks and other vehicles. In fact, drivers of passenger cars and SUVs were significantly more likely to be restrained (87.0%) than were the occupants of pickup trucks (76.8%). The size of this gap increased from last year and was larger than the historical gap. Comparisons to Previous Surveys Comparing overall usage rates in 2019 to previous years does provide useful comparisons. The overall usage rate in 2019 was 84.7%, which was a decrease from 2018 (85.6%). The 2019 usage rate was close to the historical average and the decrease from 2018 was largely due to the decrease in pickup truck restraint usage. SUMMARY AND RECOMMENDATIONS The results of the summer 2019 survey can be summarized as follows: • The summer 2019 survey results reveals that statewide safety belt use was 84.7%. This was
down from last year (85.6%), but generally in line with other recent surveys (86.9 in 2017; 86.6% in 2016, 84.4% in 2015, 86.3% in 2014, and 83.6% in 2013).
• In 2019, only one county was above 90%. In 2018, four counties had usage rates over 90%.
In 2017, three counties had rates over 90%.
• Caddo County was among the lowest usage counties for the third consecutive year.
• In 2019, drivers were analyzed separately from passengers. Consistent with recent results, drivers (84.6%) were less likely to be restrained than were their passengers (85.2%). This same general pattern has held for the last four years.
• Like recent surveys, the 2019 survey separately examined pickup trucks for their usage rates. Consistent with national data and other Oklahoma data, pickup trucks showed a significantly lower rate of usage (76.8% in 2019; 79.8% in 2018, 81.3% in 2017, 79.0% in 2016, 78.2% in 2015, and 79.4% in 2014) than other vehicle types (87.0% in 2019; 87.3% in 2018, 88.7% in 2017, 89.0% in 2016, 86.8% in 2015, and 88.6% in 2014).
Two factors that have been demonstrated to play key roles in determining a state’s use rate are: 1) the nature of the state’s seat belt law, and 2) media campaigns conducted to raise use. An analysis conducted for this study of the usage rates from 2010 finds that states with higher fines have higher usage rates (r = .49).The 2009 NHTSA survey found that those states with stronger belt enforcement laws (primary enforcement) continue to exhibit generally higher buckled rates than states with weaker laws (secondary enforcement) or no laws.

15
Seat Belt Observation Study - 2019
With respect to public education, the main theme of the national advertising campaign promoted by NHTSA has been Click It or Ticket. It conveys a message that it is illegal not to use safety belts, law enforcement officers are looking for nonuse, and offenders will be ticketed. The campaign is viewed as a success with safety belt use increases coincident with the advertising campaign.
A recent study assessing Click It or Ticket programs confirms that primary law states had substantially higher seat belt use and higher levels of enforcement than secondary states. They also noted that Click It or Ticket programs aimed at the general driving population and supplemented by more targeted programs directed at low use groups (e.g., occupants of pickups and rural residents) are key to increasing seat belt use. However, media programs without enforcement are not nearly as successful. Thus, enforcement is important. The more seat belt laws are enforced, the higher the seat belt use rate. In light of the data collected as part of the 2019 observation study, the following recommendations are presented:
• Continue to encourage law enforcement agencies to vigorously enforce the Oklahoma mandatory Seat Belt Use Act on a consistent basis;
• Collect county-level data on enforcement of the use of seat belts to document the relationship between enforcement efforts and safety restraint use;
• Continue to pursue a multimedia strategy for educating the public about the benefits of using seat belts and the consequences of non-compliance with the state seat belt law;
• Targeting specific counties and regions with low usage rates (i.e., low use counties) would likely have a positive impact on rates in those areas;
• Consider targeted initiatives to address the low usage rates among the occupants of pickup trucks. A reasonably large proportion of vehicle travel in Oklahoma takes place in pickup trucks and the usage rates of pickup truck occupants significantly lags other vehicle types. A rise in usage rates among pickup truck occupants would have positive impacts on the state’s overall usage rate.

16
Seat Belt Observation Study - 2019
REFERENCES Chen, Y. and Ye, T. 2010. Safety Belt Use in 2009 – Use Rates in the States and Territories (DOT HS 811 106).
Department of Transportation, National Highway Traffic Safety Administration, National Center for Statistics and Analysis. Washington, D.C. May.
Glassbrenner, D. 2004. Safety Belt Use in 2004 – Use Rates in the States and Territories (DOT HS 809 813).
Department of Transportation, National Highway Traffic Safety Administration, National Center for Statistics and Analysis. Washington, D.C. November.
Governors Highway Safety Association (2019). Seat Belt Laws June 2019. Retrieved from
https://www.ghsa.org/state-laws/issues/seatbelts. Hedlund, J., Gilbert, S., Ledingham, K., and Preusser, D. 2008. How States Achieve High Belt Use
Rates (DOT HS 810 962). Department of Transportation, National Highway Traffic Safety Administration. Washington, D.C.
James, T., Hall K., and Krimmer, M.. 2008. Seat Belt Observation Study. University of Oklahoma,
Institute for Public Affairs. Norman, OK. July. Pickrell, T and Ye, T. 2009. Safety Belt Use in 2008 – Demographic Characteristics (DOT HS 811 183).
Department of Transportation, National Highway Traffic Safety Administration, National Center for Statistics and Analysis. Washington, D.C. August .
Solomon, M.G., Chaudhary, N., and Cosgrove, L. 2003. Click It or Ticket Safety Belt Mobilization
Evaluation. Department of Transportation, National Highway Traffic Safety Administration, National Center for Statistics and Analysis. Washington, D.C. May.
Tison, J. and Williams, A. 2010. Analyzing the First Years of the Click It or Ticket Mobilizations. (DOT HS
811 232). Department of Transportation, National Highway Traffic Safety Administration. Washington, D.C. January.

17
Seat Belt Observation Study - 2019
APPENDIX A Seatbelt Observation Sites – June/July 2019
County Road Type Road Name Latitude Longitude
Segment Length
(mi)
Probability of
Selection
Oklahoma S1400 NE 63rd St 35.5366 -97.3813 0.8305 0.000151
Oklahoma S1400 NE Grand Blvd 35.5247 -97.4694 0.5072 0.000092
Oklahoma S1400 SE 89th St 35.3772 -97.5085 0.4187 0.000076
Oklahoma S1400 NE 93rd St 35.5657 -97.4281 0.3553 0.000065
Oklahoma S1400 SW 29th St 35.4352 -97.6158 0.3020 0.000055
Oklahoma S1400 Downing St 35.5639 -97.5469 0.2635 0.000048
Oklahoma S1400 N Macarthur Ave 35.6697 -97.6207 0.2480 0.000045
Oklahoma S1400 N Anderson Rd 35.5037 -97.3180 0.2283 0.000041
Oklahoma S1100 I- 40 35.4576 -97.4542 0.2090 0.000038
Oklahoma S1100 I- 35 35.4221 -97.4877 0.1925 0.000035
Oklahoma S1400 N Eastern Ave 35.5100 -97.4767 0.1790 0.000033
Oklahoma S1400 N Anderson Rd 35.6485 -97.3184 0.1652 0.000030
Oklahoma S1400 N Macarthur Blvd 35.6065 -97.6208 0.1534 0.000028
Oklahoma S1400 Wegner Way 35.5706 -97.6512 0.1409 0.000026
Oklahoma S1400 NE 122nd St 35.5943 -97.2086 0.1303 0.000024
Oklahoma S1400 S Holiday Ave 35.4289 -97.4347 0.1253 0.000023
Oklahoma S1400 NW 29th St 35.4995 -97.5488 0.1222 0.000022
Oklahoma S1400 NW 29th St 35.4995 -97.5378 0.1139 0.000021
Oklahoma S1400 NW Expwy Svc Rd 35.5294 -97.5737 0.1049 0.000019
Oklahoma S1400 NE 11th St 35.4801 -97.4870 0.0966 0.000018
Oklahoma S1400 SW 7th St 35.4580 -97.5154 0.0886 0.000016
Oklahoma S1400 Quail Creek Rd 35.5994 -97.5776 0.0814 0.000015
Oklahoma S1400 Briarcreek Dr 35.5704 -97.6307 0.0731 0.000013
Oklahoma S1400 NE 4th St 35.4715 -97.4782 0.0685 0.000012
Oklahoma S1400 N Western Ave 35.6304 -97.5317 0.0640 0.000012
Oklahoma S1400 NE 10th St 35.4786 -97.2673 0.0597 0.000011
Oklahoma S1400 Washington Blvd 35.4855 -97.4526 0.0547 0.000010
Oklahoma S1400 N Meridian Ave 35.4739 -97.6011 0.0479 0.000009
Oklahoma S1400 W Britton Rd 35.5656 -97.5339 0.0364 0.000007
Oklahoma S1400 SE 44th St 35.4208 -97.4516 0.0199 0.000004
Comanche S1100 I- 44 34.4891 -98.4105 1.5484 0.000507
Comanche S1400 Trail Rd 34.6013 -98.2647 0.9847 0.000322
Comanche S1400 Big Rock Rd 34.7363 -98.4832 0.7680 0.000251
Comanche S1400 E Gore Blvd 34.6085 -98.2594 0.6073 0.000199
Comanche S1200 US Hwy 277 34.7824 -98.3566 0.5019 0.000164

18
Seat Belt Observation Study - 2019
County Road Type Road Name Latitude Longitude
Segment Length
(mi)
Probability of
Selection
Comanche S1400 Watts Rd 34.8117 -98.1913 0.4304 0.000141
Comanche S1400 Deyo Mission Rd 34.6354 -98.5452 0.3502 0.000115
Comanche S1200 State Hwy 65 34.6975 -98.1951 0.2789 0.000091
Comanche S1400 NW Elm Ave 34.6203 -98.4067 0.2309 0.000076
Comanche S1200 US Hwy 62 34.7837 -98.3872 0.1854 0.000061
Comanche S1200 US Hwy 62 34.7938 -98.3875 0.1461 0.000048
Comanche S1400 NW Allan-A-Dale Ln 34.6331 -98.4619 0.1116 0.000037
Comanche S1400 SW Dr Charles W Whitlow Ave 34.5904 -98.4162 0.0877 0.000029
Comanche S1400 NW 64th St 34.6210 -98.4712 0.0666 0.000022
Comanche S1400 Cole Rd 34.8231 -98.2476 0.0403 0.000013
Garfield S1400 S 66th St 36.3398 -97.7831 1.0003 0.000361
Garfield S1400 Breckenridge Rd 36.4340 -97.7920 0.9904 0.000358
Garfield S1200 State Hwy 164 36.2836 -97.4922 0.8576 0.000310
Garfield S1200 State Hwy 74 36.2371 -97.5859 0.7128 0.000257
Garfield S1200 State Hwy 164 36.2822 -97.5270 0.6122 0.000221
Garfield S1200 US Hwy 81 36.2495 -97.8901 0.5067 0.000183
Garfield S1200 E0425 Rd / SR 412 36.3977 -97.7607 0.4822 0.000174
Garfield S1200 E0425 Rd / SR 412 36.3977 -97.5182 0.4089 0.000148
Garfield S1200 State Hwy 132 36.3642 -98.0330 0.3369 0.000122
Garfield S1400 N Independence Ave 36.4175 -97.8801 0.2655 0.000096
Garfield S1200 N 4th St 36.4309 -97.8728 0.2075 0.000075
Garfield S1200 E0425 Rd 36.3977 -97.5940 0.1469 0.000053
Garfield S1400 N Burdel Ln 36.3973 -97.9236 0.0998 0.000036
Garfield S1400 W Park Ave 36.3920 -97.8834 0.0686 0.000025
Garfield S1400 N Independence Ave 36.4197 -97.8801 0.0355 0.000013
Canadian S1100 I- 40 35.5007 -97.9104 1.0023 0.000381
Canadian S1400 N John Kilpatrick Tpke 35.5415 -97.6908 0.8026 0.000305
Canadian S1400 W Hefner Rd 35.5803 -97.6834 0.6156 0.000234
Canadian S1200 State Hwy 3 35.6484 -97.848 0.5022 0.000191
Canadian S1200 State Hwy 3 35.6884 -97.9447 0.4421 0.000168
Canadian S1200 State Hwy 152 35.3918 -97.9122 0.3712 0.000141
Canadian S1200 N Piedmont Rd 35.5178 -97.7425 0.3085 0.000117
Canadian S1100 I- 40 35.4603 -97.6868 0.2563 0.000097
Canadian S1400 SW 89th St 35.3772 -97.6871 0.2169 0.000082
Canadian S1400 SW 15th St 35.4497 -97.7085 0.1770 0.000067
Canadian S1400 Left Hand Ave 35.6137 -97.9925 0.1433 0.000055
Canadian S1200 S Mustang Rd 35.4476 -97.7246 0.1150 0.000044
Canadian S1200 W Main St 35.5079 -97.7562 0.0883 0.000034

19
Seat Belt Observation Study - 2019
County Road Type Road Name Latitude Longitude
Segment Length
(mi)
Probability of
Selection
Canadian S1200 State Hwy 66 35.5080 -97.8696 0.0630 0.000024
Canadian S1400 Lewis Ave 35.6013 -98.1164 0.0384 0.000015
Cleveland S1400 E Franklin Rd 35.2762 -97.4106 0.5154 0.000201
Cleveland S1200 Sooner Rd 35.3447 -97.4264 0.3703 0.000144
Cleveland S1400 Mimosa Dr 35.2371 -97.4474 0.2900 0.000113
Cleveland S1400 York Dr 35.2909 -97.4865 0.2413 0.000094
Cleveland S1400 Finch St 35.2380 -97.4348 0.2041 0.000079
Cleveland S1400 Merchant Dr 35.2244 -97.4796 0.1772 0.000069
Cleveland S1400 SW 89th St 35.3772 -97.5226 0.1532 0.000060
Cleveland S1400 E Robinson St 35.2328 -97.4311 0.1324 0.000052
Cleveland S1400 96th St 35.0905 -97.3004 0.1167 0.000045
Cleveland S1400 Ed Noble Pkwy 35.2136 -97.4854 0.0998 0.000039
Cleveland S1400 Grand View Ave 35.2448 -97.5031 0.0858 0.000033
Cleveland S1400 Greenbriar Chase St 35.3611 -97.5498 0.0700 0.000027
Cleveland S1400 NW 2nd St 35.3397 -97.5091 0.0571 0.000022
Cleveland S1400 S Broadway St 35.3101 -97.4733 0.0454 0.000018
Cleveland S1400 12th Ave NW 35.2867 -97.4591 0.0247 0.000010
Logan S1400 S May Ave 35.8642 -97.5672 1.0104 0.000487
Logan S1200 S Portland Ave 35.8488 -97.5851 0.8942 0.000431
Logan S1200 US Hwy 77 36.0927 -97.3955 0.6850 0.000330
Logan S1200 S Portland Ave 35.7587 -97.5849 0.5277 0.000254
Logan S1200 State Hwy 33 35.8472 -97.6536 0.4716 0.000227
Logan S1400 Thompson Trial 35.7372 -97.4555 0.3968 0.000191
Logan S1200 State Hwy 33 35.8933 -97.3615 0.3363 0.000162
Logan S1200 State Hwy 51 36.1162 -97.6510 0.2819 0.000136
Logan S1200 University Ave 35.8700 -97.3132 0.2413 0.000116
Logan S1200 N Portland Ave 36.0341 -97.5863 0.1981 0.000096
Logan S1400 Coltrane Rd 35.8097 -97.4431 0.1614 0.000078
Logan S1400 S Eastern Rd 35.8573 -97.4783 0.1280 0.000062
Logan S1400 N Mid Iron Way 35.7282 -97.5026 0.0978 0.000047
Logan S1400 S Drexel St 35.8744 -97.4124 0.0720 0.000035
Logan S1400 NE 248th St 35.7253 -97.4312 0.0497 0.000024
Caddo S1200 State Hwy 146 35.1824 -98.4249 0.9987 0.003453
Caddo S1200 US Hwy 281 35.1510 -98.2497 0.6579 0.002275
Caddo S1200 State Hwy 58 35.2907 -98.5800 0.4817 0.001666
Caddo S1200 US Hwy 62 34.8697 -98.3794 0.3447 0.001192
Caddo S1200 State Hwy 58 35.4000 -98.5707 0.2389 0.000826
Caddo S1200 Hwy 9 35.0479 -98.3468 0.1453 0.000502
20
Seat Belt Observation Study - 2019
County Road Type Road Name Latitude Longitude
Segment Length
(mi)
Probability of
Selection
Caddo S1200 US Hwy 277 34.9314 -98.1328 0.0666 0.000230
Osage S1200 State Hwy 99 36.3459 -96.4276 1.4315 0.000289
Osage S1200 State Hwy 20 36.4144 -96.4482 0.9982 0.000202
Osage S1400 New Prue Rd 36.2601 -96.2383 0.7820 0.000158
Osage S1200 State Hwy 20 36.4105 -96.4344 0.6431 0.000130
Osage S1200 State Hwy 20 36.4859 -96.6518 0.5313 0.000107
Osage S1200 State Hwy 11 36.5933 -96.2227 0.4555 0.000092
Osage S1400 N Hwy 97 36.1704 -96.1106 0.3891 0.000079
Osage S1200 US Hwy 60 36.6807 -96.5972 0.3280 0.000066
Osage S1200 State Hwy 20 36.3717 -96.2432 0.2775 0.000056
Osage S1400 S Lenapah Ave 36.3630 -96.0313 0.2309 0.000047
Osage S1400 D3795 Rd 36.3768 -96.2368 0.1898 0.000038
Osage S1400 New Prue Rd 36.2000 -96.2122 0.1507 0.000030
Osage S1400 N 33rd West Ave 36.1736 -96.0286 0.1131 0.000023
Osage S1400 D3740 Rd 36.6771 -96.3368 0.0782 0.000016
Osage S1200 W Rogers Blvd 36.3686 -96.0533 0.0410 0.000008
Tulsa S1400 N 141st E Ave 36.1994 -95.8204 1.0714 0.000253
Tulsa S1200 E 46th St N 36.2204 -95.8399 0.7490 0.000177
Tulsa S1400 Southwest Blvd 36.1225 -96.0071 0.5207 0.000123
Tulsa S1400 N Garnett Rd 36.1991 -95.8511 0.4424 0.000104
Tulsa S1200 Cherokee Expy 36.2477 -95.9347 0.3635 0.000086
Tulsa S1400 W 59th St 36.0774 -96.0337 0.2950 0.000070
Tulsa S1400 S Peach Ave 35.9825 -95.8087 0.2548 0.000060
Tulsa S1200 Broken Arrow Expy 36.0627 -95.7736 0.2392 0.000056
Tulsa S1400 W 18th Pl 36.1379 -96.1614 0.2148 0.000051
Tulsa S1400 S Victor Ave 36.0521 -95.9652 0.1950 0.000046
Tulsa S1400 W 41st St 36.1048 -96.2725 0.1795 0.000042
Tulsa S1400 Union Ave 35.9139 -96.0117 0.1639 0.000039
Tulsa S1400 E 61st St 36.0754 -95.8525 0.1499 0.000035
Tulsa S1400 W Atlanta St 36.0297 -95.8314 0.1363 0.000032
Tulsa S1400 S 33rd E Ave 36.1396 -95.9404 0.1271 0.000030
Tulsa S1400 S 72nd East Ave 36.0763 -95.8959 0.1235 0.000029
Tulsa S1400 E Admiral Blvd 36.1597 -95.9726 0.1176 0.000028
Tulsa S1400 E 81st St 36.0464 -95.8580 0.1075 0.000025
Tulsa S1400 E 17th St 36.1371 -95.8769 0.0979 0.000023
Tulsa S1400 S Kalanchoe Ave 35.9714 -95.8290 0.0894 0.000021
Tulsa S1400 E 29th St 36.1225 -95.9750 0.0817 0.000019
Tulsa S1400 E 31st St 36.1188 -95.9230 0.0741 0.000017
21
Seat Belt Observation Study - 2019
County Road Type Road Name Latitude Longitude
Segment Length
(mi)
Probability of
Selection
Tulsa S1400 E 81st St 36.0464 -95.8965 0.0692 0.000016
Tulsa S1400 S 107th East Ave 36.1457 -95.8579 0.0654 0.000015
Tulsa S1400 E Tecumseh St 36.1823 -95.9842 0.0622 0.000015
Tulsa S1400 N Frankfort Ave 36.2161 -95.9890 0.0588 0.000014
Tulsa S1400 E 24th St 36.1289 -95.8208 0.0549 0.000013
Tulsa S1400 W 21st St 36.1338 -96.1716 0.0501 0.000012
Tulsa S1400 S 66th East Ave 35.9811 -95.9038 0.0400 0.000009
Tulsa S1400 S 129th Ave E 36.1300 -95.8333 0.0292 0.000007
Creek S1100 I- 44 35.9957 -96.1719 0.9569 0.000338
Creek S1400 Old Hwy 99 36.0426 -96.5753 0.5667 0.000200
Creek S1100 I- 44 36.0580 -96.0724 0.4429 0.000157
Creek S1400 Industrial Rd 36.0285 -96.1032 0.3623 0.000128
Creek S1100 I- 44 35.8908 -96.3269 0.3035 0.000107
Creek S1200 State Hwy 16 35.9664 -96.5839 0.2551 0.000090
Creek S1200 State Hwy 97 36.0304 -96.1138 0.2216 0.000078
Creek S1400 N3710 Rd 35.8266 -96.4051 0.1905 0.000067
Creek S1200 State Hwy 51 36.1161 -96.5101 0.1624 0.000057
Creek S1200 W State Hwy 66 35.9601 -96.2024 0.1378 0.000049
Creek S1400 S 33rd West Ave 36.0719 -96.0298 0.1175 0.000042
Creek S1400 Fox Briar Dr 36.0630 -96.0350 0.0959 0.000034
Creek S1400 Hillside Dr 35.9898 -96.0431 0.0765 0.000027
Creek S1200 N Mission St 36.0034 -96.0988 0.0598 0.000021
Creek S1400 N Elm St 35.8331 -96.3933 0.0356 0.000013
Rogers S1400 S 4060 Rd 36.5045 -95.7764 0.8152 0.000343
Rogers S1400 S 4110 Rd 36.5061 -95.6867 0.5698 0.000240
Rogers S1400 S Hwy 169 36.5797 -95.7046 0.4385 0.000184
Rogers S1100 I- -44 36.1849 -95.7304 0.3464 0.000146
Rogers S1400 E 410 Rd 36.4233 -95.5277 0.2820 0.000119
Rogers S1400 Tiger Switch Rd 36.1825 -95.7773 0.2424 0.000102
Rogers S1400 S 4300 Rd 36.5262 -95.3460 0.2085 0.000088
Rogers S1400 E 450 Rd 36.3653 -95.6208 0.1768 0.000074
Rogers S1400 E 390 Rd 36.4523 -95.4853 0.1498 0.000063
Rogers S1400 S 4150 Rd 36.2526 -95.6149 0.1263 0.000053
Rogers S1400 S 4240 Rd 36.1841 -95.4578 0.1089 0.000046
Rogers S1400 B St NW 36.1530 -95.5138 0.0898 0.000038
Rogers S1400 S Old Hwy 169 36.4315 -95.7163 0.0703 0.000030
Rogers S1400 Carefree Dr 36.3101 -95.5229 0.0505 0.000021
Rogers S1200 E 490 Rd 36.3072 -95.4668 0.0140 0.000006

22
Seat Belt Observation Study - 2019
County Road Type Road Name Latitude Longitude
Segment Length
(mi)
Probability of
Selection
Wagoner S1200 S US Hwy 69 35.8783 -95.4025 0.9806 0.000549
Wagoner S1200 Creek Tpke 36.0848 -95.7215 0.6613 0.000370
Wagoner S1200 US Hwy 69 36.0135 -95.3688 0.5035 0.000282
Wagoner S1400 W 90th St N 35.8720 -95.3964 0.4040 0.000226
Wagoner S1400 Oak Grove Rd 36.1357 -95.6725 0.3254 0.000182
Wagoner S1400 S 255th East Ave 36.0638 -95.6934 0.2627 0.000147
Wagoner S1400 Oak Grove Rd 36.1461 -95.6726 0.2256 0.000126
Wagoner S1200 Creek Tpke 36.0818 -95.7277 0.1867 0.000105
Wagoner S1400 N Division St 35.9580 -95.6546 0.1534 0.000086
Wagoner S1400 N 35th St E 35.8813 -95.3229 0.1271 0.000071
Wagoner S1400 State Hwy 16 35.8599 -95.3413 0.1050 0.000059
Wagoner S1400 E 710 Rd 35.9881 -95.4067 0.0838 0.000047
Wagoner S1400 Dixieland Ave 35.8669 -95.5193 0.0694 0.000039
Wagoner S1200 S Hwy 51 35.9754 -95.6626 0.0528 0.000030
Wagoner S1400 E 690 Rd 36.0172 -95.3289 0.0250 0.000014
Lincoln S1100 I- 44 35.6938 -97.0019 0.7689 0.002792
Lincoln S1200 US Hwy 62 35.4980 -96.7581 0.5768 0.002095
Lincoln S1200 US Hwy 177 35.7569 -97.0178 0.4718 0.001713
Lincoln S1200 N 3320 Rd 35.6325 -97.0882 0.4017 0.001459
Lincoln S1200 State Hwy 18 35.5168 -96.8943 0.3402 0.001235
Lincoln S1100 I- 44 35.7528 -96.6831 0.2831 0.001028
Lincoln S1200 State Hwy 66 35.7098 -96.8321 0.2504 0.00091
Lincoln S1200 US Hwy 62 35.4925 -97.1224 0.2183 0.000793
Lincoln S1200 US Hwy 377 35.5818 -96.6625 0.1904 0.000692
Lincoln S1200 State Hwy 18 35.6361 -96.8864 0.1632 0.000593
Lincoln S1200 State Hwy 18 35.8604 -96.8765 0.1380 0.000501
Lincoln S1100 I- 44 35.7679 -96.6261 0.1131 0.000411
Lincoln S1200 State Hwy 102 35.6167 -97.0882 0.0878 0.000319
Lincoln S1200 State Hwy 99 35.8036 -96.6631 0.0671 0.000244
Lincoln S1200 State Hwy 18 35.5129 -96.8944 0.0354 0.000129
Payne S1200 Cimarron Tpke 36.2210 -97.0060 1.1034 0.004007
Payne S1200 E 6th Ave 36.1161 -96.7244 0.8356 0.003035
Payne S1200 N3330 Rd 36.2223 -97.0699 0.6795 0.002468
Payne S1200 W Moses St 35.9822 -96.7901 0.5154 0.001872
Payne S1200 W 6th Ave 36.1023 -97.2343 0.4594 0.001668
Payne S1200 Cimarron Tpke 36.2253 -96.9939 0.3839 0.001394
Payne S1200 N Little Ave 36.0414 -96.7673 0.3209 0.001165
Payne S1200 Cimarron Tpke 36.2320 -96.9143 0.2643 0.000960

23
Seat Belt Observation Study - 2019
County Road Type Road Name Latitude Longitude
Segment Length
(mi)
Probability of
Selection
Payne S1200 S Ripley Rd 36.0833 -96.9086 0.2165 0.000786
Payne S1200 Perkins Rd 36.1212 -97.0514 0.1760 0.000639
Payne S1200 N3340 Rd 36.1004 -97.0514 0.1520 0.000552
Payne S1200 Perkins Rd 36.1024 -97.0514 0.1235 0.000448
Payne S1200 S Ripley Rd 36.1088 -96.9081 0.0894 0.000325
Payne S1200 Agra Rd 35.9650 -96.8735 0.0638 0.000232
Payne S1200 W 6th Ave 36.1157 -97.0623 0.0355 0.000129
Pottawatomie S1400 No 2 Dam Rd 35.3566 -97.0677 0.7854 0.000348
Pottawatomie S1200 Drummond Rd 35.0767 -97.0364 0.5529 0.000245
Pottawatomie S1200 State Hwy 99A 35.3331 -96.7808 0.4557 0.000202
Pottawatomie S1200 State Hwy 59 35.1262 -96.7980 0.3705 0.000164
Pottawatomie S1400 Birdie Ln 35.3736 -96.9800 0.3051 0.000135
Pottawatomie S1400 N3485 Rd 35.2733 -96.7983 0.2576 0.000114
Pottawatomie S1400 Ew Co Rd 111 35.4056 -96.8220 0.2261 0.000100
Pottawatomie S1200 US Hwy 177 35.0923 -96.9316 0.1905 0.000084
Pottawatomie S1400 N Leo St 35.3413 -96.9476 0.1621 0.000072
Pottawatomie S1400 E 1300 Rd 35.1303 -96.8005 0.1344 0.000060
Pottawatomie S1400 W Macarthur St 35.3617 -96.9319 0.1131 0.000050
Pottawatomie S1400 SE 89th St 35.3768 -97.1151 0.0919 0.000041
Pottawatomie S1400 W Wall St 35.3485 -96.9267 0.0721 0.000032
Pottawatomie S1400 E123 Rd 35.2319 -96.9068 0.0554 0.000025
Pottawatomie S1400 N3450 Rd 35.3015 -96.8600 0.0263 0.000012
Sequoyah S1100 I- 40 35.3936 -94.6301 0.8403 0.000489
Sequoyah S1400 Evening Shade Rd 35.5433 -94.9488 0.5656 0.000329
Sequoyah S1400 Dwight Mission Rd 35.4378 -94.8851 0.4396 0.000256
Sequoyah S1200 State Hwy 101 35.5071 -94.6941 0.3589 0.000209
Sequoyah S1400 Lakeview Rd 35.5748 -94.8239 0.2995 0.000174
Sequoyah S1400 Swon Rd 35.4377 -94.5312 0.2520 0.000147
Sequoyah S1100 I- 40 35.4543 -94.8872 0.2147 0.000125
Sequoyah S1200 Ray Fine Blvd 35.4052 -94.5189 0.1829 0.000106
Sequoyah S1400 E 1070 Rd 35.4635 -94.7243 0.1513 0.000088
Sequoyah S1200 N Wheeler Ave 35.5690 -94.7164 0.1267 0.000074
Sequoyah S1400 S 4760 Rd 35.4142 -94.5489 0.1057 0.000061
Sequoyah S1400 E 1070 Rd 35.4639 -94.9881 0.0848 0.000049
Sequoyah S1400 N Washington St 35.4639 -94.8002 0.0669 0.000039
Sequoyah S1200 E Shawntel Smith Blvd 35.4038 -94.5880 0.0475 0.000028
Sequoyah S1400 Ridge Rd 35.6096 -95.0209 0.0138 0.000008
Muskogee S1200 State Hwy 71 35.3022 -95.3206 1.5056 0.000876
24
Seat Belt Observation Study - 2019
County Road Type Road Name Latitude Longitude
Segment Length
(mi)
Probability of
Selection
Muskogee S1100 I- 40 35.4821 -95.2139 0.7920 0.000461
Muskogee S1200 State Hwy 10 35.6714 -95.2064 0.6610 0.000384
Muskogee S1200 US Hwy 69 35.6384 -95.4564 0.5310 0.000309
Muskogee S1100 I- 40 35.4826 -95.2426 0.4328 0.000252
Muskogee S1200 State Hwy 10 35.7656 -95.1950 0.3732 0.000217
Muskogee S1200 S 13th St E 35.5257 -95.3096 0.3150 0.000183
Muskogee S1100 I- 40 35.4773 -95.3038 0.2611 0.000152
Muskogee S1100 I- 40 35.4838 -95.1561 0.2320 0.000135
Muskogee S1200 US Hwy 64 35.7853 -95.6637 0.1987 0.000116
Muskogee S1200 US Hwy 64 35.5380 -95.3096 0.1599 0.000093
Muskogee S1200 State Hwy 16 35.7808 -95.3398 0.1286 0.000075
Muskogee S1200 US Hwy 62 35.7985 -95.1380 0.1008 0.000059
Muskogee S1200 Garrison Ave 35.8079 -95.2535 0.0735 0.000043
Muskogee S1200 N 32nd St 35.7934 -95.4020 0.0507 0.000029
Seminole S1200 State Hwy 9 35.2466 -96.5971 0.3640 0.001573
Seminole S1200 US Hwy 377 35.2005 -96.6748 0.3352 0.001448
Seminole S1200 State Hwy 9a 35.1299 -96.7586 0.1155 0.000499
Seminole S1200 N S 351 35.1099 -96.7580 0.8191 0.003539
Seminole S1200 US Hwy 377 35.1219 -96.6789 0.8270 0.003574
Seminole S1200 State Hwy 9 35.2319 -96.4717 0.5648 0.002441
Seminole S1200 State Hwy 56 34.9544 -96.6301 0.3057 0.001321
Pontotoc S1200 Chickasaw Tpke 34.6281 -96.8550 1.1721 0.006892
Pontotoc S1200 State Hwy 3 34.6583 -96.5596 0.6001 0.003529
Pontotoc S1200 US Hwy 377 34.8721 -96.6786 0.5008 0.002945
Pontotoc S1200 US Hwy 377 34.7428 -96.6488 0.4057 0.002385
Pontotoc S1200 US Hwy 377 34.8136 -96.6954 0.3497 0.002056
Pontotoc S1200 State Hwy 19 34.7967 -96.8785 0.3043 0.001789
Pontotoc S1200 Richardson Loop 34.7889 -96.6902 0.2589 0.001523
Pontotoc S1200 State Hwy 48 34.8061 -96.4243 0.2226 0.001309
Pontotoc S1200 US Hwy 377 34.8653 -96.6807 0.1933 0.001136
Pontotoc S1200 State Hwy 1 34.7773 -96.5931 0.1663 0.000978
Pontotoc S1200 State Hwy 1 34.7807 -96.5813 0.1328 0.000781
Pontotoc S1200 Richardson Loop 34.7898 -96.6759 0.1109 0.000652
Pontotoc S1200 State Hwy 3w 34.8245 -96.7742 0.0828 0.000487
Pontotoc S1200 Cradduck Rd 34.7573 -96.6603 0.0680 0.000400
Pontotoc S1200 US Hwy 177 34.9488 -96.9307 0.0244 0.000143