old dominion university · all three ba sin summaries and appendices are available at the old...
TRANSCRIPT

OLD DOMINION UNIVERSITY
Department of Biological Sciences1
Old Dominion University, Norfolk, Virginia 23529
Department of Chemistry and Biochemistry2
Old Dominion University, Norfolk, Virginia 23529
Chesapeake Bay Program Office3
Virginia Department of Environmental QualityRichmond, Virginia 23230
STATUS AND TRENDS IN WATER QUALITY AND LIVING RESOURCES IN THE VIRGINIA CHESAPEAKE BAY: JAMES RIVER (1985-2003)
Prepared by
Principal Investigators:
Dr. Daniel M. Dauer1
Dr. Harold G. Marshall1
Dr. John R. Donat2
Mr. Michael F. Lane1
Ms. Suzanne C. Doughten2
Mr. Frederick A. Hoffman3
Submitted to:
Chesapeake Bay Program OfficeVirginia Department of Environmental Quality629 East Main StreetRichmond, Virginia 23230
January 2005

ii
Preface
The material in this report was produced for the Virginia Department of Environmental Quality inorder to summarize patterns of status and trends in water quality, phytoplankton, primaryproductivity, zooplankton and benthos collected in the York River as part of the Virginia ChesapeakeBay Program. There are three reports, referred to as basin summaries, one each for the James River,the York River and the Rappahannock River. These basin summaries are intended to be electronicreports that will be periodically updated and they were intended for an audience alreadyknowledgeable of the history and rationale of the program; design of the program; field andlaboratory methods; specialized parameters, e.g. the Benthic Index of Biotic Integrity; status andtrends analytical methods, etc.
In order to create a record of past patterns in status and trends and to make these data more widelyavailable, a printed version of each basin summary was produced. To make the information moreinterpretable we have added an introduction and a methods section. However, this report is a datareport and is not a comprehensive, interpretive report. Therefore, there is no discussion section tothis report.
All three basin summaries and appendices are available at the Old Dominion University ChesapeakeBay Program website <www.chesapeakebay.odu.edu> under “Reports.” The James River Reportincludes the Elizabeth River, the Chickahominy River and the Appomattox River. The York RiverReport includes the tidal Pamunkey River and Mattaponi River. The Rappahannock River Reportincludes the Corrotoman River. Also available at this website are appendices that include (1) tablesof status for all parameters measured at all stations sampled by each program, (2) tables of allparameters and metrics for which there was a significant trend, and (3) scatter plots of all parametersover time. There are five appendices: water quality, phytoplankton, primary productivity,zooplankton and benthos.

iii
Chapter 1. Introduction . . . . . . . . . . . . . . . . . . . . . . . . . . . . . . . . . . . . . . . . . . . . . . . . . . . . . 1
Chapter 2. Monitoring Program Descriptions . . . . . . . . . . . . . . . . . . . . . . . . . . . . . . . . . . . 2
I. Water Quality . . . . . . . . . . . . . . . . . . . . . . . . . . . . . . . . . . . . . . . . . . . . . . . . . . . . . . . . . . 2
A. Sampling Locations and Procedures . . . . . . . . . . . . . . . . . . . . . . . . . . . . . . . . . 2B. Laboratory Sample Processing . . . . . . . . . . . . . . . . . . . . . . . . . . . . . . . . . . . . . . 2
II. Phytoplankton . . . . . . . . . . . . . . . . . . . . . . . . . . . . . . . . . . . . . . . . . . . . . . . . . . . . . . . . . 3
A. Sampling Locations and Procedures . . . . . . . . . . . . . . . . . . . . . . . . . . . . . . . . . 3B. Laboratory Sample Processing . . . . . . . . . . . . . . . . . . . . . . . . . . . . . . . . . . . . . . 3
III. Benthos . . . . . . . . . . . . . . . . . . . . . . . . . . . . . . . . . . . . . . . . . . . . . . . . . . . . . . . . . . . . . . . 4
A. Fixed Location Sampling . . . . . . . . . . . . . . . . . . . . . . . . . . . . . . . . . . . . . . . . . . . 4B. Probability-Based Sampling . . . . . . . . . . . . . . . . . . . . . . . . . . . . . . . . . . . . . . . . 4C. Laboratory Sample Processing . . . . . . . . . . . . . . . . . . . . . . . . . . . . . . . . . . . . . . 5
IV. Statistical Analyses . . . . . . . . . . . . . . . . . . . . . . . . . . . . . . . . . . . . . . . . . . . . . . . . . . . . . . 5
A. Status Assessments . . . . . . . . . . . . . . . . . . . . . . . . . . . . . . . . . . . . . . . . . . . . . . . . 6B. Long-Term Trend Analyses . . . . . . . . . . . . . . . . . . . . . . . . . . . . . . . . . . . . . . . . 7
Chapter 3. James River Basin . . . . . . . . . . . . . . . . . . . . . . . . . . . . . . . . . . . . . . . . . . . . . . . 15
I. Executive Summary . . . . . . . . . . . . . . . . . . . . . . . . . . . . . . . . . . . . . . . . . . . . . . . . . . . . 15
A. Summary of Basin Characteristics . . . . . . . . . . . . . . . . . . . . . . . . . . . . . . . . . . 15B. Summary of Status and Long-Term Trends . . . . . . . . . . . . . . . . . . . . . . . . . . 15C. Summary of Major Issues in the Basin . . . . . . . . . . . . . . . . . . . . . . . . . . . . . . 17
II. Management Recommendations . . . . . . . . . . . . . . . . . . . . . . . . . . . . . . . . . . . . . . . . . . 18
III. Overview of Monitoring Results . . . . . . . . . . . . . . . . . . . . . . . . . . . . . . . . . . . . . . . . . . 19
IV. Overview of Basin Characteristics . . . . . . . . . . . . . . . . . . . . . . . . . . . . . . . . . . . . . . . . 21

iv
V. Detailed Overview of Status and Trends . . . . . . . . . . . . . . . . . . . . . . . . . . . . . . . . . . . 22
A. Fall Line . . . . . . . . . . . . . . . . . . . . . . . . . . . . . . . . . . . . . . . . . . . . . . . . . . . . . . . 22B. Tidal Fresh Appomattox (APPTF - Appomattox) . . . . . . . . . . . . . . . . . . . . . 23C. Tidal Fresh James River (JMSTF - Upper James) . . . . . . . . . . . . . . . . . . . . 24D. Oligohaline Chickahominy River (CHKOH - Chickahominy) . . . . . . . . . . . 25E. Oligohaline James River (JMSOH - Middle James) . . . . . . . . . . . . . . . . . . . 26F. Mesohaline James River (JMSMH - Lower James) . . . . . . . . . . . . . . . . . . . 27G. Polyhaline James River (JMSPH - River Mouth) . . . . . . . . . . . . . . . . . . . . . . 28H. Western Branch of the Elizabeth River (WBEMH - Western Branch) . . . . 30I. Southern Branch of the Elizabeth River (SBEMH - Southern Branch) . . . . 31J. Eastern Branch of the Elizabeth River (EBEMH - Eastern Branch) . . . . . . 32K. Elizabeth River Mainstem (ELIPH - Mainstem) . . . . . . . . . . . . . . . . . . . . . . 33
Literature Cited . . . . . . . . . . . . . . . . . . . . . . . . . . . . . . . . . . . . . . . . . . . . . . . . . . . . . . . . . . . . . 85
Glossary of Important Terms . . . . . . . . . . . . . . . . . . . . . . . . . . . . . . . . . . . . . . . . . . . . . . . . . . 89

v
List of Appendices (on attached CD-ROM)
Appendix A. Relative status of water quality in the Virginia tributary and mainstem stationsfor the period 2001 through 2003.
Appendix B. Long-term trends in water quality for the Virginia tributary and mainstemstations for the period 1985 through 2003.
Appendix C. Scatterplots of water quality parameters.
Appendix D. Status of phytoplankton bioindicators at the Virginia tributary and mainstemstations for the period 2001 through 2003.
Appendix E. Long-term trends in phytoplankton bioindicators at the Virginia tributary andmainstem stations from the start of monitoring through 2003.
Appendix F. Scatterplots of phytoplankton bioindicators.
Appendix G. Status of primary productivity at the Virginia tributary and mainstem stationsfor the period 2001 through 2003.
Appendix H. Long-term trends in primary productivity at the Virginia tributary andmainstem stations for the period 1989 through 2003.
Appendix I. Scatterplots of primary productivity.
Appendix J. Status in benthic community condition based on the B-IBI at the Virginiatributary and mainstem stations for the period 2001 through 2003.
Appendix K. Long-term trends in benthic bioindicators at the Virginia tributary andmainstem stations for the period 1985 through 2003.
Appendix L. Scatterplots of the B-IBI.
Appendix M. Scatterplots of the B-IBI components metrics.
vi
Summary of Status and Trends for the Chesapeake Bay and the James York and Rappahannock Rivers
The Virginia Chesapeake Bay and its tidal tributaries continue to show some environmental trendsindicating progress toward restoration of a more balanced and healthy ecosystem. However, the Baysystem remains degraded and some areas and indicators show continuing degradation. Progress inreducing nutrient inputs has made demonstrable improvements and we expect that continuedprogress toward nutrient reduction goals, along with appropriate fisheries management and chemicalcontaminant controls, will result in additional improvements to the Bay. Findings from the last 18years of the monitoring programs are highlighted below.
In 1995, the Virginia DEQ instituted changes to its analytical techniques for determining nutrientconcentrations in the tidal waters of Virginia. These changes resulted in step trends in the data forboth the nitrogen and phosphorus parameters for which status and long-term trends were assessed.An appropriate statistical technique was employed to determine long-term trends for the entire periodof record (1985-2003) and for trends that occurred during the pre-method change and post-methodchange periods. For the tidal waters of Virginia, all information presented in this summaryconcerning long-term trends in nutrient parameters refers only to trends detected for the entire periodof record and focuses only on the James, Elizabeth, York and Rappahannock rivers.
! Nonpoint source loads (estimates of controllable and uncontrollable) of phosphorus,nitrogen, and sediment as calculated by the Bay Program Watershed Model,decreased by 13%,11%, and 12%, respectively, compared to the 1985 baseline loads(Table 1).
! Point source nutrient loads were reduced by 53% for phosphorus and 30% fornitrogen, compared to the 1985 baseline loads. This decrease in discharge may bepartly due to ongoing drought conditions in Virginia (Table 1).
! Combined nutrient loads were reduced by 28% for phosphorus and 18% for nitrogen,compared to the 1985 baseline loads (Table 1).
! For nitrogen, there were improving trends at the river input stations of the JamesRiver, and the Rappahannock River along with a degrading trend in the PamunkeyRiver. For most segments, status of nitrogen parameters was either good or fair.Overall, there were four segments showing improving trends and six segmentsshowing degrading trends. Five of the six degrading segment trends were in the YorkRiver. Three of the four improving segment trends were in the Elizabeth River andthe James River and Rappahannock River.
vii
! For phosphorus, there were improving trends in flow adjusted concentrations abovethe fall-line at the river input stations of the James River, Appomattox River, andRapphannock River with a degrading trend in the Pamunkey River. Status inphosphorus parameters was typically poor in most segments except the tidalfreshwater segments. Overall, there were nine improving segment trends and ninedegrading segment trends in total phosphorus in the Virginia tributaries. All sevensegments of the York River showed degrading phosphorus trends. Improving trendsin phosphorus parameters were detected in nearly of the segments in the ElizabethRiver.
! Chlorophyll a levels were high in just under half of the segments sampled but therewas only one segment with a degrading trend in chlorophyll a and three showed animproving trend.
! Water clarity, a very important environmental parameter, was generally fair or poorin most segments throughout the tributaries. This is probably related to high andscattered increasing levels of suspended solids. These degrading conditions are amajor impediment to restoration of submerged aquatic vegetation (SAV). Nosegments showed improving trends and seven segments showed degrading trends inwater clarity.
! Levels of dissolved oxygen were good in the majority of areas in the tributaries andimproving trends were detected in three segments.
! Phytoplankton populations are a major food source and oxygen producer in thesewaters, and represent a major indicator to the health status of these tributaries. Although dominated by favorable concentrations and long-term trends among thediatoms and chlorophytes within segments of these rivers, there are disturbing signsof increased concentrations of cyanobacteria throughout these estuaries, and bloomsof dinoflagellates occur seasonally. These trends were enhanced at several locationsby increased concentrations becoming more common since 1999. Among these taxaare species known to be toxin producers. Future attention will continue to bedirected to any increased presence of these less favorable algal categories, and theenvironmental conditions that would favor their development over diatoms andchlorophytes.
! Benthic community patterns differed greatly between the rivers. In the James Riverthere were strong improving trends upstream and continued good status down stream.In the Elizabeth River there was a strong improving trend although the status of thebenthic communities remains poor. In the York River, community status was goodin the down stream segments where communities continued to improve. In theRappahannock River status was poor in the downstream segments of the river anddegrading trends were detected at the middle station.

viii
Table 1. Nutrient and Sediment Loads for Virginia (2001). Modified from data provided bythe Virginia Department of Environmental Quality. Phosphorous and nitrogen loadsare in kg/year and sediment loads are metric tons/year. Percent change compares2003 data to 1985 data. Nonpoint source loads are results based on the Year 2003Progress Run of the Chesapeake Bay Watershed Model and calculated reductions forcalendar year 2001 Best Management Practices (BMPs) as monitored by theDepartment of Conservation and Recreation. Values with a “*” were updated withthe latest available point source data.
Non Point Source Loads
Tributary Basin
2003
Phosphorus
Load (kg/yr)
% Change
in Phosphorus
2003
Nitrogen
Load(kg/yr)
% Change
in Nitrogen
2003
Sediment
Load (mtu/yr)
% Change
in Sediment
Potomac 708,138 -15% 6,554,972 -6% 647,340 -14%
Rappahannock 396,540 -19% 3,263,308 -22% 301,575 -21%
York 273,596 -17% 2,914,234 -16% 114,097 -20%
James 1,864,703 -10% 9,934,493 -7% 1,058,367 -8%
Coastal 88,092 -14% 882,602 -11% 19,885 -6%
Totals 3,331,069 -13% 23,549,610 -11% 2,141,255 -12%
Point Source Loads and in parentheses the number of point sources
Tributary Basin
2003
Phosphorus
Load (kg/yr)
% Change
in Phosphorus
2003
Nitrogen
Load (kg/yr)
% Change
in Nitrogen
Potomac (39) 236,924 -32% 3,309,286 -33%
Rappahannock (18) 32,092 -63% 312,415 24%
York (10) 78,015 -62% 525,344 -17%
James (37) 782,495 -55% 7,731,942 -30%
Coastal Bays (5) 3,486 -81% 106,272 -18%
Totals 1,133,012 -53% 11,985,258 -30%
Total Loads
Tributary Basin
2003
Phosphorus
Load
% Change
in Phosphorus
2003
Nitrogen
Load
% Change
in Nitrogen
2003
Sediment
Load (mtu/yr)
% Change
in Sediment
Non Point Source 3,331,069 -13% 23,549,610 -11% 2,141,255 -12%
Point Source 1,133,012 -53% 11,985,258 -30%
Combined 4,464,081 28% 35,534,868 18% 2,141,255 -12%
1
Chapter 1. Introduction
A marked decline in the water quality of the Chesapeake Bay has occurred over the past severaldecades. The disappearance of submerged aquatic vegetation in certain regions of the Bay, declinesin the abundance of some commercially and recreationally important species, increases in theincidence of low dissolved oxygen events, changes in the Bay's food web, and other ecologicalproblems have been related to the deteriorating water quality. The results of concentrated researchefforts in the late 1970s and early 1980s stimulated the establishment of Federal and state directivesto better manage the Chesapeake Bay watershed. By way of the Chesapeake Bay Agreements of1983, the State of Maryland, the Commonwealths of Virginia and Pennsylvania, and the District ofColumbia, agreed to share the responsibility for improving environmental conditions in theChesapeake Bay. As part of this agreement, a long-term monitoring program in the Chesapeake Baywas established in order to: 1) track long-term trends in water quality and living resource conditionsover time, 2) assess current water quality and living resource conditions, and 3) establish linkagesbetween water quality and living resources communities. By tracking long-term trends in waterquality and living resources, managers may be able to determine if changes in water quality andliving resource conditions have occurred over time and if those changes are a reflection ofmanagement actions. Assessments of current status may allow managers to identify regions ofconcern that could benefit from the implementation of pollution abatement or managementstrategies. By identifying linkages between water quality and living resources it may be possible formanagers to determine the impact of water quality management practices on living resourcecommunities.
Water quality and living resource monitoring in the Virginia Mainstem and tributaries began in 1985and has continued for 19 years. Detailed assessments of the status and long-term trends in waterquality and living resources in Chesapeake Bay and its tributaries have been previously conducted(Alden et al., 1991,1992; Carpenter and Lane, 1998; Dauer, 1997; Dauer et al., 1998a,1998b, 2002;Lane et al.,1998; Marshall, 1994,1996; Marshall and Burchardt, 1998, 2003, 2004a, 2004b; Marshallet al., 1998). An attempt was made to determine if there was concordance in current conditions of,and long-term changes, in water quality and living resources. The purpose of this project was toreassess the results of these studies by re-conducting the analyses after adding data collected during2003. This report describes the status of water quality and living resource conditions for the VirginiaMainstem and tributaries, summarizes major long-term trends in water quality and measures of livingresource community health and updating past basin summary reports (Dauer et al 2003a, 2003b,2003c).
2
Chapter 2. Chesapeake Bay Monitoring Program Descriptions
I. Water Quality
A. Sampling Locations and Procedures
As part of the U. S. Geological Survey's River Input Program, water quality data have been collectedat five stations near the fall line and three stations above the fall line in Virginia. Samples weretaken at base-flow twice a month and during high flows whenever possible between 1988 and 2003.Water quality data have also been collected by the Virginia Department of Environmental Quality(DEQ) at three additional stations upstream of these River Input sites (Figure 2-1). These stationshad a minimum of three consecutive years of samples taken between 1985 and 1996 with samplingoccurring on at least a monthly basis.
Water quality conditions were regularly monitored at 28 sites in the Bay Mainstem beginning in July,1985. From 1985 until 1995 eight stations were sampled by Old Dominion University (ODU) and20 stations were sampled by the Virginia Institute of Marine Science (VIMS). From 1995 throughthe present, Mainstem water quality monitoring was conducted by ODU. Tributary water qualitymonitoring was conducted by the Virginia DEQ at 27 sites in the James, York (including theMattaponi and Pamunkey) and Rappahannock rivers (Figure 2). In addition, six permanent waterquality monitoring sites were established in the Elizabeth River/Hampton Roads Harbor by ODUin February, 1989 (Figure 2-2). In August 1990, station LAF1 was dropped from the Elizabeth RiverLong Term Monitoring (ERLTM) Program.
The temporal sampling scheme for the water quality monitoring program changed several times overthe 19 year period (varying from 20 to 12 sampling events per year) as a result of changes in themonitoring program budget. In general, Mainstem sampling cruises were conducted semi-monthlyfrom March through October and monthly from November through February until 1996. Starting in1996 Mainstem sampling cruises were conducted semi-monthly for July and August and monthlythe rest of the year. Tributary sampling by the Virginia Department of Environmental Quality wasconducted 20 times per year until 1994 when sampling was reduced to 12 times per year. TheElizabeth River stations were sampled monthly. Field sampling procedures used for ODU andVIMS water quality collections are described in detail by Alden et al. (1992a). Field samplingprocedures for DEQ water quality collections are described in detail in DEQ's Quality AssuranceProject Plan for the Chesapeake Bay Program (Donat and Doughten, 2002).
B. Laboratory sample processing
Descriptions of laboratory sample processing and standard operating procedures for all waterquality parameters are found in the Chesapeake Bay Program Quality Assurance Project Plans(QAPjPs) prepared by each of the participating laboratories (Donat and Doughten, 2002). Copiesof the QAPjPs can be obtained by contacting EPA's Chesapeake Bay Program Quality AssuranceOfficer.
3
II. Phytoplankton
A. Sampling Locations and Procedures
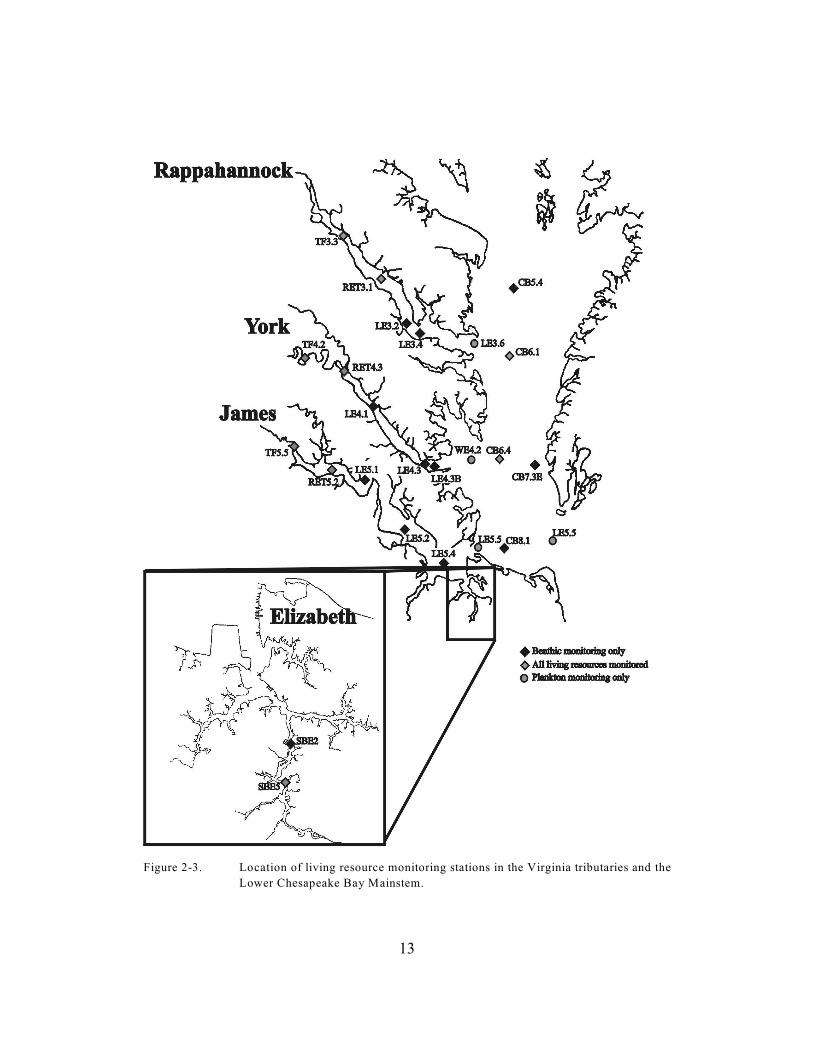
Seven stations were established in Chesapeake Bay in July 1985. These were CB6.1, CB6.4,CB7.3E, CB7.4, LE5.5, WE4.2, and LE3.6 (Figure 2-3). From July, 1985 through September, 1990,phytoplankton collections were taken from these stations twice a month from March throughOctober, and monthly November through February. From October, 1990, monthly samples weretaken at all Bay stations. Monthly sample collections and analysis in the James (TF5.5, RET5.2),York (RET4.1, RET4.3), and Rappahannock (TF3.3, RET3.1) rivers began in March, 1986. InMarch, 1987, station RET4.1 in the Pamunkey River was replaced by station TF4.2, and in February,1989, monthly collections began at two stations (SBE2, SBE5) in the Elizabeth River. Picoplanktonanalysis was included at several trial stations in January, 1989, and was expanded to include allstations in July, 1989. Primary production analysis was added to all Bay and tributary stations inJuly 1989.
At each station, two vertical sets of three liter water samples were taken at five equidistant depthsabove the pycnocline and placed in two separate carboys. The process was repeated at five depthsbelow the pycnocline. The water in each carboy was carefully mixed and replicate 500 mlsub-samples were removed from each carboy, and fixed with Lugol's solution. A second set of 125ml sub-samples were also taken above and below the pycnocline, preserved with glutaraldehyde andplaced in a cooler. These samples were taken to determine the concentrations of the autotrophicpicoplankton population. An additional replicate set was also taken from the same carboy set takenabove the pycnocline for primary productivity measurements.
B. Laboratory Sample Processing
Samples for phytoplankton analyses were passed through a series of settling and siphoning steps toproduce a concentrate (or fraction of the concentrate) that was examined using a modified Utermöhlmethod with an inverted plankton microscope (Marshall and Alden, 1990). The analysis procedureattained an estimated precision of 85% (Venrick, 1978). The autotrophic picoplankton wereprocessed through a protocol that included their collection on a 0.2 µ nucleopore filter, withsubsequent analysis using an epifluorescent microscope, under oil at 1000x magnification, with"green" and “blue” filter sets (Marshall, 1995). Supplemental analysis with a scanning electronmicroscope was used in several of the species identifications. Methodology for the productivitymeasurements is given in Marshall and Nesius (1996). Appropriate quality assurance/quality controlpractices in sample collection, analysis, and data entry were employed throughout this period.

4
III. Benthos
A. Fixed Location Sampling
Sixteen stations in the lower Chesapeake Bay were sampled quarterly (March, June, September,December) from March 1985 through December 1995 as part of the Benthic Biological MonitoringProgram of the Chesapeake Bay Program. Beginning in 1996 sampling at the fixed stations occurredonly in June and September and a stratified random sampling element was added to the program.Power and robustness analyses indicated that sampling during June and September would besufficient for detecting long-term trends at the fixed locations while at the same time, allow fundingresources to be reallocated to the probability-based random sampling regime (Alden et al., 1997).Stations were located within the mainstem of the bay and the major tributaries - the James, Yorkand Rappahannock rivers (Figure 2-3). In the tributaries, stations were located within the tidalfreshwater zone (TF5.5, TF4.2, TF3.3), turbidity maximum (transitional) zone (RET5.2, RET4.3,RET3.1), lower estuarine mesohaline muds (LE5.2, LE4.1, LE3.2) and lower estuarine polyhalinesilty-sands (LE5.4, LE4.3). The tidal freshwater station within the York River estuary was locatedin the Pamunkey River. In the Mainstem of the Bay three stations were located off the mouths ofthe major tributaries (CB8.1, CB6.4, CB6.1) and two stations in the deeper channels near the baymouth (CB7.3E) and above the Rappahannock River near the Virginia-Maryland border (CB5.4).
In 1989, five additional stations were added to the program: two stations in the Southern Branch ofthe Elizabeth River (SBE2, SBE5) in regions exposed to contaminated sediments, a station in thetransitional region of the James River (LE5.1), a station in the lower York River exposed to lowdissolved oxygen events (LE4.3B), and a station in the lower Rappahannock River exposed to lowdissolved oxygen events (LE3.4).
For the fixed point stations three replicate box core samples were collected for benthic communityanalysis. Each replicate had a surface area of 184 cm , a minimum depth of penetration to 25 cm2
within the sediment, was sieved on a 0.5 mm screen, relaxed in dilute isopropyl alcohol andpreserved with a buffered formalin-rose bengal solution.
At each station on each collection date a 50g subsample of the surface sediment was taken forsediment analysis. Salinity and temperature were measured using a Beckman RS5-3 conductivesalinometer and bottom dissolved oxygen was measured using a YSI Model 57 oxygen meter. Forthe original 16 stations see Dauer et al. (1992) for a summary of the pattern of bottom oxygen values,Dauer et al. (1993) for a summary of the distribution of contaminants in the sediments and Dauer(1993) for a summary of salinity, water depth, and sedimentary parameters.
B. Probability-Based Sampling
In 1996 a probability-based sampling program was added to estimate the area of the VirginiaChesapeake Bay and its tributaries that met the Benthic Restoration Goals as indicated by the B-IBI(Ranasinghe et al., 1994; Weisberg et al., 1997; Alden et al., 2002). Four strata were defined and
5
each stratum was sampled by 25 randomly allocated sites. The four strata were: 1) the James River;2) the York River (including the Pamunkey and Mattaponi rivers); 3) the Rappahannock River; and4) the Mainstem of the Chesapeake Bay. Each year a new set of 25 random sites was selected foreach stratum.
Probability-based sampling within strata supplements data collected at fixed-point stations.Sampling design and methods for probability-based sampling are based upon those developed byEPA's Environmental Monitoring and Assessment Program (EMAP, Weisberg et al., 1993) andallow unbiased comparisons of conditions between strata (e.g., tributaries) of the Chesapeake Baywithin the same collection year and within tributaries for between different years. The consistencyof sampling design and methodologies for probability-based sampling between the Virginia andMaryland benthic monitoring programs allows bay-wide characterizations of the condition of thebenthos for the Chesapeake Bay (Dauer 1999; Dauer and Rodi 1998a, 1998b, 1999, 2001, 2002).
Within each probability-based stratum, 25 random locations were sampled using a 0.04 m Young2
grab. At each station one grab sample was taken for macrobenthic community analysis and a secondgrab sample for sediment particle size analysis and the determination of total volatile solids. Allsampling processing for probability-based sampling stations were identical to those for the fixedstations. Physical and chemical measurements were also made at the random locations.
C. Laboratory Sample Processing
In the laboratory, each replicate was sorted and all the individuals identified to the lowest possibletaxon and enumerated. Biomass was estimated for each taxon as ash-free dry weight (AFDW) bydrying to constant weight at 60 C and ashing at 550 C for four hours. Biomass was expressed aso o
the difference between the dry and ashed weight.
The sand fraction of each sediment sample was dry sieved and the silt-clay fraction was quantifiedby a pipette analysis using the techniques of Folk (1974). Total volatile solids for each sedimentsample was determined as the AFDW weight of the sediment divided by the dry weight of thesediment, expressed as a percentage.
IV. Statistical Analyses
In order to ensure that long-term trends in water quality and living resource data are correctlyinterpreted, a unified approach for conducting the statistical analyses and interpreting their resultswas developed. Statistical analytical procedures used in this study were based on guidelinesdeveloped by the CBP Monitoring Subcommittee's Tidal Monitoring and Assessment Workgroup.For both status and trend analyses, the stations were grouped into segments based on thesegmentation scheme developed by the Data Analysis Workgroup (Figure 2-2). Status and trendanalyses were conducted for different time periods or “seasons” as defined for each monitoringcomponent in Table 2-1.

6
A. Status Assessments
For the tidal water quality stations, status analyses were conducted using surface and bottom waterquality measurements for six parameters: total nitrogen, dissolved inorganic nitrogen, totalphosphorus, dissolved inorganic phosphorus, chlorophyll a, and total suspended solids. Statusanalyses were also performed on secchi depth and bottom dissolved oxygen. All analyses wereconducted using water quality data collected from all of the Chesapeake Bay Mainstem and tributarystations from the January 2001 through December of 2003 except for bottom dissolved oxygen forwhich analyses were conducted using data collected only during the summer months of June throughSeptember.
The relative status of each station and segment was determined by comparison to a benchmark dataset comprised of all data collected from 1985 through 1990 by both the Virginia and Marylandmonitoring programs. Each station was rated as poor, fair, or good relative to the benchmark data.The ratings are obtained for data collected within each salinity zone with salinity zones beingassigned using the Venice classification system (Symposium on the Classification of BrackishWaters, 1958). For each parameter in the benchmark data set, a transformation was chosen thatyields a distribution that was symmetric and approximated by the logistic cumulative distributionfunction (CDF). In most cases, the logarithmic transformation was selected. A logistic CDF basedon the mean and variance of each parameter of the benchmark data set was used to perform aprobability integral transform on all data collected during the period of January, 2001 throughDecember, 2003. This resulted in data in the interval (0,1) that follow a uniform distribution. Thethree year median of these transformed data was computed as an indicator of status for the periodspecified. The median of n observations taken from a uniform distribution follows a Betadistribution with parameters (m,m) where:
m = (n+1)/2
and n is the number of observations. The transformed three year medians were compared to theBeta density distribution and status was determined by the placement of the transformed mediansalong the distribution. If the median was in the upper third of the distribution (where upper ischosen as the end of the distribution that is ecologically desirable) then the status rating is good,while a median in the middle third was rated fair, and a median in the lower third was rated poor.In most cases, serial dependence of the raw data resulted in greater than expected variance in theBeta density of the medians. To adjust for this, the variance of the Beta density was increased bya function of the ratio of among station variance to within station variance.
Because sampling regimes between monitoring programs varied with respect to the number ofcollection events within a given month and the number of replicate samples collected at each stationvaried, a uniform calculation protocol was adopted for use by both states to insure that thecalculations were not inadvertently biased by these discrepancies. First, replicate values werecombined by calculating a median for each station date and layer combination. Median values foreach station month and year combination were calculated to combine separate cruises per month.
7
Finally, median scores were calculated that were compared to the benchmark scale.
Water quality data were also assessed to determine if the SAV habitat requirements were met for thefollowing parameters: chlorophyll a, total suspended solids, secchi depth, dissolved inorganicnitrogen, and dissolved inorganic phosphorus. Three year medians for the SAV growing season werecompared to the SAV habitat requirement values (see Table 2-2) using a Mann-Whitney U-test. Ifthe median values were significantly higher than the habitat requirement for that parameter then theparameter was considered to have failed to met the SAV habitat requirements and if the values weresignificantly lower (higher for secchi depth) than the habitat requirement then the parameter was toconsidered to have met the SAV habitat requirement. If there was no significant difference betweenthe habitat requirements or there were insufficient data to conduct the analysis, the parameter wasconsidered borderline.
Status for phytoplankton involved the calculation of relative status using the same technique asdescribed for water quality relative status assessments. For phytoplankton communities thefollowing indicators were assessed: total phytoplankton community abundance, total phytoplanktoncommunity biomass, diatom abundance, dinoflagellate abundance, cyanobacteria abundance,picoplankton abundance, and primary productivity (carbon fixation). Benchmarks for picoplanktonabundance were made using data collected only in Virginia since sampling protocols for theMaryland program did not include counts of epifluorescent picoplankton.
Status of benthic communities at each fixed station was characterized using the three-year meanvalue (2001 through 2003) of the B-IBI (Weisberg et al., 1997). The B-IBI indicates whether themacrobenthic community meets the restoration goals developed for benthic habitats of theChesapeake Bay. An index value that exceeds or equals 3.0 indicates that the macrobenthiccommunity meets or exceeds the restoration goals developed for that habitat type while a valuebelow 3.0 indicates that the macrobenthic community does not meet the restoration goals. Statusof the benthic community was classified into four levels based on the B-IBI. Values less than orequal to 2 were classified as severely degraded, values from 2.0 to 2.6 were classified as degraded,values greater than 2.6 but less than 3.0 were classified as marginal, and values of 3.0 or more wereclassified as meeting goals.
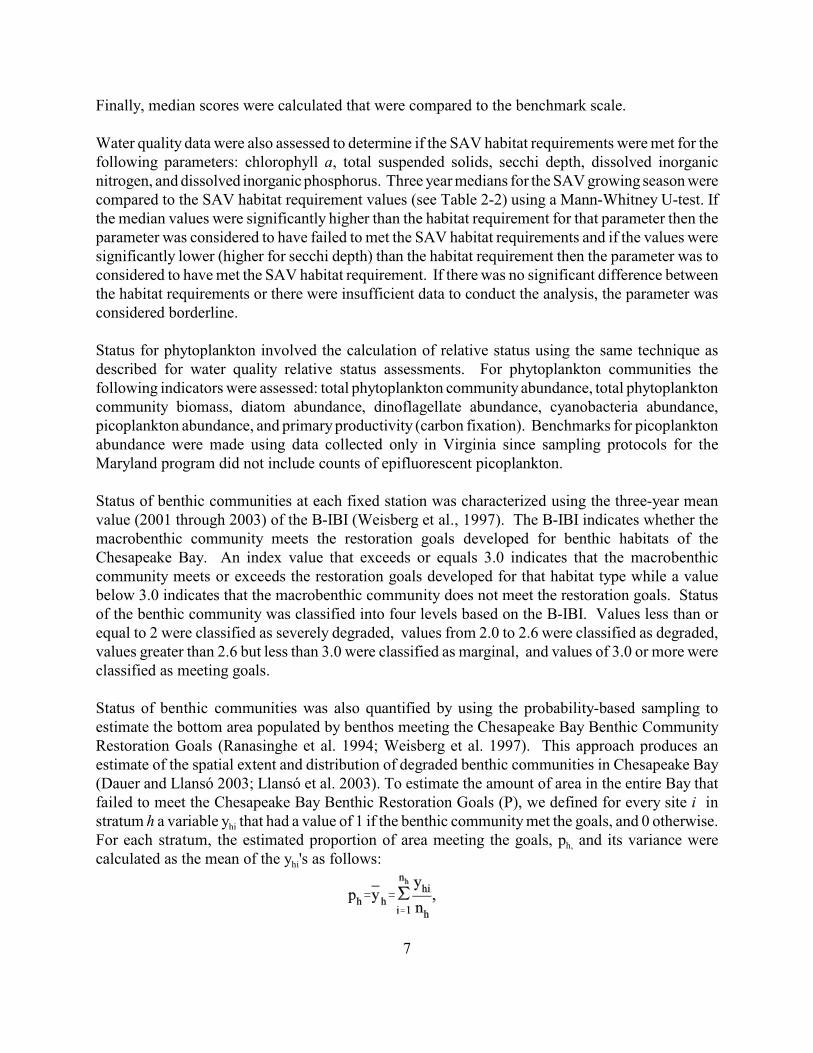
Status of benthic communities was also quantified by using the probability-based sampling toestimate the bottom area populated by benthos meeting the Chesapeake Bay Benthic CommunityRestoration Goals (Ranasinghe et al. 1994; Weisberg et al. 1997). This approach produces anestimate of the spatial extent and distribution of degraded benthic communities in Chesapeake Bay(Dauer and Llansó 2003; Llansó et al. 2003). To estimate the amount of area in the entire Bay thatfailed to meet the Chesapeake Bay Benthic Restoration Goals (P), we defined for every site i in
histratum h a variable y that had a value of 1 if the benthic community met the goals, and 0 otherwise.
h,For each stratum, the estimated proportion of area meeting the goals, p and its variance were
hicalculated as the mean of the y 's as follows:
8
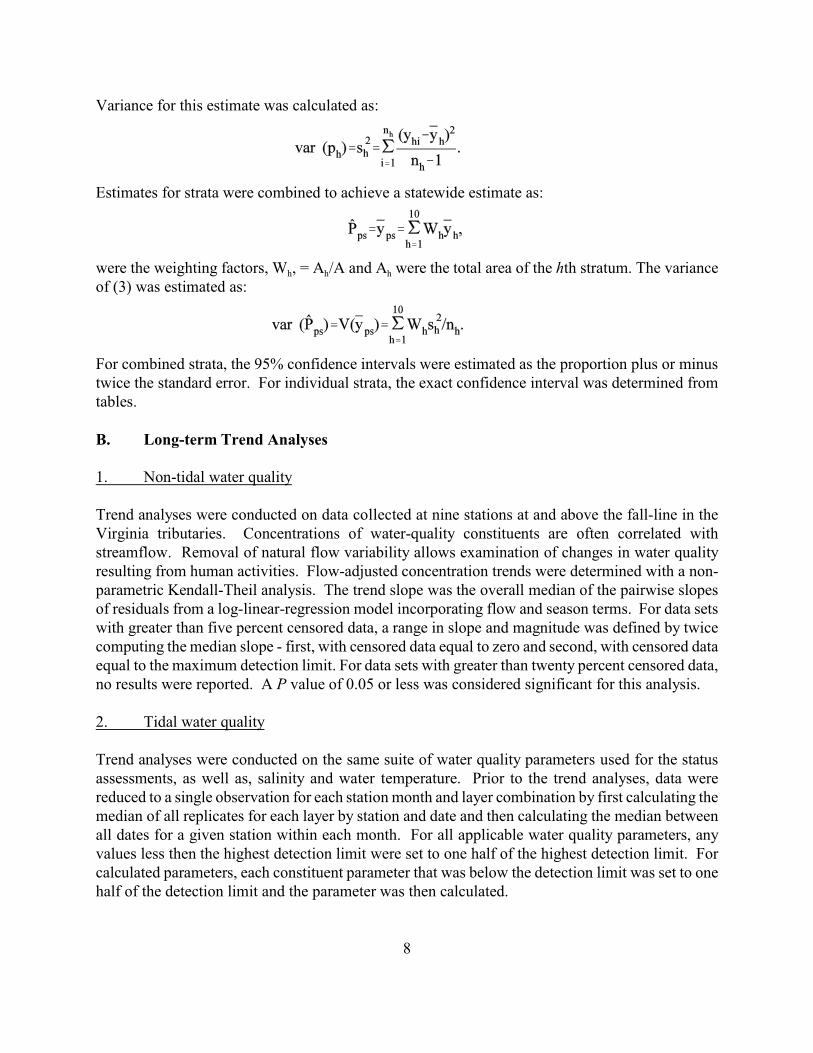
Variance for this estimate was calculated as:
Estimates for strata were combined to achieve a statewide estimate as:
h h hwere the weighting factors, W , = A /A and A were the total area of the hth stratum. The varianceof (3) was estimated as:
For combined strata, the 95% confidence intervals were estimated as the proportion plus or minustwice the standard error. For individual strata, the exact confidence interval was determined fromtables.
B. Long-term Trend Analyses
1. Non-tidal water quality
Trend analyses were conducted on data collected at nine stations at and above the fall-line in theVirginia tributaries. Concentrations of water-quality constituents are often correlated withstreamflow. Removal of natural flow variability allows examination of changes in water qualityresulting from human activities. Flow-adjusted concentration trends were determined with a non-parametric Kendall-Theil analysis. The trend slope was the overall median of the pairwise slopesof residuals from a log-linear-regression model incorporating flow and season terms. For data setswith greater than five percent censored data, a range in slope and magnitude was defined by twicecomputing the median slope - first, with censored data equal to zero and second, with censored dataequal to the maximum detection limit. For data sets with greater than twenty percent censored data,no results were reported. A P value of 0.05 or less was considered significant for this analysis.
2. Tidal water quality
Trend analyses were conducted on the same suite of water quality parameters used for the statusassessments, as well as, salinity and water temperature. Prior to the trend analyses, data werereduced to a single observation for each station month and layer combination by first calculating themedian of all replicates for each layer by station and date and then calculating the median betweenall dates for a given station within each month. For all applicable water quality parameters, anyvalues less then the highest detection limit were set to one half of the highest detection limit. Forcalculated parameters, each constituent parameter that was below the detection limit was set to onehalf of the detection limit and the parameter was then calculated.

9
Increasing trends in total nitrogen, dissolved inorganic nitrogen, total phosphorus, dissolvedinorganic phosphorus, chlorophyll a and total suspended solids should indicate increasedeutrophication and as a result positive slopes in these parameters indicate degrading conditions whilenegative slopes indicate improving water quality conditions. Increasing trends in secchi depth andbottom dissolved oxygen indicate increasing water clarity and reduced eutrophication, respectivelyand, as a result, indicate improving water quality conditions. Decreasing trends in these twoparameters indicate degrading conditions.
In 1994, changes in laboratory analytical methods for estimating concentrations of total nitrogen,dissolved inorganic nitrogen, total phosphorus and dissolved inorganic phosphorus wereimplemented by the Department of Environmental Quality in order to improve the accuracy ofconcentration estimates. These changes resulted in step trends in these parameters. In order tocompensate for the step trends, a “blocked” seasonal Kendall approach (Gilbert, 1987) was used tocompare trends conducted between two separate time periods which in this case were the pre-method(1985 through 1993) and post-method change (1995 through 2003) time periods for theseparameters. Note that 1994 was eliminated from the analyses because samples during this year werecollected and processed by a laboratory that was different than the VADCLS. The “blocked”seasonal Kendall test was applied only to those segment/parameter combinations for which a methodchange occurred. The statistical tests used for all other segment/parameter combinations were theseasonal Kendall test for monotonic trends and the Van Belle and Hughes tests for homogeneity oftrends between stations, seasons, and station-season combinations (Gilbert, 1987).
A P value of 0.01 was chosen as the statistical test criterion for all water quality trend analyses.Recent studies on representative data sets from the Chesapeake Bay monitoring program haveindicated that these tests are very powerful and robust, even when data violate most of theassumptions of parametric statistics (Alden et al., 1991; Alden et al., 1992b; Alden et al., 1994;Alden and Lane, 1996).
3. Living resources
Trend analyses for phytoplankton communities were conducted on the following phytoplanktoncommunity indices: the phytoplankton IBI, total phytoplankton abundance (excluding picoplankton);total phytoplankton biomass (excluding picoplankton); the Margalef species diversity index, and C14
productivity. In addition, trend analyses were conducted on abundance and biomass values for thefollowing taxonomic groups: diatoms; dinoflagellates; cyanobacteria; cryptomonads; chlorophytes;bloom producing species; and toxic bloom producing species. A statistical test criterion forphytoplankton metrics was a P value of 0.05.

10
The Margalef species diversity index was calculated as follows:
where S is the number of taxa in the sample and N is the number of individuals (Margalef, 1958).
Trend analyses for benthic communities were conducted using the B-IBI (Ranasinghe et al., 1994;Weisberg et al., 1997) and on selected metrics of the B-IBI. Benthic restoration goals weredeveloped for benthic habitats of the Chesapeake Bay based upon reference sites that were minimallyimpacted by low dissolved oxygen events and sediment contaminants. Goals were developed basedupon data from an index period of July 15 through September 30. Therefore trends in the value ofthe B-IBI were based upon September cruise values for the 19 year period of 1985-2003. Selectedbenthic metrics were species diversity (H’), community abundance, community biomass, pollution-indicative species abundance, pollution-indicative species biomass, pollution-sensitive speciesabundance, and pollution-sensitive species biomass. See Weisberg et al. (1997) for a list ofpollution-indicative and pollution-sensitive taxa.
The statistical tests used for the living resources bioinidcators were the seasonal Kendall test formonotonic trends and the Van Belle and Hughes tests for homogeneity of trends between seasons(Gilbert, 1987). The statistical test criterion for the benthic bioindicators was a P value of 0.10.

11
Figure 2-1. Locations of the USGS sampling stations at and above the fall-line in each of the
Virginia tributaries.

12
Figure 2-2. Map showing the locations of the water quality monitoring stations in the Virginia
tributaries and the Lower Chesapeake Bay Mainstem used in the statistical analyses.
Also shown are ellipses that delineate the Chesapeake Bay Program segmentation
scheme.
13
Figure 2-3. Location of living resource monitoring stations in the Virginia tributaries and the
Lower Chesapeake Bay Mainstem.

14
Table 2-1. Definitions of seasonal time periods for status and trend analyses conducted forof the tidal monitoring programs. A “x” indicates the analysis was conductedfor the season and parameter group combination while a “-“ indicates that noanalysis was conducted. *Note that benthic status and trend analyses wereconducted on data collected from June 15 through September 30.
Water Quality Plankton Benthos
Season Definition Status Trend
SAV
Goals Status Trend Status Trend
Annual Entire year x x - x x - -
SAV1M arch thro ugh M ay and
September through Novemberx x x x x - -
SAV2 April through October x x - x x - -
Summer1 June through September x x - x x x* x*
Summer2 July through September x x - x x - -
Spring1 March through May x x - x x - -
Spring2 April through June x x - x x - -
Fall October through December - x - x x - -
Winter January and February - x - x x - -
Table 2-2. Habitat requirements for growth and survival of SAV (from Batiuk et al., 1992;2000).
Salinity Regime
SAVGrowthSeason
LightAttenuation Coefficient
(Kd)
PercentLight at
Leaf
TotalSuspended
Solids(mg/l)
Chlorophyll a(µg/l)
DissolvedInorganicNitrogen
(mg/l)
DissolvedInorganic
Phosphorus(mg/l)
Tidal Freshwater Apr.-Oct. <2 >9 <15 <15 none <0.02
Oligohaline Apr.- Oct. <2 >9 <15 <15 none <0.02
Mesohaline Apr.-Oct. <1.5 >15 <15 <15 <0.15 <0.01
PolyhalineMar.-May,
<1.5 >15 <15 <15 <0.15 <0.01
15
Chapter 3. James River Basin
I. Executive Summary
A. Summary of Basin Characteristics
The James River basin is the largest river basin in Virginia covering 26,422 km or nearly 25% of2
the Commonwealth’s total area. The James River begins in the Allegheny Mountains where it isformed by the confluence of the Jackson and Cowpasture rivers. From its sources, the James Riverflows 547 km in a southeasterly direction to the fall-line near Richmond and for an additional 180km to Hampton Roads where it enters Chesapeake Bay. Approximately 71% of the entire basin isforested and an additional 17% of the watershed is covered by agricultural land. All other land usetypes account for just over 12% of the basin. Approximately 16,600 km of the 44,290 km (38%) ofstreambanks and shoreline within the watershed have a 30 m minimum riparian forest buffer. Thepopulation in the James River basin for 2000 was 2,522,583 people with a population density of 93.4individuals per km . Most of the basin’s population is concentrated in approximately 5% of the2
watershed which consists of residential and industrial land found in the urban areas of Tidewater,Richmond, Petersburg, Lynchburg and Charlottesville.
Total point and non-point source loadings of nitrogen were estimated to be 16,132,907 kg/yr in 2000.Total point and non-point source loadings of phosphorus and sediments were approximately2,587,742 kg/yr and 1,096,793 metric tons/yr with point sources accounting, respectively in 2000.In 2001, point source loads for total nitrogen and total phosphorus in the James River watershedwere approximately 6,974,100 kg/yr and 607,670 kg/yr, respectively. Daily freshwater flow at thefall-line ranged from a minimum of 12.66 m /sec to a maximum of 5,635 m /sec for the period of3 3
January 1, 1985 through December 31, 2002. Grand mean flow at the fall-line was 193.30 m /sec.3
Figures 3-1 to 3-7 provide summary information of basin characteristics of the James River.
B. Summary of Status and Long Term Trends
Figures 3-8 to 3-11 provide summaries of water quality status and trend analyses for the James andElizabeth rivers. The terms good, fair, and poor used in conjunction with water quality conditionsare statistically determined classifications for comparison among areas of similar salinity within theChesapeake Bay system. Though useful in comparing current conditions among different areas ofthe Chesapeake Bay system, these terms are not absolute evaluations but only appraisals relative toother areas of a generally degraded system. Several major scientific studies have shown that theChesapeake Bay system is currently nutrient enriched and has excessive and detrimental levels ofnutrient and sediment pollution (USEPA, 1982; USEPA, 1983; Boynton et al., 1995; Harding andPerry, 1997; Bricker et al., 1999; USEPA 2001; Hagy et al., 2004). Given this, it is likely that anabsolute evaluation in relation to ideal conditions would indicate that most water quality parametersare currently poor throughout the whole Bay system.
16
Status of nitrogen parameters was either good or fair in all segments of the James River. Relativestatus of total phosphorus and dissolved inorganic phosphorus was good and fair in the uppersegments of the James River (JMSTF, APPTF, and CHKOH) and poor or fair in the lower segments(JMSOH, JMSMH, JMSPH). Status of all nutrients was poor for all segments in the ElizabethRiver. Status of surface chlorophyll a was good in all James River main stem segments except theJames River Mouth (JMSPH) where it was fair. Status of surface chlorophyll a was poor in theAppomattox River (APPTF) and Chickahominy River (CHKOH). Status of surface chlorophyll awas poor in the Western Branch (WBEMH) and Elizabeth River Mainstem (ELIPH), fair in theEastern Branch (EBEMH) and good in the Southern Branch. Status of surface and bottom totalsuspended solids and secchi depth was poor in nearly all segment of the James River. Status ofsurface total suspended solids was poor in the Western Branch (WBEMH) and Elizabeth RiverMainstem (ELIPH), and fair in the Southern Branch and Eastern Branch. Status of bottom totalsuspended solids was poor in the Western Branch (WBEMH) and Elizabeth River Mainstem(ELIPH), and good in the Southern Branch and Eastern Branch. Status of secchi depth was poor inall segments of the Elizabeth River. Status of bottom dissolved oxygen was good throughout theJames River and either fair or good in all segments of the Elizabeth River.
Most parameters in the James River either did not meet the SAV habitat requirements or wereborderline with the exceptions of surface dissolved inorganic phosphorus in the Chickahominy River(CHKOH), surface chlorophyll a in the Middle James River (JMSOH), the Lower James River(JMSMH) and the James River Mouth (JMSPH). Most parameters in the Elizabeth River either didnot meet the SAV habitat requirements or were borderline except for secchi depth in the SouthernBranch and surface chlorophyll a and surface total suspended solids in all segments but the WesternBranch (WBEMH).
There were no improving trends in total nitrogen or dissolved inorganic nitrogen and a singledegrading trend in bottom total nitrogen in the Lower James River (JMSMH). Improving trends insurface and bottom dissolved inorganic phosphorus were detected in the Appomattox River (APPTF)and for bottom dissolved inorganic phosphorus in the Upper James River (JMSTF). Degradingtrends for surface and bottom dissolved inorganic phosphorus were detected in the Middle JamesRiver (JMSOH) and the Lower James River (JMSMH). An improving trend in surface chlorophylla was detected in the Chickahominy River (CHKOH). Degrading trends in bottom total suspendedsolids were detected in the Upper James River (JMSTF), the Chickahominy River (CHKOH), andthe Lower James River (JMSMH). Degrading trends in secchi depth were detected in the UpperJames River (JMSTF), the Chickahominy River (CHKOH), and the James River Mouth (JMSPH).Improving trends were detected in the Upper James River (JMSTF) and the James River Mouth(JMSPH). Improving trends in surface total nitrogen were detected in the Western Branch(WBEMH) and Southern Branch (SBEMH) while an improving trend in bottom total nitrogen wasdetected in the Eastern Branch (EBEMH) of the Elizabeth River. Improving trends in surface andbottom dissolved inorganic nitrogen were detected in the Southern Branch (SBEMH) and in theEastern Branch (EBEMH) of the Elizabeth River, respectively. Improving trends in surface andbottom total phosphorus were detected in all segments in the Elizabeth River except the ElizabethRiver Mouth (ELIPH). An improving trend in surface chlorophyll a was detected in the Western
17
Branch (WBEMH) along with improving trends in surface and bottom total suspended solids in theEastern Branch (EBEMH) and the Southern Branch (SBEMH). A degrading trend in secchi depthwas detected in the Elizabeth River Mouth segment (ELIPH).
Figures 3-12 and 3-13 provide summaries of living resources status and trend analyses for the JamesRiver. Although phytoplankton composition in the James River is represented by favorabledominance and abundance levels of diatoms, chlorophytes, and cryptophytes, there are significantsigns of degradation. Status of most phytoplankton metrics was either poor or fair in the JamesRiver while status of primary productivity was poor at station TF5.5 in the Upper James River(JMSTF), good at station RET5.2 in the Middle James River (JMSOH) and fair at station LE5.5 inthe James River Mouth segment (JMSPH). Status of most parameters at station SBE5 was poor orfair while status for the Margalef diversity index, chlorophyte biomass, picoplankton biomass andprimary productivity was good. Improving trends in diatom and chlorophyte biomass were detectedat all stations in the James River and at station SBE5 in the Southern Branch of the Elizabeth River.Improving trends in the biomass to abundance ratio were detected in all segments of the James River.Improving trends in cryptophyte biomass were detected at station TF5.5 in the Upper James Riverand station RET5.2 in the Middle James River (JMSOH). An improving trend in picoplanktonabundance was detected at station RET5.2 in the Middle James River (JMSOH). An improvingtrend in this parameter was also detected at station SBE5 in the Southern Branch (SBEMH) of theElizabeth River. Improving trends in primary productivity were detected at station RET5.2 in theMiddle James River (JMSOH) and station LE5.5 in the James River Mouth (JMSPH) segment andat station SBE5 in the Southern Branch of the Elizabeth River (SBEMH).
Improving trends in the benthic IBI (B-IBI) were detected at station TF5.5 in the Upper James River(JMSTF), at station RET5.2 in the Middle James River (JMSOH) and at station SBE5 in theSouthern Branch (SBEMH) of the Elizabeth River. The B-IBI met goals at all stations except LE5.2in the Lower James River (JMSMH) and at station TF5.5 in the Upper James River (JMSTF) wherethe status was marginal and degraded, respectively. Status of the B-IBI in the Elizabeth River wasdegraded.
C. Summary of Major Issues in the Basin
Two major water quality issues are evident in the main stem of the James River. The first is theapparent widespread problem in water clarity. Relative status of secchi depth was poor in allsegments of the James River while status of surface and bottom total suspended solids was poor inall segments except the James River Mouth (JMSPH). The SAV habitat requirements for secchidepth and surface total suspended solids were not met in any segments in the James River except theJames River Mouth (JMSPH). In addition, degrading trends in secchi depth and bottom totalsuspended solids occurred in half of the segments in the James River.
In addition to water clarity, phosphorus appear to also be problematic in this tributary although thephenomenon appears to be localized primarily in the Middle James River (JMSOH) and Lower

18
James River (JMSMH). Relative status of surface and bottom total and dissolved inorganicphosphorus was poor in the Middle James River (JMSOH) and the Lower James River (JMSMH).Also the SAV habitat requirement for surface dissolved inorganic phosphorus was not met in eitherof these two segments. Finally, degrading trends in surface and bottom dissolved inorganicphosphorus were detected in both of these segments that were consistent between the pre- and post-method periods in both the Middle James River (JMSOH) and the Lower James River (JMSMH ).
The major concerns within the phytoplankton community are increasing long-term trends inabundance and biomass among the cyanobacteria and poor status of these indicators. These taxa area less favorable food source within the water column, are associated with degrading waterconditions, and also contain several potential bloom and toxin producers. An additional concern isthe poor status of dinoflagellate biomass in the upper and mid-regions of the river, and increasedtrends of dinoflagellate biomass in the lower regions of the James. These concerns, as well as thosementioned in the section above, support the need for the adoption for the numeric chlorophyll acriteria in the James River described by VADEQ (2005). The primary area of concern with respectto the benthos is the Upper James River (JMSTF) at station TF5.5 where status of the B-IBI isdegraded.
In the Elizabeth River, water quality problems are more widespread and primarily due to excessivenutrient concentrations as is evidenced by the poor status of nutrients in all segments and by the factthat surface dissolved inorganic nitrogen and surface dissolved inorganic phosphorus either failedto meet their respective SAV habitat requirements or were borderline in all segments. Water clarityis also a problem in the Elizabeth River as indicated by the poor relative status of this parameter inall segments and the fact that the SAV habitat criterion was met only in the Southern Branch(SBEMH). Despite these problems, conditions in the Elizabeth River appear to be improving as wasindicated by the improving trends of some nutrient parameters in all segments except the ElizabethRiver Mainstem (ELIPH).
Phytoplankton communities in the Southern Branch of the Elizabeth River (SBEMH) are impactedas indicated by the fair to poor status of the majority of community metrics, as well as, the degradingtrends in cyanophyte abundance and biomass at station SBE5. Despite a significant improving trendin the B-IBI at one station, the status of the B-IBI within the Southern Branch of the Elizabeth Riverremains degraded.
II. Management Recommendations
Problems both with respect to water quality and living resources are still evident in the James River,despite improvements in point source nutrient loadings. Problems with nutrients appear to beevident especially in the mesohaline and polyhaline segments of the James River and in the ElizabethRiver. These segments are located in or near the largest concentration of urban land in the state ofVirginia. This suggests that the environmental problems in these areas may be the result of theirproximity to the point sources and urban non-point sources in this population center. Additionalpoint source and non-point source controls will help alleviate these problems. If nutrient
19
concentrations are not limiting in these areas, water clarity may be reduced by a high concentrationof total suspended solids and/or high phytoplankton concentrations caused by existing nutrientlevels. Additional point and non-point nutrient controls could also ameliorate water clarity problemswithin these segments. Problems with water clarity are more widespread in both James and theElizabeth suggesting that a combination of factors such as non-point and point source sedimentloadings, or high phytoplankton concentrations may be adversely effecting water clarity. Problemswith SAV habitat requirements tended to be widespread, as most segments had at least oneparameter which failed to meet the SAV habitat requirements. Within the lower portions of theJames River and the segments located in the Elizabeth River, water quality problems are most likelycaused by nutrient loadings from point source loadings and urban run-off.
Problems with phytoplankton communities also tended to be widespread as exhibited by: 1) theoccurrence of long-term degrading trends in cyanobacteria abundance and biomass at most stations;2) the fair to poor status of dinoflagellates and cyanobacteria biomass; and 3) the poor status of thebiomass-to-abundance ratio at all stations in the James and Elizabeth River. These problems shouldbe addressed through adoption of numeric water quality standards for chlorophyll a.
The cause of water quality and living resource problems in the upper segments of the James Riverand the Appomattox and Chickahominy rivers is unclear. A more concerted effort should be placedon designing studies that can determine the cause of the water quality and living resource problemsin these segments.
III. Overview of Monitoring Results
Figures 3-8 and 3-9 summarize the annual status and trend results for water quality in the JamesRiver. Status of all nitrogen parameters was good in the Upper and Middle James River, as wellas the Appomattox and Chickahominy rivers (segments JMSTF, JMSOH, APPTF, and CHKOH).In the Lower James River (JMSMH) and the James River Mouth (JMSPH), status of nitrogenparameters was either good or fair. Relative status of total and dissolved inorganic phosphorus wasfair in the Upper James River (JMSTF), good in the Appomattox River (APPTF) and ChickahominyRiver (CHKOH), and poor in the Middle and Lower James River (segments JMSOH and JMSMH).Status of these parameters in the James River Mouth (JMSPH) was fair for all but surface totalphosphorus for which the status was poor. Status of surface chlorophyll a was good for the Upper,Middle, and Lower James River (segments JMSTF, JMSOH, and JMSMH). Status of surface andbottom total suspended solids and secchi depth was poor in all segments of the James River exceptthe James River Mouth (ELIPH) where only secchi depth had a poor status. Status of bottomdissolved oxygen was good throughout all segments of the James River.
With the exception of surface dissolved inorganic phosphorus in the Chickahominy River, SAVhabitat requirements for nutrients, where applicable, were either borderline or not met (Table 3-5).Surface chlorophyll a failed the SAV habitat criterion in the Appomattox River (APPTF), wasborderline in the Upper James (JMSTF) and Chickahominy River (CHKOH) but met the habitat

20
requirement in all other segments downstream. Surface total suspended solids was either borderlineor failed to meet the SAV requirement in all segments except the James River Mouth (JMSPH)where the criterion was met. Secchi depth failed to met the SAV habitat requirement in all segmentsexcept the James River Mouth (JMSPH) where it met the criterion.
With respect to nutrients, improving trends that were consistent between the pre- and post-methodchange periods were limited to surface and bottom dissolved inorganic phosphorus in theAppomattox River (APPTF) and bottom dissolved inorganic phosphorus in the Upper James River(JMSTF). Degrading trends consistent between pre- and post-method change periods include surfaceand bottom dissolved inorganic phosphorus in the Middle James River (JMSOH) and Lower JamesRiver (JMSMH) and bottom total nitrogen in the Lower James River (JMSMH). Improving trendswere detected for surface chlorophyll a in the Chickahominy River (CHKOH) and bottom dissolvedoxygen in the Upper James River (JSMTF) and the James River Mouth (JMSPH). No other trendsfor the entire period of record were observed. With the exception of degrading trends in surfacedissolved inorganic phosphorus in segments the Middle James River (JMSOH) and Lower JamesRiver (JMSMH), no significant trends in nutrients were consistent between the pre- and post-methodchange periods during the SAV growing season (Table 3-6). An improving trend in surfacechlorophyll a was detected in the Chickahominy River (CHKOH) and degrading trends in secchidepth were detected in the Upper James River (JMSTF) and the Chickahominy River (CHKOH)during the SAV growing season (Table 3-7).
With respect to water quality, nutrient conditions appear to be best in the upper segments of theJames River particularly with respect to phosphorus and problems with nutrients are localizedprimarily in the Middle James River and Lower James River. Water clarity as measured by bothtotal suspended solids and secchi depth was poor throughout most of the James River and noimprovements were observed. Dissolved oxygen was good throughout the James River.
The James River phytoplankton parameters showed both positive and negative characterizations andtrends. Specifically the total phytoplankton abundance and biomass indicated long-term increasingtrends. Throughout the river the diatoms continued to show increasing biomass trends, with thenegative conditions of increasing trends of cyanobacterial abundance and biomass.
Benthic community status was good in most segments of the James River except for station TF5.5in the Upper James River where status was degraded and at station LE5.2 in the Lower James River(JMSMH) where the status was marginal. Improving trends in the B-IBI were detected at stationTF5.5 in the Upper James River (JMSTF) and station RET5.2 in the Middle James River (JMSOH).
Figures 3-10 and 3-11 summarize the annual status and trend results for water quality in theElizabeth River. Status of all nutrient parameters was poor in all segments of the Elizabeth River.Status of surface chlorophyll a was poor in the Western Branch (WBEMH) and the Elizabeth RiverMainstem (ELIPH) but good in the Southern Branch (SBEMH) and fair in the Eastern Branch(EBEMH). Status of surface and bottom total suspended solids was generally fair or poor except forbottom total suspended solids in the Southern Branch (SBEMH) and Eastern Branch (EBEMH)
21
where status was good for this parameter. Status of secchi depth was poor throughout the ElizabethRiver while the status of bottom dissolved oxygen was either fair or good.
Surface dissolved inorganic nitrogen and surface dissolved inorganic phosphorus either failed tomeet their respective SAV habitat requirements or were borderline in all Elizabeth River segments.Surface chlorophyll a and surface total suspended solids met their respective SAV habitat criteriain all Elizabeth River segments except the Western Branch (WBEMH) where surface chlorophylla was borderline and surface total suspended solids failed the criterion. Secchi depth failed to meetthe criterion in the Western Branch (WBEMH), was borderline in the Eastern Branch (EBEMH) andElizabeth River Mainstem (ELIPH), and met the criterion in the Southern Branch (SBEMH).
Improving trends in either surface or bottom total nitrogen were found in all segments of theElizabeth River except the Elizabeth River Mainstem (ELIPH). Improving trends in surface andbottom total phosphorus were detected in all segments of the Elizabeth River except the ElizabethRiver Mainstem (ELIPH). In addition, an improving trend in surface dissolved inorganic nitrogenand an improving trend in bottom dissolved inorganic nitrogen were detected in the Southern Branch(SBEMH) and the Eastern Branch (EBEMH), respectively. In addition to the improving trends innutrients, improving trends were detected in surface chlorophyll a in the Western Branch (WBEMH),bottom total suspended solids in the Southern Branch, and surface total suspended solids in theEastern Branch (EBEMH). The only degrading trend detected in the Elizabeth River was for secchidepth in the Elizabeth River Mainstem (ELIPH). During the SAV growing season, improving trendswere detected in surface total and dissolved inorganic phosphorus in the Eastern Branch (EBEMH).A degrading trend in secchi depth was detected in the Elizabeth River Mainstem (ELIPH) during thisseason. No other significant trends were detected during the SAV growing season (Tables 3-12,3-13).
Results of the relative status assessments and SAV habitat criteria indicate that water qualityconditions within the Elizabeth River are heavily degraded. Trend results for both the Annual andand SAV growing season indicate that water quality is improving.
In general, status and trend results for the phytoplankton in the Southern Branch (SBEMH) reflectthe results for the water quality. With respect to phytoplankton communities, many metrics showedonly fair or poor status but improving trends were detected for diatom, chlorophyte and cryptophytebiomass. In addition, an improving trend in primary productivity was also detected. Despite thesigns of improvement, phytoplankton populations remain under stress as indicated by the degradingtrends observed for cyanophyte abundance and biomass.
Benthic community status in the Southern Branch (SBEMH) also reflected water quality conditions.Status of the B-IBI was poor at both station SBE5 and station SBE2 but an improving trend in theB-IBI, coupled with improving trends in several community composition metrics, was detected atstation SBE5. Although no trend in B-IBI was detected, conditions at SBE2 may also be improvingas was indicated in the improving trends observed for pollution indicative and pollution sensitivespecies biomass and abundance.
22
IV. Overview of Basin Characteristics
The James River basin is the largest river basin in Virginia covering 26,422 km or nearly 25% of2
the Commonwealth’s total area. The James River begins in the Allegheny Mountains where it isformed by the confluence of the Jackson and Cowpasture rivers. From its sources, the James Riverflows 547 km in a southeasterly direction to the fall-line near Richmond and for an additional 180km to Hampton Roads where it enters Chesapeake Bay.
The population in the James River basin grew from 2,288,366 individuals in 1990 to 2,522,583individuals in 2000 (Figure 3-1a) with a basin-wide population density of 93.4 individuals per km .2
Most of the basin’s population is concentrated in approximately 5% of the watershed which consistsof residential and industrial land found in the urban areas of Tidewater, Richmond, Petersburg,Lynchburg and Charlottesville. Population density in the James River Basin ranges from 108.45individuals per km in the Middle James River (JMSOH) to 894.53 individuals per km in at the2 2
James River Mouth in the vicinity of Hampton Roads (Figure 3-1b).
Approximately 71% of the entire basin is forested and an additional 17% of the watershed is coveredby agricultural land. All other land use types account for just over 12% of the basin. Approximately16,600 km of the 44,290 km (38%) of streambanks and shoreline within the watershed has a 30 mminimum riparian forest buffer. In terms of total area, both forested and agricultural land use typeswere highest in the region around the Upper James River segment (Figure 3-2a), and accounted for723.5 km and 262.34 km of land, respectively. The percentage of forested land within sub-2 2
watersheds of the James River remained relatively stable at 45% or more of the total sub-watershedfrom the Middle James River to the Appomattox River. However the percentage of forested landdecreased to just under 35% in the Lower James River and to less than 10% at the James RiverMouth (Figure 3-2b).
Total point and non-point source loadings of nitrogen were estimated to be 16,132,907 kg/yr in 2000.Total point and non-point source loadings of phosphorus and sediments were approximately2,587,742 kg/yr and 1,096,793 metric tons/yr, respectively in 2000. Point sources account forapproximately 6,173,000 kg/yr (38%) of the total nitrogen loadings and 715,768 kg/yr (nearly 28%)of the total phosphorus loadings (Figure 3-3a-b). Agricultural and forested land accounted for494,418,550 kg/yr (45%) and 390,099,890 (36%) of the total suspended sediment loadings (Figure3-3c).
Point source loadings of total nitrogen decreased from 11,231,184 kg/yr in 1985 to 6,974,083 kg/yrin 2001 (Figure 3-4a). Point source phosphorus showed a similar improving trend, decreasing from1,653,887 kg/yr in 1985 to 607,670 kg/yr in 2001 (Figure 3-4b). Point source discharges for bothtotal nitrogen and total phosphorus appear to be concentrated above the fall-line in James River(AFL-JR) and the James River Mouth (JMSPH) (Figure 3-5a-b).
The ratio of impacted (agricultural and urban) to forested land use peaks in the region around theJames River Mouth (Figure 3-6). This suggests that the area around this segment would be more
23
likely than other regions in the basin to experience high non-point source loadings of both nutrientsand sediments from agricultural and urban land.
Daily freshwater flow at the fall-line ranged from a minimum of 12.66 m /sec to a maximum of3
5,635 m /sec for the period of January 1, 1985 through December 31, 2002. Grand mean flow at the3
fall-line was 193.30 m /sec. There was a significant decreasing trend in freshwater flow at the James3
River fall-line and annual peaks in monthly mean flow during the last four years appear to be muchlower than during previous years (Figure 3-7a). Annual mean flow ranged from approximately 40%to 50% lower than the grand mean flow during the last four years (Figure 3-7b).
V. Detailed Overview of Status and Trends
A. Fall Line
In general, water quality conditions above and at the fall-line in the James River appear to beimproving. Improving trends in flow adjusted concentrations of ammonia were detected in theJackson River at Covington, in the James River at Bent Creek, and in the James River at Scottsville.Improving trends in flow adjusted concentrations of nitrates-nitrites were detected in the James Riverat Scottsville and at Cartersville. Improving trends in flow adjusted concentrations of totalphosphorus were detected at all stations at and above the fall-line in the James River. An improvingtrend in flow adjusted dissolved inorganic phosphorus was detected in the James River atCartersville (Table 3-1). Water quality conditions above the fall-line in the Appomattox River alsoimproved, as indicated by the improving trend in dissolved inorganic phosphorus at Mataoca (Table3-1).
A. Tidal Fresh Appomattox (APPTF - Appomattox)
1. Water quality for living resources
a) Nutrient parameters
Status of all nutrient parameters was good except for surface total phosphorus for which the statuswas fair (Figure 3-8; Table 3-2). Significant improving trends in surface and bottom dissolvedinorganic phosphorus were detected that were consistent between the pre- and post-method changeperiods (Figure 3-8; Table 3-3). No other trends were detected in this segment
b) Non-nutrient parameters
Status of all non-nutrient parameters was poor except for bottom dissolved oxygen for which thestatus was good (Figure 3-9; Table 3-3). There were no trends in any of the non-nutrient parametersin this segment (Figure 3-9; Table 3-4).
24
2. Water quality for SAV
a) SAV habitat requirements
All parameters except surface dissolved inorganic phosphorus failed to meet the SAV habitatrequirements (Table 3-5).
b) Nutrient parameters
There were no trends in nutrient parameters during the SAV growing season in this segment (Table3-6).
c) Non-nutrient parameters
There were no trends in non-nutrient parameters during the SAV growing season in this segment(Table 3-6).
3. Living resources
Living resource monitoring is not conducted within this segment.
C. Tidal Fresh James River (JMSTF - Upper James)
1. Water quality for living resources
a) Nutrient parameters
Status of all nitrogen parameters in this segment was good while status of all phosphorus parameterswas fair (Figure 3-8;Table 3-2). There were significant differences in trends between the pre- andpost-method periods for surface and bottom total nitrogen, surface and bottom dissolved inorganicnitrogen, and surface dissolved inorganic phosphorus. For all of these parameters, a significantimproving trend was detected in the pre-method change period which was not significant in the post-method change period. A improving significant trend in bottom dissolved inorganic phosphorus wasdetected which was consistent between the pre- and post-method change periods (Figure 3-8;Table3-3).
b) Non-nutrient parameters
Status of surface and bottom total suspended solids and secchi depth was poor, however, status ofsurface chlorophyll a, bottom dissolved oxygen was good (Figure 3-9;Table 3-2). Degrading trendsin surface bottom total suspended solids, and secchi depth were detected while an improving trendin Summer1 bottom dissolved oxygen was detected (Figure 3-9;Table 3-4).
25
2. Water quality for SAV
a) SAV habitat requirements
All parameters either failed to meet the SAV habitat requirement or were borderline (Table 3-5).
b) Nutrient parameters
Although there were significant improving trends in surface total nitrogen, surface dissolvedinorganic nitrogen, and surface dissolved inorganic phosphorus during the pre-method changeperiod, none were consistent with data collected during the post-method change periods. (Table 3-6).
c) Non-nutrient parameters
A degrading trend in secchi depth was detected in this segment (Table 3-17).
3. Living resources
The total phytoplankton populations increased in both abundance and biomass, including a favorableincrease in the biomass to abundance ratio. There were no significant trends in productivity orspecies diversity. The diatoms, chlorophytes, and cryptophytes exhibited favorable increasing trendsin biomass, with degrading trends of biomass and abundance associated with the cyanobacteria.Although the dinoflagellate biomass status was poor, there were no significant trends associatedhere, or with the picoplankton biomass. Overall, the floral component was mixed with statusgenerally unfavorable and improvements required.
Benthic community status was degraded at station TF5.5; however, an improving trend in the B-IBIwas detected due to increasing trends in pollution sensitive species abundance and biomass (Figure3-13). Values of the B-IBI showed a fairly steady increase from around 2.0 (degraded) in 1985 toaround 4.5 (above the B-IBI Goal) in 1999 but dropped precipitously during the last 4 years todegraded conditions in 2003 (Appendix L).
D. Oligohaline Chickahominy River (CHKOH - Chickahominy)
1. Water quality for living resources
a) Nutrient parameters
Status of all nutrient parameters was good except for surface and bottom total phosphorus for whichthe status was poor (Figure 3-8;Table 3-2). No significant trends were detected for any of thenutrient parameters (Figure 3-8;Table 3-3).

26
b) Non-nutrient parameters
Status of all non-nutrient parameters was poor except for Summer1 bottom dissolved oxygen forwhich the status was good (Figure 3-9;Table 3-2). Degrading trends in bottom total suspended solidsand secchi depth were detected along with an improving trend in surface chlorophyll a (Figure 3-9;Table 3-4).
2. Water quality for SAV
a) SAV habitat requirements
Surface dissolved inorganic phosphorus met its respective SAV habitat requirements while surfacetotal suspended solids and secchi depth failed to met the requirements and surface chlorophyll a wasborderline (Table 3-5).
b) Nutrient parameters
There were no trends in nutrient parameters during the SAV growing season in this segment (Table3-6).
c) Non-nutrient parameters
An improving trend was detected in surface chlorophyll a while a degrading trend was detected insecchi depth (Table 3-7).
3. Living resources
Living resource monitoring is not conducted within this segment.
E. Oligohaline James River (JMSOH - Middle James)
1. Water quality for living resources
a) Nutrient parameters
Status of all nitrogen parameters was good while the status of all phosphorus parameters was poor(Figure 3-8;Table 3-2). No significant trends were detected for surface and bottom total nitrogen ineither the pre- or post-method change periods. There were significant differences between pre- andpost-method change periods for surface and bottom dissolved inorganic nitrogen. For bothparameters the pre-method change trends were improving but the post-method change trends werenot significant. There were significant differences in trends between the pre- and post-methodchange periods for surface and bottom total phosphorus. For surface total phosphorus, the pre-method change trend was degrading, but the post-method change trend was not significant. For

27
bottom total phosphorus, the pre-method change trend was degrading but the post-method changetrend was improving. (Figure 3-8;Table 3-3).
b) Non-nutrient parameters
Status of surface chlorophyll a and bottom dissolved oxygen was good while the status of all otherparameters was poor (Figure 3-9;Table 3-2). Increasing trends in surface and bottom salinity weredetected in this segment but no other trends were detected (Figure 3-9;Table 3-4).
2. Water quality for SAV
a) SAV habitat criteria
Although the SAV habitat requirement for surface chlorophyll a was met, all other parameters failedto meet their respective criteria (Table 3-5).
b) Nutrient parameter trends
Although a significant improving trend in surface dissolved inorganic nitrogen and a significantdegrading trend in surface total phosphorus were detected during the pre-method change period,neither of these trends were significant during the post-method change period. A significantdegrading trend in surface dissolved inorganic phosphorus was detected that was consistent betweenthe pre- and post-method change periods (Table 3-6).
c) Non-nutrient parameter trends
There were no trends in the non-nutrient parameters in this segment during the SAV growing season(Table 3-7).
3. Living resources
There were mixed patterns at this station. However, the majority of status ratings for thephytoplankton parameters were poor (biomass to abundance ratio, species diversity, plus the biomassof dinoflagellates, cyanobacteria, and picoplankton, and cyanobacteria abundance). Good statusoccurred with productivity, and the biomass of diatoms and chlorophytes. Improving trends werethen associated with diatom biomass, productivity, and the biomass of both cryptophytes andchlorophytes (Figure 3-12, Appendix F). These indices show a mixed pattern of prevailing andfavorable populations under duress but still dominant with other less favorable algal categoriesincreasing.
Benthic community status was good at both stations LE5.1 and RET5.2 and an improving trend inthe B-IBI was detected at station RET5.2 due to increases in total abundance, pollution sensitivespecies abundance, pollution sensitive species biomass, and species diversity (Figure 3-13). Values

28
of the B-IBI generally fluctuated around the B-IBI Goal at station LE5.1 while showing a slight butrelatively consistent increase at station RET5.2 (Appendix L).
F. Mesohaline James River (JMSMH - Lower James)
1. Water quality for living resources
a) Nutrients parameters
Status of all nitrogen parameters was fair except surface total nitrogen for which the status was goodwhile the status of all phosphorus parameters was poor (Figure 3-8; Table 3-2). Significantdegrading trends in bottom total nitrogen and surface and bottom dissolved inorganic phosphoruswere detected that were consistent between pre- and post-method change periods. Significantdifferences in trends between the pre- and post-method change periods for surface and bottom totalphosphorus were detected. For both parameters, the pre-method change trend was degrading whilethe post-method change trends were not significant (Figure 3-8;Table 3-3).
b) Non-nutrient parameters
Although the status of surface chlorophyll a and Summer1 bottom dissolved oxygen was good, thestatus of surface and bottom total suspended solids and secchi depth was poor (Figure 3-9;TableTable 3-2). An degrading trend in secchi depth was detected (Figure 3-9; Table 3-4).
2. Water quality for SAV
a) SAV habitat requirements
Only surface chlorophyll a met its respective SAV habitat requirement. Both surface dissolvedinorganic phosphorus and secchi depth failed their requirements and the remaining parameters wereborderline (Table 3-5).
b) Nutrient parameter trends
Significant degrading trends were detected in surface total nitrogen and surface dissolved inorganicphosphorus which were consistent between the pre- and post-method change periods. A significantdifference in trends was detected between the pre- and post-method change periods for surface totalphosphorus. The degrading trend in the pre-method change data for this parameter was not detectedin the post-method change period (Table 3-6).
c) Non-nutrient parameter trends
No significant trends were detected for any of the non-nutrient parameters during the SAV growingseason in this segment (Table 3-7)
29
3. Living resources
Phytoplankton monitoring is not conducted within this segment.
Benthic community status at station LE5.2 was marginal and, although there was no trend in the B-IBI, there was an improving trend in total abundance (Figure 3-13). Values for the B-IBI variedsubstantially at this site ranging periodically from below 2.5 (degraded) to values approaching 5.0(Meets Goals) since 1985 (Appendix L).
G. Polyhaline James River (JMSPH - River Mouth)
1. Water quality for living resources
a) Nutrient parameters
Status of nitrogen parameters was good except for bottom total nitrogen for which the status was fair.Status of all phosphorus parameters was fair except for surface total phosphorus for which the statuswas poor (Figure 3-8;Table 3-2). No significant trends were detected for any of the nutrientparameters in this segment (Figure 3-8;Table 3-3).
b) Non-nutrient parameters
Status of surface chlorophyll a and surface total suspended solids was fair. Status of bottom totalsuspended solids and Summer1 bottom dissolved oxygen was good while the status of secchi depthwas poor (Figure 3-9;Table 3-2). A degrading trend was detected in secchi depth while an improvingtrend was detected in Summer1 bottom dissolved oxygen. An increasing trend in bottom salinityand a decreasing trend in bottom water temperature were detected in this segment (Figure 3-9;Table3-4).
2. Water quality for SAV
a) SAV habitat requirements
Surface dissolved inorganic nitrogen and phosphorus failed to meet the SAV habitat requirementswhile the criteria were met for all parameters in this segment (Table 3-5).
b) Nutrient parameter trends
Although a significant degrading trend in surface total phosphorus was detected for the pre-methodchange period, it was not consistent with the post-method change trend which was not significant.No other trends were detected for any of the nutrients in this segment (Table 3-6).

30
c) Non-nutrient parameter trends
No significant trends were detected for any of the non-nutrient parameters in this segment (Table 3-7).
3. Living resources
There were increased long-term trends in total phytoplankton abundance and biomass, with poorstatus represented for total biomass and the biomass to abundance ratio. The majority ofphytoplankton categories had a status rating of fair or poor, including a poor status for productivity.There were positive increased biomass trends among the diatoms and chlorophytes, and in thebiomass to abundance ratio, but poor status and degrading trends of increased biomass andabundance indicated for the cyanobacteria, plus increasing trends in dinoflagellate biomass. (Figure3-12, Appendix F). This is a region is also associated with sporadic and common dinoflagellateblooms.
Benthic community status was good with no trend in the B-IBI at station LE5.4. Improving trendsin total biomass and pollution indicative species abundance were detected at this station but adegrading trend in pollution sensitive species biomass was also detected (Figure 3-13). A plot of theB-IBI indicates the benthic community has remained relatively stable ranging between values of 3.0to above 4.0 nearly every year since 1985 (Appendix L).
H. Western Branch of the Elizabeth River (WBEMH - Western Branch)
1. Water quality for living resources
a) Nutrient parameters
Status for all nutrient parameters was poor (Figure 3-10;Table 3-8). Improving trends were detectedin surface total nitrogen and surface and bottom total phosphorus in this segment (Figure 3-10; Table3-9).
b) Non-nutrient parameters
Status of surface chlorophyll a, surface and bottom total suspended solids, and secchi depth was poorwhile status of bottom dissolved oxygen was good (Figure 3-11;Table 3-8). An improving trendwas detected in surface chlorophyll a but no other trends were detected in this segment (Figure 3-11;Table 3-10).

31
2. Water quality for SAV
a) SAV habitat requirements
Surface dissolved inorganic phosphorus, surface total suspended solids, and secchi depth failed tomeet the SAV habitat requirements, while surface dissolved inorganic phosphorus and surfacechlorophyll a were borderline (Table 3-11).
b) Nutrient parameters
Improving trends were detected in surface total phosphorus and surface dissolved inorganicphosphorus during the SAV growing season in this segment (Table 3-12).
c) Non-nutrient parameters
No trends in non-nutrient parameters were detected (Table 3-13).
3. Living resources
Phytoplankton and zooplankton monitoring is not conducted within this segment.
I. Southern Branch of the Elizabeth River (SBEMH - Southern Branch)
1. Water quality for living resources
a) Nutrient parameters
Status of all nutrient parameters was poor (Figure 3-10;Table 3-8). Improving trends were detectedin surface total nitrogen, surface dissolved inorganic nitrogen and surface and bottom totalphosphorus (Figure 3-10;Table 3-9).
b) Non-nutrient parameters
Status of surface chlorophyll a and bottom total suspended solids was good while status of surfacetotal suspended solids and bottom dissolved oxygen was fair. Status of secchi depth was poor(Figure 3-11;Table 3-8). An improving trend were detected in bottom total suspended solids andincreasing trends were detected in surface and bottom water temperature (Figure 3-11;Table 3-10).
2. Water quality for SAV
a) SAV habitat requirements
SAV habitat requirements were not met for surface chlorophyll a, surface total suspended solids and

32
secchi depth; however, both surface dissolved inorganic nitrogen and surface of dissolved inorganicphosphorus did meet their respective criteria (Table 3-11).
b) Nutrient parameters
No significant trends were detected in any of the nutrients during the SAV growing season in thissegment (Table 3-12).
c) Non-nutrient parameters
No significant trends were detected in the non-nutrient parameters in this segment during the SAVgrowing season (Table 3-13).
3. Living resources
The Elizabeth River is recognized as one of the most polluted rivers in Virginia. Its algalpopulations to a great extent are similar to those in the lower Chesapeake Bay, with a fewrepresentative species entering the southern branch from the Dismal Swamp Canal. The algalparameters have status ratings of good (species diversity, productivity, chlorophyte and picoplanktonbiomass), fair (biomass of diatoms, dinoflagellates, and cyanobacteria), and poor (totalphytoplankton biomass, phytoplankton biomass to abundance ratio). Favorable trends are presentin total productivity, and the biomass among diatoms, chlorophytes, and cryptophytes (Figure 3-12,Appendix F). Although there are signs of improvement within this community, the algal componentremains under stress.
Although benthic community status was degraded at both SBE5 and SBE2, an improving trend inthe B-IBI was detected at station SBE5 and improving trends in several community metrics weredetected at SBE2. The improving trend in the B-IBI at station SBE5 was the result of trends innearly all metrics of benthic community health (Figure 3-13). Values of the B-IBI showed agenerally steady increase from 1989 through 2003 at station SBE5 while the B-IBI was fairly stableand below the B-IBI goal at station SBE2 (Appendix L).
J. Eastern Branch of the Elizabeth River (EBEMH - Eastern Branch)
1. Water quality for living resources
a) Nutrient parameters
Status of all nitrogen and phosphorus parameters was poor (Figure 3-10;Table 3-8). Improvingtrends were detected in bottom total nitrogen and dissolved inorganic phosphorus, as well as, surfaceand bottom total phosphorus (Figure 3-10; Table 3-9).

33
b) Non-nutrient parameters
Status of surface chlorophyll a, surface total suspended solids, and Summer1 bottom dissolvedoxygen was fair, while the status of bottom total suspended solids was good. Secchi depth status waspoor. An improving trend in surface total suspended solids was detected (Figure 3-11;Table 3-10).
2. Water quality for SAV
a) SAV habitat requirements
Although surface dissolved inorganic nitrogen and phosphorus failed to meet the SAV habitatrequirements, surface chlorophyll a, and surface total suspended solids met their respectiverequirements. Secchi depth was borderline (Table 3-11).
b) Nutrient parameters
No trends were detected in any of the nutrient parameters during the SAV growing season in thissegment (Table 3-12).
c) Non-nutrient parameters
No significant trends were collected for any of the non-nutrient parameters in this segment (Table3-13).
3. Living resources
Phytoplankton and zooplankton monitoring is not conducted within this segment.
K. Elizabeth River Mainstem (ELIPH - Mainstem)
1. Water quality for living resources
a) Nutrient parameters
Status of all nutrient parameters in this segment was poor and no significant trends in nutrients weredetected (Figure 3-10;Tables 3-8, 3-9).
b) Non-nutrient parameters
Status in surface chlorophyll a, surface total suspended solids and secchi depth was poor while thestatus of bottom total suspended solids and Summer1 bottom dissolved oxygen were fair and good,respectively (Figure 3-11; Table 3-8). A degrading trend in secchi depth was detected but no othertrends were detected in the non-nutrient parameters (Figure 3-11;Table 3-10).
34
2. Water quality for SAV
a) SAV habitat requirements
Although surface chlorophyll a and surface total suspended solids met the SAV habitat requirements,surface dissolved inorganic nitrogen failed to meet its criteria and surface dissolved inorganicphosphorus and secchi depth were borderline (Table 3-11).
b) Nutrient parameters
No significant degrading trends in nutrients were detected during the SAV growing season in thissegment (Table 3-12).
c) Non-nutrient parameters
A degrading trend in secchi depth was detected during the SAV growing season in this segment(Table 3-13).
3. Living resources
Living resource monitoring is not conducted within this segment.
Further information about the benthos of the Elizabeth River can be found in Dauer (2004).

37
Figure 3-1. Patterns in: a) total and projected total watershed population
over time, and b) population density between sub-watersheds
within the James River basin for the year 2000.
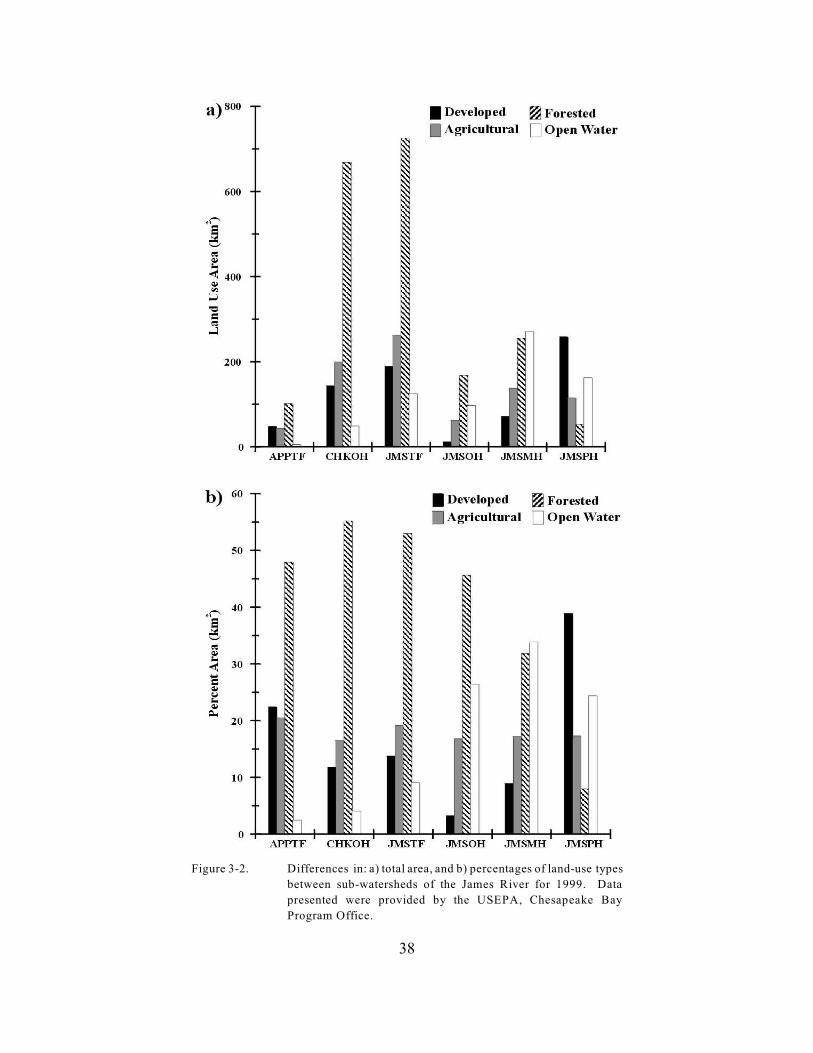
38
Figure 3-2. Differences in: a) total area, and b) percentages of land-use types
between sub-watersheds of the James River for 1999. Data
presented were provided by the USEPA, Chesapeake Bay
Program Office.
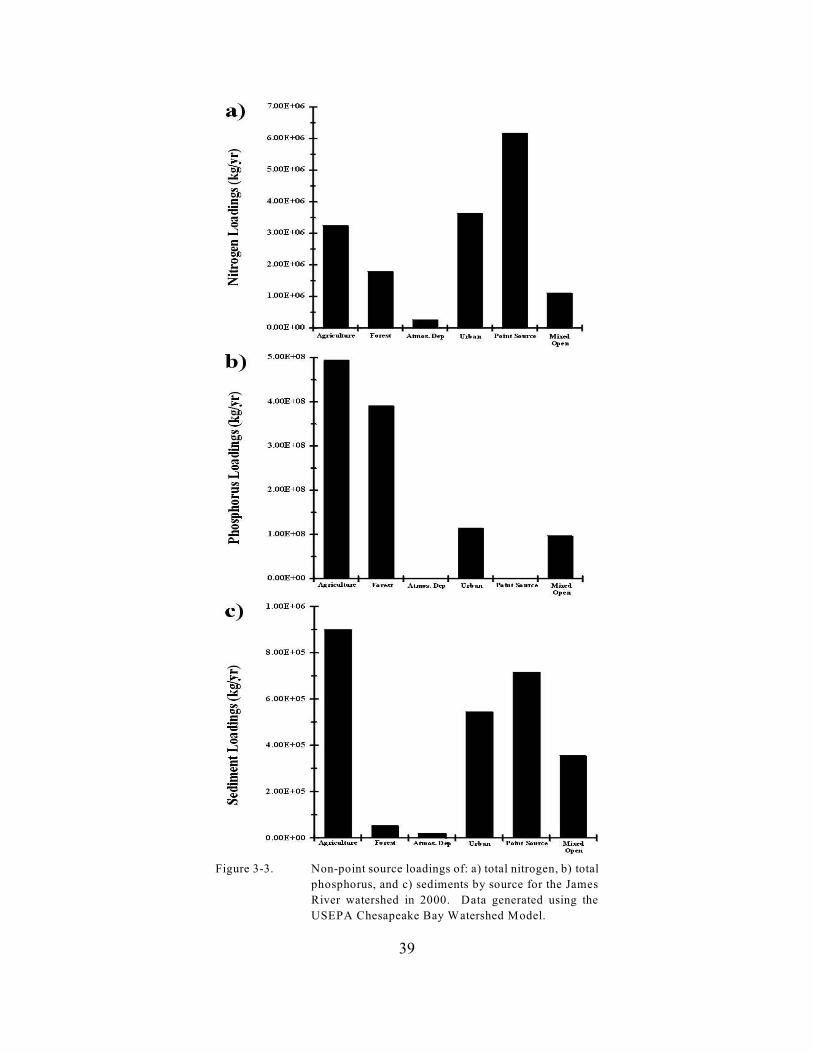
39
Figure 3-3. Non-point source loadings of: a) total nitrogen, b) total
phosphorus, and c) sediments by source for the James
River watershed in 2000. Data generated using the
USEPA Chesapeake Bay Watershed Model.

40
Figure 3-4. Long-term trends in point source: a) total nitrogen loadings, and b) total phosphorus
loadings in the James River for 1985 through 2001.
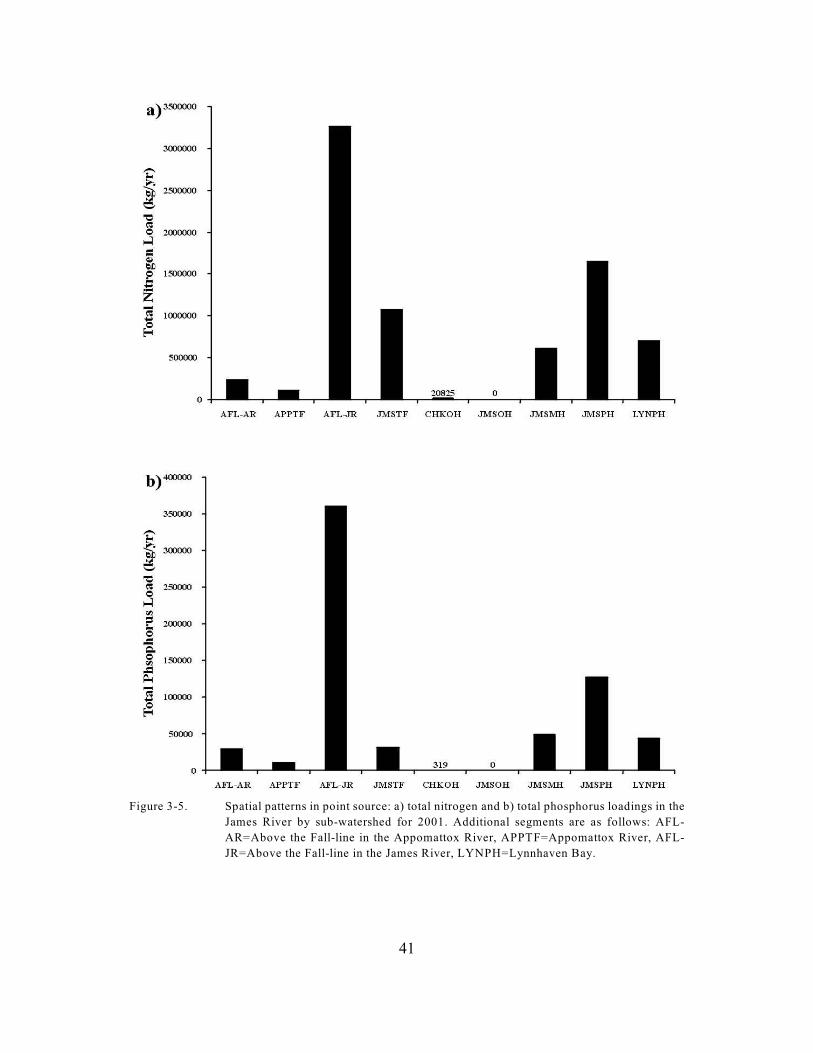
41
Figure 3-5. Spatial patterns in point source: a) total nitrogen and b) total phosphorus loadings in the
James River by sub-watershed for 2001. Additional segments are as follows: AFL-
AR=Above the Fall-line in the Appomattox River, APPTF=Appomattox River, AFL-
JR=Above the Fall-line in the James River, LYNPH=Lynnhaven Bay.
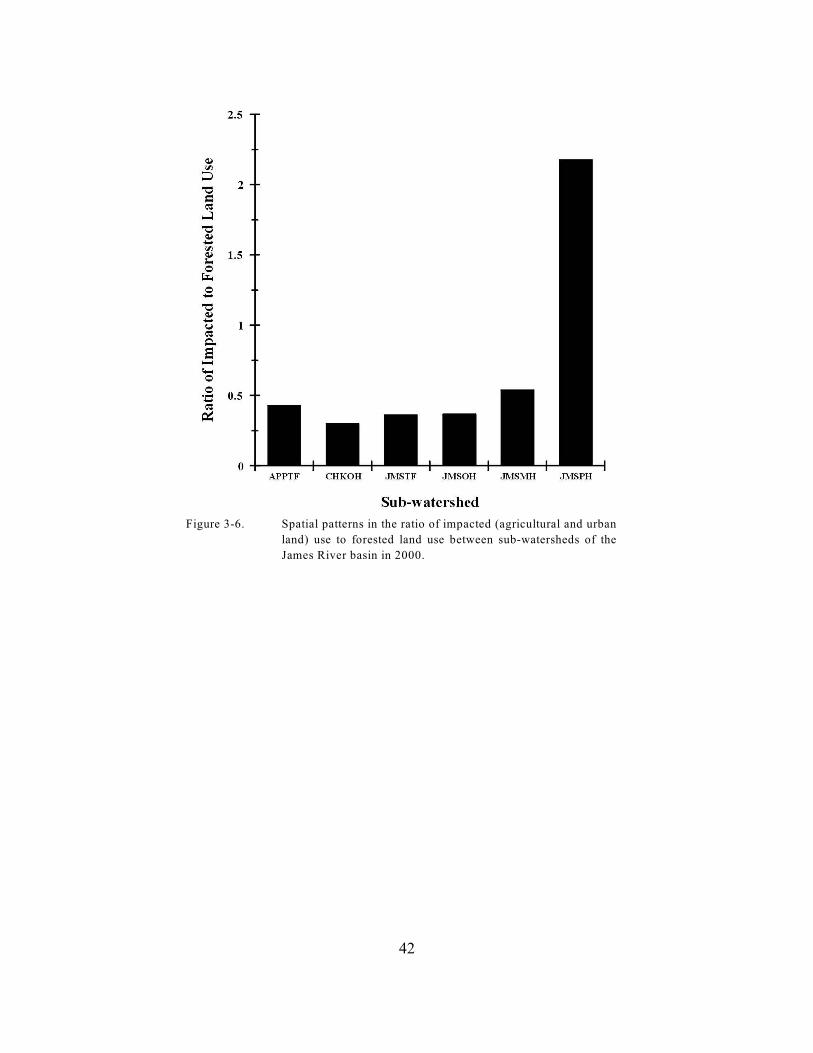
42
Figure 3-6. Spatial patterns in the ratio of impacted (agricultural and urban
land) use to forested land use between sub-watersheds of the
James River basin in 2000.

43
Figure 3-7. Plots of: a) monthly mean and b) annual mean freshwater flow at the James River
fall-line for the period of 1985 through 2002.
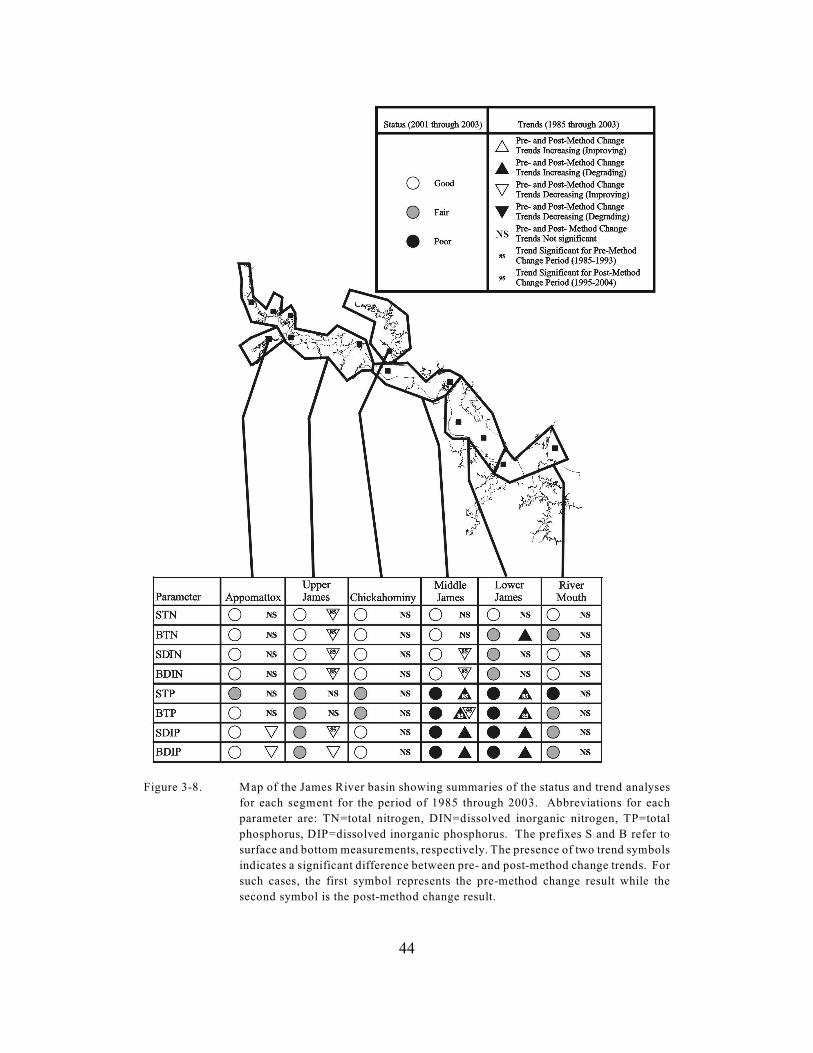
44
Figure 3-8. Map of the James River basin showing summaries of the status and trend analyses
for each segment for the period of 1985 through 2003. Abbreviations for each
parameter are: TN=total nitrogen, DIN=dissolved inorganic nitrogen, TP=total
phosphorus, DIP=dissolved inorganic phosphorus. The prefixes S and B refer to
surface and bottom measurements, respectively. The presence of two trend symbols
indicates a significant difference between pre- and post-method change trends. For
such cases, the first symbol represents the pre-method change result while the
second symbol is the post-method change result.
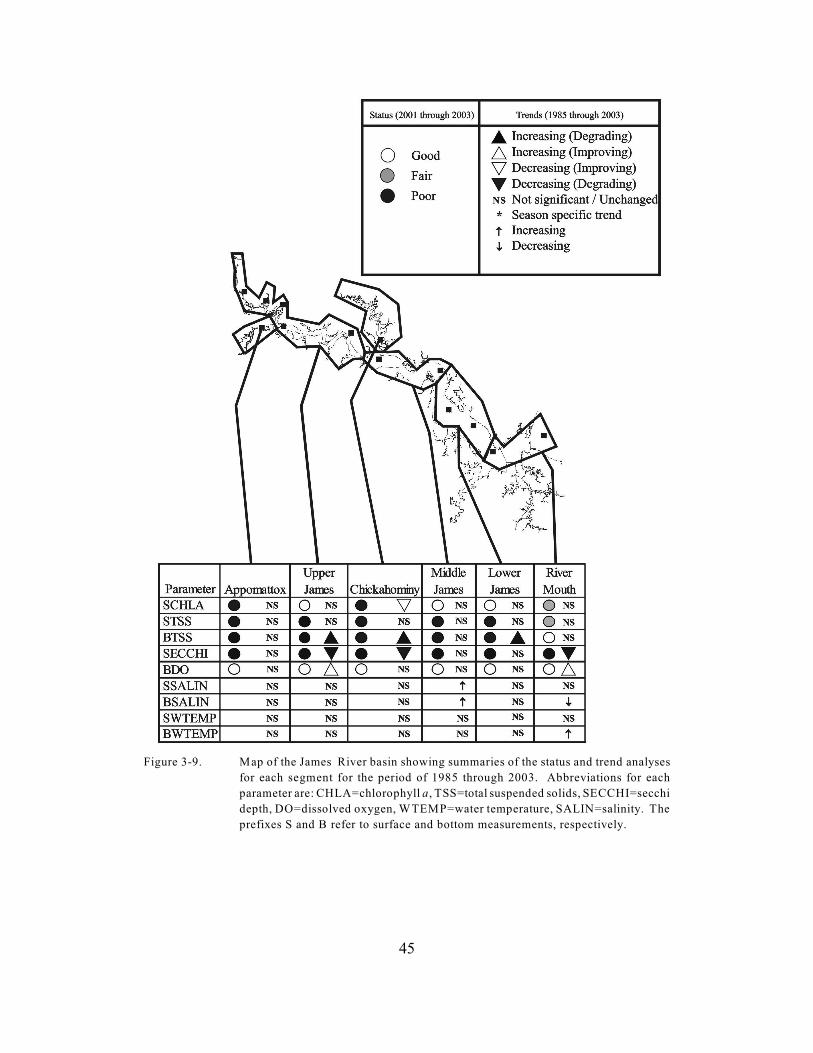
45
Figure 3-9. Map of the James River basin showing summaries of the status and trend analyses
for each segment for the period of 1985 through 2003. Abbreviations for each
parameter are: CHLA=chlorophyll a, TSS=total suspended solids, SECCHI=secchi
depth, DO=dissolved oxygen, WTEMP=water temperature, SALIN=salinity. The
prefixes S and B refer to surface and bottom measurements, respectively.
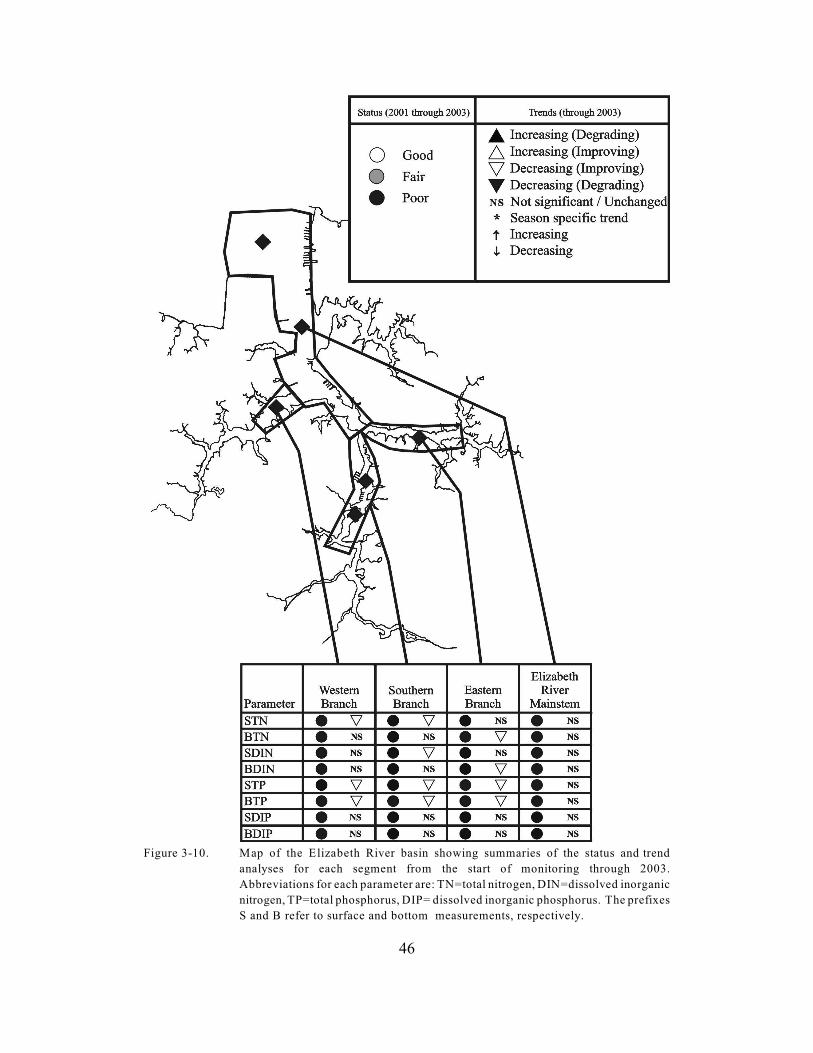
46
Figure 3-10. Map of the Elizabeth River basin showing summaries of the status and trend
analyses for each segment from the start of monitoring through 2003.
Abbreviations for each parameter are: TN=total nitrogen, DIN=dissolved inorganic
nitrogen, TP=total phosphorus, DIP= dissolved inorganic phosphorus. The prefixes
S and B refer to surface and bottom measurements, respectively.

47
Figure 3-11. Map of the Elizabeth River basin showing summaries of the status and trend
analyses for each segment from the start of monitoring through 2003. Abbreviations
for each parameter are: CHLA=chlorophyll a, TSS=total suspended solids,
SECCHI=secchi depth, DO=dissolved oxygen, WTEMP=water temperature,
SALIN=salinity. The prefixes S and B refer to surface and bottom measurements,
respectively.

48
Figure 3-12. Map of the James River basin showing summaries of the status and trend analyses
for phytoplankton bioindicators for each segment for the period 1985 through
2003.

49
Figure 3-13. Map of the James River basin showing summaries of the status and trend analyses
for benthic bioindicators for each segment for the period 1985 through 2003.

50
Table 3-1. Trends in flow adjusted concentrations (FAC) of water quality parameters at the James River
watershed RIM stations located in the Jackson River at Covington, the James River at Cartersville, the
James River at Scottsville, and the Appomattox River at Matoaca for the period 1985 through 2003.
Station Data Type Parameter T-statistic P value slope Direction
Jackson River at Covington FAC TN 0.4353 0.6748 0.0026 No Trend
Jackson River at Covington FAC TKN -0.6184 0.5535 -0.0007 No Trend
Jackson River at Covington FAC NH4 -3.0981 0.0147 -0.0346 Improving
Jackson River at Covington FAC NO23 -1.6638 0.1347 -0.0111 No Trend
Jackson River at Covington FAC TP -14.2633 0.0000 -0.1419 Improving
Jackson River at Covington FAC TSS -2.0570 0.0737 -0.0137 No Trend
James River at Bent Creek FAC TN -1.1930 0.2671 -0.0031 No Trend
James River at Bent Creek FAC TKN 3.4340 0.0089 0.0225 Degrading
James River at Bent Creek FAC NH4 -3.2629 0.0115 -0.0375 Improving
James River at Bent Creek FAC NO23 -4.6114 0.0017 -0.0560 Improving
James River at Bent Creek FAC TP -8.6212 0.0000 -0.0756 Improving
James River at Bent Creek FAC TSS 0.6613 0.5270 0.0181 No Trend
James River at Scottsville FAC TN 0.9845 0.3537 0.0082 No Trend
James River at Scottsville FAC TKN 0.7397 0.4806 0.0069 No Trend
James River at Scottsville FAC NH4 -5.2049 0.0008 -0.0532 Improving
James River at Scottsville FAC NO23 -1.3007 0.2296 -0.0263 No Trend
James River at Scottsville FAC TP -7.0269 0.0001 -0.0569 Improving
James River at Scottsville FAC TSS 1.4781 0.1776 0.0182 No Trend
James River at Cartersville FAC TN -1.9175 0.0915 -0.0077 No Trend
James River at Cartersville FAC NO23 -4.5689 0.0018 -0.0262 Improving
James River at Cartersville FAC TP -5.8521 0.0004 -0.0346 Improving
James River at Cartersville FAC DIP -9.0764 0.0000 -0.0578 Improving
James River at Cartersville FAC TSS -1.6902 0.1295 -0.0135 No Trend
Appomattox River at Matoaca FAC TN 0.4489 0.6654 0.0036 No Trend
Appomattox River at Matoaca FAC NO23 -1.9599 0.0857 -0.0127 No Trend
Appomattox River at Matoaca FAC TP -0.0909 0.9298 -0.0008 No Trend
Appomattox River at Matoaca FAC DIP -2.6323 0.0301 -0.0185 Improving
Appomattox River at Matoaca FAC TSS 1.0946 0.3056 0.0048 No Trend

51
Table 3-2. Annual season water quality status in the James, Appomattox, and Chickahominy rivers for the period
2001 through 2003 (values presented are median concentrations with secchi depth in meters,
chlorophyll a in µg/l, and all other parameters in mg/l).
Segment ParameterSurfaceMedian
SurfaceScore
SurfaceStatus
BottomMedian
BottomScore
BottomStatus
APPTF TN 0.8990 29.82 Good 0.9130 23.96 Good
APPTF DIN 0.3020 18.12 Good 0.3250 16.16 Good
APPTF TP 0.0922 47.24 Fair 0.0932 37.03 Good
APPTF PO4F 0.0185 33.60 Good 0.0180 36.66 Good
APPTF CHLA 15.63 77.39 Poor - - -
APPTF TSS 23.50 77.45 Poor 31.50 66.41 Poor
APPTF SECCHI 0.50 23.16 Poor - - -
JMSTF TN 0.8928 24.95 Good 1.0815 32.19 Good
JMSTF DIN 0.3648 26.41 Good 0.4010 27.45 Good
JMSTF TP 0.0844 39.83 Fair 0.1200 43.62 Fair
JMSTF PO4F 0.0258 37.81 Fair 0.0235 40.50 Fair
JMSTF CHLA 7.66 41.05 Good - - -
JMSTF TSS 16.25 71.63 Poor 51.00 75.77 Poor
JMSTF SECCHI 0.40 23.16 Poor - - -
CHKOH TN 0.7365 17.74 Good 0.7830 19.10 Good
CHKOH DIN 0.1465 11.41 Good 0.1395 8.22 Good
CHKOH TP 0.0739 36.17 Fair 0.0902 38.92 Fair
CHKOH PO4F 0.0125 30.90 Good 0.0130 33.32 Good
CHKOH CHLA 13.22 77.30 Poor - - -
CHKOH TSS 22.00 75.36 Poor 38.50 64.70 Poor
CHKOH SECCHI 0.50 12.80 Poor - - -
JMSOH TN 0.7250 24.39 Good 0.8385 30.82 Good
JMSOH DIN 0.3190 33.63 Good 0.2960 36.35 Good
JMSOH TP 0.0809 65.66 Poor 0.1131 75.78 Poor
JMSOH PO4F 0.0260 81.02 Poor 0.0275 75.88 Poor
JMSOH CHLA 6.44 30.83 Good - - -
JMSOH TSS 21.50 85.11 Poor 53.00 90.06 Poor
JMSOH SECCHI 0.48 12.80 Poor - - -
JMSMH TN 0.5300 22.18 Good 0.5828 43.11 Fair
JMSMH DIN 0.1400 39.12 Fair 0.1325 48.55 Fair
JMSMH TP 0.0588 71.22 Poor 0.0762 80.86 Poor
JMSMH PO4F 0.0265 92.54 Poor 0.0265 86.36 Poor
JMSMH CHLA 6.60 27.40 Good - - -
JMSMH TSS 13.00 67.33 Poor 27.50 76.64 Poor
JMSMH SECCHI 0.85 16.26 Poor - - -
JMSPH TN 0.4565 31.63 Good 0.4532 40.51 Fair
JMSPH DIN 0.0566 32.86 Good 0.0555 30.99 Good
JMSPH TP 0.0391 65.26 Poor 0.0432 47.01 Fair
JMSPH PO4F 0.0097 63.15 Fair 0.0098 46.92 Fair
JMSPH CHLA 7.57 48.30 Fair - - -
JMSPH TSS 9.95 59.43 Fair 15.39 38.59 Good
JMSPH SECCHI 1.15 17.55 Poor - - -
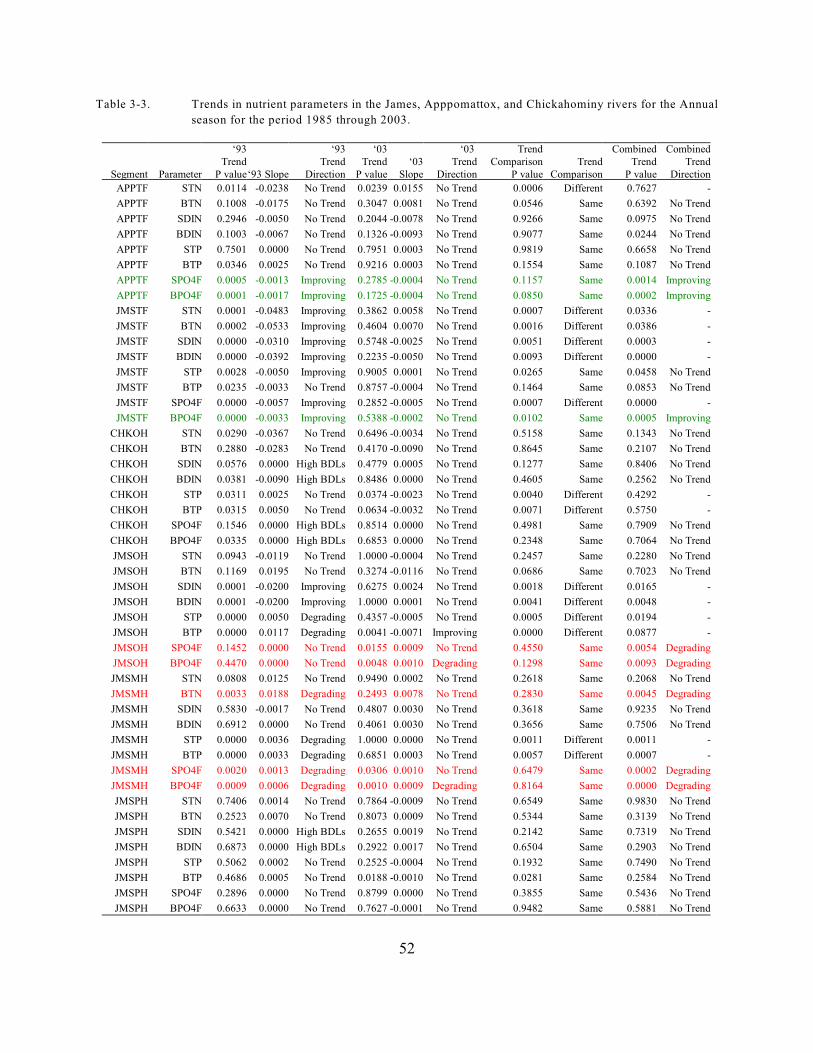
52
Table 3-3. Trends in nutrient parameters in the James, Apppomattox, and Chickahominy rivers for the Annual
season for the period 1985 through 2003.
Segment Parameter
‘93Trend
P value‘93 Slope
‘93Trend
Direction
‘03Trend
P value‘03
Slope
‘03 Trend
Direction
TrendComparison
P valueTrend
Comparison
CombinedTrend
P value
CombinedTrend
Direction
APPTF STN 0.0114 -0.0238 No Trend 0.0239 0.0155 No Trend 0.0006 Different 0.7627 -
APPTF BTN 0.1008 -0.0175 No Trend 0.3047 0.0081 No Trend 0.0546 Same 0.6392 No Trend
APPTF SDIN 0.2946 -0.0050 No Trend 0.2044 -0.0078 No Trend 0.9266 Same 0.0975 No Trend
APPTF BDIN 0.1003 -0.0067 No Trend 0.1326 -0.0093 No Trend 0.9077 Same 0.0244 No Trend
APPTF STP 0.7501 0.0000 No Trend 0.7951 0.0003 No Trend 0.9819 Same 0.6658 No Trend
APPTF BTP 0.0346 0.0025 No Trend 0.9216 0.0003 No Trend 0.1554 Same 0.1087 No Trend
APPTF SPO4F 0.0005 -0.0013 Improving 0.2785 -0.0004 No Trend 0.1157 Same 0.0014 Improving
APPTF BPO4F 0.0001 -0.0017 Improving 0.1725 -0.0004 No Trend 0.0850 Same 0.0002 Improving
JMSTF STN 0.0001 -0.0483 Improving 0.3862 0.0058 No Trend 0.0007 Different 0.0336 -
JMSTF BTN 0.0002 -0.0533 Improving 0.4604 0.0070 No Trend 0.0016 Different 0.0386 -
JMSTF SDIN 0.0000 -0.0310 Improving 0.5748 -0.0025 No Trend 0.0051 Different 0.0003 -
JMSTF BDIN 0.0000 -0.0392 Improving 0.2235 -0.0050 No Trend 0.0093 Different 0.0000 -
JMSTF STP 0.0028 -0.0050 Improving 0.9005 0.0001 No Trend 0.0265 Same 0.0458 No Trend
JMSTF BTP 0.0235 -0.0033 No Trend 0.8757 -0.0004 No Trend 0.1464 Same 0.0853 No Trend
JMSTF SPO4F 0.0000 -0.0057 Improving 0.2852 -0.0005 No Trend 0.0007 Different 0.0000 -
JMSTF BPO4F 0.0000 -0.0033 Improving 0.5388 -0.0002 No Trend 0.0102 Same 0.0005 Improving
CHKOH STN 0.0290 -0.0367 No Trend 0.6496 -0.0034 No Trend 0.5158 Same 0.1343 No Trend
CHKOH BTN 0.2880 -0.0283 No Trend 0.4170 -0.0090 No Trend 0.8645 Same 0.2107 No Trend
CHKOH SDIN 0.0576 0.0000 High BDLs 0.4779 0.0005 No Trend 0.1277 Same 0.8406 No Trend
CHKOH BDIN 0.0381 -0.0090 High BDLs 0.8486 0.0000 No Trend 0.4605 Same 0.2562 No Trend
CHKOH STP 0.0311 0.0025 No Trend 0.0374 -0.0023 No Trend 0.0040 Different 0.4292 -
CHKOH BTP 0.0315 0.0050 No Trend 0.0634 -0.0032 No Trend 0.0071 Different 0.5750 -
CHKOH SPO4F 0.1546 0.0000 High BDLs 0.8514 0.0000 No Trend 0.4981 Same 0.7909 No Trend
CHKOH BPO4F 0.0335 0.0000 High BDLs 0.6853 0.0000 No Trend 0.2348 Same 0.7064 No Trend
JMSOH STN 0.0943 -0.0119 No Trend 1.0000 -0.0004 No Trend 0.2457 Same 0.2280 No Trend
JMSOH BTN 0.1169 0.0195 No Trend 0.3274 -0.0116 No Trend 0.0686 Same 0.7023 No Trend
JMSOH SDIN 0.0001 -0.0200 Improving 0.6275 0.0024 No Trend 0.0018 Different 0.0165 -
JMSOH BDIN 0.0001 -0.0200 Improving 1.0000 0.0001 No Trend 0.0041 Different 0.0048 -
JMSOH STP 0.0000 0.0050 Degrading 0.4357 -0.0005 No Trend 0.0005 Different 0.0194 -
JMSOH BTP 0.0000 0.0117 Degrading 0.0041 -0.0071 Improving 0.0000 Different 0.0877 -
JMSOH SPO4F 0.1452 0.0000 No Trend 0.0155 0.0009 No Trend 0.4550 Same 0.0054 Degrading
JMSOH BPO4F 0.4470 0.0000 No Trend 0.0048 0.0010 Degrading 0.1298 Same 0.0093 Degrading
JMSMH STN 0.0808 0.0125 No Trend 0.9490 0.0002 No Trend 0.2618 Same 0.2068 No Trend
JMSMH BTN 0.0033 0.0188 Degrading 0.2493 0.0078 No Trend 0.2830 Same 0.0045 Degrading
JMSMH SDIN 0.5830 -0.0017 No Trend 0.4807 0.0030 No Trend 0.3618 Same 0.9235 No Trend
JMSMH BDIN 0.6912 0.0000 No Trend 0.4061 0.0030 No Trend 0.3656 Same 0.7506 No Trend
JMSMH STP 0.0000 0.0036 Degrading 1.0000 0.0000 No Trend 0.0011 Different 0.0011 -
JMSMH BTP 0.0000 0.0033 Degrading 0.6851 0.0003 No Trend 0.0057 Different 0.0007 -
JMSMH SPO4F 0.0020 0.0013 Degrading 0.0306 0.0010 No Trend 0.6479 Same 0.0002 Degrading
JMSMH BPO4F 0.0009 0.0006 Degrading 0.0010 0.0009 Degrading 0.8164 Same 0.0000 Degrading
JMSPH STN 0.7406 0.0014 No Trend 0.7864 -0.0009 No Trend 0.6549 Same 0.9830 No Trend
JMSPH BTN 0.2523 0.0070 No Trend 0.8073 0.0009 No Trend 0.5344 Same 0.3139 No Trend
JMSPH SDIN 0.5421 0.0000 High BDLs 0.2655 0.0019 No Trend 0.2142 Same 0.7319 No Trend
JMSPH BDIN 0.6873 0.0000 High BDLs 0.2922 0.0017 No Trend 0.6504 Same 0.2903 No Trend
JMSPH STP 0.5062 0.0002 No Trend 0.2525 -0.0004 No Trend 0.1932 Same 0.7490 No Trend
JMSPH BTP 0.4686 0.0005 No Trend 0.0188 -0.0010 No Trend 0.0281 Same 0.2584 No Trend
JMSPH SPO4F 0.2896 0.0000 No Trend 0.8799 0.0000 No Trend 0.3855 Same 0.5436 No Trend
JMSPH BPO4F 0.6633 0.0000 No Trend 0.7627 -0.0001 No Trend 0.9482 Same 0.5881 No Trend

53
Table 3-4. Trends in non-nutrient parameters in the James, Apppomattox, and Chickahominy rivers for the
Annual season for the period 1985 through 2003.
Segment Season Parameter % BDLs P value Slope Baseline % Change DirectionAPPTF Annual SCHLA 21.43 0.2261 -0.0470 30.94 0.00 No Trend
APPTF Annual STSS 0.00 0.6607 0.0000 19.50 0.00 No Trend
APPTF Annual BTSS 0.00 0.9092 0.0000 27.25 0.00 No Trend
APPTF Annual SECCHI 0.00 0.0171 0.0000 0.50 0.00 No Trend
APPTF Summer1 BDO 0.00 0.0414 0.0441 8.20 10.22 No Trend
APPTF Annual SSALINITY 0.00 0.0002 0.0000 0.01 0.00 Unchanged
APPTF Annual BSALINITY 0.00 0.0000 0.0000 0.01 0.00 Unchanged
APPTF Annual BWTEMP 0.00 0.0398 0.0682 19.00 6.82 No Trend
APPTF Annual SWTEMP 0.00 0.0288 0.0627 19.68 6.05 No Trend
JMSTF Annual SCHLA 42.26 0.5318 0.0000 6.67 0.00 High BDLs
JMSTF Annual STSS 15.72 0.2574 0.0833 14.75 0.00 No Trend
JMSTF Annual BTSS 3.05 0.0051 1.0000 172.00 11.05 Degrading
JMSTF Annual SECCHI 0.00 0.0000 -0.0067 0.70 -18.10 Degrading
JMSTF Summer1 BDO 0.00 0.0020 0.0409 6.35 12.25 Improving
JMSTF Annual SSALINITY 0.00 0.0000 0.0000 0.01 0.00 Unchanged
JMSTF Annual BSALINITY 0.00 0.0000 0.0000 0.01 0.00 Unchanged
JMSTF Annual BWTEMP 0.00 0.2484 0.0325 18.48 3.34 No Trend
JMSTF Annual SWTEMP 0.00 0.2141 0.0303 17.88 3.22 No Trend
CHKOH Annual SCHLA 7.75 0.0052 -0.4009 22.35 -28.71 Improving
CHKOH Annual STSS 0.00 0.0652 0.2500 17.50 22.86 No Trend
CHKOH Annual BTSS 0.00 0.0010 1.0000 27.00 59.26 Degrading
CHKOH Annual SECCHI 0.00 0.0000 -0.0091 0.60 -24.24 Degrading
CHKOH Summer1 BDO 0.00 0.2786 0.0250 5.75 6.96 No Trend
CHKOH Annual SSALINITY 0.00 0.0000 0.0000 0.01 0.00 Unchanged
CHKOH Annual BSALINITY 0.00 0.0000 0.0000 0.01 0.00 Unchanged
CHKOH Annual BWTEMP 0.00 0.4274 0.0162 15.60 1.67 No Trend
CHKOH Annual SWTEMP 0.00 0.5471 0.0187 16.00 1.87 No Trend
JMSOH Annual SCHLA 18.32 0.1169 -0.0810 7.22 0.00 No Trend
JMSOH Annual STSS 2.43 0.0235 -0.4354 662.00 -1.25 No Trend
JMSOH Annual BTSS 0.44 0.7409 -0.2308 290.00 -1.51 No Trend
JMSOH Annual SECCHI 0.00 0.1581 0.0000 0.53 0.00 No Trend
JMSOH Summer1 BDO 0.00 0.3814 -0.0090 6.88 -2.50 No Trend
JMSOH Annual SSALINITY 0.00 0.0092 0.0458 2.72 32.05 Increasing
JMSOH Annual BSALINITY 0.00 0.0037 0.0795 3.47 43.53 Increasing
JMSOH Annual BWTEMP 0.00 0.6057 0.0148 18.48 1.52 No Trend
JMSOH Annual SWTEMP 0.00 0.4608 0.0200 18.30 2.08 No Trend
JMSMH Annual SCHLA 28.21 0.6059 -0.0080 4.47 0.00 No Trend
JMSMH Annual STSS 8.83 0.4570 -0.0670 15.00 -8.48 No Trend
JMSMH Annual BTSS 3.96 0.0009 0.7500 142.00 10.04 Degrading
JMSMH Annual SECCHI 0.00 0.6075 0.0000 0.95 0.00 No Trend
JMSMH Summer1 BDO 0.00 0.8865 0.0000 6.20 0.00 No Trend
JMSMH Annual SSALINITY 0.00 0.1200 0.0995 14.96 12.64 No Trend
JMSMH Annual BSALINITY 0.00 0.2237 0.0500 18.35 5.18 No Trend
JMSMH Annual BWTEMP 0.00 0.5177 0.0127 19.90 1.21 No Trend
JMSMH Annual SWTEMP 0.00 0.8313 0.0053 20.13 0.50 No Trend
JMSPH Annual SCHLA 16.43 0.2888 0.0318 8.19 0.00 No Trend
JMSPH Annual STSS 7.74 0.1821 0.0708 8.25 16.29 No Trend
JMSPH Annual BTSS 2.06 0.5512 -0.0686 18.45 -7.07 No Trend
JMSPH Annual SECCHI 0.00 0.0007 -0.0111 1.30 -16.24 Degrading
JMSPH Summer1 BDO 0.00 0.0000 0.0500 5.95 15.97 Improving
JMSPH Annual SSALINITY 0.00 0.2982 -0.0417 21.56 -3.67 No Trend
JMSPH Annual BSALINITY 0.00 0.0000 -0.1418 24.64 -10.94 Decreasing
JMSPH Annual BWTEMP 0.00 0.0032 0.0623 16.95 6.99 Increasing
JMSPH Annual SWTEMP 0.00 0.9355 0.0000 17.40 0.00 No Trend

54
Table 3-5. SAV season water quality status in in the James, Appomattox, and Chickahominy rivers for the period
2001 through 2003 (values presented are median concentrations with secchi depth in meters,
chlorophyll a in µg/l, and all other parameters in mg/l).
Segment Parameter Season Layer Median Score StatusHabitat
Requirement
APPTF STN SAV S 0.8813 31.71 Good -
APPTF SDIN SAV S 0.2865 17.20 Good -
APPTF STP SAV S 0.0883 41.09 Fair -
APPTF SPO4F SAV S 0.0155 32.95 Good Borderline
APPTF SCHLA SAV S 11.25 66.84 Poor Fail
APPTF STSS SAV S 23.00 68.52 Poor Fail
APPTF SECCHI SAV S 0.40 22.00 Poor Fail
JMSTF STN SAV S 0.9010 27.69 Good -
JMSTF SDIN SAV S 0.3715 26.03 Good -
JMSTF STP SAV S 0.0814 36.75 Good -
JMSTF SPO4F SAV S 0.0250 38.82 Fair Fail
JMSTF SCHLA SAV S 6.15 20.38 Good Borderline
JMSTF STSS SAV S 20.00 70.11 Poor Borderline
JMSTF SECCHI SAV S 0.40 22.00 Poor Fail
CHKOH STN SAV S 0.7500 20.63 Good -
CHKOH SDIN SAV S 0.1435 10.61 Good -
CHKOH STP SAV S 0.0790 40.24 Fair -
CHKOH SPO4F SAV S 0.0125 32.42 Good Pass
CHKOH SCHLA SAV S 15.58 83.40 Poor Borderline
CHKOH STSS SAV S 23.50 75.78 Poor Fail
CHKOH SECCHI SAV S 0.40 12.08 Poor Fail
JMSOH STN SAV S 0.8108 31.91 Good -
JMSOH SDIN SAV S 0.3243 40.79 Fair -
JMSOH STP SAV S 0.0811 63.82 Poor -
JMSOH SPO4F SAV S 0.0270 78.91 Poor Fail
JMSOH SCHLA SAV S 5.88 28.26 Good Pass
JMSOH STSS SAV S 23.00 83.57 Poor Fail
JMSOH SECCHI SAV S 0.45 10.00 Poor Fail
JMSMH STN SAV S 0.6455 35.04 Good -
JMSMH SDIN SAV S 0.2973 55.34 Fair Borderline
JMSMH STP SAV S 0.0650 78.84 Poor -
JMSMH SPO4F SAV S 0.0308 92.57 Poor Fail
JMSMH SCHLA SAV S 4.28 18.21 Good Pass
JMSMH STSS SAV S 13.50 69.47 Poor Borderline
JMSMH SECCHI SAV S 0.83 13.55 Poor Fail
JMSPH STN SAV S 0.5022 38.91 Good -
JMSPH SDIN SAV S 0.0852 53.64 Fair Borderline
JMSPH STP SAV S 0.0470 73.06 Poor -
JMSPH SPO4F SAV S 0.0200 79.16 Poor Borderline
JMSPH SCHLA SAV S 7.67 51.55 Fair Pass
JMSPH STSS SAV S 11.72 69.35 Poor Pass
JMSPH SECCHI SAV S 1.05 13.49 Poor Pass

55
Table 3-6. Trends in nutrient parameters in the James, Apppomattox, and Chickahominy rivers for the SAV
season for the period 1985 through 2003.
Segment Parameter
‘93Trend
P value‘93 Slope
‘93Trend
Direction
‘03Trend
P value‘03
Slope
‘03 Trend
Direction
TrendComparison
P valueTrend
Comparison
CombinedTrend
P value
CombinedTrend
Direction
APPTF STN 0.0098 -0.0340 Improving 0.3933 0.0136 No Trend 0.0117 Same 0.1865 No Trend
APPTF SDIN 0.6861 -0.0024 No Trend 0.0238 -0.0142 No Trend 0.2401 Same 0.0661 No Trend
APPTF STP 0.1941 -0.0020 No Trend 0.8369 -0.0005 No Trend 0.4524 Same 0.2721 No Trend
APPTF SPO4F 0.0413 -0.0007 High BDLs 0.6188 -0.0002 No Trend 0.3080 Same 0.0720 No Trend
JMSTF STN 0.0000 -0.0513 Improving 0.9672 0.0015 No Trend 0.0025 Different 0.0037 -
JMSTF SDIN 0.0000 -0.0358 Improving 0.2515 -0.0058 No Trend 0.0089 Different 0.0000 -
JMSTF STP 0.0020 -0.0050 Improving 0.6933 -0.0006 No Trend 0.0636 Same 0.0134 No Trend
JMSTF SPO4F 0.0000 -0.0050 Improving 0.7823 0.0001 No Trend 0.0006 Different 0.0029 -
CHKOH STN 0.0546 -0.0375 No Trend 0.7733 -0.0030 No Trend 0.4985 Same 0.2125 No Trend
CHKOH BTN 0.7753 -0.0150 No Trend 0.8048 -0.0029 No Trend 0.9715 Same 0.6948 No Trend
CHKOH SDIN 0.4664 0.0000 High BDLs 0.0174 0.0017 No Trend 0.0131 Same 0.0836 No Trend
CHKOH BDIN 0.4344 0.0000 High BDLs 0.1843 0.0010 No Trend 0.1151 Same 0.4416 No Trend
CHKOH STP 0.1175 0.0020 No Trend 0.0639 -0.0027 No Trend 0.0160 Same 0.3951 No Trend
CHKOH BTP 0.0622 0.0063 No Trend 0.1165 -0.0037 No Trend 0.0205 Same 0.6736 No Trend
CHKOH SPO4F 0.3681 0.0000 High BDLs 0.2015 0.0004 No Trend 0.1230 Same 0.3869 No Trend
CHKOH BPO4F 0.0599 0.0000 High BDLs 0.0609 0.0003 No Trend 0.0132 Same 0.3179 No Trend
JMSOH STN 0.4530 -0.0050 No Trend 0.3143 0.0059 No Trend 0.2046 Same 0.8879 No Trend
JMSOH BTN 0.0535 0.0221 No Trend 0.7473 0.0063 No Trend 0.2599 Same 0.1023 No Trend
JMSOH SDIN 0.0020 -0.0173 Improving 0.0150 0.0123 No Trend 0.0001 Different 0.5611 -
JMSOH STP 0.0001 0.0050 Degrading 0.8130 -0.0003 No Trend 0.0040 Different 0.0128 -
JMSOH SPO4F 0.0083 0.0007 Degrading 0.0001 0.0015 Degrading 0.2744 Same 0.0000 Degrading
JMSMH STN 0.0285 0.0167 No Trend 0.0641 0.0104 No Trend 0.8819 Same 0.0039 Degrading
JMSMH SDIN 0.9656 0.0000 No Trend 0.0598 0.0101 No Trend 0.2081 Same 0.1671 No Trend
JMSMH STP 0.0000 0.0050 Degrading 0.2874 0.0016 No Trend 0.0098 Different 0.0000 -
JMSMH SPO4F 0.0054 0.0017 Degrading 0.0129 0.0014 No Trend 0.9096 Same 0.0002 Degrading
JMSPH STN 0.1055 0.0113 No Trend 0.9661 0.0001 No Trend 0.2784 Same 0.2284 No Trend
JMSPH SDIN 0.6665 -0.0001 High BDLs 0.2505 0.0054 No Trend 0.2498 Same 0.6280 No Trend
JMSPH STP 0.0009 0.0015 Degrading 0.7012 -0.0004 No Trend 0.0088 Different 0.0442 -
JMSPH SPO4F 1.0000 0.0000 No Trend 0.1298 0.0002 No Trend 0.2405 Same 0.2676 No Trend
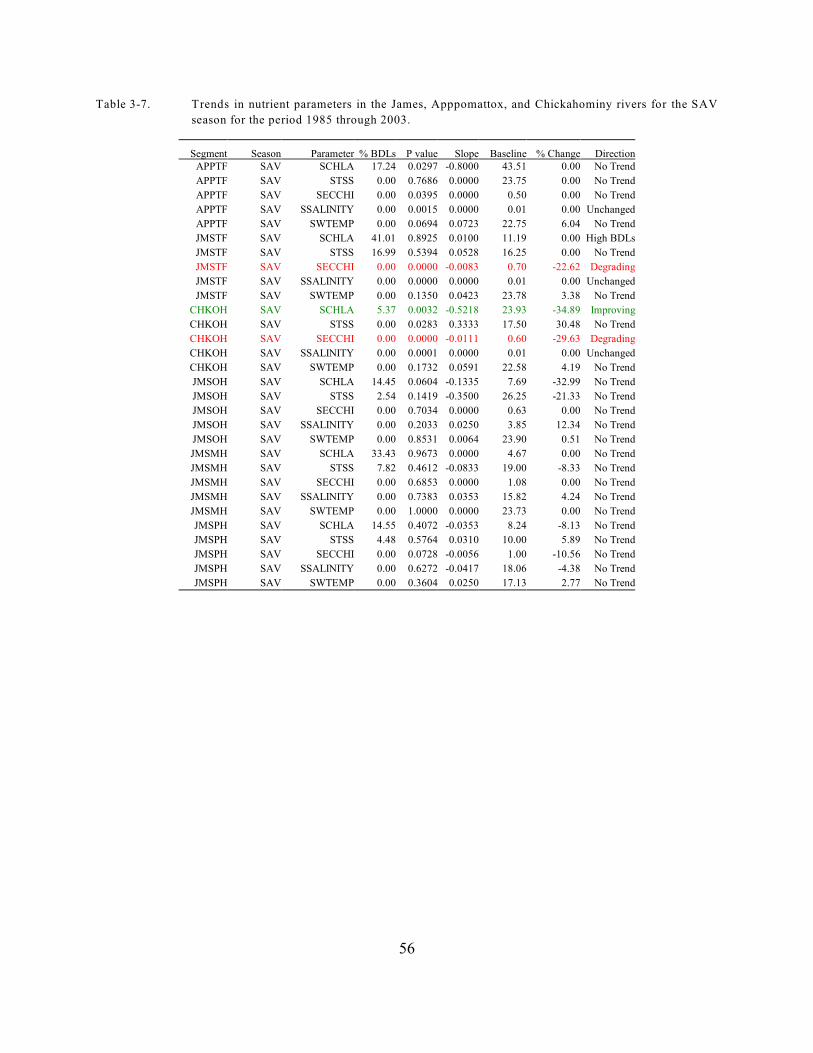
56
Table 3-7. Trends in nutrient parameters in the James, Apppomattox, and Chickahominy rivers for the SAV
season for the period 1985 through 2003.
Segment Season Parameter % BDLs P value Slope Baseline % Change DirectionAPPTF SAV SCHLA 17.24 0.0297 -0.8000 43.51 0.00 No Trend
APPTF SAV STSS 0.00 0.7686 0.0000 23.75 0.00 No Trend
APPTF SAV SECCHI 0.00 0.0395 0.0000 0.50 0.00 No Trend
APPTF SAV SSALINITY 0.00 0.0015 0.0000 0.01 0.00 Unchanged
APPTF SAV SWTEMP 0.00 0.0694 0.0723 22.75 6.04 No Trend
JMSTF SAV SCHLA 41.01 0.8925 0.0100 11.19 0.00 High BDLs
JMSTF SAV STSS 16.99 0.5394 0.0528 16.25 0.00 No Trend
JMSTF SAV SECCHI 0.00 0.0000 -0.0083 0.70 -22.62 Degrading
JMSTF SAV SSALINITY 0.00 0.0000 0.0000 0.01 0.00 Unchanged
JMSTF SAV SWTEMP 0.00 0.1350 0.0423 23.78 3.38 No Trend
CHKOH SAV SCHLA 5.37 0.0032 -0.5218 23.93 -34.89 Improving
CHKOH SAV STSS 0.00 0.0283 0.3333 17.50 30.48 No Trend
CHKOH SAV SECCHI 0.00 0.0000 -0.0111 0.60 -29.63 Degrading
CHKOH SAV SSALINITY 0.00 0.0001 0.0000 0.01 0.00 Unchanged
CHKOH SAV SWTEMP 0.00 0.1732 0.0591 22.58 4.19 No Trend
JMSOH SAV SCHLA 14.45 0.0604 -0.1335 7.69 -32.99 No Trend
JMSOH SAV STSS 2.54 0.1419 -0.3500 26.25 -21.33 No Trend
JMSOH SAV SECCHI 0.00 0.7034 0.0000 0.63 0.00 No Trend
JMSOH SAV SSALINITY 0.00 0.2033 0.0250 3.85 12.34 No Trend
JMSOH SAV SWTEMP 0.00 0.8531 0.0064 23.90 0.51 No Trend
JMSMH SAV SCHLA 33.43 0.9673 0.0000 4.67 0.00 No Trend
JMSMH SAV STSS 7.82 0.4612 -0.0833 19.00 -8.33 No Trend
JMSMH SAV SECCHI 0.00 0.6853 0.0000 1.08 0.00 No Trend
JMSMH SAV SSALINITY 0.00 0.7383 0.0353 15.82 4.24 No Trend
JMSMH SAV SWTEMP 0.00 1.0000 0.0000 23.73 0.00 No Trend
JMSPH SAV SCHLA 14.55 0.4072 -0.0353 8.24 -8.13 No Trend
JMSPH SAV STSS 4.48 0.5764 0.0310 10.00 5.89 No Trend
JMSPH SAV SECCHI 0.00 0.0728 -0.0056 1.00 -10.56 No Trend
JMSPH SAV SSALINITY 0.00 0.6272 -0.0417 18.06 -4.38 No Trend
JMSPH SAV SWTEMP 0.00 0.3604 0.0250 17.13 2.77 No Trend

57
Table 3-8. Annual season water quality status in the Eliazbeth River for the period 2001 through 2003 (values
presented are median concentrations with secchi depth in meters, chlorophyll a in µg/l, and all other
parameters in mg/l).
Segment ParameterSurfaceMedian
SurfaceScore
SurfaceStatus
BottomMedian
BottomScore
BottomStatus
EBEMH TN 0.8293 88.29 Poor 0.7285 82.93 Poor
EBEMH DIN 0.3786 89.51 Poor 0.3079 97.84 Poor
EBEMH TP 0.0536 80.15 Poor 0.0532 62.09 Poor
EBEMH PO4F 0.0372 98.85 Poor 0.0579 99.62 Poor
EBEMH CHLA 7.16 47.28 Fair - - -
EBEMH TSS 8.83 57.32 Fair 12.30 37.43 Good
EBEMH SECCHI 1.10 17.55 Poor - - -
WBEMH TN 0.6982 63.12 Poor 0.6976 75.94 Poor
WBEMH DIN 0.2510 72.64 Poor 0.2017 79.02 Poor
WBEMH TP 0.0637 89.16 Poor 0.0608 69.45 Poor
WBEMH PO4F 0.0452 99.68 Poor 0.0476 99.16 Poor
WBEMH CHLA 11.75 66.98 Poor - - -
WBEMH TSS 19.00 88.26 Poor 20.68 67.20 Poor
WBEMH SECCHI 0.70 6.08 Poor - - -
SBEMH TN 1.0335 98.38 Poor 0.9648 97.29 Poor
SBEMH DIN 0.5375 98.97 Poor 0.4967 99.82 Poor
SBEMH TP 0.0615 85.55 Poor 0.0624 75.81 Poor
SBEMH PO4F 0.0357 98.91 Poor 0.0548 99.29 Poor
SBEMH CHLA 4.18 16.56 Good - - -
SBEMH TSS 8.60 45.25 Fair 10.03 26.16 Good
SBEMH SECCHI 1.13 17.55 Poor - - -
ELIPH TN 0.6556 70.13 Poor 0.6000 74.53 Poor
ELIPH DIN 0.2143 77.21 Poor 0.2147 86.67 Poor
ELIPH TP 0.0554 84.71 Poor 0.0710 79.00 Poor
ELIPH PO4F 0.0414 98.64 Poor 0.0366 94.13 Poor
ELIPH CHLA 10.20 62.98 Poor - - -
ELIPH TSS 10.41 61.81 Poor 17.74 49.54 Fair
ELIPH SECCHI 1.03 13.04 Poor - - -

58
Table 3-9. Trends in nutrient parameters in the Elizabeth River for the Annual season for the period 1985 through
2003.
a) Seasonal Kendall results
Segment Season Parameter % BDLs P value Slope Baseline % Change Direction
EBEMH Annual STN 0.00 0.0177 -0.0099 1.040 -14.28 No Trend
EBEMH Annual BTN 0.00 0.0007 -0.0094 0.855 -16.45 Improving
EBEMH Annual SDIN 0.00 0.0290 -0.0077 0.507 -22.93 No Trend
EBEMH Annual BDIN 0.00 0.0003 -0.0100 0.490 -30.47 Improving
EBEMH Annual STP 0.00 0.0000 -0.0014 0.075 -27.25 Improving
EBEMH Annual BTP 0.00 0.0000 -0.0013 0.074 -27.31 Improving
EBEMH Annual SPO4F 6.90 0.1132 0.0006 0.018 29.64 No Trend
EBEMH Annual BPO4F 8.57 0.1097 0.0006 0.022 25.12 No Trend
WBEMH Annual STN 0.00 0.0006 -0.0094 0.800 -17.69 Improving
WBEMH Annual BTN 0.00 0.0137 -0.0069 0.791 -13.12 No Trend
WBEMH Annual SDIN 6.18 0.2220 -0.0012 0.198 -8.93 No Trend
WBEMH Annual BDIN 2.81 0.1867 -0.0022 0.257 -12.68 No Trend
WBEMH Annual STP 0.00 0.0000 -0.0019 0.083 -33.68 Improving
WBEMH Annual BTP 0.00 0.0000 -0.0017 0.080 -31.20 Improving
WBEMH Annual SPO4F 14.69 0.5195 0.0000 0.008 0.00 No Trend
WBEMH Annual BPO4F 13.48 0.8750 0.0000 0.013 0.00 No Trend
SBEMH Annual STN 0.00 0.0018 -0.0148 1.333 -16.66 Improving
SBEMH Annual BTN 0.00 0.3509 -0.0032 1.070 -4.46 No Trend
SBEMH Annual SDIN 0.00 0.0001 -0.0145 0.738 -29.44 Improving
SBEMH Annual BDIN 0.00 0.1401 -0.0044 0.586 -11.14 No Trend
SBEMH Annual STP 0.00 0.0000 -0.0011 0.074 -23.21 Improving
SBEMH Annual BTP 0.00 0.0000 -0.0015 0.079 -28.57 Improving
SBEMH Annual SPO4F 2.52 0.0999 0.0008 0.033 22.82 No Trend
SBEMH Annual BPO4F 5.32 0.4642 0.0005 0.037 11.59 No Trend
b) Blocked seasonal Kendal results
Segment Parameter
‘93 Trend
P value‘93 Slope
‘93 Trend
Direction
‘03 Trend
P value‘03
Slope
‘03 Trend
Direction
TrendComparison
P valueTrend
Comparison
CombinedTrend
P value
CombinedTrend
Direction
ELIPH STN 1.0000 0.0000 No Trend 0.0938 0.0102 No Trend 0.1928 Same 0.2091 No Trend
ELIPH BTN 1.0000 0.0000 No Trend 0.1156 0.0066 No Trend 0.2234 Same 0.2234 No Trend
ELIPH SDIN 0.9426 0.0002 No Trend 0.0326 0.0083 No Trend 0.1165 Same 0.0876 No Trend
ELIPH BDIN 0.8504 0.0000 No Trend 0.4888 0.0020 No Trend 0.6892 Same 0.4951 No Trend
ELIPH STP 0.8184 0.0000 No Trend 0.8564 0.0000 No Trend 1.0000 Same 0.7560 No Trend
ELIPH BTP 0.1060 0.0013 No Trend 0.6089 -0.0005 No Trend 0.1342 Same 0.4809 No Trend
ELIPH SPO4F 0.7632 0.0000 No Trend 0.4146 0.0003 No Trend 0.7030 Same 0.4066 No Trend
ELIPH BPO4F 0.5036 0.0000 No Trend 0.3200 0.0003 No Trend 0.7882 Same 0.2267 No Trend

59
Table 3-10. Trends in non-nutrient parameters in the Elizabeth River for the Annual season for the period 1985
through 2003.
Segment Season Parameter % BDLs P value Slope Baseline % Change Direction
ELIPH Annual SCHLA 16.54 0.5834 0.0180 8.63 0.00 No Trend
ELIPH Annual STSS 8.09 0.0153 -0.2000 8.00 -47.50 No Trend
ELIPH Annual BTSS 2.22 0.1449 -0.2833 16.00 -33.65 No Trend
ELIPH Annual SECCHI 0.00 0.0017 -0.0088 1.10 -15.24 Degrading
ELIPH Summer1 BDO 0.00 0.2408 0.0244 5.25 8.85 No Trend
ELIPH Annual SSALINITY 0.00 0.1644 -0.0781 21.01 -7.06 No Trend
ELIPH Annual BSALINITY 0.00 0.0765 -0.0600 24.08 -4.73 No Trend
ELIPH Annual BWTEMP 0.00 0.2994 0.0287 17.90 3.04 No Trend
ELIPH Annual SWTEMP 0.00 0.1336 0.0328 20.00 3.12 No Trend
EBEMH Annual SCHLA 1.15 0.3586 -0.0750 6.600 -17.05 No Trend
EBEMH Annual STSS 0.57 0.0086 -0.2040 9.950 -30.75 Improving
EBEMH Annual BTSS 0.00 0.0375 -0.2650 12.150 -32.72 No Trend
EBEMH Annual SECCHI 0.00 0.0743 0.0000 1.000 0.00 No Trend
EBEMH Summer1 BDO 0.00 0.0420 0.0760 3.250 35.08 No Trend
EBEMH Annual SSALINITY 0.00 0.0257 0.1150 16.850 10.24 No Trend
EBEMH Annual BSALINITY 0.00 0.6109 0.0329 18.400 2.68 No Trend
EBEMH Annual BWTEMP 0.00 0.0125 0.0921 15.900 8.69 No Trend
EBEMH Annual SWTEMP 0.00 0.1204 0.0486 17.000 4.29 No Trend
WBEMH Annual SCHLA 0.00 0.0083 -0.3733 23.000 -24.34 Improving
WBEMH Annual STSS 0.00 0.0160 -0.3233 20.600 -23.54 No Trend
WBEMH Annual BTSS 0.00 0.0367 -0.4380 20.500 -32.05 No Trend
WBEMH Annual SECCHI 0.00 0.0156 0.0000 0.600 0.00 No Trend
WBEMH Summer1 BDO 0.00 0.0243 0.1057 4.400 36.04 No Trend
WBEMH Annual SSALINITY 0.00 0.0191 0.1500 15.900 14.15 No Trend
WBEMH Annual BSALINITY 0.00 0.0801 0.1060 16.700 9.52 No Trend
WBEMH Annual BWTEMP 0.00 0.2048 0.0448 16.150 4.16 No Trend
WBEMH Annual SWTEMP 0.00 0.1486 0.0560 17.000 4.94 No Trend
SBEMH Annual SCHLA 1.99 0.0723 -0.1080 4.050 -40.01 No Trend
SBEMH Annual STSS 0.85 0.0118 -0.2000 8.575 -34.99 No Trend
SBEMH Annual BTSS 0.29 0.0000 -0.4903 13.075 -56.24 Improving
SBEMH Annual SECCHI 0.00 0.1156 0.0083 0.750 16.67 No Trend
SBEMH Summer1 BDO 0.00 0.0227 0.0909 2.650 51.46 No Trend
SBEMH Annual SSALINITY 0.00 0.0163 0.1691 14.750 17.20 No Trend
SBEMH Annual BSALINITY 0.00 0.4877 -0.0440 18.450 -3.57 No Trend
SBEMH Annual BWTEMP 0.00 0.0000 0.2100 17.100 18.42 Increasing
SBEMH Annual SWTEMP 0.00 0.0028 0.1142 18.200 9.41 Increasing

60
Table 3-11. SAV season water quality status in in the Elizabeth River for the period 2001 through 2003 (values
presented are median concentrations with secchi depth in meters, chlorophyll a in µg/l, and all other
parameters in mg/l).
Segment Parameter Season Layer Median Score StatusHabitat
Requirement
EBEMH STN SAV S 0.8632 91.63 Poor -
EBEMH SDIN SAV S 0.4212 88.82 Poor Fail
EBEMH STP SAV S 0.0536 80.89 Poor -
EBEMH SPO4F SAV S 0.0330 98.12 Poor Fail
EBEMH SCHLA SAV S 6.41 45.75 Fair Pass
EBEMH STSS SAV S 8.12 54.01 Fair Pass
EBEMH SECCHI SAV S 1.10 20.16 Poor Borderline
WBEMH STN SAV S 0.7487 72.75 Poor -
WBEMH SDIN SAV S 0.2878 74.06 Poor Borderline
WBEMH STP SAV S 0.0637 92.37 Poor -
WBEMH SPO4F SAV S 0.0469 99.62 Poor Fail
WBEMH SCHLA SAV S 9.40 65.31 Poor Borderline
WBEMH STSS SAV S 16.82 85.90 Poor Fail
WBEMH SECCHI SAV S 0.75 5.91 Poor Fail
SBEMH STN SAV S 1.0266 98.15 Poor -
SBEMH SDIN SAV S 0.5686 98.29 Poor Fail
SBEMH STP SAV S 0.0578 84.80 Poor -
SBEMH SPO4F SAV S 0.0344 97.50 Poor Fail
SBEMH SCHLA SAV S 2.65 4.76 Good Pass
SBEMH STSS SAV S 7.63 44.29 Fair Pass
SBEMH SECCHI SAV S 1.23 21.85 Poor Pass
ELIPH STN SAV S 0.7167 80.09 Poor -
ELIPH SDIN SAV S 0.2819 88.67 Poor Fail
ELIPH STP SAV S 0.0709 92.42 Poor -
ELIPH SPO4F SAV S 0.0375 98.35 Poor Borderline
ELIPH SCHLA SAV S 9.35 57.97 Poor Pass
ELIPH STSS SAV S 11.69 67.19 Poor Pass
ELIPH SECCHI SAV S 0.90 9.80 Poor Borderline

61
Table 3-12. Trends in nutrient parameters in the Elizabeth River for the SAV season for the period 1985 through
2003. Note collections of data in all segments except ELIPH begin in 1989.
a) Seasonal Kendall results
Segment Season Parameter % BDLs P value Slope Baseline % Change DirectionEBEMH SAV STN 0.00 0.2710 -0.0060 1.049 -8.58 No Trend
EBEMH SAV SDIN 0.00 0.0736 -0.0077 0.530 -21.88 No Trend
EBEMH SAV STP 0.00 0.0541 -0.0009 0.086 -14.91 No Trend
EBEMH SAV BTP 0.00 0.0006 -0.0013 0.099 -19.85 Improving
EBEMH SAV SPO4F 5.95 0.2225 -0.0006 0.066 -13.07 No Trend
WBEMH SAV STN 0.00 0.0112 -0.0088 0.813 -16.15 No Trend
WBEMH SAV SDIN 2.27 0.6815 -0.0005 0.246 -2.85 No Trend
WBEMH SAV STP 0.00 0.0000 -0.0022 0.110 -30.46 Improving
WBEMH SAV SPO4F 11.49 0.0001 -0.0010 0.051 -30.23 Improving
SBEMH SAV STN 0.00 0.0555 -0.0098 1.266 -11.57 No Trend
SBEMH SAV SDIN 0.00 0.0218 -0.0118 0.702 -25.21 No Trend
SBEMH SAV STP 0.00 0.0163 -0.0009 0.100 -14.20 No Trend
SBEMH SAV SPO4F 3.43 0.0604 -0.0008 0.067 -17.07 No Trend
b) Blocked seasonal Kendall results
Segment Parameter
‘93Trend
P value‘93 Slope
‘93Trend
Direction
‘03Trend
P value‘03
Slope
‘03 Trend
Direction
TrendComparison
P valueTrend
Comparison
CombinedTrend
P value
CombinedTrend
Direction
ELIPH STN 0.1387 0.0123 No Trend 0.0370 0.0130 No Trend 0.6432 Same 0.0104 No Trend
ELIPH SDIN 1.0000 0.0000 No Trend 0.1601 0.0072 No Trend 0.3079 Same 0.3079 No Trend
ELIPH STP 0.0048 0.0014 Degrading 0.8641 0.0000 No Trend 0.0700 Same 0.0341 No Trend
ELIPH SPO4F 0.8412 0.0000 No Trend 0.0516 0.0003 No Trend 0.1904 Same 0.1016 No Trend

62
Table 3-13. Trends in non-nutrient parameters in the Elizabeth River for the SAV season for the period 1985
through 2003. Note collections of data in all segments except ELIPH begin in 1989.
Segment Season Parameter % BDLs P value Slope Baseline % Change DirectionEBEMH SAV SCHLA 1.20 0.7671 0.0208 3.550 8.78 No Trend
EBEMH SAV STSS 1.16 0.1440 -0.1219 9.950 -18.38 No Trend
EBEMH SAV SECCHI 0.00 0.0633 0.0077 0.950 12.15 No Trend
EBEMH SAV SSALINITY 0.00 0.0667 0.1150 17.950 9.61 No Trend
EBEMH SAV SWTEMP 0.00 0.2071 0.0433 23.950 2.71 No Trend
WBEMH SAV SCHLA 0.00 0.0517 -0.3560 19.250 -27.74 No Trend
WBEMH SAV STSS 0.00 0.6643 -0.1102 26.300 -6.28 No Trend
WBEMH SAV SECCHI 0.00 0.0491 0.0000 0.550 0.00 No Trend
WBEMH SAV SSALINITY 0.00 0.0945 0.1171 17.150 10.25 No Trend
WBEMH SAV SWTEMP 0.00 0.3173 0.0382 24.200 2.37 No Trend
SBEMH SAV SCHLA 2.33 0.0880 -0.1631 3.725 -65.67 No Trend
SBEMH SAV STSS 0.56 0.1242 -0.1500 8.575 -26.24 No Trend
SBEMH SAV SECCHI 0.00 0.0585 0.0125 0.750 25.00 No Trend
SBEMH SAV BDO 0.00 0.0006 0.0886 4.200 31.63 Improving
SBEMH SAV SSALINITY 0.00 0.0299 0.1788 16.700 16.06 No Trend
SBEMH SAV SWTEMP 0.00 0.0132 0.1143 25.200 6.80 No Trend
ELIPH SAV SCHLA 15.22 0.8820 0.0049 7.70 0.00 No Trend
ELIPH SAV STSS 3.54 0.9472 0.0000 8.70 0.00 No Trend
ELIPH SAV SECCHI 0.00 0.0045 -0.0090 0.95 -17.91 Degrading
ELIPH SAV SSALINITY 0.00 0.7069 -0.0357 17.84 -3.80 No Trend
ELIPH SAV SWTEMP 0.00 0.0613 0.0625 17.18 6.91 No Trend
63
Literature Cited
Alden, R.W. III., R.S. Birdsong, D.M. Dauer, H.G. Marshall and R.M. Ewing, 1992a. VirginiaChesapeake Bay water quality and living resources monitoring programs: Comprehensivetechnical report, 1985-1989. Applied Marine Research Laboratory Technical Report No.848, Norfolk VA. Final Report to the Virginia State Water Control Board, Richmond,Virginia.
Alden, R.W. III, D.M. Dauer, J.A. Ranasinghe, L.C. Scott, and R.J. Llansó. 2002. Statisticalverification of the Chesapeake Bay Benthic Index of Biotic Integrity. Environmetrics13:473- 498.
Alden, R.W. III., R.M. Ewing, S.W. Sokolowski, J.C. Seibel, 1991. Long-term trends in waterquality of the Lower Chesapeake Bay. p. 502-522, In: New Perspectives in the ChesapeakeSystem: A Research and Management Partnership. Proceedings of a Conference.Chesapeake Research Consortium Publication No. 137, Solomons, MD., pp. 780.
Alden, R.W. III. and M.F. Lane, 1996. An assessment of the power and robustness of theChesapeake Bay Program Water Quality Monitoring Programs: Phase III - Refinementevaluations. Applied Marine Research Laboratory Technical Report No. 3002, Norfolk VA.Final Report to the Virginia State Water Control Board, Richmond, Virginia.
Alden, R.W. III., M.F. Lane, H. Lakkis, J.C. Seibel, 1992b. An assessment of the power androbustness of the Chesapeake Bay Program Water Quality Monitoring Programs: Phase I -Preliminary evaluations. Applied Marine Research Laboratory Technical Report No. 846,Norfolk VA. Final Report to the Virginia State Water Control Board, Richmond, Virginia.
Alden, R.W. III., M.F. Lane, H. Lakkis, J.C. Seibel, 1994. An assessment of the power androbustness of the Chesapeake Bay Program Water Quality Monitoring Programs: Phase II -Refinement evaluations. Applied Marine Research Laboratory Technical Report No. 965,Norfolk VA. Final Report to the Virginia State Water Control Board, Richmond, Virginia.
Alden, R.W. III, S.B. Weisberg, J.A. Ranasinghe and D.M. Dauer. 1997. Optimizing temporalsampling strategies for benthic environmental monitoring programs. Marine PollutionBulletin 34: 913-922.
Batiuk, R.A., R.J. Orth, K.A. Moore, W.C. Dennison, J.C. Stevenson, L.W. Staver, V. Carter, N.B.Rybicki, R.E. Hickman, S. Kollar, S. Beiber, and P. Heasly, 1992. Chesapeake BaySubmerged Aquatic Vegetation Habitat Requirements and Restoration Targets: A TechnicalSynthesis. CBP/TRS83/92. US Environmental Protection Agency Chesapeake Bay Program.Annapolis, MD., pp. 186.

64
Batiuk, R.A., P. Bergstrom, M. Kemp, E. Koch, L. Murray, J.C. Stevenson, R. Bartleson, V. Carter,N.B. Rybicki, J.M. Landwehr, C. Gallegos, L. Karrh, M. Naylor, D. Wilcox, K.A. Moore,S. Ailstock, and M. Teichberg, 2000. Chesapeake Bay Submerged Aquatic VegetationHabitat Requirements and Restoration Targets: A Second Technical Synthesis. USEnvironmental Protection Agency Chesapeake Bay Program , pp. 217.
Boynton, W.R., J.H. Garber, R. Summers, W.M. Kemp, 1995. Inputs, transformations, and transportof nitrogen and phosphorus in Chesapeake Bay and selected tributaries. Estuaries. 18:285-314.
Bricker, S.B., C.G. Clement, D.E. Pirhalla, S.P. Orlando, and D.R.G. Farrow, 1999. Nationalestuarine eutrophication assessment: effects of nutrient enrichment in the nations estuaries.NOAA, National Ocean Service, Special projects office and the National centers for CoastalOcean Science. Silver Spring, MD., 71 pp.
Carpenter, K.E. and M.F. Lane, 1998. Zooplankton Status and Trends in the Virginia Tributariesand Chesapeake Bay: 1985-1996. AMRL Technical Report No. 3064. Final Report to theVirginia Department of Environmental Quality, Richmond, Virginia. Applied MarineResearch Laboratory, Norfolk VA., pp. 28.
Dauer, D.M., 1993. Biological criteria, environmental health and estuarine macrobenthiccommunity structure. Mar. Pollut. Bull. 26: 249-257.
Dauer, D.M. 1997. Virginia Chesapeake Bay Monitoring Program. Benthic Communities Report.1985-1996. Final Report to the Virginia Department of Environmental Quality, pp. 92.
Dauer, D.M. 1999. Baywide benthic community condition based upon 1997 random probabilitybased sampling and relationships between benthic community condition, water quality,sediment quality, nutrient loads and land use patterns in Chesapeake Bay. Final report to theVirginia Department of Environmental Quality, pp.18.
DDaauueerr, D.M. 2004. Benthic Biological Monitoring Program of the Elizabeth River Watershed(2003). Final Report to the Virginia Department of Environmental Quality, Chesapeake BayProgram, 88 pp.
Dauer, D.M., M. F. Lane, H.G. Marshall, and K.E. Carpenter. 1998a. Status and trends in waterquality and living resources in the Virginia Chesapeake Bay: 1985-1997. Final report to theVirginia Department of Environmental Quality, pp. 86.
Dauer, D.M., M. F. Lane, H.G. Marshall, K.E. Carpenter and J.R. Donat. 2002. Status and trendsin water quality and living resources in the Virginia Chesapeake Bay: 1985-2000. Finalreport to the Virginia Department of Environmental Quality, pp. 149.

65
Dauer, D.M., H.G. Marshall, K.E. Carpenter, J.R. Donat, M. F. Lane, S. Doughten and F.J.Hoffman. 2003a. Status and trends in water quality and living resources in the VirginiaChesapeake Bay: James River (1985-2002). Final report to the Virginia Department ofEnvironmental Quality. 94 pp.
Dauer, D.M., H.G. Marshall, K.E. Carpenter, J.R. Donat, M. F. Lane, S. Doughten and F.J.Hoffman. 2003b. Status and trends in water quality and living resources in the VirginiaChesapeake Bay: York River (1985-2002). Final report to the Virginia Department ofEnvironmental Quality. 75 pp.
Dauer, D.M., H.G. Marshall, K.E. Carpenter, J.R. Donat, M. F. Lane, S. Doughten and F.J.Hoffman. 2003c. Status and trends in water quality and living resources in the VirginiaChesapeake Bay: Rappahannock River (1985-2002). Final report to the Virginia Departmentof Environmental Quality. 60 pp.
Dauer, D.M., Luckenbach, M.W. and A.J. Rodi, Jr., 1993. Abundance biomass comparison (ABCmethod):effects of an estuarine gradient, anoxic/hypoxic events and contaminated sediments.Mar. Biol. 116: 507-518.
Dauer, D.M., H.G. Marshall, K.E. Carpenter, M.F. Lane, R.W. Alden III, K.K. Nesius and L.W.Haas, 1998b. Virginia Chesapeake Bay Water Quality and Living Resources MonitoringPrograms: Executive Report, 1985-1996. Final Report to the Virginia Department ofEnvironmental Quality, Richmond, Virginia. Applied Marine Research Laboratory, NorfolkVA., pp. 28.
Dauer, D.M. and A.J. Rodi, Jr. 1998a. Benthic biological monitoring of the lower Chesapeake Bay.1996 Random Sampling. Virginia Department of Environmental Quality, Chesapeake BayProgram, pp. 137.
Dauer, D.M. and A.J. Rodi, Jr. 1998b. Benthic biological monitoring of the lower Chesapeake Bay.1997 Random Sampling. Virginia Department of Environmental Quality, Chesapeake BayProgram, pp. 132.
Dauer, D.M. and A.J. Rodi, Jr. 1999. Baywide benthic community condition based upon 1998random probability based sampling. Final report to the Virginia Department ofEnvironmental Quality, pp. 126.
Dauer, D.M. and A.J. Rodi, Jr. 2001. Baywide benthic community condition based upon 1999random probability based sampling. Final report to the Virginia Department ofEnvironmental Quality, pp. 154.

66
Dauer, D.M. and A.J. Rodi, Jr. 2002. Baywide benthic community condition based upon 2000random probability based sampling. Final report to the Virginia Department ofEnvironmental Quality, pp. 151.
Dauer, D.M., Rodi, Jr., A.J. and J.A. Ranasinghe, 1992. Effects of low dissolved oxygen events onthe macrobenthos of the lower Chesapeake Bay. Estuaries 15: 384-391.
Donat, J.R. and S.C. Doughten, 2003. Work/Quality Assurance Project Plan for Chesapeake BayMainstem and Elizabeth River Water Quality Monitoring Program. Revision 5. OldDominion University, Norfolk, VA. Prepared for the Virginia Department of EnvironmentalQuality, Richmond, VA., pp. 469.
Folk, R.L. 1974. Petrology of sedimentary rocks. Hemphill Publishing Co., Austin, Texas, pp. 182.
Gilbert, R.O., 1987. Statistical methods for environmental pollution monitoring. Van NostrandReinhold Co., New York, pp. 320.
Hagy, J.D., W.R. Boynton, C.W. Keefe, and K.V. Wood, 2004. Hypoxia in Chesapeake Bay, 1950-2001: Long-term change in relation to nutrient loading and river flow. Estuaries. 27:634-658.
Harding, L. W., Jr. and E. S. Perry. 1997. Long-term increase of phytoplankton biomass inChesapeake Bay, 1950-94. Mar. Ecol. Prog. Ser. 157: 39-52.
Lane, M.F., R.W. Alden III, and A.W. Messing, 1998. Water Quality Status and Trends in theVirginia Tributaries and Chesapeake Bay: 1985-1996. AMRL Technical Report No. 3067.Final Report to the Virginia Department of Environmental Quality, Richmond, Virginia.Applied Marine Research Laboratory, Norfolk VA., pp. 116.
Margalef, R., 1958. Information theory in ecology. Gen. Syst. 3:36-71.
Marshall, H.G. 1994. Chesapeake Bay phytoplankton: I. Composition. Proc. Biological Soc.Washington, 107:573-585.
Marshall, H.G. 1995. Succession of dinoflagellate blooms in the Chesapeake Bay, U.S.A. In: P.Lassus et al. (eds.) Harmful Marine Algal Blooms, Lavoisier, Intercept, Ltd., pp. 615-620.
Marshall, H.G. 1996. Toxin producing phytoplankton in Chesapeake Bay. Virginia J. Science,47:29-37.
Marshall, H.G. and R.W. Alden. 1990. A comparison of phytoplankton assemblages andenvironmental relationships in three estuarine rivers of the lower Chesapeake Bay. Estuaries,13:287-300.

67
Marshall, H.G. and L. Burchardt. 1998. Phytoplankton composition within the tidal freshwaterregion of the James River, Virginia. Proc. Biol Soc. Wash. 111:720-730.
Marshall, H.G. and L. Burchardt. 2003. Characteristic seasonal phytoplankton relationships in tidalfreshwater/oligohaline regions of two Virginia (U.S.A.) rivers. In: Algae and the BiologicalState of Water, Acta Botanica Warmiae et Masuriae 3:71-78.
Marshall, H.G. and L. Burchardt. 2004a. Monitoring phytoplankton populations and water qualityparameters in estuarine rivers of Chesapeake Bay, U.S.A. Oceanological andHydrobiological Studies, 33(1):55-64.
Marshall, H.G. and L. Burchardt. 2004b. Phytoplankton composition within the tidal freshwater-oligohaline regions of the Rappahannock and Pamunkey Rivers in Viginia. Castanea, InPress.
Marshall, H.G. and K.K. Nesius. 1996. Phytoplankton composition in relation to primaryproduction in Chesapeake Bay. Marine Biology, 125:611-617.
Marshall, H.G., K.K. Nesius, and M.F. Lane, 1998. Phytoplankton Status and Trends in the VirginiaTributaries and Chesapeake Bay: 1985-1996. AMRL Technical Report No. 3063. FinalReport to the Virginia Department of Environmental Quality, Richmond, Virginia. AppliedMarine Research Laboratory, Norfolk VA., pp. 33.
Park, G.S. and H,G. Marshall. 1993. Microzooplankton in the Lower Chesapeake Bay, and the tidalElizabeth, James, and York Rivers. Virginia J. Science, 44:329-340.
Ranasinghe, J.A., S.B. Weisberg, D.M. Dauer, L.C. Schaffner, R.J. Diaz and J.B. Frithsen, 1994.Chesapeake Bay benthic community restoration goals. Report for the U.S. EnvironmentalProtection Agency, Chesapeake Bay Office and the Maryland Department of NaturalResources, pp. 49.
Symposium on the Classification of Brackish Waters, 1958. The Venice system for the classificationof marine waters according to salinity. Oikos 9:11-12.
USEPA, 1982. Chesapeake Bay Program Technical Studies: A Synthesis. U. S. EnvironmentalProtection Agency, Region III. 635 pp.
USEPA, 1983. Chesapeake Bay Program, Chesapeake Bay: A Framework for Action. United StatesEnvironmental Protection Agency. Philadelphia, Pennsylvania.
USEPA, 2001. National Coastal Condition Report. U. S. Environmental Protection Agency, officeof Research and Development. EPA-620/R-01/005. 204 pp.
68
Venrick,E.L. 1978. How many cells to count. In: A. Sournia (ed.) Phytoplankton Manual.UNESCO Publ. Page Brothers Ltd., pp. 167-180.
Weisberg, S.B., A.F. Holland, K.J. Scott, H.T. Wilson, D.G. Heimbuch, S.C. Schimmel, J.B.Frithsen, J.F. Paul, J.K. Summers, R.M. Valente, J. Gerritsen, and R.W. Latimer. 1993.EMAP-Estuaries, Virginian Province 1990: Demonstration Project Report. EPA/600/R-92/100. U.S. Environmental Protection Agency, Washington, D.C.
Weisberg, S.B., J.A. Ranasinghe, D.M. Dauer, L.C. Schaffner, R.J. Diaz and J.B. Frithsen, 1997. Anestuarine benthic index of biotic integrity (B-IBI) for Chesapeake Bay. Estuaries. 20: 149-158.
69
Glossary of Important Terms
Anoxic - condition in which the water column is characterized by a complete absence of oxygen. Anoxic conditions
typically result from excessive decomposition of organic material by bacteria, high respiration by phytoplankton,
stratification of the water column due to salinity or temperature effects or a combination of these factors. Anoxic
conditions can result in fish kills or localized extinction of benthic communities.
Anthropogenic - resulting from or generated by human activities.
Benthos - refers to organisms that dwell on or within the bottom. Includes both hard substratum habitats (e.g. oyster
reefs) and sedimentary habitats (sand and mud bottoms).
B-IBI - the benthic index of biotic integrity of Weisberg et al. (1997). The B-IBI is a multi-metric index that compares
the condition of a benthic community to reference conditions.
Biological Nutrient Removal (BNR) - a temperature dependent process in which the ammonia nitrogen present in
wastewater is converted by bacteria first to nitrate nitrogen and then to nitrogen gas. This technique is used to reduce
the concentration of nitrogen in sewage treatment plant effluents.
Biomass - a quantitative estimate of the total mass of organisms for a particular population or community within a given
area at a given time. Biomass for phytoplankton is measured as the total carbon within a liter of water. Biomass for
the benthos is measured as the total ash-free dry weight per square meter of sediment habitat.
Chlorophyll a - a green pigment found in plant cells that functions as the receptor for energy in the form of sunlight.
This energy is used in the production of cellular materials for growth and reproduction in plants. Chlorophyll a
concentrations are measured in µg/L and are used as estimate of the total biomass of phytoplankton cells in the water
column. In general, high levels of chlorophyll a concentrations are believed to be indicative of excessive growth of
phytoplankton resulting from excess nutrients such as nitrogen and phosphorus in the water column.
Calanoid copepod - crustaceans of the subclass Copepoda and order Calanoida that are the dominant group of the
mesozooplankton in marine systems. Copepods in this group (e.g. Acartia tonsa) are one of the most important
consumers of phytoplankton in estuarine systems.
Chlorophytes - algae belonging to the division Chlorophyta often referred to as true “green algae.” Chlorophytes occur
in unicellular, colonial and filamentous forms and are generally more common in tidal freshwater and oligohaline
portions of estuaries.
Cladocerans - crustaceans of the class Branchipoda and class Cladocera commonly referred to as “water fleas.”
Although cladocerans are primarily found in tidal freshwater areas in estuaries, blooms of marine cladocerans
periodically occur in higher salinity areas. Some smaller species such as Bosmina longirostris are believed to be
indicators of poor water quality conditions.
Cryptomonads -algae belonging to the division Cryptophyta that have accessory pigments in addition to chlorophyll
a which give these small flagellated cells a red, brown or yellow color.
Cyanobacteria - algae belonging to the division Cyanophycea that are procaryotic and that occur in single-celled,
filamentous and colonial forms. In general, high concentrations of cyanobacteria are considered to be indicative of poor
water quality.
Cyclopoid copepod - crustaceans of the subclass Copepoda and order Cyclopoida that are the dominant group of the
mesozooplankton in marine systems. Copepods in this group (e.g. Mesocyclops edax) are one of the most important
consumers of phytoplankton in estuarine systems.

70
Diatoms - algae belonging to the division Bacillariophyta that have a cell wall that is composed primarily of silica and
that consists of two separate halves. Most diatoms are single-celled but some are colonial and filamentous forms.
Diatoms are generally considered to be indicative of good water quality and are considered to be appropriate food for
many zooplankton.
Dinoflagellates - biflagellated, predominately unicellular protists which are capable of performing photosynthesis. Many
dinoflagellates are covered with cellulose plates or with a series of membranes. Some dinoflagellates periodically
reproduce in large numbers causing blooms that are often referred to as “red tides.” Certain species produce toxins and
blooms of these forms have been implicated in fish kills. High concentrations of dinoflagellates are generally considered
to be indicative of poor water quality.
Dissolved oxygen (DO) - the concentration of oxygen in solution in the water column, measured in mg/L. Most
organisms rely on oxygen for cellular metabolism and as a result low levels of dissolved oxygen adversely affect
important living resources such as fish and the benthos. In general, dissolved oxygen levels decrease with increasing
pollution.
4Dissolved inorganic nitrogen (DIN) - the concentration of inorganic nitrogen compounds including ammonia (NH ),
3 2nitrates (NO ) and nitrites (NO ) in the water column measured in mg/L. These dissolved inorganic forms of nitrogen
are directly available for uptake by phytoplankton by diffusion without first undergoing the process of decomposition.
High concentrations of dissolved inorganic nitrogen can result in excessive growth of phytoplankton which in turn can
adversely effect other living resources.
Dissolved inorganic phosphorus (PO4F) - the concentration of inorganic phosphorus compounds consisting primarily
4of orthophosphates (PO ), The dissolved inorganic forms of phosphorus are directly available for uptake by
phytoplankton by diffusion without first undergoing the process of decomposition. High concentrations of dissolved
inorganic phosphorus can result in excessive growth of phytoplankton which in turn can adversely effect other living
resources.
Estuary - A semi-enclosed body of water that has a free connection with the open sea and within which seawater is
diluted measurably with freshwater derived from land drainage.
Eucaryote - organisms the cells of which have discrete organelles and a nucleus separated from the cytoplasm by a
membrane.
Fall-line - location of the maximum upstream extent of tidal influence in an estuary typically characterized by a waterfall.
Fixed Point Stations - stations for long-term trend analysis whose location is unchanged over time.
Flow adjusted concentration (FAC) - concentration value which has been recalculated to remove the variation caused
by freshwater flow into a stream. By removing variation caused by flow, the effects of other factors such as nutrient
management strategies can be assessed.
Holoplankton - zooplankton such as copepods or cladocerans that spend their entire life cycle within the water column.
Habitat - a local environment that has a community distinct from other such habitat types. For the B-IBI of Chesapeake
Bay seven habitat types were defined as combinations of salinity and sedimentary types - tidal freshwater, oligohaline,
low mesohaline, high mesohaline sand, high mesohaline mud, polyhaline sand and polyhaline mud.
Hypoxic - condition in which the water column is characterized by dissolved oxygen concentrations less than 2 mg/L
but greater than 0 mg/L. Hypoxic conditions typically result from excessive decomposition of organic material by
bacteria, high respiration by phytoplankton, stratification of the water column due to salinity or temperature effects or
a combination of these factors. Hypoxic conditions can result in fish kills or localized extinction of benthic communities.
71
Light attenuation (KD) - Absorption, scattering, or reflection of light by dissolved or suspended material in the water
column expressed as the change in light extinction per meter of depth. Light attenuation reduces the amount of light
available to submerged aquatic vegetation.
Loading - the total mass of contaminant or nutrient added to a stream or river generally expressed in lbs/yr.
Macrobenthos - a size category of benthic organisms that are retained on a mesh of 0.5 mm.
Meroplankton - temporary zooplankton consisting of the larval stages of organisms whose adult stages are not
planktonic.
Mesohaline - refers to waters with salinity values ranging between 0.5 and 18.0 ppt.
Mesozooplankton - zooplankton with a maximum dimension ranging between 63 µm and 2000 µm. This size category
consists primarily of adults stages of copepods, cladocerans, mysid shrimp, and chaetognaths, as well as, the larval stages
of a variety of invertebrates and fish.
Metric - a parameter or measurement of community structure (e.g., abundance, biomass, species diversity).
Microzooplankton - zooplankton with a maximum dimension ranging between 2 µm and 63 µm. This size category
consists primarily of single-celled protozoans, rotifers and the larval stages of copepods, cladocerans and other
invertebrates.
Nauplii - earliest crustacean larval stage characterized by a single simple eye and three pairs of appendages.
Non-point source - a source of pollution that is distributed widely across the landscape surrounding a water body instead
of being at a fixed location (e.g. run-off from residential and agricultural land).
Oligohaline - refers to waters with salinity values ranging between 0.5 and 5.0 ppt.
Oligotrich - protists of the phylum Ciliophora and order Oligotricha. These ciliates are important predators of small
phytoplankton in marine systems.
Percent of light at the leaf surface (PLL) - the percentage of light at the surface of the water column that reaches the
surface of the leaves of submerged aquatic vegetation generally estimated for depths of 0.5 m and 1.0 m. Without
sufficient light at the leaf surface, submerged aquatic plants cannot perform photosynthesis and hence cannot grow or
reproduce.
Phytoplankton - that portion of the plankton capable of producing its own food by photosynthesis. Typical members
of the phytoplankton include diatoms, dinoflagellates and chlorophytes.
Picoplankton - phytoplankton with a diameter between 0.2 and 2.0 µm in diameter. Picoplankton consists primarily
of cyanobacteria and high concentrations of picoplankton are generally considered to be indicative of poor water quality
conditions.
Pielou’s evenness - an estimate of the distribution of proportional abundances of individual species within a community.
Evenness (J) is calculated as follows: J=H’/lnS where H’ is the Shannon - Weiner diversity index and S is the number
of species.
Plankton - aquatic organisms that drift within and that are incapable of movement against water currents. Some plankton
have limited locomotor ability that allows them to change their vertical position in the water column.

72
Point source - a source of pollution that is concentrated at a specific location such as the outfall of a sewage treatment
plant or factory.
Polyhaline - refers to waters with salinity values ranging between 18.0 and 30 ppt.
Primary productivity - the rate of production of living material through the process of photosynthesis that for
phytoplankton is typically expressed in grams of carbon per liter of water per hour. High rates of primary productivity
are generally considered to be related to excessive concentrations of nutrients such as nitrogen and phosphorus in the
water column.
Probability based sampling - all locations within a stratum have an equal chance of being sampled. Allows estimation
of the percent of the stratum meeting or failing the benthic restoration goals.
Procaryote - organisms the cells of which do not have discrete organelles or a nucleus (e.g. Cyanobacteria).
Pycnocline - a rapid change in salinity in the water column indicating stratification of water with depth resulting from
either changes in salinity or water temperature.
Random Station - a station selected randomly within a stratum. In every succeeding sampling event new random
locations are selected.
Recruitment - the successful dispersal settlement and development of larval forms of plants or animal to a reproducing
adult.
Reference condition - the structure of benthic communities at reference sites.
Reference sites - sites determined to be minimally impacted by anthropogenic stress. Conditions at theses sites are
considered to represent goals for restoration of impacted benthic communities. Reference sites were selected by
Weisberg et al. (1997) as those outside highly developed watersheds, distant from any point-source discharge, with no
sediment contaminant effect, with no low dissolved oxygen effect and with a low level of organic matter in the sediment.
Restoration Goal - refers to obtaining an average B-IBI value of 3.0 for a benthic community indicating that values for
metrics approximate the reference condition.
Riparian Buffer - An area of trees and shrubs a minium of 100 feet wide located up gradient, adjacent, and parallel to
the edge of a water feature which serves to: 1) reduce excess amounts of sediment, organic matter, nutrients, and other
pollutants in surface runoff, 2) reduce soluble pollutants in shallow ground water flow, 3) create shade along water bodies
to lower aquatic temperatures, 4) provide a source of detritus and large woody debris aquatic organisms, 5) provide
riparian habitat and corridors for wildlife, and 6) reduce erosion of streambanks and shorelines
Rotifer - small multicellular planktonic animal of phylum Rotifera. These organisms are a major component of the
microzooplankton and are major consumers of phytoplankton. High densities of rotifers are believed to be indicative
of high densities of small phytoplankton such as cyanobacteria and as such are believed to be indicative of poor water
quality.
Salinity - the concentration of dissolved salts in the water column measured in mg/L, ppt or psu. The composition and
distribution of plant and animal communities is directly affected by salinity in estuarine systems. The effects of salinity
on living resources must be taken into consideration when interpreting the potential effects of human activities on living
resources.
73
Sarcodinians - single celled protists of the subphylum Sarcodina which includes amoeba and similar forms,
characterized by possession of pseudopodia. Planktonic forms of sarcodinians typically have a external shell or test
constructed of detrital or sedimentary particles and are important consumers of phytoplankton.
Secchi depth - the depth of light penetration expressed in meters as measured using a secchi disk. Light penetration
depth directly affects the growth and recruitment of submerge aquatic vegetation.
Shannon Weiner diversity index - a measure of the number of species within a community and the relative abundances
of each species. The Shannon Weiner index is calculated as follows:
iwhere p is the proportion of the ith species and S is the number of species.
Stratum - a geographic region of unique ecological condition or managerial interest.
Submerged aquatic vegetation (SAV) - rooted vascular plants (e.g. eelgrass, widgeon grass, sago pondweed) that grow
in shallow water areas . SAV are important in marine environments because they serve as major food source, provide
refuge for juvenile crabs and fish, stabilize sediments preventing shoreline erosion and excessive suspended materials
in the water column, and produce oxygen in the water column.
Threshold - a value of a metric that determines the B-IBI scoring. For all metrics except abundance and biomass, two
thresholds are used - the lower 5 percentile and the 50 percentile (median) of the distribution of values at referenceth th
sites. Samples with metric values less than the lower 5 percentile are scored as a 1. Samples with values between theth
5 and 50 metrics are scored as 3 and values greater than the 50 percentile are scored as 5. For abundance andth th th
biomass, values below the 5 and above the 95 percentile are scored as 1, values between the 5 and 25 and the 75th th th th th
and 95 percentiles are scored as 3 and values between the 25 and 75 percentiles are scored as 5.th th th
Tidal freshwater - refers to waters with salinity values ranging between 0 and 0.5 ppt which are located in the upper
reaches of the estuary at or just below the maximum upstream extent of tidal influence.
Tintinnid - protists of phylum Ciliophora and order Oligotricha. These ciliates are important predators of small
phytoplankton in marine systems. Tintinnids are distinguished from other members of this group because they create an
exoskeleton or test made of foreign particles that have been cemented together.
Total nitrogen (TN) - the concentration of both inorganic and organic compounds in the water column which contain
nitrogen measured in mg/L. Nitrogen is a required nutrient for protein synthesis. Inorganic forms of nitrogen are directly
available for uptake by phytoplankton while organic compounds must first be decomposed by bacteria prior to being
available for use for other organisms. High levels of total nitrogen are considered to be detrimental to living resources
either as a source of nutrients for excessive phytoplankton growth or as a source of excessive bacterial decomposition
that can increase the incidence and extent of anoxic or hypoxic events.
Total phosphorus (TP) - the concentration of both inorganic and organic compounds in the water column which contain
phosphorus measured in mg/L. Phosphorus is a required nutrient for cellular metabolism and for the production of cell
membranes. Inorganic forms of phosphorus are directly available for uptake by phytoplankton while organic compounds
must first be decomposed by bacteria prior to being available for use for other organisms. High levels of total nitrogen
are considered to be detrimental to living resources either as a source of nutrients for excessive phytoplankton growth
or as a source of excessive bacterial decomposition that can increase the incidence and extent of anoxic or hypoxic
events.

74
Total suspended solids (TSS) - the concentration of suspended particles in the water column, measured in mg/L. The
composition of total suspended solids includes both inorganic (fixed) and organic (volatile) compounds. The fixed
suspended solids component is comprised of sediment particles while the volatile suspended solids component is
comprised of detrital particles and planktonic organisms. The concentration of total suspended solids directly affects
water clarity which in turn affects the development and growth of submerged aquatic vegetation.
Zoea - last planktonic larval stage of crustaceans such as crabs and shrimp. Numbers of crab zoea may reflect the
recruitment success of adult crabs.
Zooplankton - the animal component of the plankton which typically includes copepods, cladocerans, jellyfish and many
other forms.