old town north small area plan eco-district old town north small area plan 1 city of alexandria,...
TRANSCRIPT
1Old Town North Small Area Plan Eco-District
City of Alexandria, Virginia
Old Town North Small Area Plan
Eco-District

2Old Town North Small Area Plan Eco-District
3Old Town North Small Area Plan Eco-District
City CouncilAllison Silberberg, MayorJustin M. Wilson, Vice MayorWillie F. Bailey, Sr.John T. ChapmanTimothy B. LovainRedella S. Pepper Paul C. Smedberg
Planning CommissionDavid BrownStephen KoenigMindy LyleMary Lyman, ChairNathan MacekMaria Wasowski
OTN SAP Advisory GroupMaria Wasowski, Chair Steven Arabia Engin Artemel Scott Barstow Anna Bentley Chip Carlin Elizabeth ChimentoHerbert J. (Herb) Cooper-Levy Krista Di laconiAustin FlajserStephen Goodman Carolyn Griffin Kevin Harris Marie McKenney TaverniniBruce M. MachanicJesse O'Connell Thomas F. SoapesDavid Speck Jeff StrupChrista Watters
ACKNOWLEDGEMENTS
Environmental Policy CommissionNatasha Garcia Andersen Scott Barstow Susan Gitlin, Vice-ChairGeoffrey GoodeJohn Irizarry James Kapsis, ChairAaron KartyJessica LassetterStephen MiloneTyler Orton Carolyn Schroeder Kyle Winslow
Consultant TeamSmithGroupJJRMerrill St. Leger Greg MellaStephen ConschafterValerie BersteneDon Posson
Greening Urban Chris EarleyGary Woolsey
All photos by SmithGroupJJR unless noted otherwise
Department Of Planning And ZoningCarrie BeachHeba El-GawishJeffrey FarnerKarl MoritzJames RobertsNancy Williams, SAP Project Manager
Department Of Transportation and Environmental ServicesErin Bevis-CarterSara DeGrootLisa GoldbergYon LambertJesse MainesBrian RahalLalit SharmaSteve SindiongWilliam SkrabakKhoa Tran, Project Manager
Department of General ServicesBill Eger
4Old Town North Small Area Plan Eco-District
Executive Summary.................................................................................................................61 Introduction ..................................................................................................................9
1.1 Overview ................................................................................................................................................................. 91.2 Old Town North (OTN) Small Area Plan .................................................................................................................... 11
2 Citywide Goals and Targets ............................................................................................133 Energy and Carbon ........................................................................................................17
3.1 Energy Use of Existing Buildings in OTN ...................................................................................................................183.2 Projected Energy Use of Future Buildings in OTN ......................................................................................................193.3 Energy Conservation Strategies for Existing Buildings and Major Renovations..........................................................21
Understanding the Energy Use of Existing Commercial and Residential BuildingsEnergy Conservation Strategies for Existing Commercial BuildingsEnergy Conservation Strategies for Existing Residential BuildingsCombining Energy Strategies for Existing Commercial PropertiesCombining Energy Strategies for Existing Residential PropertiesIncentives to Improve Energy Consumption in Existing PropertiesDisclosure OrdinancesBringing the Existing Building Stock up to Code
3.4 Energy Reduction Strategies for Future Buildings ................................................................................................... 28Understanding the Energy Use of Future Commercial and Residential BuildingsEnergy Strategies for Future BuildingsEnergy Conservation Strategies for Future Commercial BuildingsEnergy Conservation Strategies for Future Residential BuildingsDistrict EnergyCombining Energy Strategies for Future Commercial PropertiesCombining Energy Strategies for Future Residential Properties
3.5 Solar Energy ........................................................................................................................................................... 39Solar Energy Potential in OTNSolar Co-OpsSolar Photovoltaics and Energy Demand
3.6 Energy Targets for the OTN Eco-District ....................................................................................................................453.7 Cumulative Impacts ................................................................................................................................................ 463.8 Cost Considerations for Energy Improvements ......................................................................................................... 47
TABLE OF CONTENTS
5Old Town North Small Area Plan Eco-District
4. Water .......................................................................................................................... 514.1 Water Consumption of Existing Buildings in OTN .................................................................................................... 524.2 Projected Water Consumption of Future Buildings in OTN ....................................................................................... 52
Total Water Consumption4.3 Water Conservation Strategies ............................................................................................................................... 54
Purple Pipe DistrictsCombining Water Conservation Strategies
4.4 Water Targets for the OTN Eco-District .................................................................................................................... 594.5 Cumulative Impacts ............................................................................................................................................... 604.6 Payback of Water Conservation Approaches ........................................................................................................... 61
4.7 Incentives for Water Conservation .......................................................................................................................... 61
5. Stormwater ..................................................................................................................635.1 Existing Stormwater Conditions in OTN .................................................................................................................. 64
Combined Stormwater – Sewer SystemResource Protection Areas
5.2 Stormwater Strategies ........................................................................................................................................... 65Examples of Stormwater Strategies
5.3 Combining Stormwater Strategies .......................................................................................................................... 695.4 Stormwater Targets for the OTN Eco-District ........................................................................................................... 705.5 Incentives...............................................................................................................................................................705.6 Costs for Stormwater Management BMPs ...............................................................................................................71
6. Tree Canopy and Habitat .............................................................................................. 736.1 Existing Natural Areas in Old Town Alexandria ....................................................................................................... 74
Existing Natural Areas with OTNExisting Tree Canopy in OTNCreating Habitat
6.2 Sea Level Rise ........................................................................................................................................................ 766.3 Tree Canopy and Habitat Strategies ........................................................................................................................ 776.4 Tree Canopy and Habitat Targets for the OTN Eco-District .........................................................................................79
Potential Future Tree Canopy and Habitat6.5 Benefits of Tree Canopy Increases ............................................................................................................................80
6Old Town North Small Area Plan Eco-District
Executive Summary
The purpose of the Eco-District Study document is to provide the City and Old Town North (OTN) stakeholders including residents, businesses, property owners, developers, homeowner associations, the Environmental Policy Commission and others, with information on potential strategies and targets to help achieve an increased level of sustainability in all aspects of its built and natural environment.
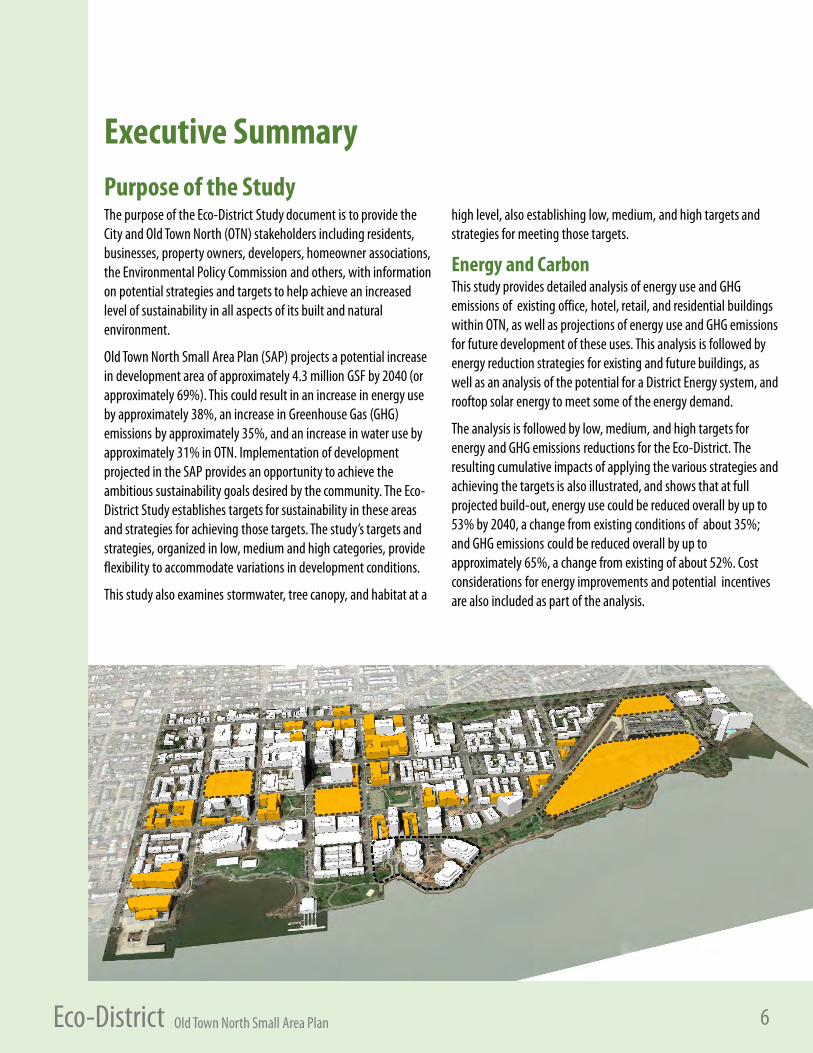
Old Town North Small Area Plan (SAP) projects a potential increase in development area of approximately 4.3 million GSF by 2040 (or approximately 69%). This could result in an increase in energy use by approximately 38%, an increase in Greenhouse Gas (GHG) emissions by approximately 35%, and an increase in water use by approximately 31% in OTN. Implementation of development projected in the SAP provides an opportunity to achieve the ambitious sustainability goals desired by the community. The Eco-District Study establishes targets for sustainability in these areas and strategies for achieving those targets. The study’s targets and strategies, organized in low, medium and high categories, provide flexibility to accommodate variations in development conditions.
This study also examines stormwater, tree canopy, and habitat at a
high level, also establishing low, medium, and high targets and strategies for meeting those targets.
Energy and CarbonThis study provides detailed analysis of energy use and GHG emissions of existing office, hotel, retail, and residential buildings within OTN, as well as projections of energy use and GHG emissions for future development of these uses. This analysis is followed by energy reduction strategies for existing and future buildings, as well as an analysis of the potential for a District Energy system, and rooftop solar energy to meet some of the energy demand.
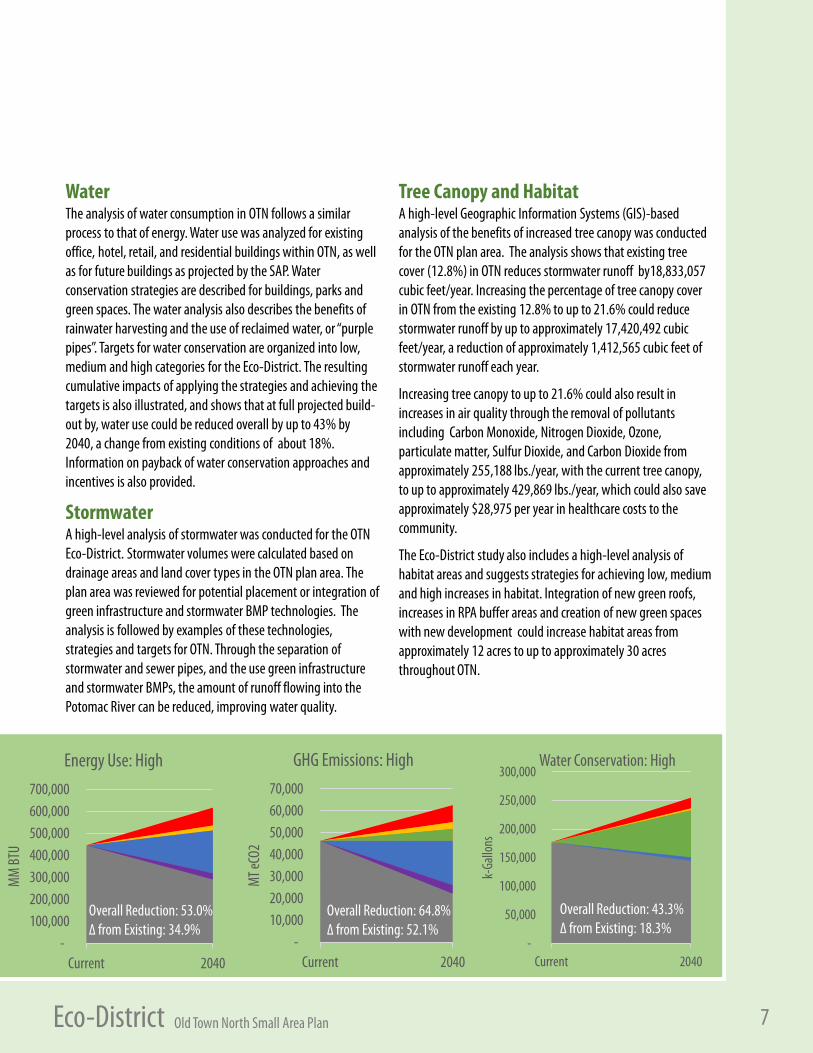
The analysis is followed by low, medium, and high targets for energy and GHG emissions reductions for the Eco-District. The resulting cumulative impacts of applying the various strategies and achieving the targets is also illustrated, and shows that at full projected build-out, energy use could be reduced overall by up to 53% by 2040, a change from existing conditions of about 35%; and GHG emissions could be reduced overall by up to approximately 65%, a change from existing of about 52%. Cost considerations for energy improvements and potential incentives are also included as part of the analysis.
Purpose of the Study
7Old Town North Small Area Plan Eco-District
- 10,000 20,000 30,000 40,000 50,000 60,000 70,000
Current 2040
MT eC
O2
GHG Emissions: High
- 100,000 200,000 300,000 400,000 500,000 600,000 700,000
Current 2040
MM
BTU
Energy Use: High
Overall Reduction: 53.0%∆ from Existing: 34.9%
WaterThe analysis of water consumption in OTN follows a similar process to that of energy. Water use was analyzed for existing office, hotel, retail, and residential buildings within OTN, as well as for future buildings as projected by the SAP. Water conservation strategies are described for buildings, parks and green spaces. The water analysis also describes the benefits of rainwater harvesting and the use of reclaimed water, or “purple pipes”. Targets for water conservation are organized into low, medium and high categories for the Eco-District. The resulting cumulative impacts of applying the strategies and achieving the targets is also illustrated, and shows that at full projected build-out by, water use could be reduced overall by up to 43% by 2040, a change from existing conditions of about 18%. Information on payback of water conservation approaches and incentives is also provided.
StormwaterA high-level analysis of stormwater was conducted for the OTN Eco-District. Stormwater volumes were calculated based on drainage areas and land cover types in the OTN plan area. The plan area was reviewed for potential placement or integration of green infrastructure and stormwater BMP technologies. The analysis is followed by examples of these technologies, strategies and targets for OTN. Through the separation of stormwater and sewer pipes, and the use green infrastructure and stormwater BMPs, the amount of runoff flowing into the Potomac River can be reduced, improving water quality.
Tree Canopy and HabitatA high-level Geographic Information Systems (GIS)-based analysis of the benefits of increased tree canopy was conducted for the OTN plan area. The analysis shows that existing tree cover (12.8%) in OTN reduces stormwater runoff by18,833,057 cubic feet/year. Increasing the percentage of tree canopy cover in OTN from the existing 12.8% to up to 21.6% could reduce stormwater runoff by up to approximately 17,420,492 cubic feet/year, a reduction of approximately 1,412,565 cubic feet of stormwater runoff each year.
Increasing tree canopy to up to 21.6% could also result in increases in air quality through the removal of pollutants including Carbon Monoxide, Nitrogen Dioxide, Ozone, particulate matter, Sulfur Dioxide, and Carbon Dioxide from approximately 255,188 lbs./year, with the current tree canopy, to up to approximately 429,869 lbs./year, which could also save approximately $28,975 per year in healthcare costs to the community.
The Eco-District study also includes a high-level analysis of habitat areas and suggests strategies for achieving low, medium and high increases in habitat. Integration of new green roofs, increases in RPA buffer areas and creation of new green spaces with new development could increase habitat areas from approximately 12 acres to up to approximately 30 acres throughout OTN.
-
50,000
100,000
150,000
200,000
250,000
300,000
Current 2040
k-Ga
llons
Water Conservation: High
Overall Reduction: 43.3%∆ from Existing: 18.3%
Overall Reduction: 64.8%∆ from Existing: 52.1%

8Old Town North Small Area Plan Eco-District
9Old Town North Small Area Plan Eco-District
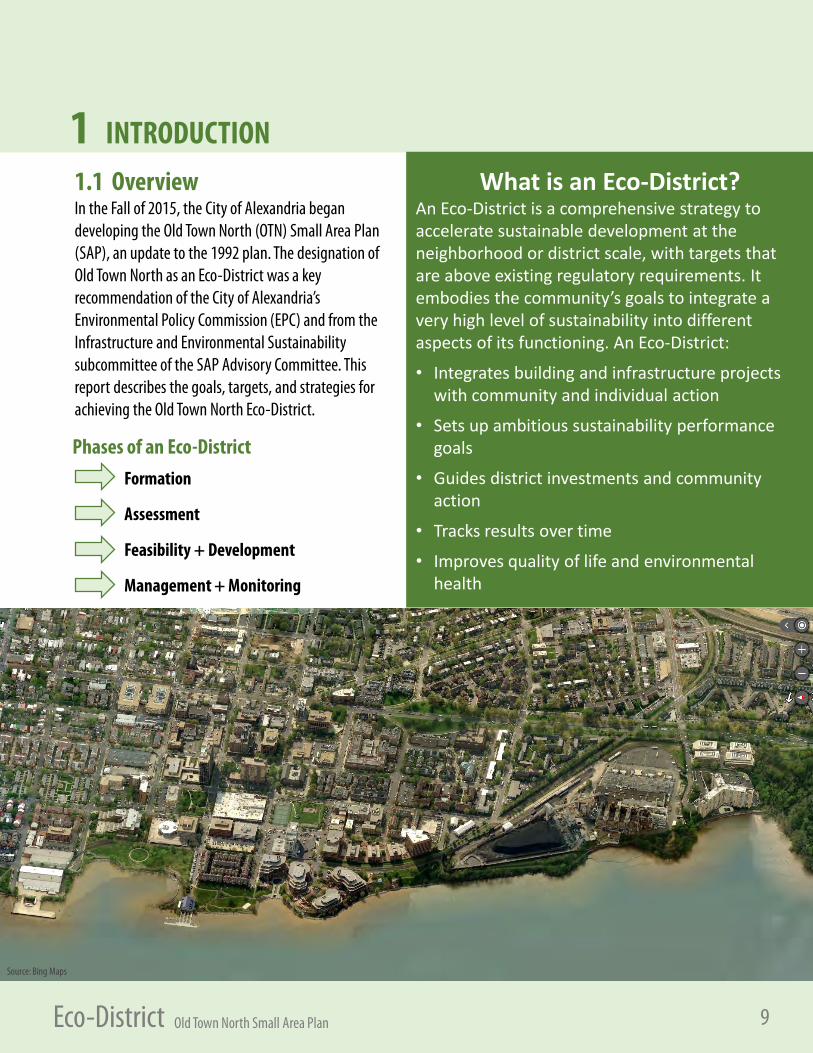
1 INTRODUCTION1.1 OverviewIn the Fall of 2015, the City of Alexandria began developing the Old Town North (OTN) Small Area Plan (SAP), an update to the 1992 plan. The designation of Old Town North as an Eco-District was a key recommendation of the City of Alexandria’s Environmental Policy Commission (EPC) and from the Infrastructure and Environmental Sustainability subcommittee of the SAP Advisory Committee. This report describes the goals, targets, and strategies for achieving the Old Town North Eco-District.
What is an Eco-District?An Eco-District is a comprehensive strategy to accelerate sustainable development at the neighborhood or district scale, with targets that are above existing regulatory requirements. It embodies the community’s goals to integrate a very high level of sustainability into different aspects of its functioning. An Eco-District:
• Integrates building and infrastructure projects with community and individual action
• Sets up ambitious sustainability performance goals
• Guides district investments and community action
• Tracks results over time
• Improves quality of life and environmental health
Formation
Assessment
Feasibility + Development
Management + Monitoring
Phases of an Eco-District
Source: Bing Maps
10Old Town North Small Area Plan Eco-District
Why do Eco-Districts Matter?Eco-districts have a variety of benefits to the residents and stakeholders of a community:
For Utilities, Eco-Districts : • Guide the development of more cost-effective and resilient
green infrastructure investments over time• Scale conservation and demand-side management goals by
aggregating district-wide projects
For Businesses, Eco-Districts : • Bring district-scale infrastructure/building products and
services to market• Create the potential for “Eco” branding and social capital
For Neighbors, Eco-Districts : • Enhance a neighborhood’s economic vitality and sustainability• Create a forum for neighborhood organization and advocacy
For Municipalities, Eco-Districts: • Help meet broader sustainability policy and economic
development goals• Put demonstration projects on the ground• Save local money and resources• Stimulate new business development
For Developers and Property Owners, Eco-Districts: • Reduce development and operating costs by linking
individual building investments to neighborhood infrastructure
• Promote investing long term instead of short term
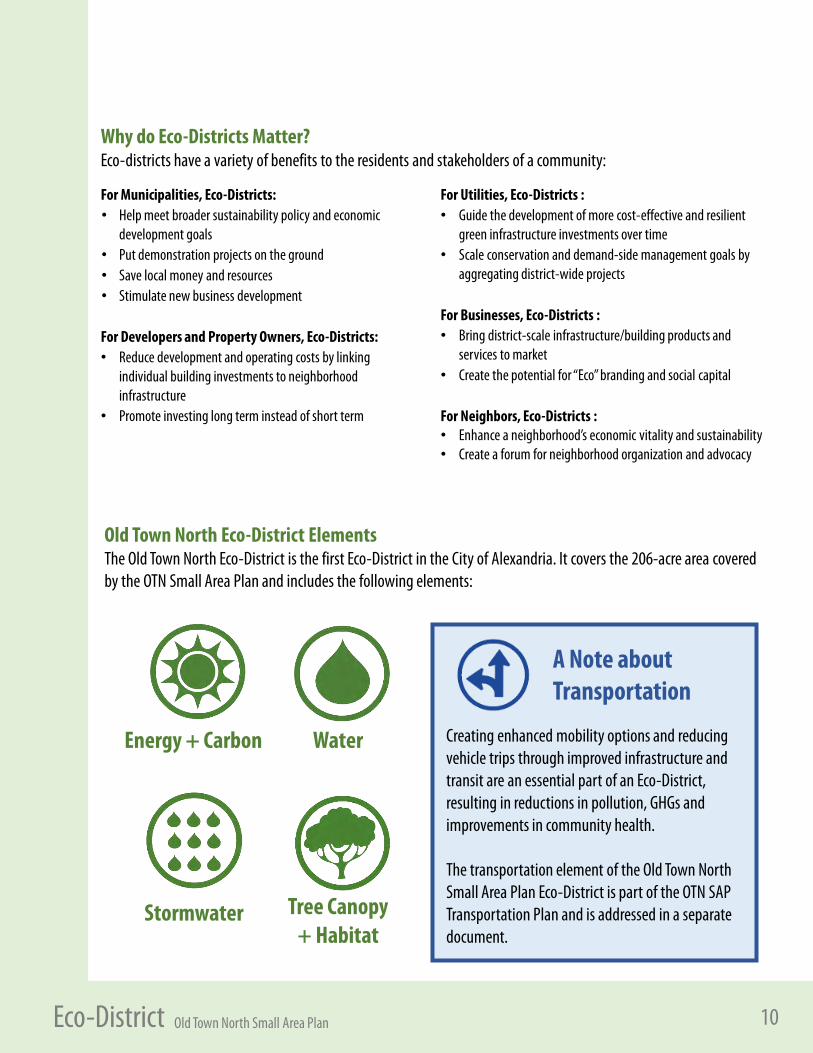
Old Town North Eco-District ElementsThe Old Town North Eco-District is the first Eco-District in the City of Alexandria. It covers the 206-acre area covered by the OTN Small Area Plan and includes the following elements:
Energy + Carbon
Stormwater
Water
Tree Canopy+ Habitat
A Note about Transportation
Creating enhanced mobility options and reducing vehicle trips through improved infrastructure and transit are an essential part of an Eco-District, resulting in reductions in pollution, GHGs and improvements in community health.
The transportation element of the Old Town North Small Area Plan Eco-District is part of the OTN SAP Transportation Plan and is addressed in a separate document.
11Old Town North Small Area Plan Eco-District
- 500,000
1,000,000 1,500,000 2,000,000 2,500,000 3,000,000 3,500,000 4,000,000 4,500,000 5,000,000
Hotels Retail Office Single FamilyResidential
MultifamilyResidential
Squa
re F
eet
ProposedExisting
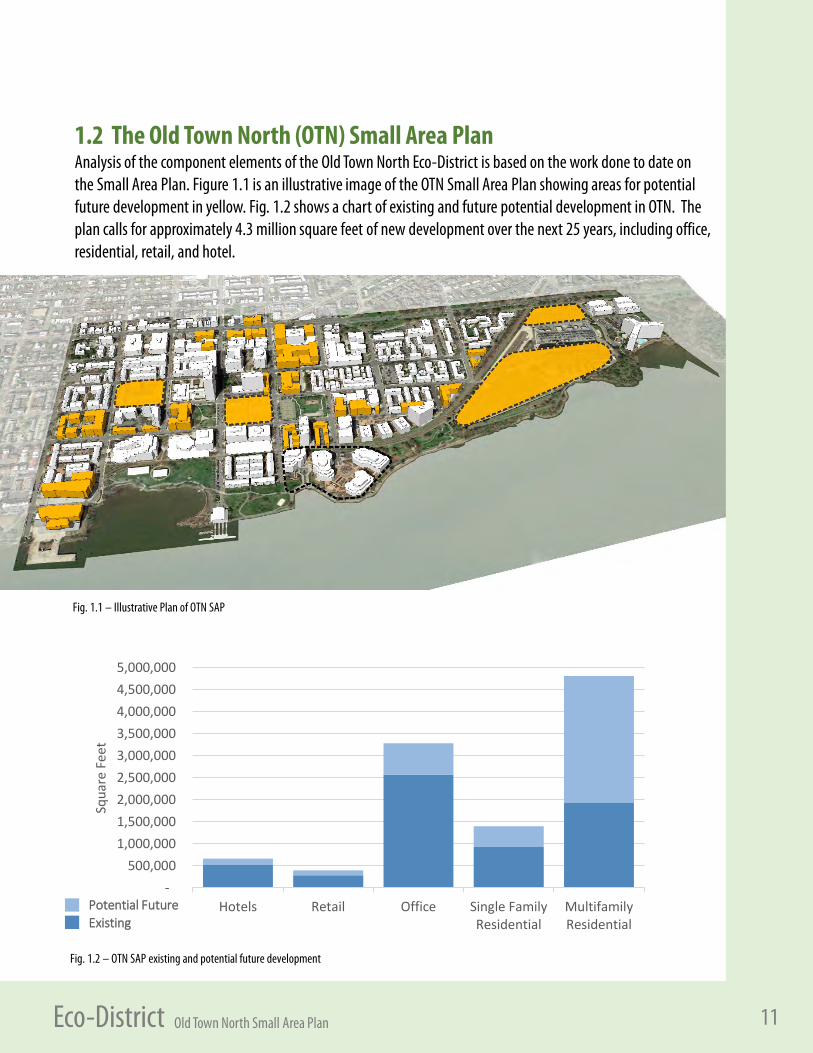
1.2 The Old Town North (OTN) Small Area PlanAnalysis of the component elements of the Old Town North Eco-District is based on the work done to date on the Small Area Plan. Figure 1.1 is an illustrative image of the OTN Small Area Plan showing areas for potential future development in yellow. Fig. 1.2 shows a chart of existing and future potential development in OTN. The plan calls for approximately 4.3 million square feet of new development over the next 25 years, including office, residential, retail, and hotel.
Fig. 1.1 – Illustrative Plan of OTN SAP
Fig. 1.2 – OTN SAP existing and potential future development
Potential FutureExisting

12Old Town North Small Area Plan Eco-District
13Old Town North Small Area Plan Eco-District
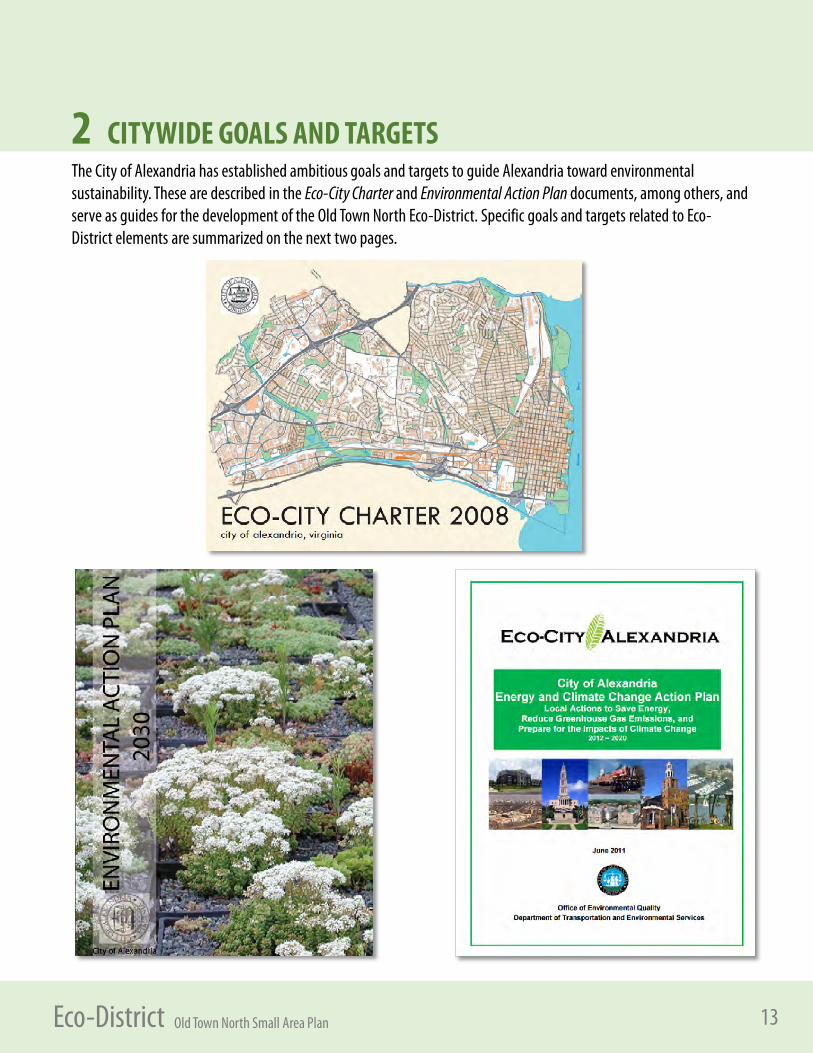
2 CITYWIDE GOALS AND TARGETSThe City of Alexandria has established ambitious goals and targets to guide Alexandria toward environmental sustainability. These are described in the Eco-City Charter and Environmental Action Plan documents, among others, and serve as guides for the development of the Old Town North Eco-District. Specific goals and targets related to Eco-District elements are summarized on the next two pages.
14Old Town North Small Area Plan Eco-District
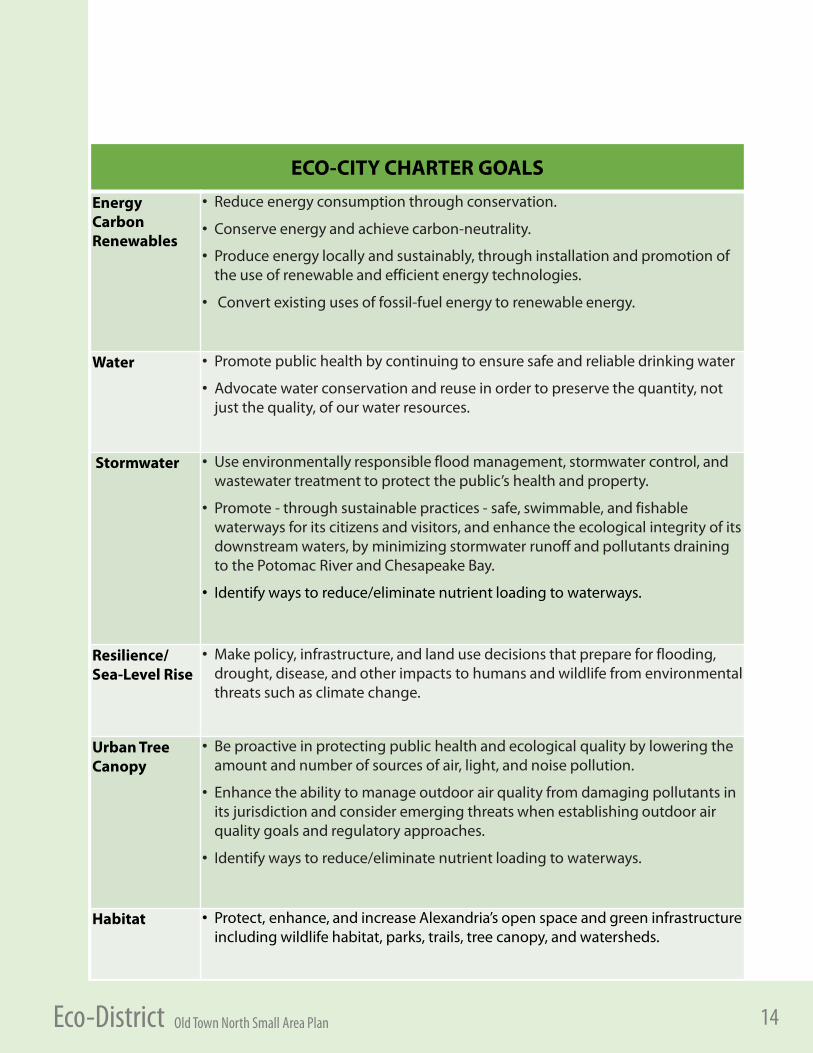
ECO-CITY CHARTER GOALS
EnergyCarbonRenewables
• Reduce energy consumption through conservation.
• Conserve energy and achieve carbon-neutrality.
• Produce energy locally and sustainably, through installation and promotion of the use of renewable and efficient energy technologies.
• Convert existing uses of fossil-fuel energy to renewable energy.
Water • Promote public health by continuing to ensure safe and reliable drinking water
• Advocate water conservation and reuse in order to preserve the quantity, not just the quality, of our water resources.
Stormwater • Use environmentally responsible flood management, stormwater control, and wastewater treatment to protect the public’s health and property.
• Promote - through sustainable practices - safe, swimmable, and fishable waterways for its citizens and visitors, and enhance the ecological integrity of its downstream waters, by minimizing stormwater runoff and pollutants draining to the Potomac River and Chesapeake Bay.
• Identify ways to reduce/eliminate nutrient loading to waterways.
Resilience/Sea-Level Rise
• Make policy, infrastructure, and land use decisions that prepare for flooding, drought, disease, and other impacts to humans and wildlife from environmental threats such as climate change.
Urban Tree Canopy
• Be proactive in protecting public health and ecological quality by lowering the amount and number of sources of air, light, and noise pollution.
• Enhance the ability to manage outdoor air quality from damaging pollutants in its jurisdiction and consider emerging threats when establishing outdoor air quality goals and regulatory approaches.
• Identify ways to reduce/eliminate nutrient loading to waterways.
Habitat • Protect, enhance, and increase Alexandria’s open space and green infrastructure including wildlife habitat, parks, trails, tree canopy, and watersheds.
15Old Town North Small Area Plan Eco-District
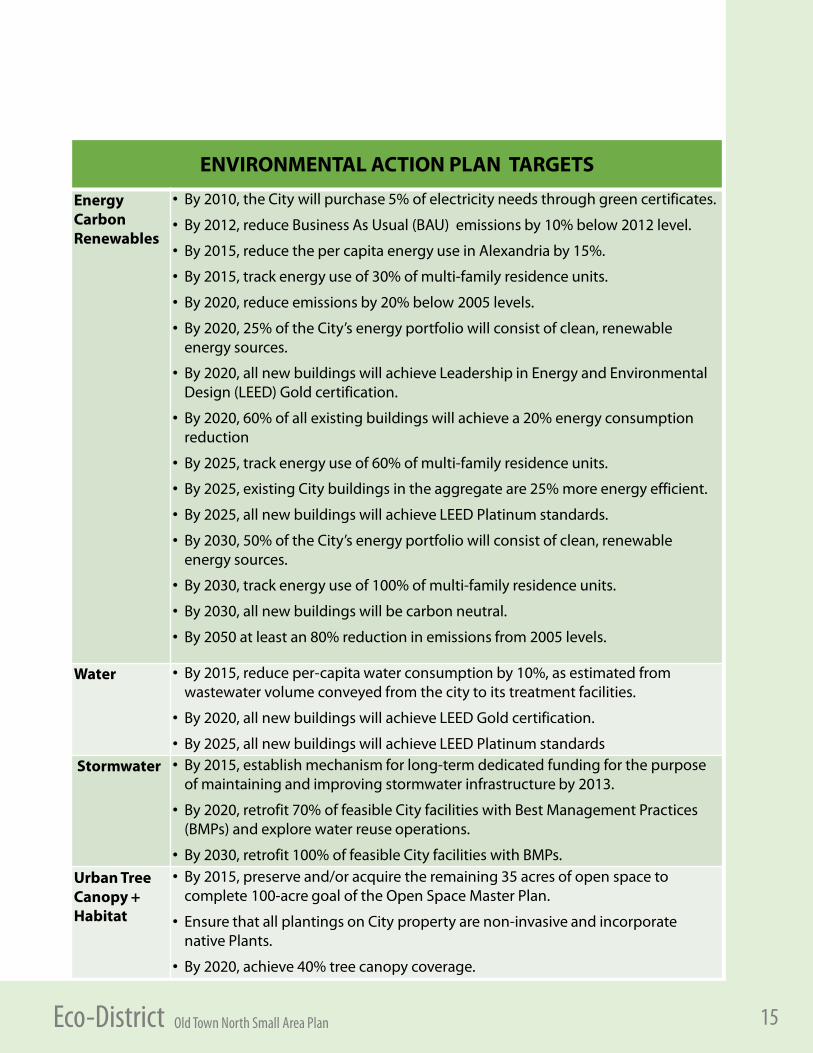
ENVIRONMENTAL ACTION PLAN TARGETS
EnergyCarbonRenewables
• By 2010, the City will purchase 5% of electricity needs through green certificates.
• By 2012, reduce Business As Usual (BAU) emissions by 10% below 2012 level.
• By 2015, reduce the per capita energy use in Alexandria by 15%.
• By 2015, track energy use of 30% of multi-family residence units.
• By 2020, reduce emissions by 20% below 2005 levels.
• By 2020, 25% of the City’s energy portfolio will consist of clean, renewable energy sources.
• By 2020, all new buildings will achieve Leadership in Energy and EnvironmentalDesign (LEED) Gold certification.
• By 2020, 60% of all existing buildings will achieve a 20% energy consumption reduction
• By 2025, track energy use of 60% of multi-family residence units.
• By 2025, existing City buildings in the aggregate are 25% more energy efficient.
• By 2025, all new buildings will achieve LEED Platinum standards.
• By 2030, 50% of the City’s energy portfolio will consist of clean, renewable energy sources.
• By 2030, track energy use of 100% of multi-family residence units.
• By 2030, all new buildings will be carbon neutral.
• By 2050 at least an 80% reduction in emissions from 2005 levels.
Water • By 2015, reduce per-capita water consumption by 10%, as estimated from wastewater volume conveyed from the city to its treatment facilities.
• By 2020, all new buildings will achieve LEED Gold certification.
• By 2025, all new buildings will achieve LEED Platinum standardsStormwater • By 2015, establish mechanism for long-term dedicated funding for the purpose
of maintaining and improving stormwater infrastructure by 2013.
• By 2020, retrofit 70% of feasible City facilities with Best Management Practices (BMPs) and explore water reuse operations.
• By 2030, retrofit 100% of feasible City facilities with BMPs.
Urban Tree Canopy + Habitat
• By 2015, preserve and/or acquire the remaining 35 acres of open space to complete 100-acre goal of the Open Space Master Plan.
• Ensure that all plantings on City property are non-invasive and incorporate native Plants.
• By 2020, achieve 40% tree canopy coverage.

16Old Town North Small Area Plan Eco-District
17Old Town North Small Area Plan Eco-District
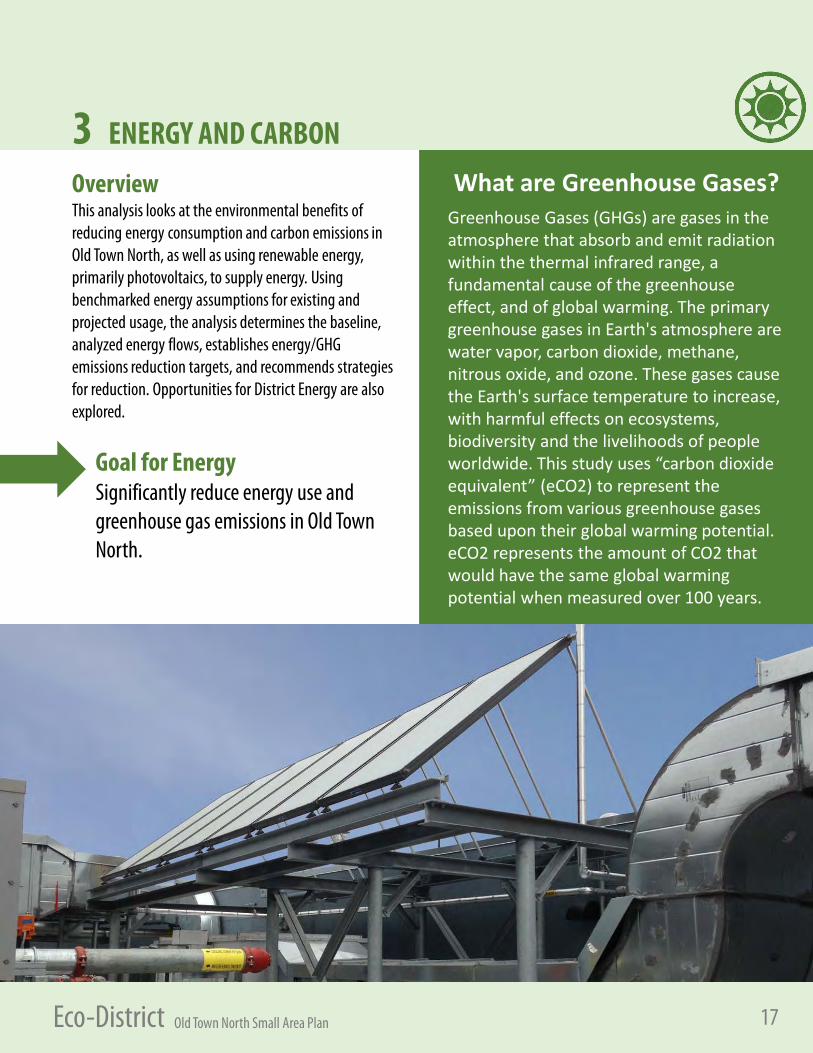
OverviewThis analysis looks at the environmental benefits of reducing energy consumption and carbon emissions in Old Town North, as well as using renewable energy, primarily photovoltaics, to supply energy. Using benchmarked energy assumptions for existing and projected usage, the analysis determines the baseline, analyzed energy flows, establishes energy/GHG emissions reduction targets, and recommends strategies for reduction. Opportunities for District Energy are also explored.
3 ENERGY AND CARBONWhat are Greenhouse Gases?
Greenhouse Gases (GHGs) are gases in the atmosphere that absorb and emit radiation within the thermal infrared range, a fundamental cause of the greenhouse effect, and of global warming. The primary greenhouse gases in Earth's atmosphere are water vapor, carbon dioxide, methane, nitrous oxide, and ozone. These gases cause the Earth's surface temperature to increase, with harmful effects on ecosystems, biodiversity and the livelihoods of people worldwide. This study uses “carbon dioxide equivalent” (eCO2) to represent the emissions from various greenhouse gases based upon their global warming potential. eCO2 represents the amount of CO2 that would have the same global warming potential when measured over 100 years.
Goal for EnergySignificantly reduce energy use and greenhouse gas emissions in Old Town North.
18Old Town North Small Area Plan Eco-District
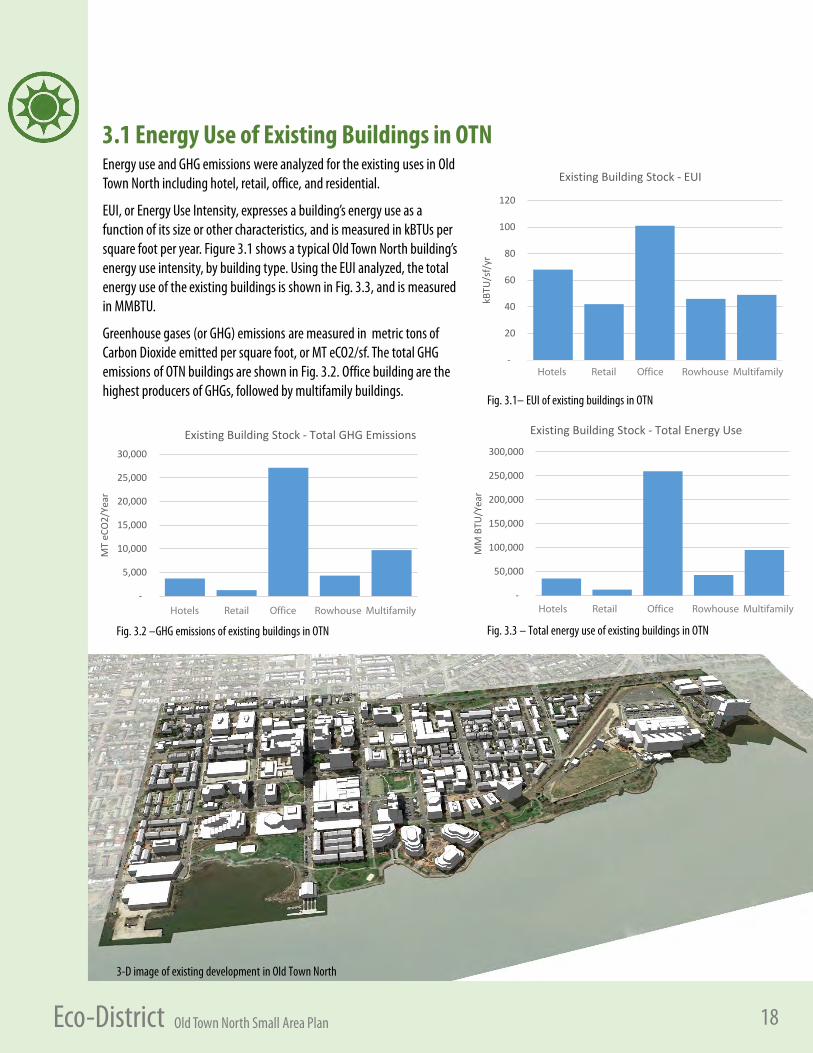
Energy use and GHG emissions were analyzed for the existing uses in Old Town North including hotel, retail, office, and residential.
EUI, or Energy Use Intensity, expresses a building’s energy use as a function of its size or other characteristics, and is measured in kBTUs per square foot per year. Figure 3.1 shows a typical Old Town North building’s energy use intensity, by building type. Using the EUI analyzed, the total energy use of the existing buildings is shown in Fig. 3.3, and is measured in MMBTU.
Greenhouse gases (or GHG) emissions are measured in metric tons of Carbon Dioxide emitted per square foot, or MT eCO2/sf. The total GHG emissions of OTN buildings are shown in Fig. 3.2. Office building are the highest producers of GHGs, followed by multifamily buildings.
Fig. 3.1– EUI of existing buildings in OTN
Fig. 3.3 – Total energy use of existing buildings in OTNFig. 3.2 –GHG emissions of existing buildings in OTN
3-D image of existing development in Old Town North
3.1 Energy Use of Existing Buildings in OTN
-
20
40
60
80
100
120
kBTU
/sf/
yr
Existing Building Stock - EUI
Hotels Retail Office Rowhouse Multifamily
-
5,000
10,000
15,000
20,000
25,000
30,000
Hotels Retail StoreOffice Bldgs Rowhouse Multifamily
MT
eCO
2/Ye
ar
Existing Building Stock - Total GHG Emissions
Hotels Retail Office Rowhouse Multifamily
-
50,000
100,000
150,000
200,000
250,000
300,000
MM
BTU
/Yea
r
Existing Building Stock - Total Energy Use
Hotels Retail Office Rowhouse Multifamily
19Old Town North Small Area Plan Eco-District
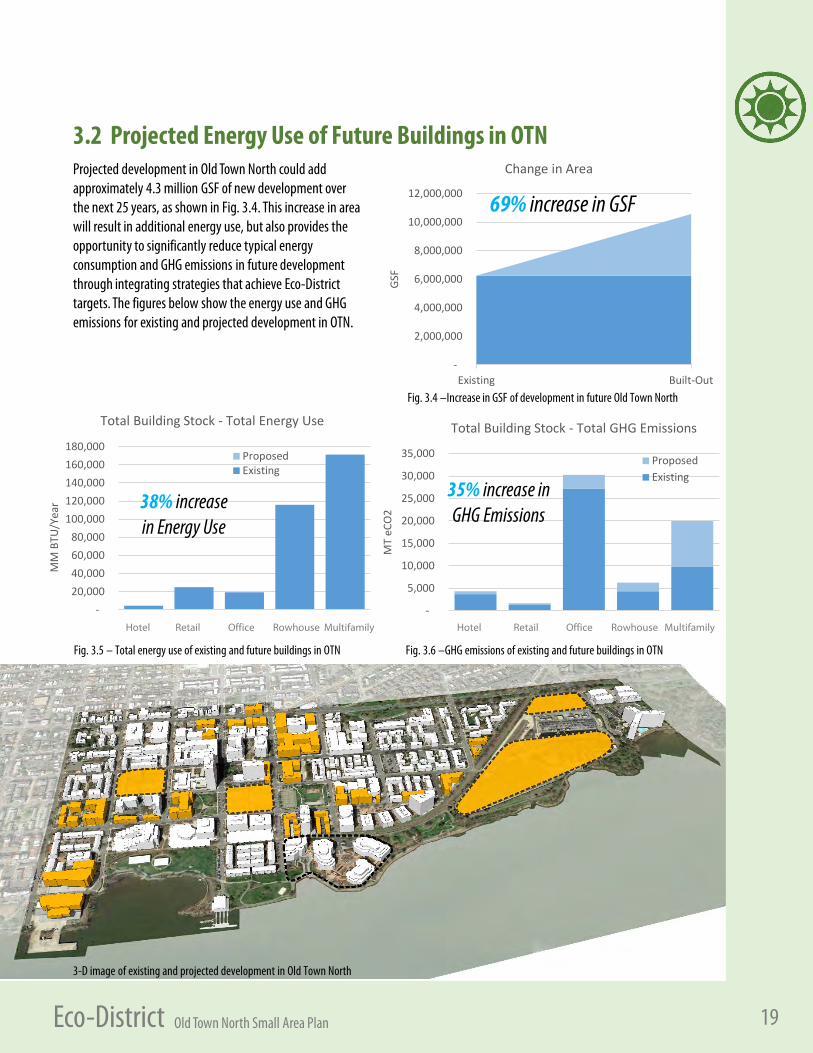
Fig. 3.5 – Total energy use of existing and future buildings in OTN
- 20,000 40,000 60,000 80,000
100,000 120,000 140,000 160,000 180,000
Office Residential Residential
MM
BTU
/Yea
r
Total Building Stock - Total Energy Use
ProposedExisting
38% increase in Energy Use
Hotel Retail Office Rowhouse Multifamily
Projected development in Old Town North could add approximately 4.3 million GSF of new development over the next 25 years, as shown in Fig. 3.4. This increase in area will result in additional energy use, but also provides the opportunity to significantly reduce typical energy consumption and GHG emissions in future development through integrating strategies that achieve Eco-District targets. The figures below show the energy use and GHG emissions for existing and projected development in OTN.
-
5,000
10,000
15,000
20,000
25,000
30,000
35,000
Hotels Retail Store Office Bldgs Rowhouse Multifamily
MT
eCO
2
Total Building Stock - Total GHG Emissions
ProposedExisting
35% increase in GHG Emissions
Fig. 3.6 –GHG emissions of existing and future buildings in OTN
Fig. 3.4 –Increase in GSF of development in future Old Town North
-
2,000,000
4,000,000
6,000,000
8,000,000
10,000,000
12,000,000
Existing Built-OutGS
F
Change in Area
69% increase in GSF
3.2 Projected Energy Use of Future Buildings in OTN
3-D image of existing and projected development in Old Town North
Hotel Retail Office Rowhouse Multifamily
20Old Town North Small Area Plan Eco-District
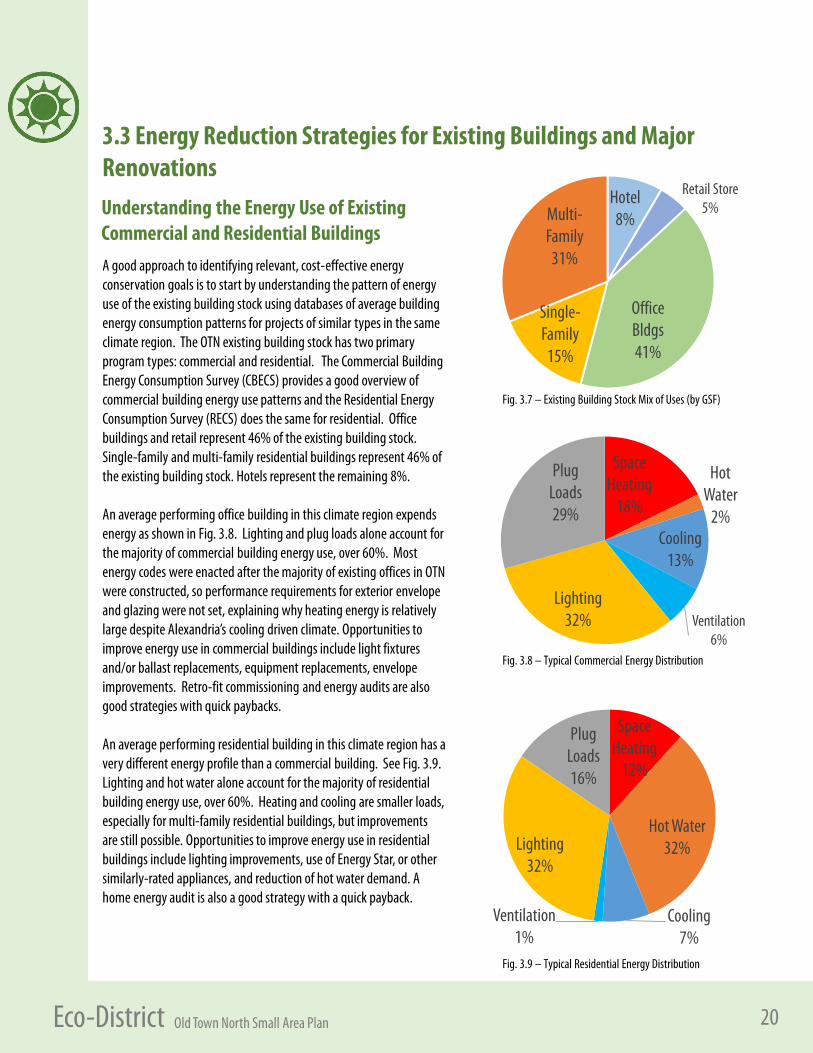
A good approach to identifying relevant, cost-effective energy conservation goals is to start by understanding the pattern of energy use of the existing building stock using databases of average building energy consumption patterns for projects of similar types in the same climate region. The OTN existing building stock has two primary program types: commercial and residential. The Commercial Building Energy Consumption Survey (CBECS) provides a good overview of commercial building energy use patterns and the Residential Energy Consumption Survey (RECS) does the same for residential. Office buildings and retail represent 46% of the existing building stock. Single-family and multi-family residential buildings represent 46% of the existing building stock. Hotels represent the remaining 8%.
An average performing office building in this climate region expends energy as shown in Fig. 3.8. Lighting and plug loads alone account for the majority of commercial building energy use, over 60%. Most energy codes were enacted after the majority of existing offices in OTN were constructed, so performance requirements for exterior envelope and glazing were not set, explaining why heating energy is relatively large despite Alexandria’s cooling driven climate. Opportunities to improve energy use in commercial buildings include light fixtures and/or ballast replacements, equipment replacements, envelope improvements. Retro-fit commissioning and energy audits are also good strategies with quick paybacks.
An average performing residential building in this climate region has a very different energy profile than a commercial building. See Fig. 3.9. Lighting and hot water alone account for the majority of residential building energy use, over 60%. Heating and cooling are smaller loads, especially for multi-family residential buildings, but improvements are still possible. Opportunities to improve energy use in residential buildings include lighting improvements, use of Energy Star, or other similarly-rated appliances, and reduction of hot water demand. A home energy audit is also a good strategy with a quick payback.
Hotel8%
Retail Store5%
Office Bldgs41%
Single-Family15%
Multi-Family31%
Space Heating
18%
Hot Water
2%Cooling
13%
Ventilation6%
Lighting32%
Plug Loads29%
Fig. 3.7 – Existing Building Stock Mix of Uses (by GSF)
3.3 Energy Reduction Strategies for Existing Buildings and Major Renovations
Fig. 3.9 – Typical Residential Energy Distribution
Space Heating
12%
Hot Water32%
Cooling7%
Ventilation1%
Lighting32%
Plug Loads16%
Fig. 3.8 – Typical Commercial Energy Distribution
Understanding the Energy Use of Existing Commercial and Residential Buildings
21Old Town North Small Area Plan Eco-District
ENERGY CONSERVATION STRATEGIES FOR EXISTING BUILDINGS
LOW MEDIUM HIGHLamp replacements Items from “Low” Column + Items from “Medium” Column +
Energy AuditsWeatherization, insulation upgrades,
storm windowsWindow replacements
Appliance/office equipment replacements
Light fixture and ballast replacements
HVAC equipment upgrades
Showerhead replacementsBMS/EMS Controls and
Metering/Sub-metering
Programmable Thermostats
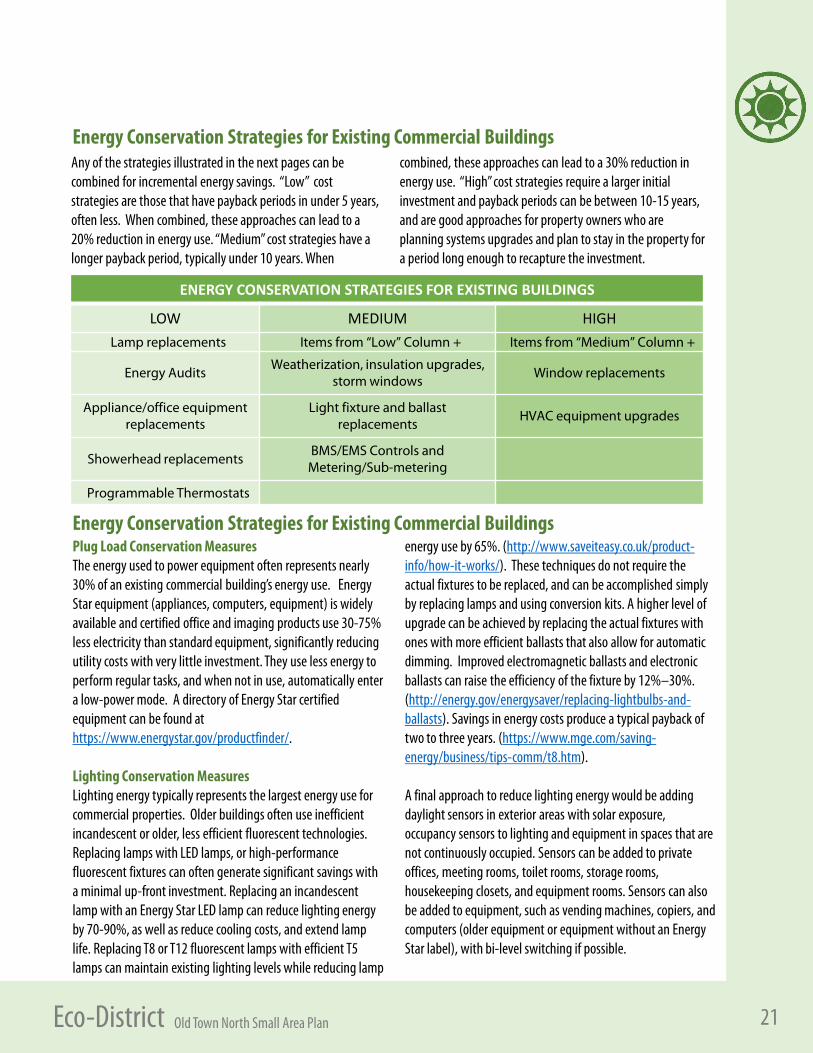
Any of the strategies illustrated in the next pages can be combined for incremental energy savings. “Low” cost strategies are those that have payback periods in under 5 years, often less. When combined, these approaches can lead to a 20% reduction in energy use. “Medium” cost strategies have a longer payback period, typically under 10 years. When
combined, these approaches can lead to a 30% reduction in energy use. “High” cost strategies require a larger initial investment and payback periods can be between 10-15 years, and are good approaches for property owners who are planning systems upgrades and plan to stay in the property for a period long enough to recapture the investment.
Plug Load Conservation Measures The energy used to power equipment often represents nearly 30% of an existing commercial building’s energy use. Energy Star equipment (appliances, computers, equipment) is widely available and certified office and imaging products use 30-75% less electricity than standard equipment, significantly reducing utility costs with very little investment. They use less energy to perform regular tasks, and when not in use, automatically enter a low-power mode. A directory of Energy Star certified equipment can be found at https://www.energystar.gov/productfinder/.
Lighting Conservation MeasuresLighting energy typically represents the largest energy use for commercial properties. Older buildings often use inefficient incandescent or older, less efficient fluorescent technologies. Replacing lamps with LED lamps, or high-performance fluorescent fixtures can often generate significant savings with a minimal up-front investment. Replacing an incandescent lamp with an Energy Star LED lamp can reduce lighting energy by 70-90%, as well as reduce cooling costs, and extend lamp life. Replacing T8 or T12 fluorescent lamps with efficient T5 lamps can maintain existing lighting levels while reducing lamp
energy use by 65%. (http://www.saveiteasy.co.uk/product-info/how-it-works/). These techniques do not require the actual fixtures to be replaced, and can be accomplished simply by replacing lamps and using conversion kits. A higher level of upgrade can be achieved by replacing the actual fixtures with ones with more efficient ballasts that also allow for automatic dimming. Improved electromagnetic ballasts and electronic ballasts can raise the efficiency of the fixture by 12%–30%. (http://energy.gov/energysaver/replacing-lightbulbs-and-ballasts). Savings in energy costs produce a typical payback of two to three years. (https://www.mge.com/saving-energy/business/tips-comm/t8.htm).
A final approach to reduce lighting energy would be adding daylight sensors in exterior areas with solar exposure, occupancy sensors to lighting and equipment in spaces that are not continuously occupied. Sensors can be added to private offices, meeting rooms, toilet rooms, storage rooms, housekeeping closets, and equipment rooms. Sensors can also be added to equipment, such as vending machines, copiers, and computers (older equipment or equipment without an Energy Star label), with bi-level switching if possible.
Energy Conservation Strategies for Existing Commercial Buildings
Energy Conservation Strategies for Existing Commercial Buildings
22Old Town North Small Area Plan Eco-District
Hot Water Conservation Measures Reducing residential hot water use saves water and reduces water heating energy. Water heating energy can be the largest energy use for the average residence. Going from a conventional showerhead to a water sense showerhead can reduce hot water demand by 15% alone, resulting in a 5% reduction in energy use for a typical residence. Similar opportunities existing to reduce hot water demand for clothes washers and dishwashers by using Energy Star certified equipment. Energy Star appliances not only reduce plug load energy, but also save water which in turn saves water heating energy. As an example, an Energy Star certified clothes washer uses about 25% less energy and 40% less water than regular washers. Upgrading hot water heaters to more efficient models, especially point-source hot water heaters, can also yield additional energy savings.
Lighting Conservation MeasuresLighting energy is the other primary energy use of existing residences. Lighting upgrades are easier to implement in most residences, because they entail replacing incandescent and halogen lamps with new LED options. The previous section on lighting conservation measures for commercial buildings describes the potential savings, resources, and economic benefits of lamp replacement projects. Upgrading exterior lighting to include timeclock switches or light level/motion sensors can be a cost-effective way to reduce lighting energy.
Energy Conservation Strategies for Existing Residential Buildings
HVAC (Heating, Ventilation, Air Conditioning) Conservation Measures Reducing heating and cooling loads can be difficult to implement in existing buildings since passive approaches are typically integrated into a building’s design. Still, there are opportunities for envelope improvements including adding exterior solar shading devices, window replacement, or the addition of storm windows, and improving wall and roof insulation values with blown-in insulation. To meet the remaining heating and cooling loads more efficiently, owners can replace their existing inefficient equipment such as boilers, air-conditioning systems, air-handling units, fans, and pumps, with more efficient Energy Star rated equipment. Energy Star certified light commercial HVAC equipment uses 7–10% less energy than standard equipment. (https://www.energystar.gov/products/heating_cooling/light_commercial_heating_cooling). Additional approaches to reduce HVAC equipment energy use include retrofit testing and balancing, building management
system upgrades, automated control improvements including scheduling and setbacks that incorporate occupancy, CO2, or pressure sensors to setback HVAC equipment when spaces are unoccupied, and ensuring the HVAC system is not over-pressurized or de-pressurized.
Another cost-effective way to improve energy performance is to conduct an energy audit. An audit can be done simply by using tools like the EPA Energy Star Portfolio Manager to benchmark a property’s performance in order to understand if energy consumption is atypical. A more robust audit can be performed using energy service companies - professional businesses that design, implement, and often finance energy-efficiency improvements to existing buildings. These companies generally guarantee specific results and operate on performance-based contracts. They predict (and will often guarantee) an energy savings of between 15%-30% depending on the age and condition of the building.
Plug Load Conservation MeasuresWhile plug loads represent a smaller portion of the overall energy profile of a residence, (around 15% for an average existing residence), the availability of Energy Star equipment is endless. Energy Star appliances consume 20% or less energy than conventional products. The Energy Star at Home website is a useful resource providing tips for reducing household energy use, a directory of Energy Star certified products, an economic analysis tools include a rebate finder and a savings calculator. https://www.energystar.gov/campaign/home
HVAC Conservation MeasuresThe simplest way to reduce HVAC energy use is to properly maintain HVAC equipment and replace filtration media at intervals recommended by the manufacturer. Improving the thermal envelope by upgrading existing windows, supplementing attic insulation, using blown-in insulation in wall assemblies, and reducing infiltration with weather-seals and caulking, are all low-cost, high-return techniques largely applicable to single-family residences (with limited benefit to multi-family residential buildings).
Homeowners can also replace their existing inefficient equipment such as boilers, furnaces, and heat pumps with more efficient Energy Star rated equipment. Replacing a heat pump that is more than 10 years old can reduce heating and cooling energy by 20%. Replacing a furnace that is more than 15 years old can reduce heating energy by 15%.
23Old Town North Small Area Plan Eco-District
Space Heating
18%
Hot Water
2%
Cooling13%
Ventilation6%
Lighting32%
Plug Loads29%
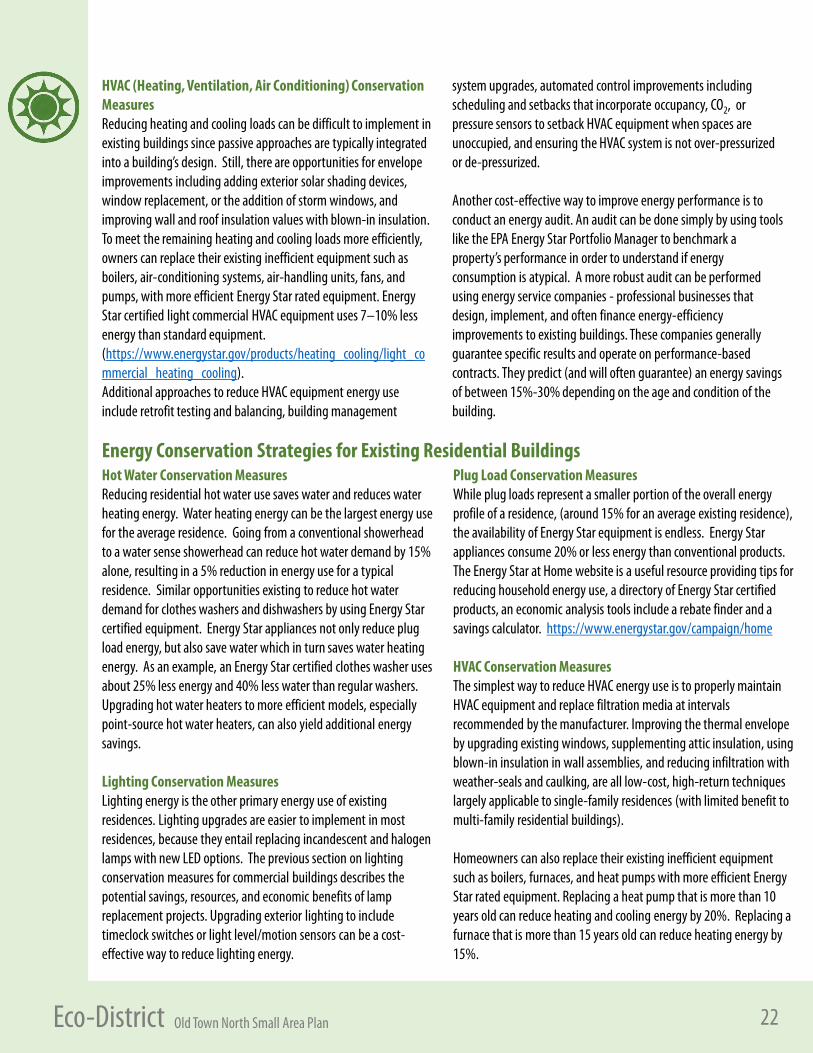
Combining Energy Strategies for Existing Commercial PropertiesThe first pie chart shows the typical energy use of existing commercial properties, and the second pie chart shows potential energy conservation measures, by energy end use, that can lead to a 50% overall reduction in energy use.
Space Heating
Hot Water
Cooling
Ventilation
Lighting
Plug Loads
Space Heating Savings 60% reduction:• Envelope improvements• Boiler replacement• Energy audit
Hot Water Savings20% reduction:• Water Heater
replacement
Cooling Savings 30% reduction:• Lighting/Equipment
Improvements• HVAC upgrades• Energy audit
Ventilation Savings 20% reduction:• HVAC upgrades• Energy audit
Lighting Savings 60% reduction:• Re-lamping• Ballast/Fixture replacements• Lighting Controls
Plug Load Savings 50% reduction:• Energy Star equipment• Plug load management
controls
Fig. 3.10 – Typical Energy Use of Existing Commercial Properties
Fig. 3.11 – Potential Commercial Energy Conservation Measures by Energy End Use
Programmable thermostats are another approach. While the first generation of programmable thermostats lacked data to substantiate energy savings claims, the newer products have had a better track record. The Nest Thermostat has documented research that shows savings of 10-12% on heating and 15% on cooling energy. A home energy audit can help homeowners determine if their property is wasting energy and prioritize efficiency upgrades. Upgrades identified in a home energy audit can save 5-30% on heating and cooling energy.
Residents in existing multifamily buildings in OTN can work with their condo boards and reference the commercial building opportunities. Weatherization to reduce air leakage can reduce HVAC demand. If replacement of the existing residential HVAC system can be afforded or is warranted, energy-efficient options should be considered, including Variable-Air-Volume (in lieu of Constant Volume) systems, energy recovery ventilation systems, variable frequency motors, as well as more robust energy management and controls systems.
24Old Town North Small Area Plan Eco-District
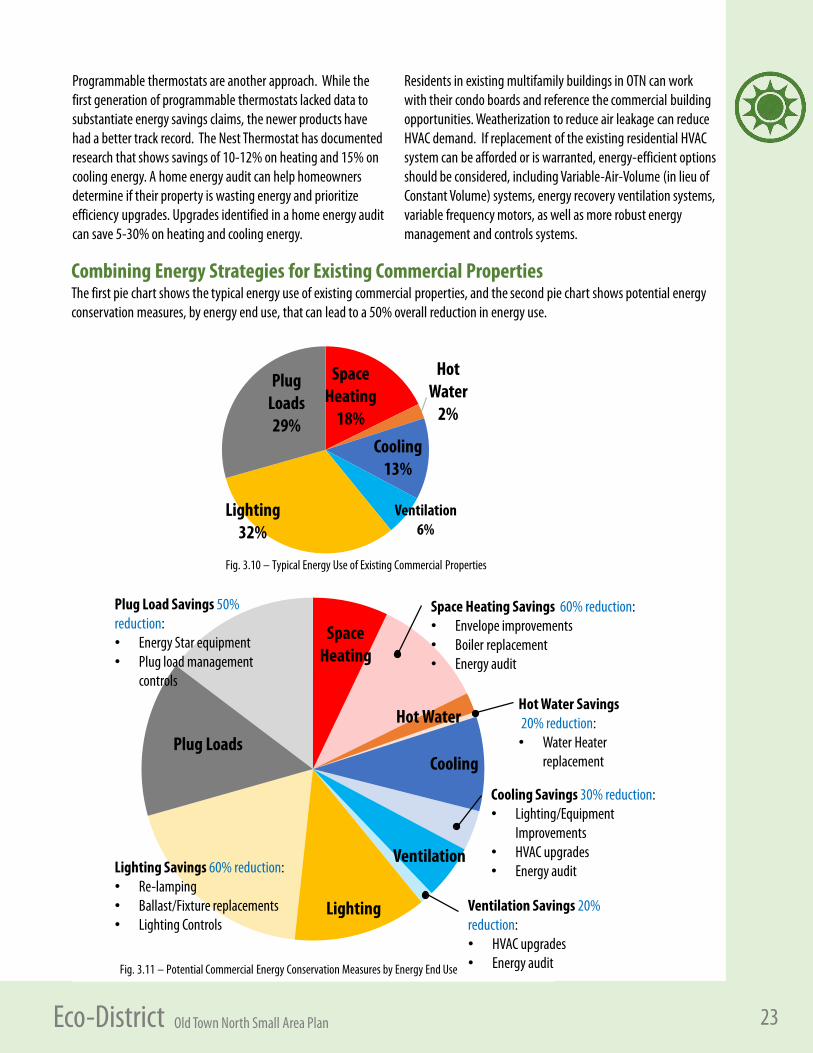
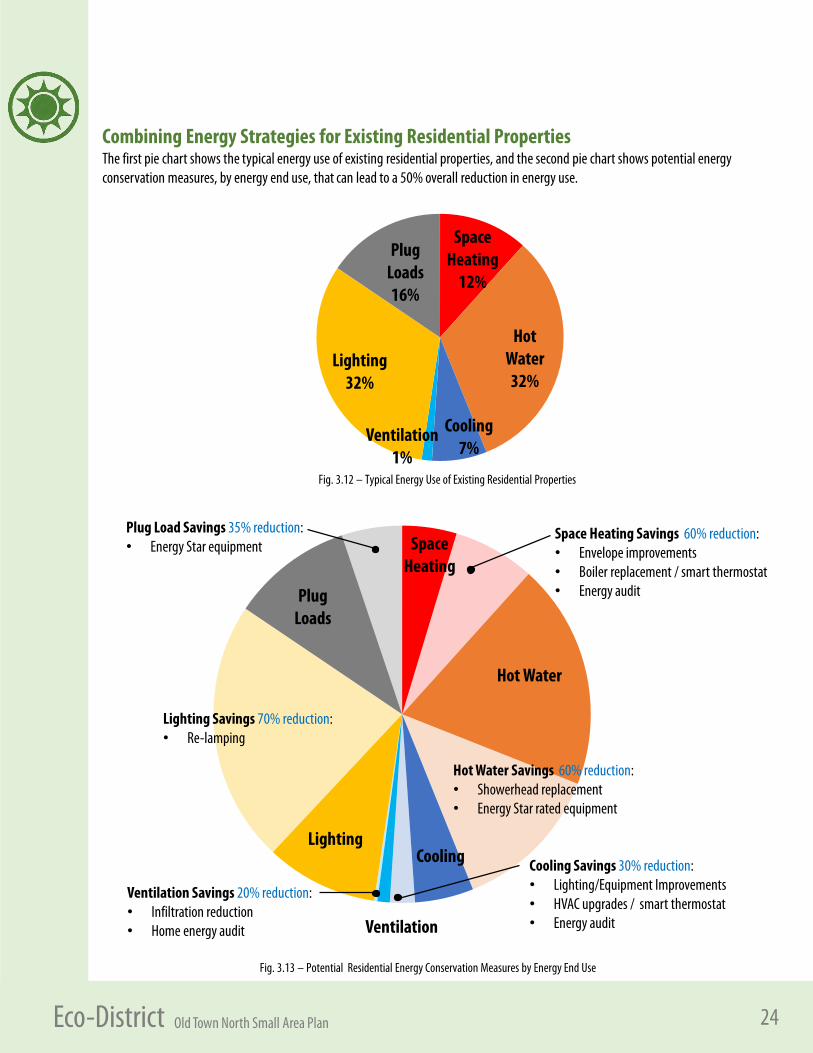
Combining Energy Strategies for Existing Residential PropertiesThe first pie chart shows the typical energy use of existing residential properties, and the second pie chart shows potential energy conservation measures, by energy end use, that can lead to a 50% overall reduction in energy use.
Space Heating
12%
Hot Water32%
Cooling7%
Ventilation1%
Lighting32%
Plug Loads16%
Space Heating
Hot Water
Cooling
Ventilation
Lighting
Plug Loads
Space Heating Savings 60% reduction:• Envelope improvements• Boiler replacement / smart thermostat• Energy audit
Hot Water Savings 60% reduction:• Showerhead replacement• Energy Star rated equipment
Cooling Savings 30% reduction:• Lighting/Equipment Improvements• HVAC upgrades / smart thermostat• Energy audit
Ventilation Savings 20% reduction:• Infiltration reduction• Home energy audit
Lighting Savings 70% reduction:• Re-lamping
Plug Load Savings 35% reduction:• Energy Star equipment
Fig. 3.12 – Typical Energy Use of Existing Residential Properties
Fig. 3.13 – Potential Residential Energy Conservation Measures by Energy End Use
25Old Town North Small Area Plan Eco-District
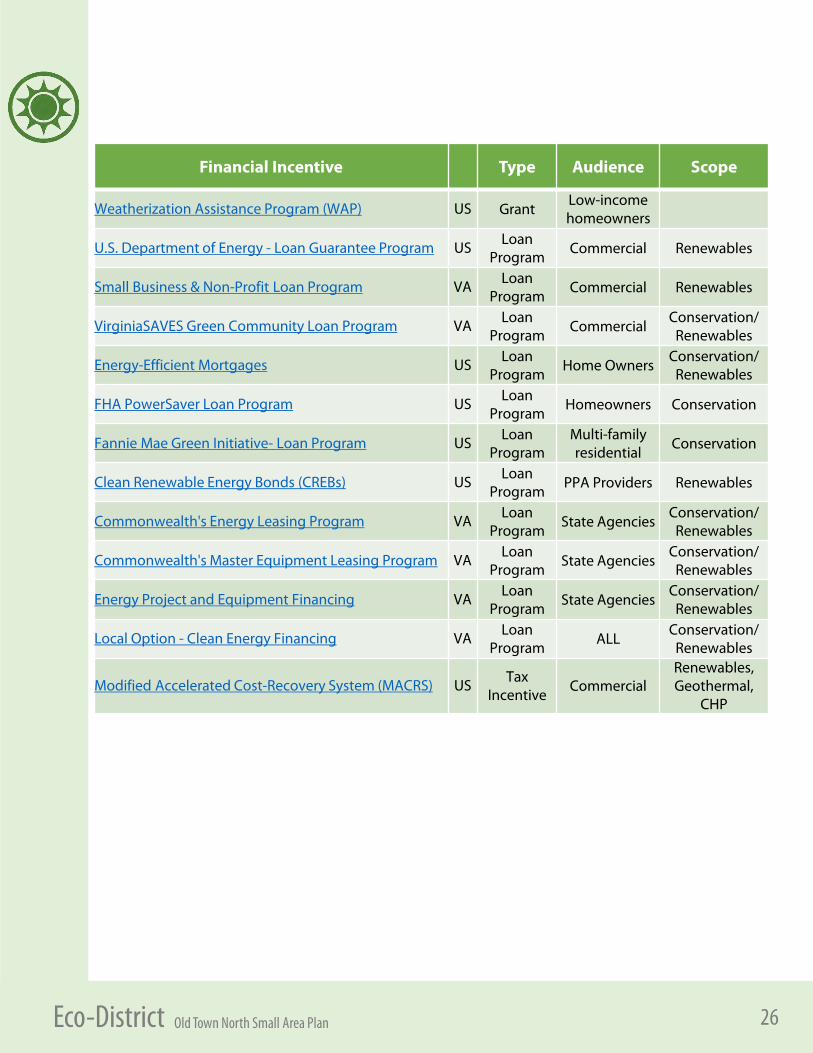
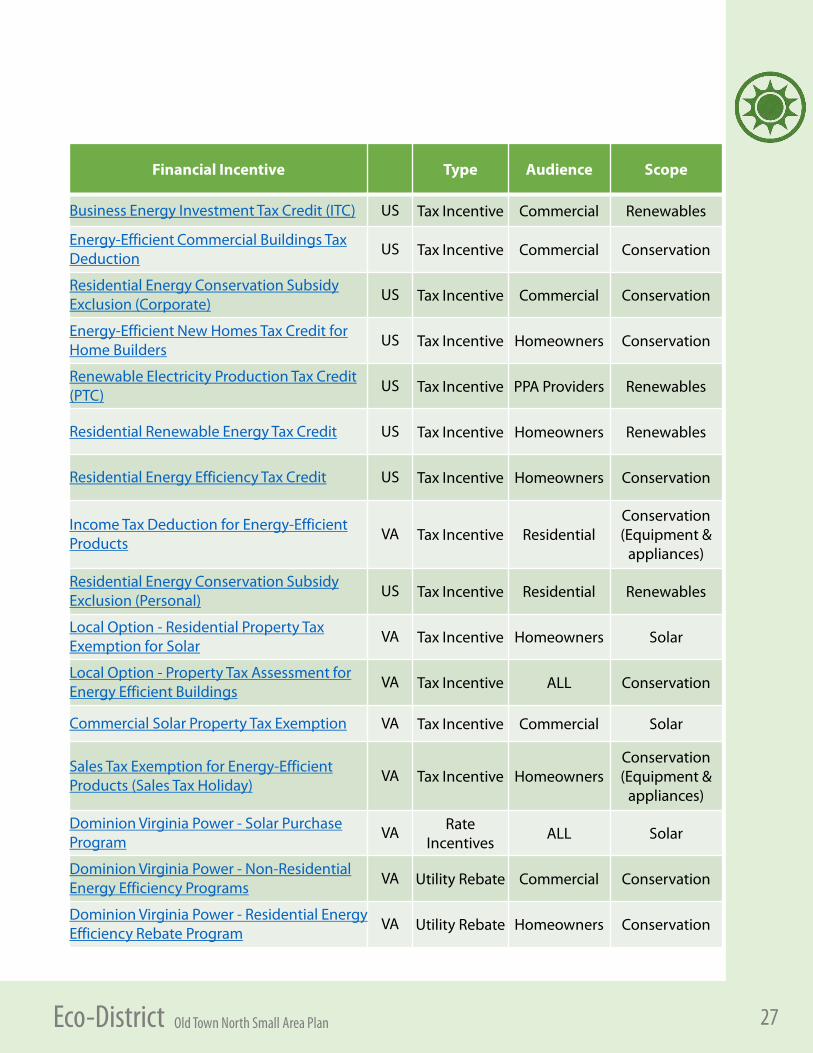
Incentives to encourage energy conservation upgrades to existing properties fall into three types: • Special loans programs, both at the federal and state
level - These programs often help property owners fund the initial investment for conservation measures, allowing participants to use the operational cost savings from the improvements to pay back the loan. Refer to the table on the next page for examples.
• Tax Incentives – These give property owners either relief from sales tax or income tax deductions or exemptions, again at both the Federal and State level.
• Rebates from utility companies – these offset the cost of conservation measures. There are also grants for low-income homeowners to fund improvements to lower utility costs. The following are examples of how incentives can encourage many of the improvements outlined in the last section.
Incentives for Lighting, Plug Load, and HVAC Energy SavingsTaxpayers in Virginia may take a personal income tax deduction equal to 20% of the sales taxes paid for energy efficient equipment, like clothes washers, room air conditioners, dishwashers, refrigerators, as well as heating and cooling equipment. Additionally, Virginia offers a sales tax holiday once a year for the purchase of Energy Star (and WaterSense) labelled equipment. Similar to the EnergyStar program, EPA’s WaterSense is a label that recognizes plumbing fixtures and appliances that meet water conservation thresholds, helping consumers select water conserving options. Virginia’s sales tax holiday applies to the purchase of LED light bulbs, an extremely cost effective way residential property owners can significantly reduce energy use. Washington Gas provides rebates on furnaces and tankless hot water heaters.
Incentives for Energy AuditsDominion Power offers the Home Energy Check Up program that provides an on-site analysis of energy use with upgrade recommendations, financial incentives that cover approved measures, and access to prequalified contractors(https://www.dom.com/residential/dominion-virginia-power/ways-to-save/energy-conservation-programs). Dominion also offers a non-residential energy audit and program, a similar incentive for commercial property owners. (https://www.dom.com/business/dominion-virginia-power/ways-to-save/energy-conservation-programs)
The City of Alexandria’s website provides tips on conserving energy (https://www.alexandriava.gov/Energy#tips) that includes a link to “Virginia Incentives for Renewable and Efficiency Energy”. This link takes visitors to the dsireusa.org website that catalogues incentives by State. (http://programs.dsireusa.org/system/program?state=VA). The City of Charlottesville has a catalogue of incentives with user-friendly links: www.charlottesville.org/greenincentives.
If 40% of property owners take advantage of incentive programs and reduce their energy use by 20%, the total energy use of the existing building stock with the District could drop down by 8%:
MMBTU/yr (.40) (-.20) = MMBTU/yr (-.08)In other words, 40% of total energy use of properties reduced by 20% equals an overall Eco-District wide reduction of total energy use by 8%.
Incentives to Improve Energy Consumption in Existing Properties
26Old Town North Small Area Plan Eco-District
Financial Incentive Type Audience Scope
Weatherization Assistance Program (WAP) US GrantLow-income homeowners
U.S. Department of Energy - Loan Guarantee Program USLoan
ProgramCommercial Renewables
Small Business & Non-Profit Loan Program VALoan
ProgramCommercial Renewables
VirginiaSAVES Green Community Loan Program VALoan
ProgramCommercial
Conservation/ Renewables
Energy-Efficient Mortgages USLoan
ProgramHome Owners
Conservation/Renewables
FHA PowerSaver Loan Program USLoan
ProgramHomeowners Conservation
Fannie Mae Green Initiative- Loan Program USLoan
ProgramMulti-family residential
Conservation
Clean Renewable Energy Bonds (CREBs) USLoan
ProgramPPA Providers Renewables
Commonwealth's Energy Leasing Program VALoan
ProgramState Agencies
Conservation/ Renewables
Commonwealth's Master Equipment Leasing Program VALoan
ProgramState Agencies
Conservation/ Renewables
Energy Project and Equipment Financing VALoan
ProgramState Agencies
Conservation/ Renewables
Local Option - Clean Energy Financing VALoan
ProgramALL
Conservation/ Renewables
Modified Accelerated Cost-Recovery System (MACRS) USTax
IncentiveCommercial
Renewables, Geothermal,
CHP
27Old Town North Small Area Plan Eco-District
Financial Incentive Type Audience Scope
Business Energy Investment Tax Credit (ITC) US Tax Incentive Commercial Renewables
Energy-Efficient Commercial Buildings Tax Deduction
US Tax Incentive Commercial Conservation
Residential Energy Conservation Subsidy Exclusion (Corporate)
US Tax Incentive Commercial Conservation
Energy-Efficient New Homes Tax Credit for Home Builders
US Tax Incentive Homeowners Conservation
Renewable Electricity Production Tax Credit (PTC)
US Tax Incentive PPA Providers Renewables
Residential Renewable Energy Tax Credit US Tax Incentive Homeowners Renewables
Residential Energy Efficiency Tax Credit US Tax Incentive Homeowners Conservation
Income Tax Deduction for Energy-Efficient Products
VA Tax Incentive ResidentialConservation (Equipment &
appliances)
Residential Energy Conservation Subsidy Exclusion (Personal)
US Tax Incentive Residential Renewables
Local Option - Residential Property Tax Exemption for Solar
VA Tax Incentive Homeowners Solar
Local Option - Property Tax Assessment for Energy Efficient Buildings
VA Tax Incentive ALL Conservation
Commercial Solar Property Tax Exemption VA Tax Incentive Commercial Solar
Sales Tax Exemption for Energy-Efficient Products (Sales Tax Holiday)
VA Tax Incentive HomeownersConservation (Equipment &
appliances)
Dominion Virginia Power - Solar Purchase Program
VA Rate Incentives
ALL Solar
Dominion Virginia Power - Non-Residential Energy Efficiency Programs
VA Utility Rebate Commercial Conservation
Dominion Virginia Power - Residential Energy Efficiency Rebate Program
VA Utility Rebate Homeowners Conservation
28Old Town North Small Area Plan Eco-District
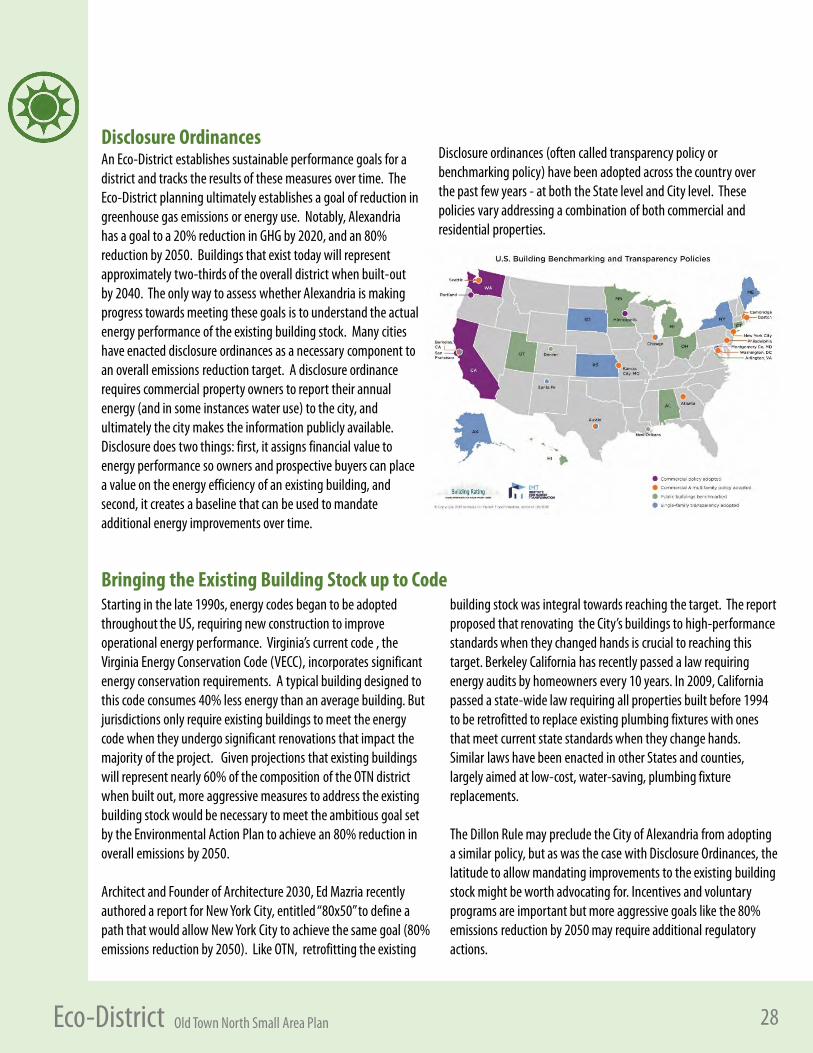
Disclosure OrdinancesAn Eco-District establishes sustainable performance goals for a district and tracks the results of these measures over time. The Eco-District planning ultimately establishes a goal of reduction in greenhouse gas emissions or energy use. Notably, Alexandria has a goal to a 20% reduction in GHG by 2020, and an 80% reduction by 2050. Buildings that exist today will represent approximately two-thirds of the overall district when built-out by 2040. The only way to assess whether Alexandria is making progress towards meeting these goals is to understand the actual energy performance of the existing building stock. Many cities have enacted disclosure ordinances as a necessary component to an overall emissions reduction target. A disclosure ordinance requires commercial property owners to report their annual energy (and in some instances water use) to the city, and ultimately the city makes the information publicly available. Disclosure does two things: first, it assigns financial value to energy performance so owners and prospective buyers can place a value on the energy efficiency of an existing building, and second, it creates a baseline that can be used to mandate additional energy improvements over time.
Disclosure ordinances (often called transparency policy or benchmarking policy) have been adopted across the country over the past few years - at both the State level and City level. These policies vary addressing a combination of both commercial and residential properties.
Starting in the late 1990s, energy codes began to be adopted throughout the US, requiring new construction to improve operational energy performance. Virginia’s current code , the Virginia Energy Conservation Code (VECC), incorporates significant energy conservation requirements. A typical building designed to this code consumes 40% less energy than an average building. But jurisdictions only require existing buildings to meet the energy code when they undergo significant renovations that impact the majority of the project. Given projections that existing buildings will represent nearly 60% of the composition of the OTN district when built out, more aggressive measures to address the existing building stock would be necessary to meet the ambitious goal set by the Environmental Action Plan to achieve an 80% reduction in overall emissions by 2050.
Architect and Founder of Architecture 2030, Ed Mazria recently authored a report for New York City, entitled “80x50” to define a path that would allow New York City to achieve the same goal (80% emissions reduction by 2050). Like OTN, retrofitting the existing
building stock was integral towards reaching the target. The report proposed that renovating the City’s buildings to high-performance standards when they changed hands is crucial to reaching this target. Berkeley California has recently passed a law requiring energy audits by homeowners every 10 years. In 2009, California passed a state-wide law requiring all properties built before 1994 to be retrofitted to replace existing plumbing fixtures with ones that meet current state standards when they change hands. Similar laws have been enacted in other States and counties, largely aimed at low-cost, water-saving, plumbing fixture replacements.
The Dillon Rule may preclude the City of Alexandria from adopting a similar policy, but as was the case with Disclosure Ordinances, the latitude to allow mandating improvements to the existing building stock might be worth advocating for. Incentives and voluntary programs are important but more aggressive goals like the 80% emissions reduction by 2050 may require additional regulatory actions.
Bringing the Existing Building Stock up to Code
29Old Town North Small Area Plan Eco-District
Hotel3%
Retail Store2%
Office Bldgs17%
Single-Family11%Multi-
Family67%
Projected Development Mix of Uses (by GSF)
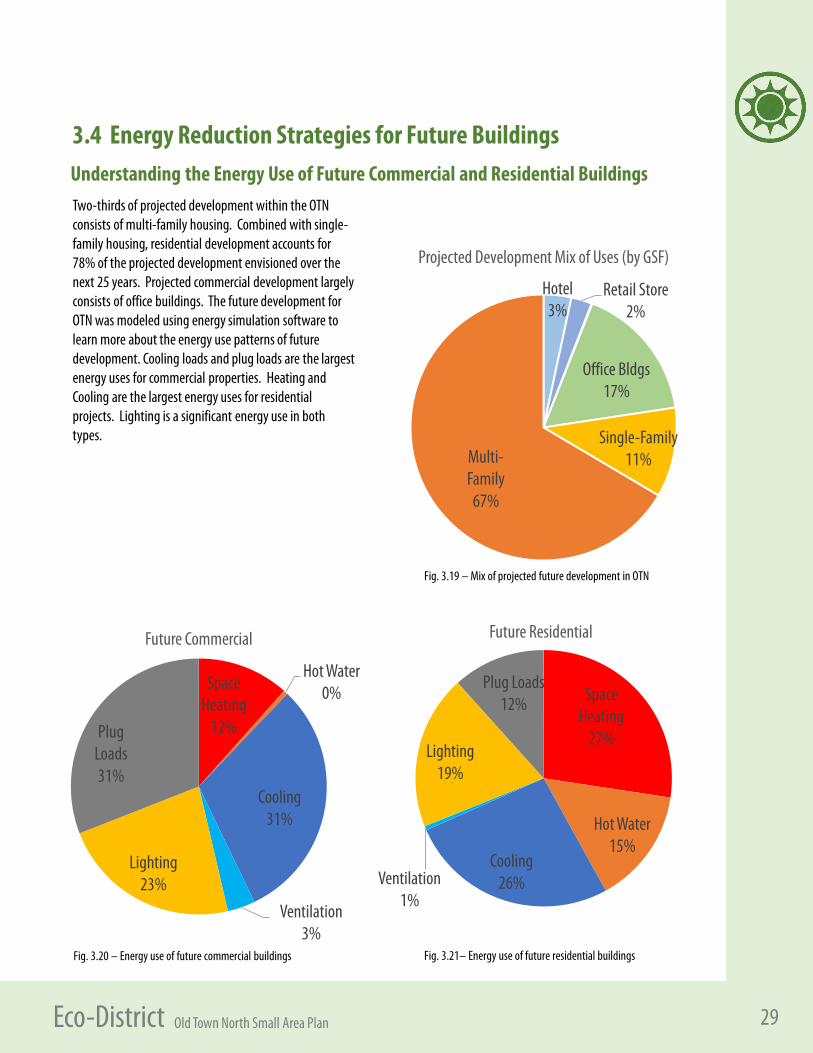
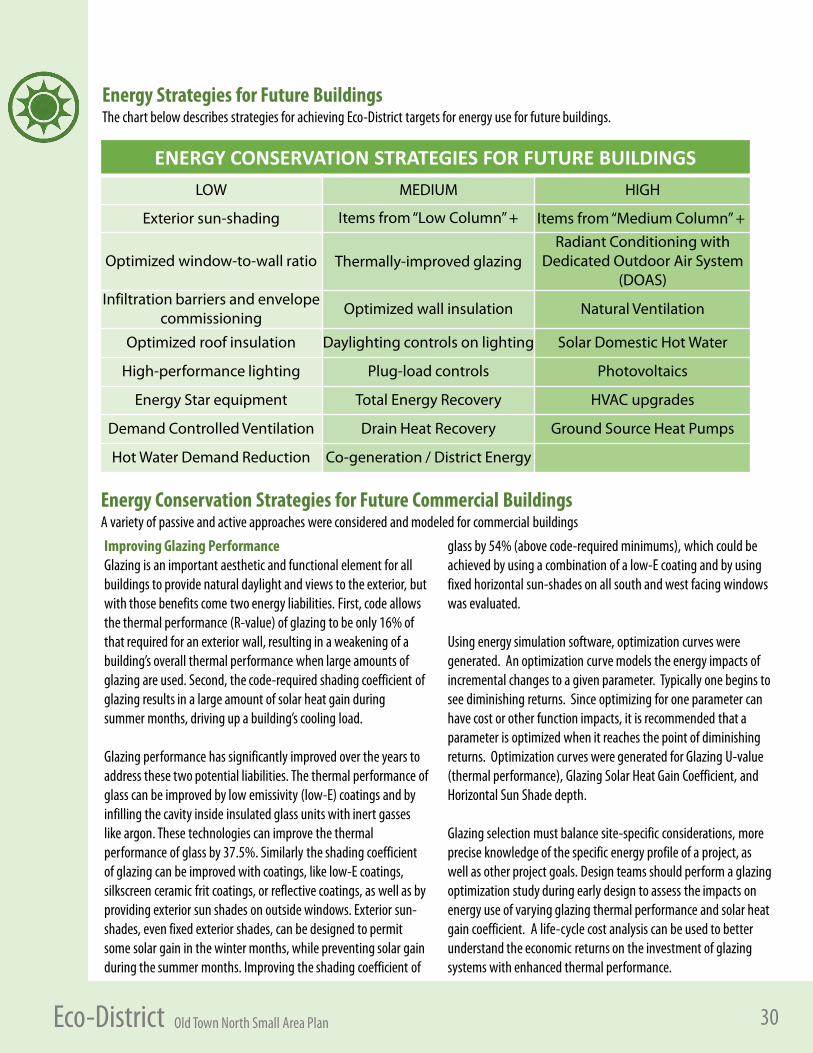
Two-thirds of projected development within the OTN consists of multi-family housing. Combined with single-family housing, residential development accounts for 78% of the projected development envisioned over the next 25 years. Projected commercial development largely consists of office buildings. The future development for OTN was modeled using energy simulation software to learn more about the energy use patterns of future development. Cooling loads and plug loads are the largest energy uses for commercial properties. Heating and Cooling are the largest energy uses for residential projects. Lighting is a significant energy use in both types.
Space Heating
12%
Hot Water0%
Cooling31%
Ventilation3%
Lighting23%
Plug Loads31%
Future Commercial
Space Heating
27%
Hot Water15%
Cooling26%Ventilation
1%
Lighting19%
Plug Loads12%
Future Residential
Fig. 3.21– Energy use of future residential buildings
Fig. 3.19 – Mix of projected future development in OTN
3.4 Energy Reduction Strategies for Future BuildingsUnderstanding the Energy Use of Future Commercial and Residential Buildings
Fig. 3.20 – Energy use of future commercial buildings
30Old Town North Small Area Plan Eco-District
ENERGY CONSERVATION STRATEGIES FOR FUTURE BUILDINGSLOW MEDIUM HIGH
Exterior sun-shading Items from “Low Column” + Items from “Medium Column” +
Optimized window-to-wall ratio Thermally-improved glazingRadiant Conditioning with
Dedicated Outdoor Air System (DOAS)
Infiltration barriers and envelope commissioning
Optimized wall insulation Natural Ventilation
Optimized roof insulation Daylighting controls on lighting Solar Domestic Hot Water
High-performance lighting Plug-load controls Photovoltaics
Energy Star equipment Total Energy Recovery HVAC upgrades
Demand Controlled Ventilation Drain Heat Recovery Ground Source Heat Pumps
Hot Water Demand Reduction Co-generation / District Energy
Energy Strategies for Future BuildingsThe chart below describes strategies for achieving Eco-District targets for energy use for future buildings.
Energy Conservation Strategies for Future Commercial BuildingsA variety of passive and active approaches were considered and modeled for commercial buildings
Improving Glazing PerformanceGlazing is an important aesthetic and functional element for all buildings to provide natural daylight and views to the exterior, but with those benefits come two energy liabilities. First, code allows the thermal performance (R-value) of glazing to be only 16% of that required for an exterior wall, resulting in a weakening of a building’s overall thermal performance when large amounts of glazing are used. Second, the code-required shading coefficient of glazing results in a large amount of solar heat gain during summer months, driving up a building’s cooling load.
Glazing performance has significantly improved over the years to address these two potential liabilities. The thermal performance of glass can be improved by low emissivity (low-E) coatings and by infilling the cavity inside insulated glass units with inert gasses like argon. These technologies can improve the thermal performance of glass by 37.5%. Similarly the shading coefficient of glazing can be improved with coatings, like low-E coatings, silkscreen ceramic frit coatings, or reflective coatings, as well as by providing exterior sun shades on outside windows. Exterior sun-shades, even fixed exterior shades, can be designed to permit some solar gain in the winter months, while preventing solar gain during the summer months. Improving the shading coefficient of
glass by 54% (above code-required minimums), which could be achieved by using a combination of a low-E coating and by using fixed horizontal sun-shades on all south and west facing windows was evaluated.
Using energy simulation software, optimization curves were generated. An optimization curve models the energy impacts of incremental changes to a given parameter. Typically one begins to see diminishing returns. Since optimizing for one parameter can have cost or other function impacts, it is recommended that a parameter is optimized when it reaches the point of diminishing returns. Optimization curves were generated for Glazing U-value (thermal performance), Glazing Solar Heat Gain Coefficient, and Horizontal Sun Shade depth.
Glazing selection must balance site-specific considerations, more precise knowledge of the specific energy profile of a project, as well as other project goals. Design teams should perform a glazing optimization study during early design to assess the impacts on energy use of varying glazing thermal performance and solar heat gain coefficient. A life-cycle cost analysis can be used to better understand the economic returns on the investment of glazing systems with enhanced thermal performance.
31Old Town North Small Area Plan Eco-District
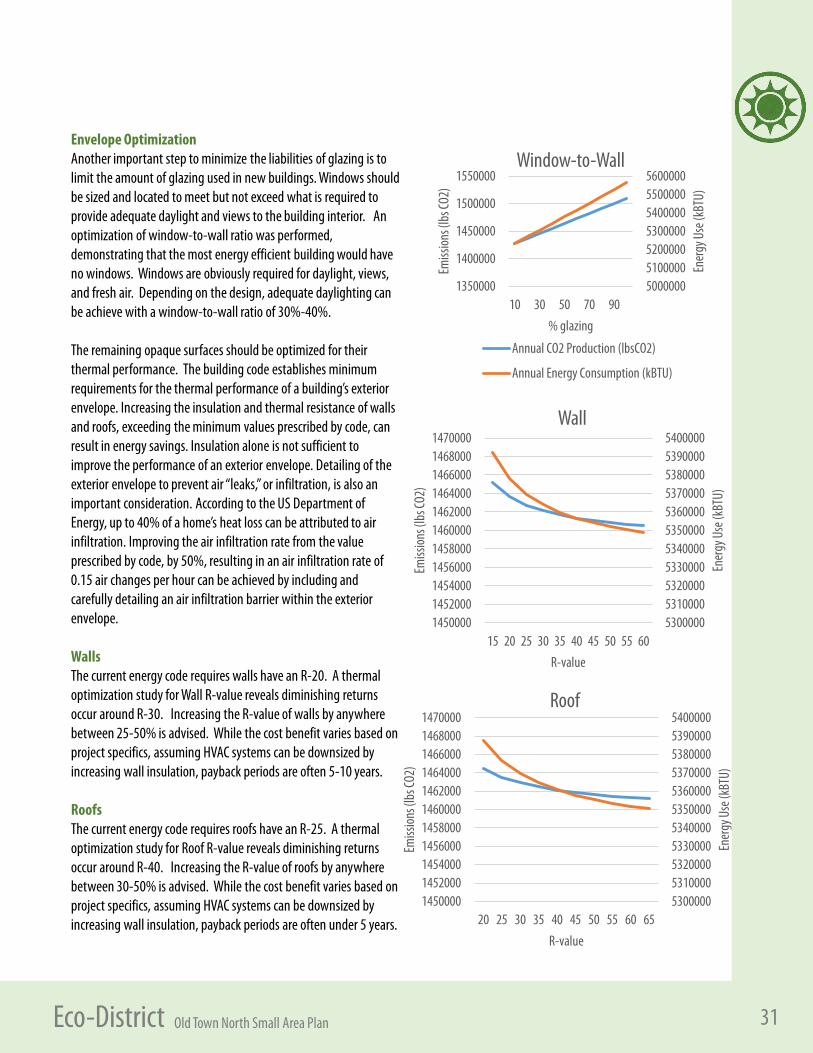
Envelope OptimizationAnother important step to minimize the liabilities of glazing is to limit the amount of glazing used in new buildings. Windows should be sized and located to meet but not exceed what is required to provide adequate daylight and views to the building interior. An optimization of window-to-wall ratio was performed, demonstrating that the most energy efficient building would have no windows. Windows are obviously required for daylight, views, and fresh air. Depending on the design, adequate daylighting can be achieve with a window-to-wall ratio of 30%-40%.
The remaining opaque surfaces should be optimized for their thermal performance. The building code establishes minimum requirements for the thermal performance of a building’s exterior envelope. Increasing the insulation and thermal resistance of walls and roofs, exceeding the minimum values prescribed by code, can result in energy savings. Insulation alone is not sufficient to improve the performance of an exterior envelope. Detailing of the exterior envelope to prevent air “leaks,” or infiltration, is also an important consideration. According to the US Department of Energy, up to 40% of a home’s heat loss can be attributed to air infiltration. Improving the air infiltration rate from the value prescribed by code, by 50%, resulting in an air infiltration rate of 0.15 air changes per hour can be achieved by including and carefully detailing an air infiltration barrier within the exterior envelope.
WallsThe current energy code requires walls have an R-20. A thermal optimization study for Wall R-value reveals diminishing returns occur around R-30. Increasing the R-value of walls by anywhere between 25-50% is advised. While the cost benefit varies based on project specifics, assuming HVAC systems can be downsized by increasing wall insulation, payback periods are often 5-10 years.
RoofsThe current energy code requires roofs have an R-25. A thermal optimization study for Roof R-value reveals diminishing returns occur around R-40. Increasing the R-value of roofs by anywhere between 30-50% is advised. While the cost benefit varies based on project specifics, assuming HVAC systems can be downsized by increasing wall insulation, payback periods are often under 5 years.
5000000510000052000005300000540000055000005600000
1350000
1400000
1450000
1500000
1550000
10 30 50 70 90
Ener
gy U
se (k
BTU)
Emiss
ions (
lbs C
O2)
% glazing
Window-to-Wall
Annual CO2 Production (lbsCO2)
Annual Energy Consumption (kBTU)
53000005310000532000053300005340000535000053600005370000538000053900005400000
14500001452000145400014560001458000146000014620001464000146600014680001470000
15 20 25 30 35 40 45 50 55 60
Ener
gy U
se (k
BTU)
Emiss
ions (
lbs C
O2)
R-value
Wall
53000005310000532000053300005340000535000053600005370000538000053900005400000
14500001452000145400014560001458000146000014620001464000146600014680001470000
20 25 30 35 40 45 50 55 60 65
Ener
gy U
se (k
BTU)
Emiss
ions (
lbs C
O2)
R-value
Roof
32Old Town North Small Area Plan Eco-District
490000050000005100000520000053000005400000550000056000005700000
14200001430000144000014500001460000147000014800001490000
0.020.140.250.370.480.6 0.710.830.941.06
Ener
gy Us
e (kB
TU)
Emiss
ions (
lbs CO
2)
U-value
GlazingAnnual CO2 Production (lbsCO2) Annual Energy Consumption (kBTU)
4000000
4500000
5000000
5500000
6000000
6500000
600000800000
100000012000001400000160000018000002000000
0.1 0.2 0.3 0.4 0.5 0.6 0.7 0.8 0.9 1En
ergy
Use (
kBTU
)
Emiss
ions (
lbs CO
2)
SHGC
Solar Heat Gain Coefficient
5100000
5150000
5200000
5250000
5300000
5350000
5400000
1380000
1400000
1420000
1440000
1460000
1480000
0 0.5 1 1.5 2 2.5 3 3.5 4 4.5
Ener
gy Us
e (kB
TU)
Emiss
ions (
lbs CO
2)
Feet
Horizontal Sun-shade Depth
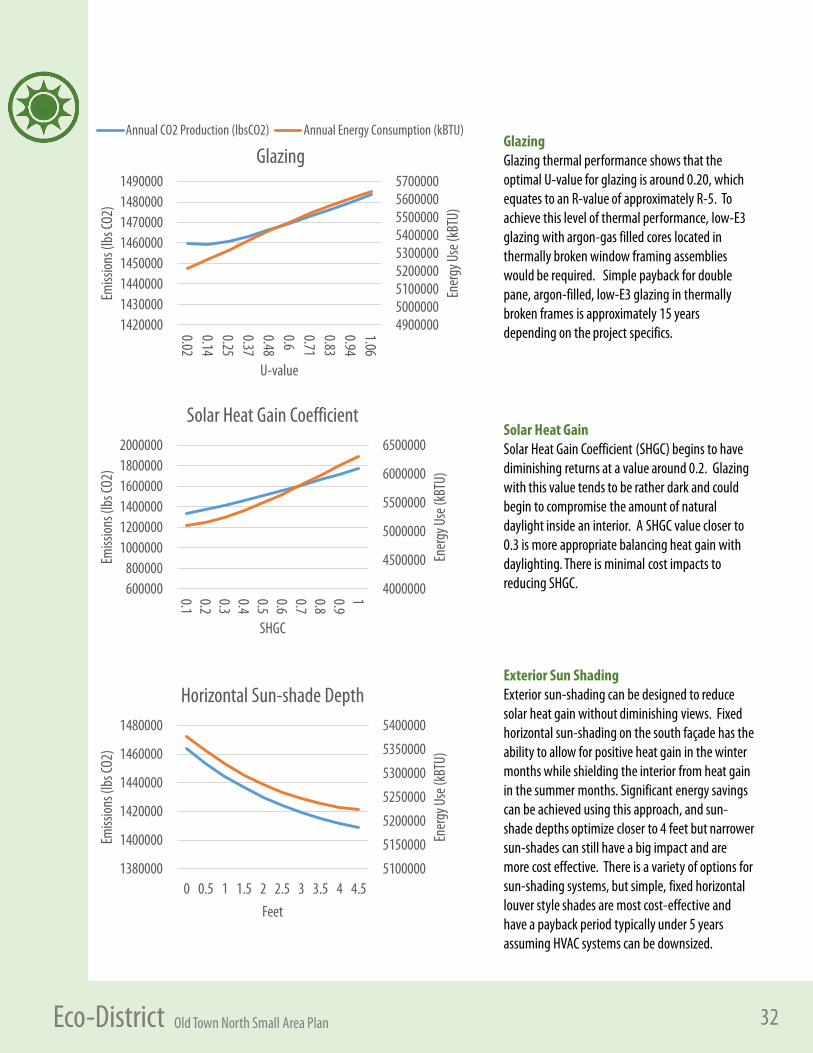
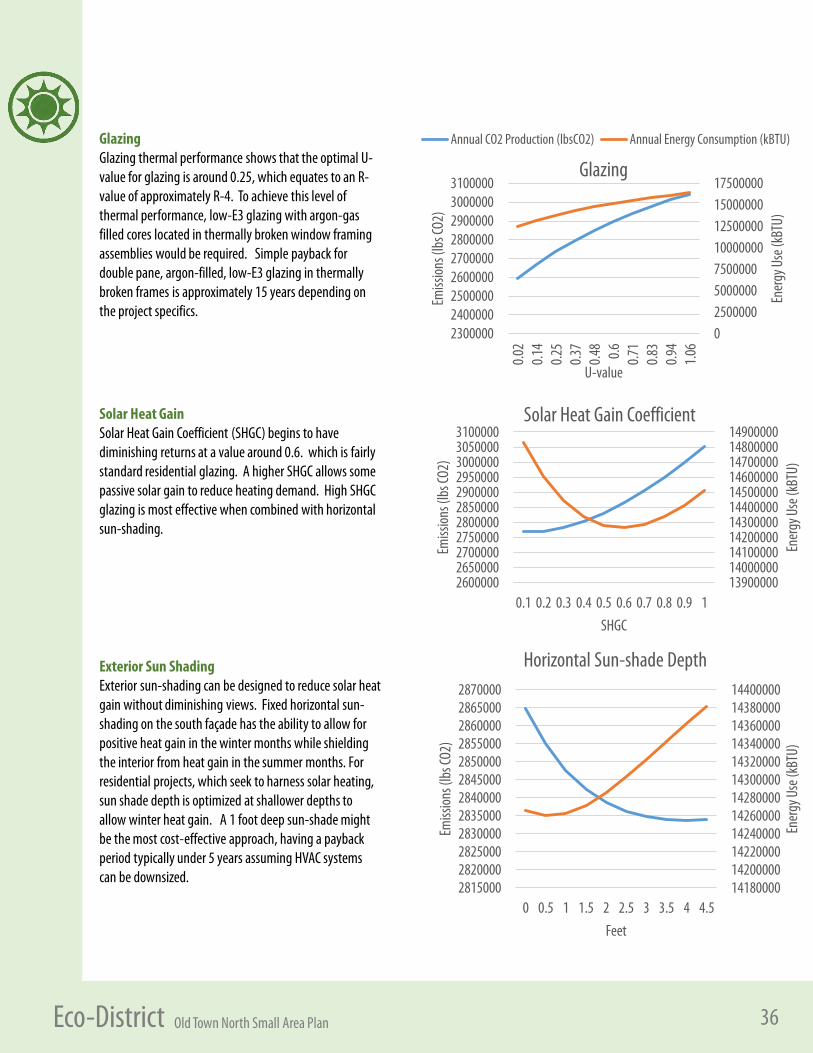
Solar Heat GainSolar Heat Gain Coefficient (SHGC) begins to have diminishing returns at a value around 0.2. Glazing with this value tends to be rather dark and could begin to compromise the amount of natural daylight inside an interior. A SHGC value closer to 0.3 is more appropriate balancing heat gain with daylighting. There is minimal cost impacts to reducing SHGC.
GlazingGlazing thermal performance shows that the optimal U-value for glazing is around 0.20, which equates to an R-value of approximately R-5. To achieve this level of thermal performance, low-E3 glazing with argon-gas filled cores located in thermally broken window framing assemblies would be required. Simple payback for double pane, argon-filled, low-E3 glazing in thermally broken frames is approximately 15 years depending on the project specifics.
Exterior Sun Shading Exterior sun-shading can be designed to reduce solar heat gain without diminishing views. Fixed horizontal sun-shading on the south façade has the ability to allow for positive heat gain in the winter months while shielding the interior from heat gain in the summer months. Significant energy savings can be achieved using this approach, and sun-shade depths optimize closer to 4 feet but narrower sun-shades can still have a big impact and are more cost effective. There is a variety of options for sun-shading systems, but simple, fixed horizontal louver style shades are most cost-effective and have a payback period typically under 5 years assuming HVAC systems can be downsized.
33Old Town North Small Area Plan Eco-District
High-Performance Lighting & DaylightingCode requires a maximum lighting power density (the amount of watts per square foot of building used for lighting) of 1.0 watts/sf. Improving upon this lighting power density (LPD) is possible, resulting in both less energy for lighting as well as less energy for cooling the waste heat from lighting. Strategies to improve LPD include task/ambient lighting (providing lower light levels that are supplemented as needed by task lights), high-efficiency lighting, and occupancy sensors that automatically shut off lights when spaces are not occupied. These approaches combined could result in a 25-35% reduction in LPD.
Reliance on artificial lighting can be significantly reduced by planning the building fenestration and interior layout so that daylight meets or supplements the building’s lighting demand. Several design strategies should be considered to maximize the benefit of daylighting, including:• Selection of glass to provide good visible light transmittance,
balanced with the need to control solar heat gain;• Consideration of window location and size, with a preference
towards windows with a head that touches the ceiling;• Consideration of tall ceilings to allow daylight to penetrate
deep within a building’s footprint;• Interior planning to avoid closed offices around a building’s
perimeter, allowing daylight to penetrate deep within a building’s footprint;
• Preference for narrow building footprints to maximize daylight zones within the building footprint;
• Incorporation of light shelves (both interior and exterior) to improve daylight penetration;
• Use of light colored interior finishes, especially ceilings, to improve natural light reflection; and
• Automatic control of artificial lighting to dim or to step-down artificial light output depending on the amount of natural light entering the interior. Lighting zones and layouts should be planned to maximize the benefit from the natural light.
The cost payback of high-performance lighting is nearly instantaneous, since it merely requires strong lighting design and careful interior planning, and reducing LPD can reduce cooling demand resulting in downsizing HVAC equipment. Daylight design often requires using daylight sensors and
dimmable or stepped lighting, which does have a modest cost premium. The payback for daylighting including lighting controls and electronic ballasts can be anywhere from 4-10 years.
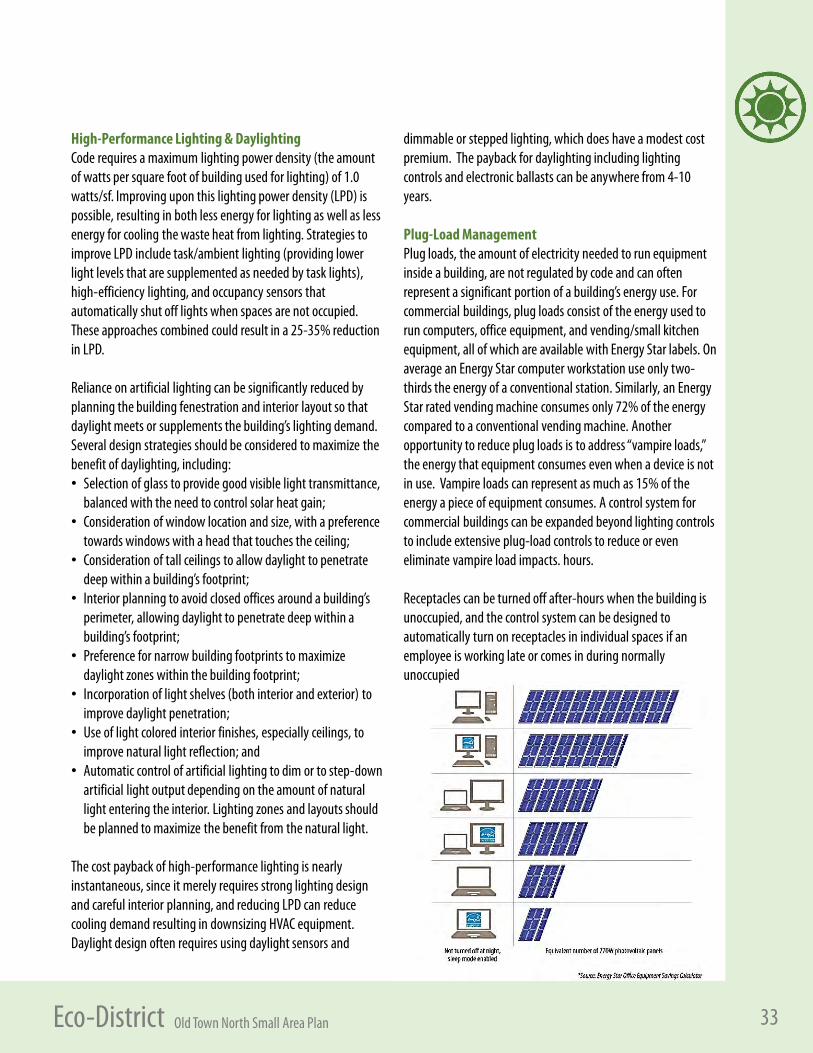
Plug-Load ManagementPlug loads, the amount of electricity needed to run equipment inside a building, are not regulated by code and can often represent a significant portion of a building’s energy use. For commercial buildings, plug loads consist of the energy used to run computers, office equipment, and vending/small kitchen equipment, all of which are available with Energy Star labels. On average an Energy Star computer workstation use only two-thirds the energy of a conventional station. Similarly, an Energy Star rated vending machine consumes only 72% of the energy compared to a conventional vending machine. Another opportunity to reduce plug loads is to address “vampire loads,” the energy that equipment consumes even when a device is not in use. Vampire loads can represent as much as 15% of the energy a piece of equipment consumes. A control system for commercial buildings can be expanded beyond lighting controls to include extensive plug-load controls to reduce or even eliminate vampire load impacts. hours.
Receptacles can be turned off after-hours when the building is unoccupied, and the control system can be designed to automatically turn on receptacles in individual spaces if an employee is working late or comes in during normally unoccupied
34Old Town North Small Area Plan Eco-District
Radiant Conditioning with DOASConventional, all-air HVAC systems rely on large air handling units and bulky ductwork to transfer heat to or from occupied spaces. Radiant heating and cooling systems differ because they heat or cool surfaces rather than air. The surfaces also conduct heat to people that touch them, and warm or cool the air by convection as well. Radiant systems use water or refrigerant as the heat transfer medium, which transports energy more efficiently than air, reducing chiller demand. Modern radiant systems can save large amounts of energy while also providing better comfort and are often integrated into floors or ceilings. They are more efficient than forced air heating or cooling because there are no duct losses. They are not used for humidity control and dehumidification via the ventilation air system. Radiant system are coupled with a dedicated outdoor air system (DOAS) which provides a ventilation and dehumidification working parallel with the radiant system to handle space conditioning. Fans are only needed to supply the required ventilation air, since air is not used to heat or cool a space, resulting in significantly less fan energy.
Chilled beams distribute chilled water through overhead horizontal cooling coils, and milder water temperatures can be used reducing chiller demand. They transfer heat primarily via piping, saving initial and operating costs while taking up less overhead space. “Passive” chilled beams and radiant ceilings/slabs largely rely on a downward convective force to distribute cooling from a coil or flat surface. “Active” chilled beams employ smaller primary air systems, often with a dedicated outside air system, to enhance air flow through a cooling coil to increase capacity and provide more uniform comfort within an area.
Variable refrigerant flow (VRF) systems use refrigerant as the cooling and heating medium. The refrigerant is conditioned by a single condensing unit, and is circulated within the building to multiple fan-coil units. The fan coil units can be mounted in a space in the ceiling or walls, or hidden above the ceiling, or located near the conditioned space connected through short air ducts. Fan coils condition and recirculate air from the space and are coupled with an independent DOAS for ventilation and dehumidification. Heat recovery VRF technology allows individual indoor units to heat or cool as required, while the central condensing unit load benefits from internal heat recovery. They are the primary HVAC system choice in Europe, Japan, China, and other parts of the world, and are beginning to penetrate the U.S. market.
Costs and energy savings vary a great deal making it challenging to define a single payback for the many applications of the systems, but it is possible to achieve a simple payback of 15 years or less. The GSA Report on VRF systems is a useful reference to better understand the most suitable applications, benefits, and economics of this system. http://www.gsa.gov/portal/mediaId/169771/fileName/GPG_VRF_Report_-_FINAL_DRAFT_4-16-13
Natural VentilationOffices can benefit from using natural ventilation to passively cool and ventilate their interiors for a portion of the year. While the climate in Alexandria has hot, humid summers and cold winters, the Spring and Fall have a climate that supports natural ventilation. Natural ventilation in this region can provide comfortable interiors without any mechanical cooling and ventilation for approximately 10% of the year. There is a cost premium for operable windows and building controls, which will in time payback from reduced operational energy use. It is not easy to quantify the return on investment because it depends on details of building siting and design. Other barriers to naturally ventilating office environments is the potential for street noise, air quality, security, and the need for an open-layout interior to optimize cross ventilation. Less quantifiable benefits include providing occupants control over their thermal comfort and improved occupant satisfaction connecting occupants to the outside environment.
Demand Controlled VentilationSimilar to the concept of an occupancy sensor that controls lighting based on whether a room is occupied, ventilation air can be supplied to a space only when it is occupied. Demand controlled ventilation uses CO2 sensors to monitor interior air in order to sense when a space is occupied and to tailor ventilation rates based on the number of occupants within a space. Not only does this approach lead to energy savings, but it also can improve indoor air quality ensuring that adequate ventilation is always provided within a space. Concentrations of CO2 from full occupancy of a space may take some time to build up, resulting in a potential lag between the time of occupancy and the time of increased ventilation. As such, demand controlled ventilation is better suited for spaces that do not experience significant, short term changes in occupancy.
35Old Town North Small Area Plan Eco-District
Energy RecoveryEnergy Recovery systems recover thermal energy from exhaust air and recycling that energy, to pre-heat supply air. A total energy recovery wheel is an air-to-air heat exchanger that not only can transfer sensible heat but also latent heat. Not only is temperature transferred but these energy recovery wheels also transfer moisture using a desiccant. During the cooling season the desiccant wheel both dehumidifies and pre-cools outside air, significantly reducing the cooling requirements of the conditioned space. In the heating season, the process reverses and the energy recovery wheel both humidifies and preheats outdoor air. Energy recovery wheels work best in program types with high ventilation rates, since these spaces have higher volumes of supply and exhaust air. Energy recovery wheels increase static pressures resulting in greater fan energy; as such, the savings in cooling and heating might be offset by increased fan energy in space types that do not have high ventilation rates.
Improving Glazing PerformanceResidential properties’ energy consumption is often impacted more by external loads than commercial properties, so envelope improvements and glazing approaches are essential. Multi-family residential projects would benefit from the glazing recommendation described for commercial buildings in the last section. (low-E3, argon-filled insulated glazing in thermally-broken frames). Smaller scaled multi-family as well as single family residences would use residential window systems and should utilize similar glazing (low-E3, argon-filled insulated glazing) but with metal clad wood, or fiberglass frames. Since residential properties also have a larger heating demand, glazing selections should consider the benefit of passive solar heat gain. Refer to the charts on the subsequent pages.
Energy Conservation Strategies for Future Residential BuildingsA variety of passive and active approaches were considered and modeled for buildings
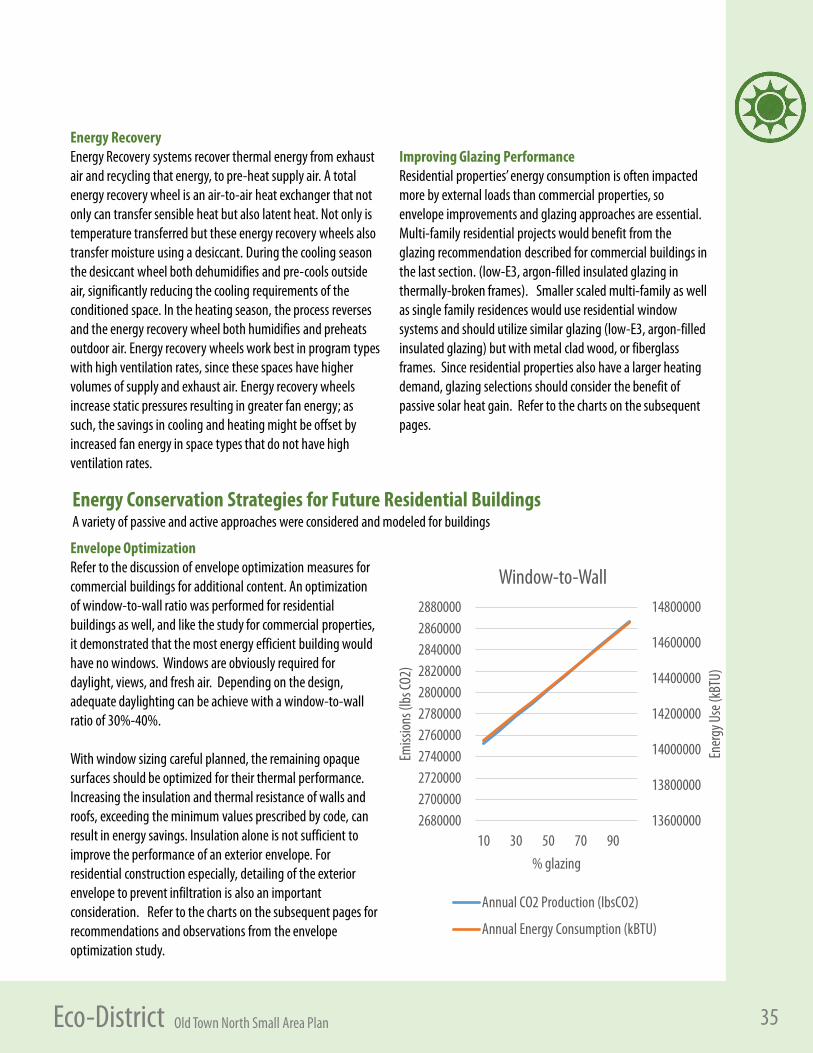
Envelope OptimizationRefer to the discussion of envelope optimization measures for commercial buildings for additional content. An optimization of window-to-wall ratio was performed for residential buildings as well, and like the study for commercial properties, it demonstrated that the most energy efficient building would have no windows. Windows are obviously required for daylight, views, and fresh air. Depending on the design, adequate daylighting can be achieve with a window-to-wall ratio of 30%-40%.
With window sizing careful planned, the remaining opaque surfaces should be optimized for their thermal performance. Increasing the insulation and thermal resistance of walls and roofs, exceeding the minimum values prescribed by code, can result in energy savings. Insulation alone is not sufficient to improve the performance of an exterior envelope. For residential construction especially, detailing of the exterior envelope to prevent infiltration is also an important consideration. Refer to the charts on the subsequent pages for recommendations and observations from the envelope optimization study.
13600000
13800000
14000000
14200000
14400000
14600000
14800000
26800002700000272000027400002760000278000028000002820000284000028600002880000
10 30 50 70 90
Ener
gy Us
e (kB
TU)
Emiss
ions (
lbs CO
2)
% glazing
Window-to-Wall
Annual CO2 Production (lbsCO2)
Annual Energy Consumption (kBTU)
36Old Town North Small Area Plan Eco-District
Glazing Glazing thermal performance shows that the optimal U-value for glazing is around 0.25, which equates to an R-value of approximately R-4. To achieve this level of thermal performance, low-E3 glazing with argon-gas filled cores located in thermally broken window framing assemblies would be required. Simple payback for double pane, argon-filled, low-E3 glazing in thermally broken frames is approximately 15 years depending on the project specifics.
025000005000000750000010000000125000001500000017500000
230000024000002500000260000027000002800000290000030000003100000
0.02
0.14
0.25
0.37
0.48 0.6 0.71
0.83
0.94
1.06
Ener
gy Us
e (kB
TU)
Emiss
ions (
lbs CO
2)
U-value
Glazing
Annual CO2 Production (lbsCO2) Annual Energy Consumption (kBTU)
Solar Heat Gain Solar Heat Gain Coefficient (SHGC) begins to have diminishing returns at a value around 0.6. which is fairly standard residential glazing. A higher SHGC allows some passive solar gain to reduce heating demand. High SHGC glazing is most effective when combined with horizontal sun-shading.
Exterior Sun Shading Exterior sun-shading can be designed to reduce solar heat gain without diminishing views. Fixed horizontal sun-shading on the south façade has the ability to allow for positive heat gain in the winter months while shielding the interior from heat gain in the summer months. For residential projects, which seek to harness solar heating, sun shade depth is optimized at shallower depths to allow winter heat gain. A 1 foot deep sun-shade might be the most cost-effective approach, having a payback period typically under 5 years assuming HVAC systems can be downsized.
1390000014000000141000001420000014300000144000001450000014600000147000001480000014900000
26000002650000270000027500002800000285000029000002950000300000030500003100000
0.1 0.2 0.3 0.4 0.5 0.6 0.7 0.8 0.9 1
Ener
gy Us
e (kB
TU)
Emiss
ions (
lbs CO
2)
SHGC
Solar Heat Gain Coefficient
141800001420000014220000142400001426000014280000143000001432000014340000143600001438000014400000
281500028200002825000283000028350002840000284500028500002855000286000028650002870000
0 0.5 1 1.5 2 2.5 3 3.5 4 4.5
Ener
gy Us
e (kB
TU)
Emiss
ions (
lbs CO
2)
Feet
Horizontal Sun-shade Depth
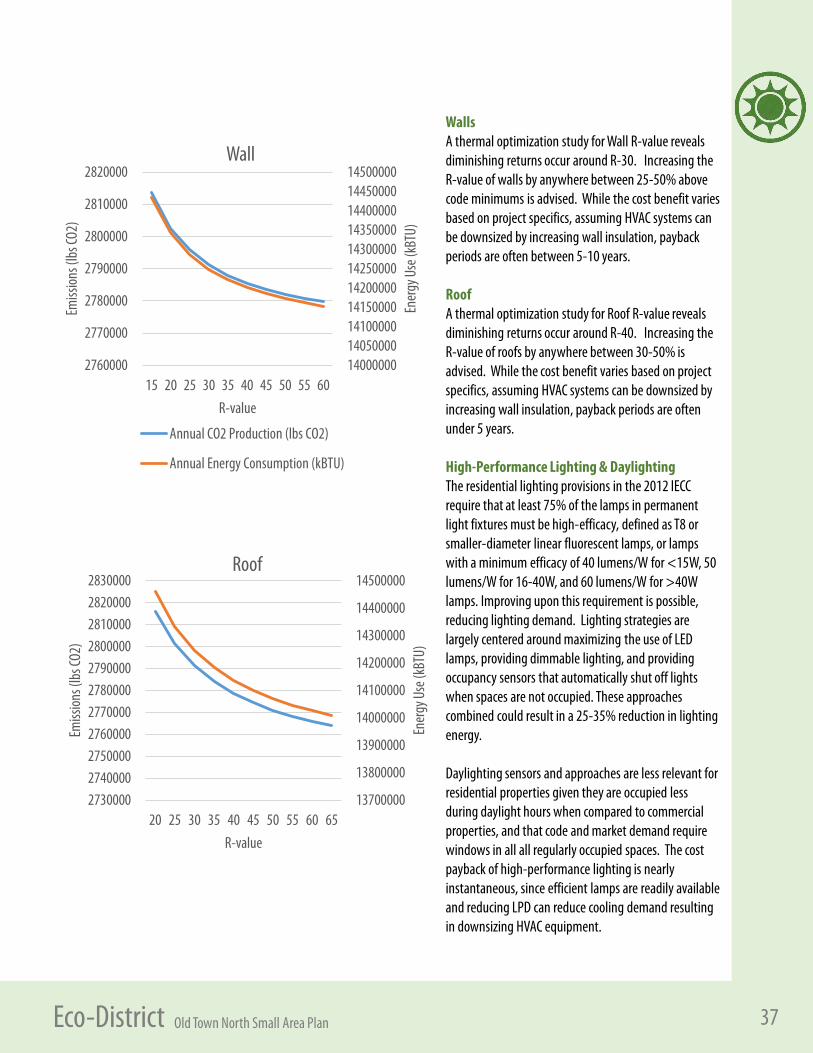
37Old Town North Small Area Plan Eco-District
WallsA thermal optimization study for Wall R-value reveals diminishing returns occur around R-30. Increasing the R-value of walls by anywhere between 25-50% above code minimums is advised. While the cost benefit varies based on project specifics, assuming HVAC systems can be downsized by increasing wall insulation, payback periods are often between 5-10 years.
RoofA thermal optimization study for Roof R-value reveals diminishing returns occur around R-40. Increasing the R-value of roofs by anywhere between 30-50% is advised. While the cost benefit varies based on project specifics, assuming HVAC systems can be downsized by increasing wall insulation, payback periods are often under 5 years.
High-Performance Lighting & DaylightingThe residential lighting provisions in the 2012 IECC require that at least 75% of the lamps in permanent light fixtures must be high-efficacy, defined as T8 or smaller-diameter linear fluorescent lamps, or lamps with a minimum efficacy of 40 lumens/W for <15W, 50 lumens/W for 16-40W, and 60 lumens/W for >40W lamps. Improving upon this requirement is possible, reducing lighting demand. Lighting strategies are largely centered around maximizing the use of LED lamps, providing dimmable lighting, and providing occupancy sensors that automatically shut off lights when spaces are not occupied. These approaches combined could result in a 25-35% reduction in lighting energy.
Daylighting sensors and approaches are less relevant for residential properties given they are occupied less during daylight hours when compared to commercial properties, and that code and market demand require windows in all all regularly occupied spaces. The cost payback of high-performance lighting is nearly instantaneous, since efficient lamps are readily available and reducing LPD can reduce cooling demand resulting in downsizing HVAC equipment.
13700000
13800000
13900000
14000000
14100000
14200000
14300000
14400000
14500000
27300002740000275000027600002770000278000027900002800000281000028200002830000
20 25 30 35 40 45 50 55 60 65
Ener
gy Us
e (kB
TU)
Emiss
ions (
lbs CO
2)
R-value
Roof
1400000014050000141000001415000014200000142500001430000014350000144000001445000014500000
2760000
2770000
2780000
2790000
2800000
2810000
2820000
15 20 25 30 35 40 45 50 55 60
Ener
gy Us
e (kB
TU)
Emiss
ions (
lbs CO
2)
R-value
Wall
Annual CO2 Production (lbs CO2)
Annual Energy Consumption (kBTU)
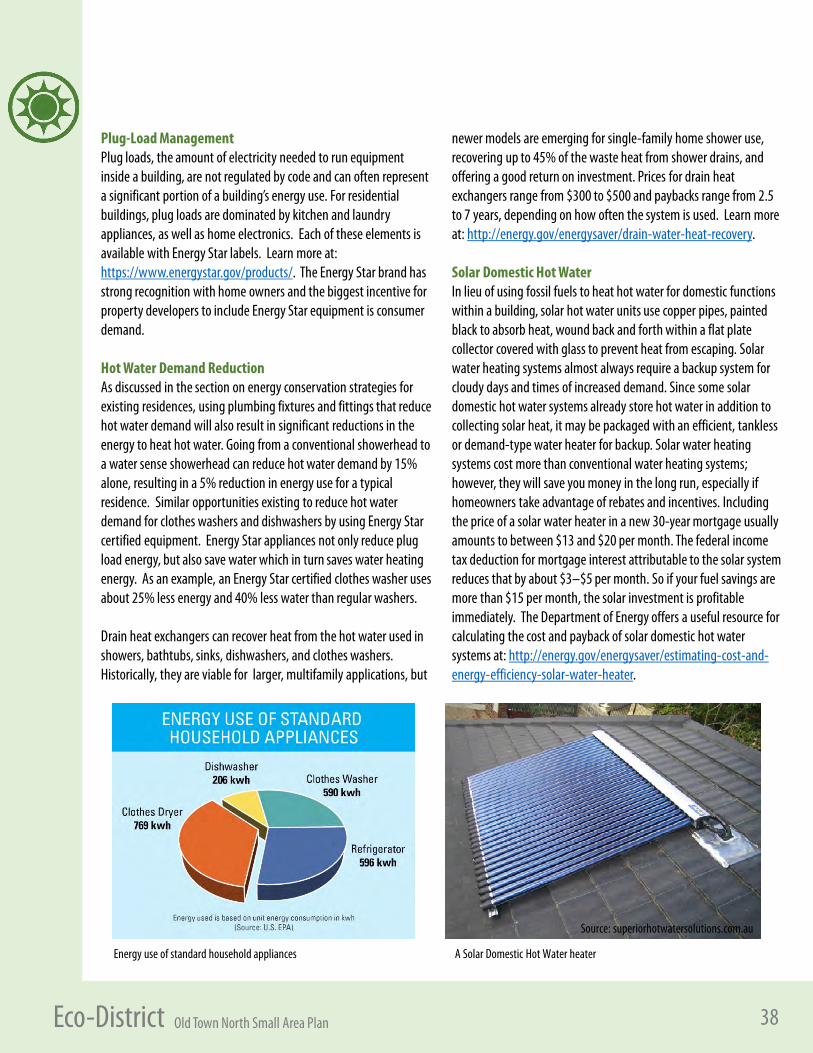
38Old Town North Small Area Plan Eco-District
Plug-Load ManagementPlug loads, the amount of electricity needed to run equipment inside a building, are not regulated by code and can often represent a significant portion of a building’s energy use. For residential buildings, plug loads are dominated by kitchen and laundry appliances, as well as home electronics. Each of these elements is available with Energy Star labels. Learn more at: https://www.energystar.gov/products/. The Energy Star brand has strong recognition with home owners and the biggest incentive for property developers to include Energy Star equipment is consumer demand.
Hot Water Demand ReductionAs discussed in the section on energy conservation strategies for existing residences, using plumbing fixtures and fittings that reduce hot water demand will also result in significant reductions in the energy to heat hot water. Going from a conventional showerhead to a water sense showerhead can reduce hot water demand by 15% alone, resulting in a 5% reduction in energy use for a typical residence. Similar opportunities existing to reduce hot water demand for clothes washers and dishwashers by using Energy Star certified equipment. Energy Star appliances not only reduce plug load energy, but also save water which in turn saves water heating energy. As an example, an Energy Star certified clothes washer uses about 25% less energy and 40% less water than regular washers.
Drain heat exchangers can recover heat from the hot water used in showers, bathtubs, sinks, dishwashers, and clothes washers. Historically, they are viable for larger, multifamily applications, but
newer models are emerging for single-family home shower use, recovering up to 45% of the waste heat from shower drains, and offering a good return on investment. Prices for drain heat exchangers range from $300 to $500 and paybacks range from 2.5 to 7 years, depending on how often the system is used. Learn more at: http://energy.gov/energysaver/drain-water-heat-recovery.
Solar Domestic Hot WaterIn lieu of using fossil fuels to heat hot water for domestic functions within a building, solar hot water units use copper pipes, painted black to absorb heat, wound back and forth within a flat plate collector covered with glass to prevent heat from escaping. Solar water heating systems almost always require a backup system for cloudy days and times of increased demand. Since some solar domestic hot water systems already store hot water in addition to collecting solar heat, it may be packaged with an efficient, tankless or demand-type water heater for backup. Solar water heating systems cost more than conventional water heating systems; however, they will save you money in the long run, especially if homeowners take advantage of rebates and incentives. Including the price of a solar water heater in a new 30-year mortgage usually amounts to between $13 and $20 per month. The federal income tax deduction for mortgage interest attributable to the solar system reduces that by about $3–$5 per month. So if your fuel savings are more than $15 per month, the solar investment is profitable immediately. The Department of Energy offers a useful resource for calculating the cost and payback of solar domestic hot water systems at: http://energy.gov/energysaver/estimating-cost-and-energy-efficiency-solar-water-heater.
A Solar Domestic Hot Water heaterEnergy use of standard household appliances
Source: superiorhotwatersolutions.com.au
39Old Town North Small Area Plan Eco-District
Natural VentilationOperable windows are required in dwelling units so natural ventilation is intrinsic to residential buildings, but design strategies to improve the effectiveness and efficiency of natural ventilation should be considered. Providing cross-ventilation or stack ventilation will increase wind speeds and air flow making natural ventilation more effective. This is easier to implement in single-family residences, and vernacular typologies, like the shotgun house, can often inform design moves. Multifamily residences may not be able to provide cross ventilation depending on their configuration, but techniques like providing high and low operable units within a window wall can promote stack ventilation and air flow. The inclusion of ceiling fans in living spaces can also increase comfort, extend the natural ventilation season, and enhance air flow.
Efficient Residential HVAC systemsHVAC systems for residential properties come in all shapes and sizes depending on specific needs. Options include centralized systems that provide a building’s HVAC needs using one centrally located mechanical area, and decentralized systems that provide separate HVAC equipment in each unit. Centralized systems are typically more sophisticated and efficient but cannot be metered for individual units. Decentralized systems allow united to be metered separately, but often lack the efficiency and benefits of scale. Providing individual metering of units is itself a good energy conservation measure. Making residents more connected, especially financially connected, to their energy use can significantly reduce energy use. Wireless HVAC Units are increasingly emerging, and will let building managers and residents remotely monitor and control heating and cooling units.
ENERGY STAR certified heat pumps have higher ratings for seasonal energy efficiency ratio (SEER), energy efficiency ratio (EER), and heating seasonal performance factor (HSPF) and use about 5% percent less energy than conventional new models. ENERGY STAR certified central air conditioners have higher seasonal energy efficiency ratio (SEER) and energy efficiency ratio (EER) ratings and use 8 percent less energy than conventional new models.
“The EDR Multifamily Design Guide for Energy Efficiency” is a good reference for achieving energy conservation in multifamily buildings. Learn more at: https://energydesignresources.com/media/2308/EDR_DesignGuidelines_MultiFamily.pdf. In addition to describing HVAC approaches and energy conservation measures suitable for multifamily buildings, the study provides useful cost-benefit analysis.
Ground Source Heat PumpsGround-source (or geothermal) heat pumps use the constant temperature of the earth as a heat source or heat sink instead of the outside air temperature. Regardless of seasonal air temperature variations, the earth’s surface temperature remains at a relatively constant temperature. The earth acts as thermal mass providing temperatures warmer than the air in the winter and cooler than the air in the summer. Ground-source heat pumps utilize this stable earth temperature by exchanging heat with the earth through a ground heat exchanger. Ground-source and water-source heat pumps can heat and cool, and do not depend on the temperature of the outside air.
Even though the installation price of a ground-source heat pump can be several times more than a conventional system, the payback from the resulting energy savings is typically between 5 to 10 years. The following are two good resources to learn more about ground-source heat pumps:• http://energy.gov/energysaver/geothermal-heat-pumps
This webpage is part of the US Department of Energy’s resources that provide consumers with more information (including financial incentives) for efficient HVAC systems.
• https://www.energystar.gov/products/heating_cooling/heat_pumps_geothermalThis webpage is part of the EPA’s Energy Star program, noting that Energy Star certified geothermal heat pumps are over 45 percent more energy efficient than standard options.
40Old Town North Small Area Plan Eco-District
It should be noted that while a CHP will consume 7,499 MMBTU more site energy, it will have lower source energy resulting in 1,752 MT eCO2 less emissions when compared to a non-CHP design.
Given a CHP for the power plant site would be relatively small (CHPs are typically in the 2MW range and the power plant site would require something in the 900 kW range), a CHP for the power plant site would have an initial investment of approximately $1,800,000 (incorporated within a future development building) with a yearly savings of $290,000. That would provide a simple payback of 6.1 years or a Return on
Investment of 16%. These are high level calculations and do not factor in operations and maintenance costs. This would be improved using the many incentives available in Virginia to developers or investors wanting to build a CHP, which include:-Clean Energy Manufacturing Incentive Grant Program-Local Option - Renewable Energy Machinery and Tools Property Tax Exemption-VirginiaSAVES Green Community Loan Program-Commonwealth's Energy Leasing Program-Energy Project and Equipment Financing
kWh MMBTU MT eCO2 MMBTU Therms MT eCO2 MMBTU MT eCO2Non-CHP 12,762,720 43,548 6,030 424,800 4,249,014 22,550 468,348 28,580 CHP 5,384,418 18,372 2,544 751,550 7,517,294 39,894 769,922 42,438 Difference (7,378,302) (25,176) (3,486) 326,750 3,268,280 17,345 301,574 13,859
Purchased Electricity Purchased Natural Gas Total Energy/Emissions
District EnergyCombined Heat and Power (CHP), sometimes referred to as cogeneration, helps stabilize the utility grid by generating electricity close to the site of use. These systems reduce source energy by using the waste heat from on-site electricity generation to heat adjacent buildings or to provide hot water. CHP installations help reduce the need for additional power plants and upgrading transmission lines. CHP can also generate electricity more cleanly and efficiently when powered with natural gas or renewable fuels. Dominion Virginia Power has confirmed they have high pressure natural gas lines in Alexandria near the Old Town North area that can be extended to supply a new CHP in the new Eco-District.
The Old Town North (OTN) Eco-District can help meet City of Alexandria goals to reduce GHG emissions from electricity and natural gas use by maximizing efficiency, increasing renewable energy generation and procurement, and promoting efficient community-scale energy systems.
Shared utility infrastructure projects like district heating can generate significant life-cycle cost and resource savings and related GHG reductions if applicable legal, timing, and financial issues can be brought into alignment. The City’s many programs (technical assistance, incentives and rebates, and accessible financing) can be focused and applied at scale within the Eco-District context.
Using the projected energy loads for the power plant site development based on the energy models built to predict energy impacts of future development, a CHP for the site was modeled to understand the plant size, energy use, and potential energy and emissions savings. The CHP was sized to produce enough electricity such that the waste heat from that production met the power plant site’s heating and hot water demand. The CHP system will consume 326,750 additional therms of Natural Gas vs conventional heating, and will produce 7,378,302 kWh of electricity. Refer to the table below:
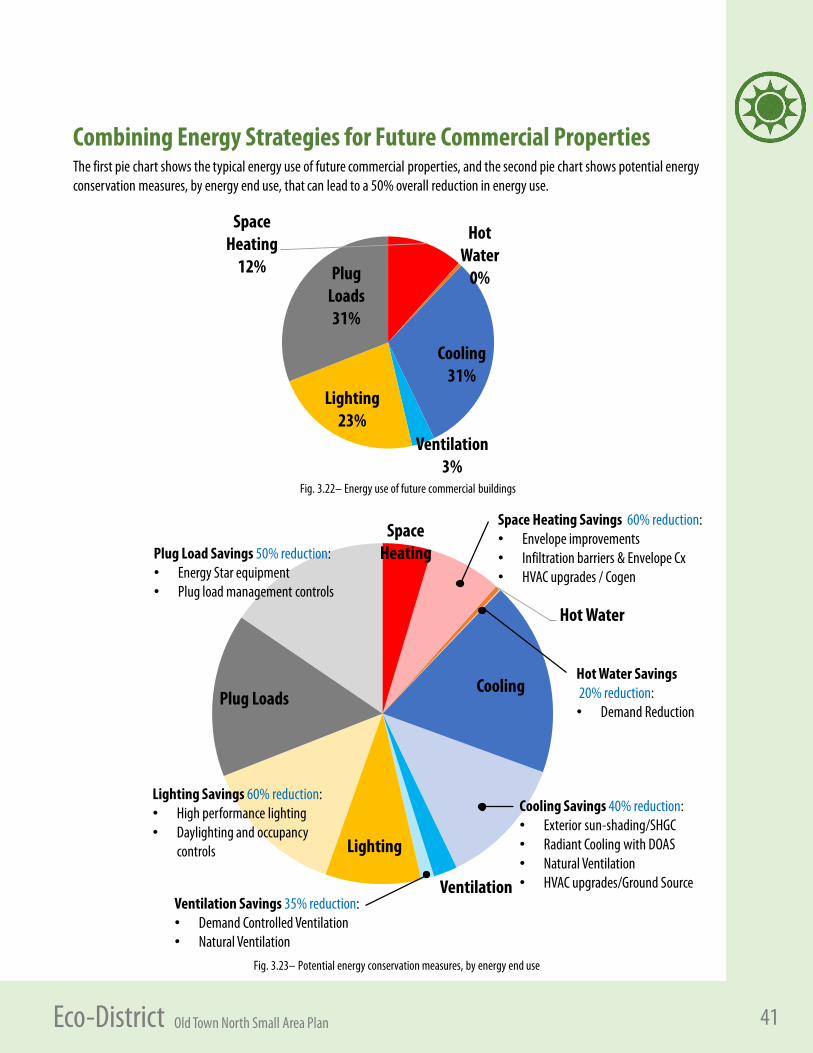
41Old Town North Small Area Plan Eco-District
Space Heating
12%
Hot Water
0%
Cooling31%
Ventilation3%
Lighting23%
Plug Loads31%
The first pie chart shows the typical energy use of future commercial properties, and the second pie chart shows potential energy conservation measures, by energy end use, that can lead to a 50% overall reduction in energy use.
Space Heating
Hot Water
Cooling
Ventilation
Lighting
Plug Loads
Space Heating Savings 60% reduction:• Envelope improvements• Infiltration barriers & Envelope Cx• HVAC upgrades / Cogen
Hot Water Savings20% reduction:• Demand Reduction
Cooling Savings 40% reduction:• Exterior sun-shading/SHGC• Radiant Cooling with DOAS• Natural Ventilation• HVAC upgrades/Ground Source
Ventilation Savings 35% reduction:• Demand Controlled Ventilation• Natural Ventilation
Lighting Savings 60% reduction:• High performance lighting• Daylighting and occupancy
controls
Plug Load Savings 50% reduction:• Energy Star equipment• Plug load management controls
Combining Energy Strategies for Future Commercial Properties
Fig. 3.22– Energy use of future commercial buildings
Fig. 3.23– Potential energy conservation measures, by energy end use
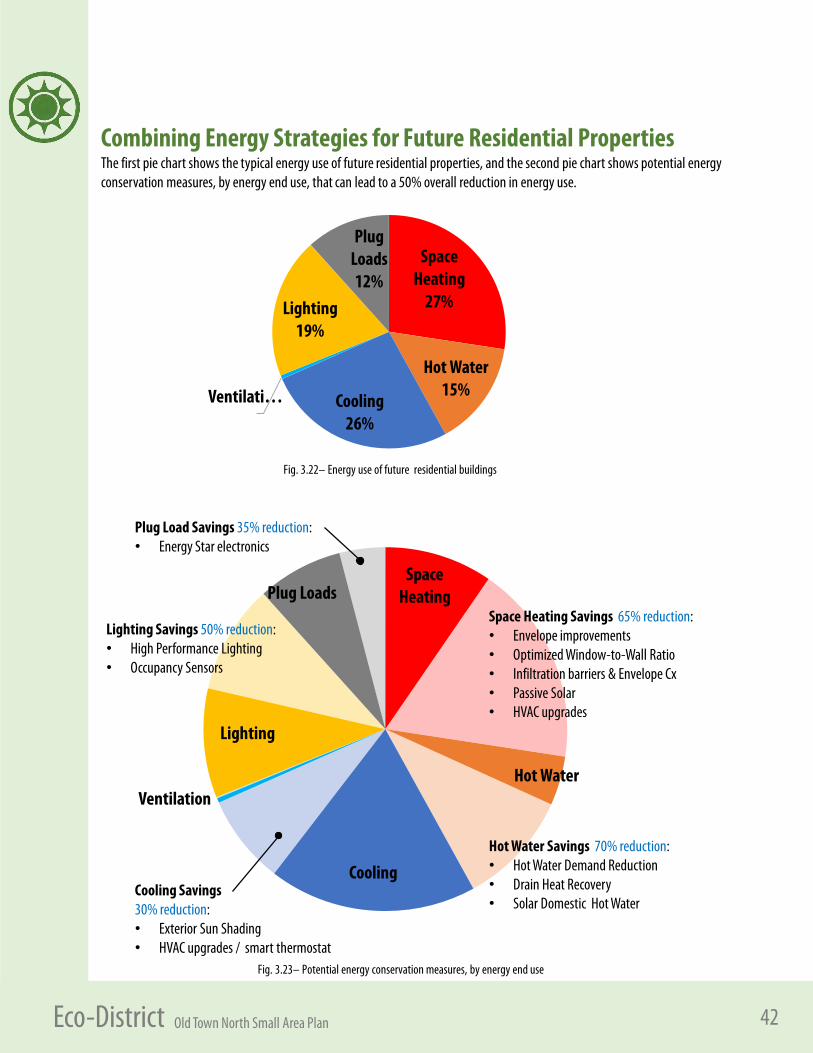
42Old Town North Small Area Plan Eco-District
Space Heating
27%
Hot Water15%
Cooling26%
Ventilati…
Lighting19%
Plug Loads12%
Combining Energy Strategies for Future Residential PropertiesThe first pie chart shows the typical energy use of future residential properties, and the second pie chart shows potential energy conservation measures, by energy end use, that can lead to a 50% overall reduction in energy use.
Space Heating
Hot Water
Cooling
Ventilation
Lighting
Plug LoadsSpace Heating Savings 65% reduction:• Envelope improvements• Optimized Window-to-Wall Ratio• Infiltration barriers & Envelope Cx• Passive Solar • HVAC upgrades
Hot Water Savings 70% reduction:• Hot Water Demand Reduction• Drain Heat Recovery• Solar Domestic Hot Water
Cooling Savings 30% reduction:• Exterior Sun Shading • HVAC upgrades / smart thermostat
Lighting Savings 50% reduction:• High Performance Lighting • Occupancy Sensors
Plug Load Savings 35% reduction:• Energy Star electronics
Fig. 3.22– Energy use of future residential buildings
Fig. 3.23– Potential energy conservation measures, by energy end use
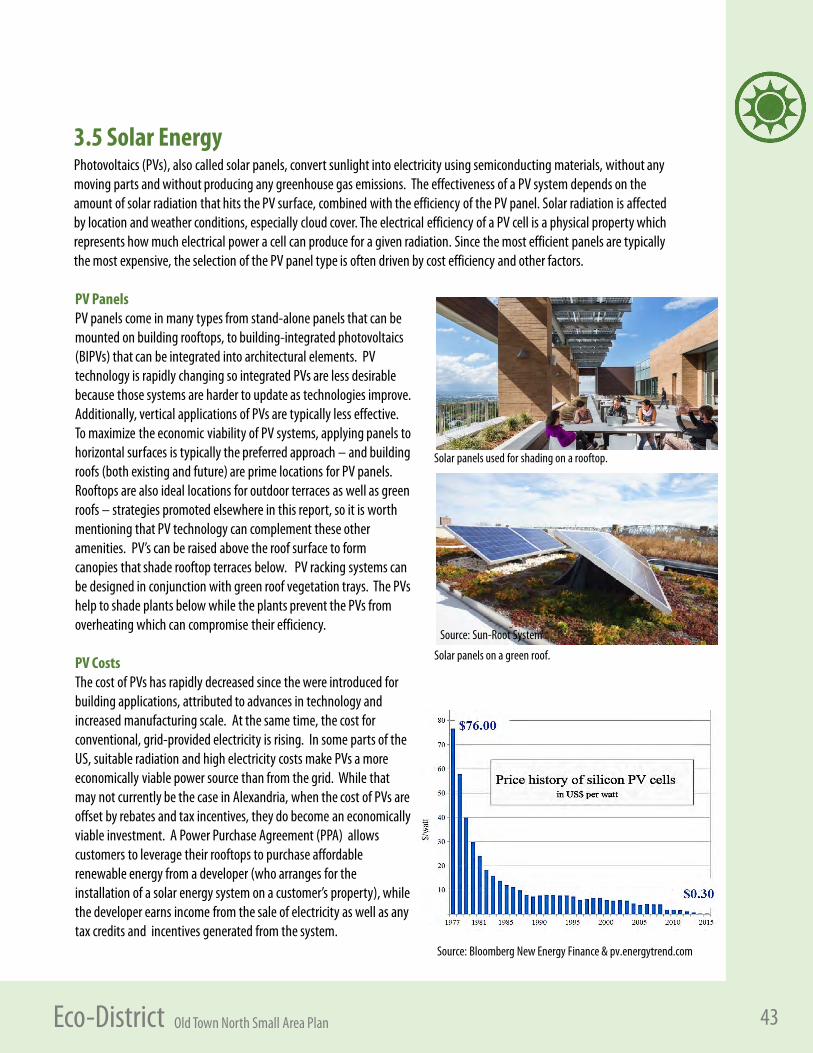
43Old Town North Small Area Plan Eco-District
Solar panels used for shading on a rooftop.
Solar panels on a green roof.
Photovoltaics (PVs), also called solar panels, convert sunlight into electricity using semiconducting materials, without any moving parts and without producing any greenhouse gas emissions. The effectiveness of a PV system depends on the amount of solar radiation that hits the PV surface, combined with the efficiency of the PV panel. Solar radiation is affectedby location and weather conditions, especially cloud cover. The electrical efficiency of a PV cell is a physical property which represents how much electrical power a cell can produce for a given radiation. Since the most efficient panels are typically the most expensive, the selection of the PV panel type is often driven by cost efficiency and other factors.
PV PanelsPV panels come in many types from stand-alone panels that can be mounted on building rooftops, to building-integrated photovoltaics (BIPVs) that can be integrated into architectural elements. PV technology is rapidly changing so integrated PVs are less desirable because those systems are harder to update as technologies improve. Additionally, vertical applications of PVs are typically less effective. To maximize the economic viability of PV systems, applying panels to horizontal surfaces is typically the preferred approach – and building roofs (both existing and future) are prime locations for PV panels. Rooftops are also ideal locations for outdoor terraces as well as green roofs – strategies promoted elsewhere in this report, so it is worth mentioning that PV technology can complement these other amenities. PV’s can be raised above the roof surface to form canopies that shade rooftop terraces below. PV racking systems can be designed in conjunction with green roof vegetation trays. The PVs help to shade plants below while the plants prevent the PVs from overheating which can compromise their efficiency.
PV CostsThe cost of PVs has rapidly decreased since the were introduced for building applications, attributed to advances in technology and increased manufacturing scale. At the same time, the cost for conventional, grid-provided electricity is rising. In some parts of the US, suitable radiation and high electricity costs make PVs a more economically viable power source than from the grid. While that may not currently be the case in Alexandria, when the cost of PVs are offset by rebates and tax incentives, they do become an economically viable investment. A Power Purchase Agreement (PPA) allows customers to leverage their rooftops to purchase affordable renewable energy from a developer (who arranges for the installation of a solar energy system on a customer’s property), while the developer earns income from the sale of electricity as well as any tax credits and incentives generated from the system.
3.5 Solar Energy
Source: Bloomberg New Energy Finance & pv.energytrend.com
Source: Sun-Root System
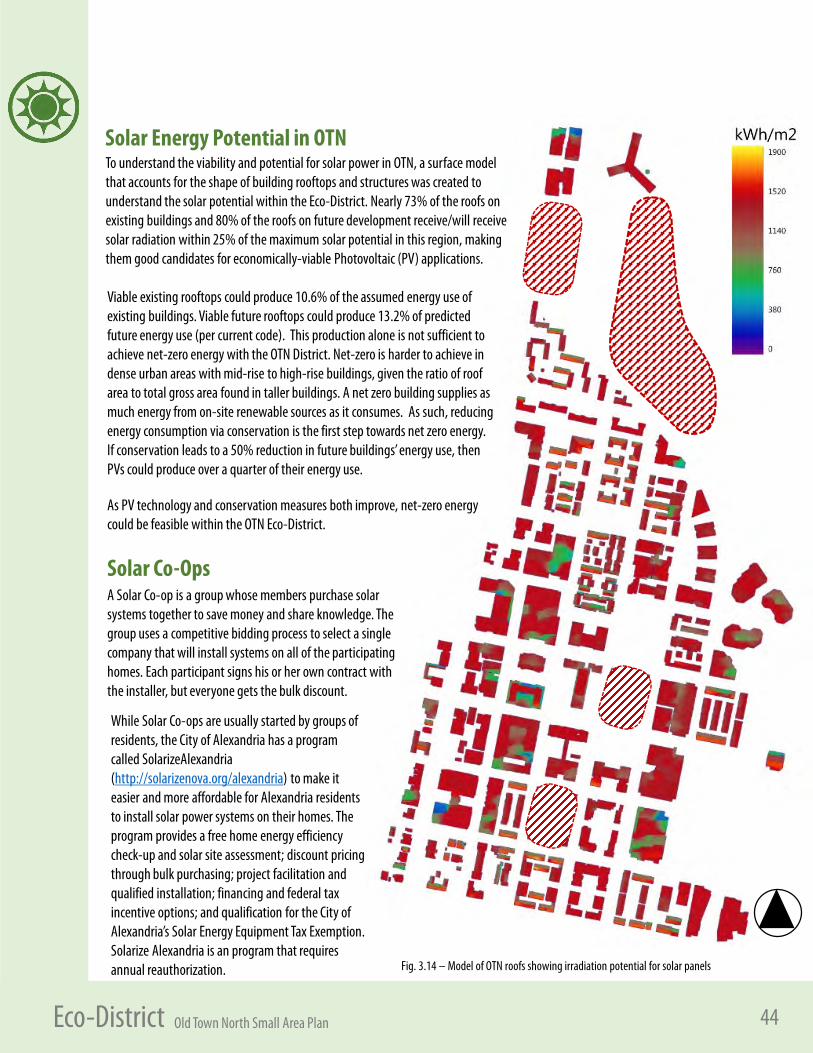
44Old Town North Small Area Plan Eco-District
To understand the viability and potential for solar power in OTN, a surface model that accounts for the shape of building rooftops and structures was created to understand the solar potential within the Eco-District. Nearly 73% of the roofs on existing buildings and 80% of the roofs on future development receive/will receive solar radiation within 25% of the maximum solar potential in this region, making them good candidates for economically-viable Photovoltaic (PV) applications.
Fig. 3.14 – Model of OTN roofs showing irradiation potential for solar panels
Viable existing rooftops could produce 10.6% of the assumed energy use of existing buildings. Viable future rooftops could produce 13.2% of predicted future energy use (per current code). This production alone is not sufficient to achieve net-zero energy with the OTN District. Net-zero is harder to achieve in dense urban areas with mid-rise to high-rise buildings, given the ratio of roof area to total gross area found in taller buildings. A net zero building supplies as much energy from on-site renewable sources as it consumes. As such, reducing energy consumption via conservation is the first step towards net zero energy. If conservation leads to a 50% reduction in future buildings’ energy use, then PVs could produce over a quarter of their energy use.
As PV technology and conservation measures both improve, net-zero energy could be feasible within the OTN Eco-District.
Solar Energy Potential in OTN
While Solar Co-ops are usually started by groups of residents, the City of Alexandria has a program called SolarizeAlexandria(http://solarizenova.org/alexandria) to make it easier and more affordable for Alexandria residents to install solar power systems on their homes. The program provides a free home energy efficiency check-up and solar site assessment; discount pricing through bulk purchasing; project facilitation and qualified installation; financing and federal tax incentive options; and qualification for the City of Alexandria’s Solar Energy Equipment Tax Exemption. Solarize Alexandria is an program that requires annual reauthorization.
Solar Co-OpsA Solar Co-op is a group whose members purchase solar systems together to save money and share knowledge. The group uses a competitive bidding process to select a single company that will install systems on all of the participating homes. Each participant signs his or her own contract with the installer, but everyone gets the bulk discount.
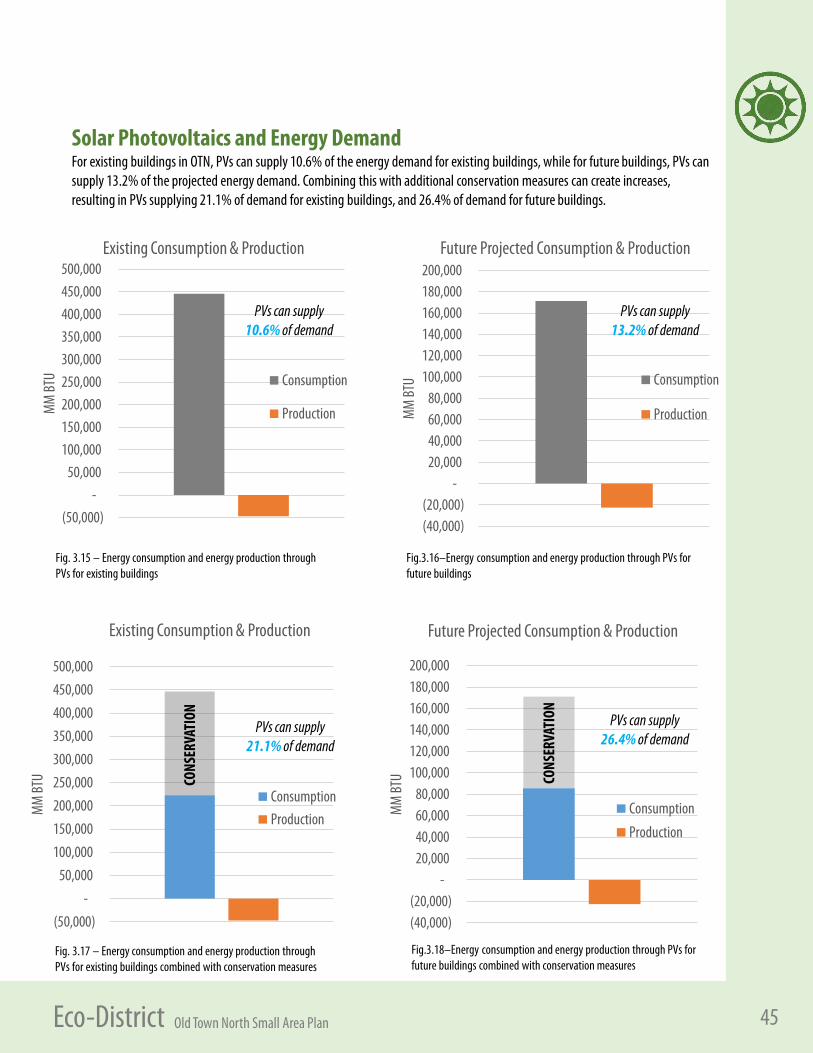
45Old Town North Small Area Plan Eco-District
(50,000) -
50,000 100,000 150,000 200,000 250,000 300,000 350,000 400,000 450,000 500,000
MM
BTU
Existing Consumption & Production
ConsumptionProduction
(40,000) (20,000)
- 20,000 40,000 60,000 80,000
100,000 120,000 140,000 160,000 180,000 200,000
MM
BTU
Future Projected Consumption & Production
Consumption
Production
PVs can supply 21.1% of demand
CONS
ERVA
TION
Solar Photovoltaics and Energy DemandFor existing buildings in OTN, PVs can supply 10.6% of the energy demand for existing buildings, while for future buildings, PVs can supply 13.2% of the projected energy demand. Combining this with additional conservation measures can create increases, resulting in PVs supplying 21.1% of demand for existing buildings, and 26.4% of demand for future buildings.
PVs can supply 26.4% of demand
CONS
ERVA
TION
(50,000) -
50,000 100,000 150,000 200,000 250,000 300,000 350,000 400,000 450,000 500,000
MM
BTU
Existing Consumption & Production
Consumption
Production
PVs can supply 10.6% of demand
(40,000) (20,000)
- 20,000 40,000 60,000 80,000
100,000 120,000 140,000 160,000 180,000 200,000
MM
BTU
Future Projected Consumption & Production
Consumption
Production
PVs can supply 13.2% of demand
Fig. 3.15 – Energy consumption and energy production through PVs for existing buildings
Fig.3.16–Energy consumption and energy production through PVs for future buildings
Fig. 3.17 – Energy consumption and energy production through PVs for existing buildings combined with conservation measures
Fig.3.18–Energy consumption and energy production through PVs for future buildings combined with conservation measures
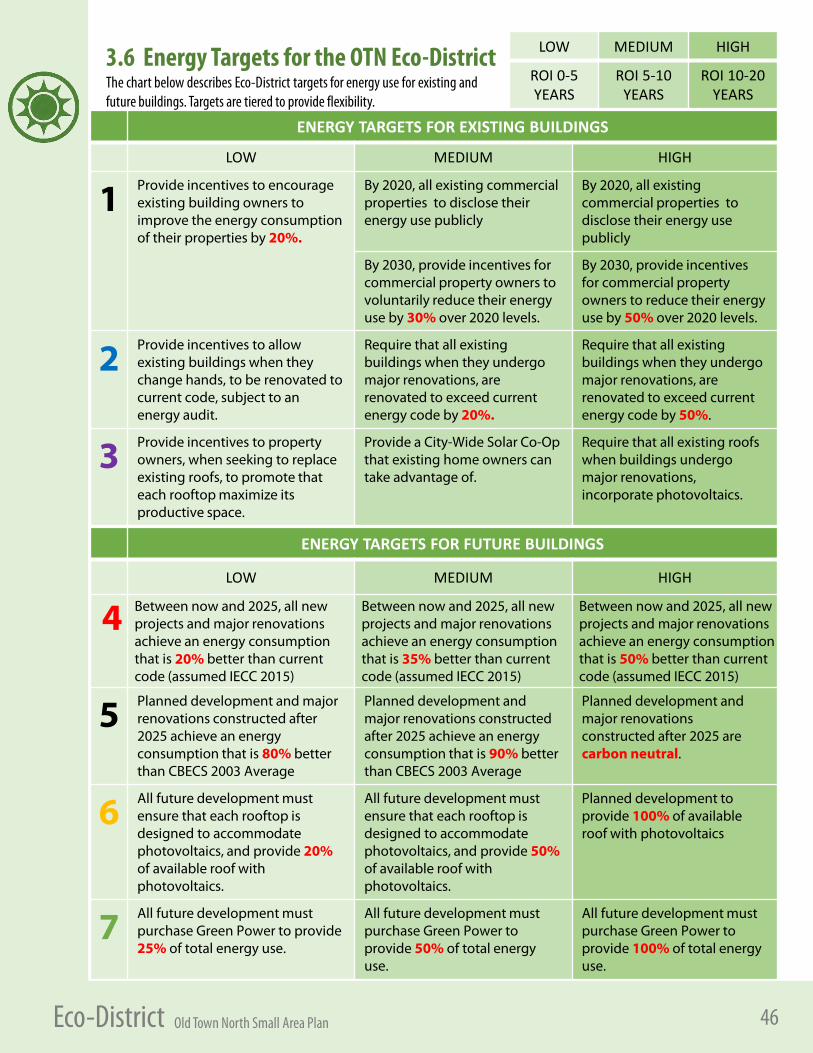
46Old Town North Small Area Plan Eco-District
ENERGY TARGETS FOR EXISTING BUILDINGS
LOW MEDIUM HIGH
1 Provide incentives to encourage existing building owners to improve the energy consumption of their properties by 20%.
By 2020, all existing commercial properties to disclose their energy use publicly
By 2020, all existing commercial properties to disclose their energy use publicly
By 2030, provide incentives for commercial property owners to voluntarily reduce their energy use by 30% over 2020 levels.
By 2030, provide incentives for commercial property owners to reduce their energy use by 50% over 2020 levels.
2 Provide incentives to allow existing buildings when they change hands, to be renovated to current code, subject to an energy audit.
Require that all existing buildings when they undergomajor renovations, are renovated to exceed current energy code by 20%.
Require that all existing buildings when they undergo major renovations, are renovated to exceed current energy code by 50%.
3 Provide incentives to property owners, when seeking to replace existing roofs, to promote that each rooftop maximize its productive space.
Provide a City-Wide Solar Co-Op that existing home owners can take advantage of.
Require that all existing roofs when buildings undergo major renovations, incorporate photovoltaics.
ENERGY TARGETS FOR FUTURE BUILDINGS
LOW MEDIUM HIGH
4 Between now and 2025, all new projects and major renovations achieve an energy consumption that is 20% better than current code (assumed IECC 2015)
Between now and 2025, all new projects and major renovations achieve an energy consumption that is 35% better than current code (assumed IECC 2015)
Between now and 2025, all new projects and major renovations achieve an energy consumption that is 50% better than current code (assumed IECC 2015)
5 Planned development and major renovations constructed after 2025 achieve an energy consumption that is 80% better than CBECS 2003 Average
Planned development and major renovations constructed after 2025 achieve an energy consumption that is 90% better than CBECS 2003 Average
Planned development and major renovations constructed after 2025 are carbon neutral.
6 All future development must ensure that each rooftop is designed to accommodate photovoltaics, and provide 20% of available roof with photovoltaics.
All future development must ensure that each rooftop is designed to accommodate photovoltaics, and provide 50% of available roof with photovoltaics.
Planned development to provide 100% of available roof with photovoltaics
7 All future development must purchase Green Power to provide 25% of total energy use.
All future development must purchase Green Power to provide 50% of total energy use.
All future development must purchase Green Power to provide 100% of total energy use.
3.6 Energy Targets for the OTN Eco-DistrictThe chart below describes Eco-District targets for energy use for existing and future buildings. Targets are tiered to provide flexibility.
LOW MEDIUM HIGH
ROI 0-5 YEARS
ROI 5-10 YEARS
ROI 10-20 YEARS
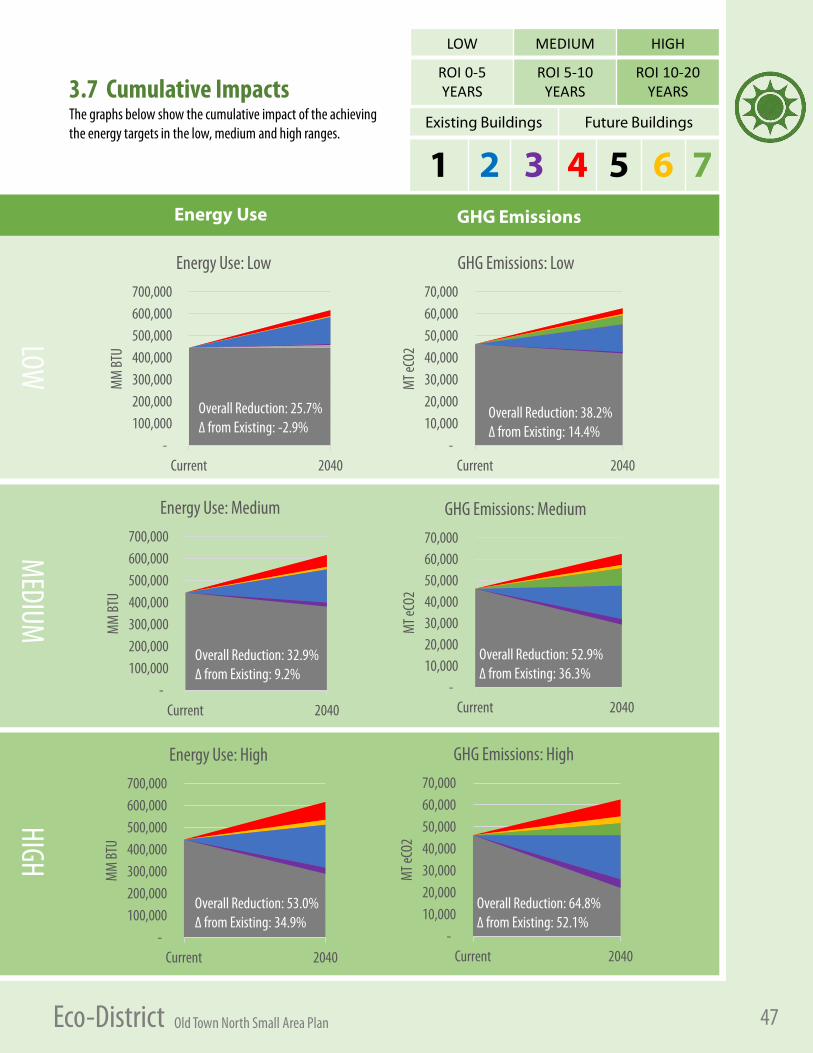
47Old Town North Small Area Plan Eco-District
3.7 Cumulative Impacts The graphs below show the cumulative impact of the achieving the energy targets in the low, medium and high ranges.
- 10,000 20,000 30,000 40,000 50,000 60,000 70,000
Current 2040
MT eC
O2
GHG Emissions: High
- 10,000 20,000 30,000 40,000 50,000 60,000 70,000
Current 2040
MT eC
O2
GHG Emissions: Medium
- 10,000 20,000 30,000 40,000 50,000 60,000 70,000
Current 2040
MT eC
O2
GHG Emissions: Low
- 100,000 200,000 300,000 400,000 500,000 600,000 700,000
Current 2040
MM
BTU
Energy Use: Low
- 100,000 200,000 300,000 400,000 500,000 600,000 700,000
Current 2040
MM
BTU
Energy Use: Medium
- 100,000 200,000 300,000 400,000 500,000 600,000 700,000
Current 2040
MM
BTU
Energy Use: High
Overall Reduction: 25.7%∆ from Existing: -2.9%
Overall Reduction: 38.2%∆ from Existing: 14.4%
Overall Reduction: 53.0%∆ from Existing: 34.9%
Overall Reduction: 32.9%∆ from Existing: 9.2%
Overall Reduction: 52.9%∆ from Existing: 36.3%
Overall Reduction: 64.8%∆ from Existing: 52.1%
Energy Use GHG Emissions
LOW
MEDIUM
HIGH
Existing Buildings Future Buildings
1 2 3 4 5 6 7
LOW MEDIUM HIGH
ROI 0-5 YEARS
ROI 5-10 YEARS
ROI 10-20 YEARS
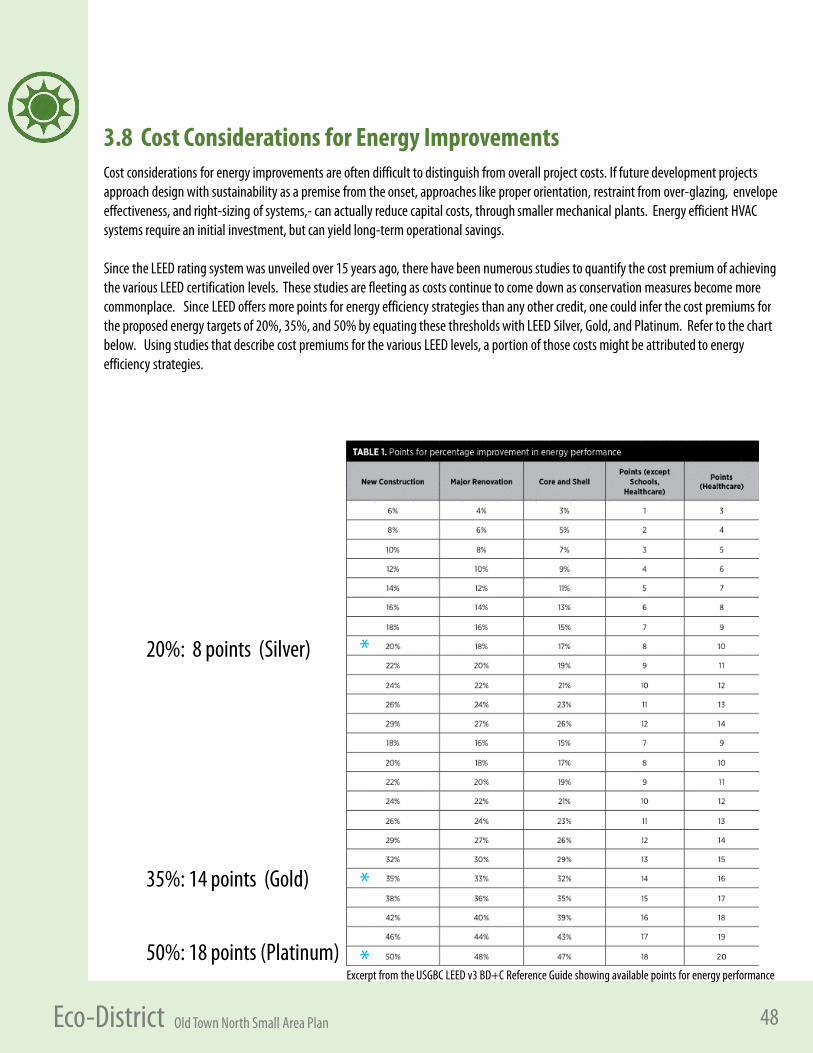
48Old Town North Small Area Plan Eco-District
3.8 Cost Considerations for Energy Improvements
20%: 8 points (Silver)
35%: 14 points (Gold)
50%: 18 points (Platinum)
*
*
*
Cost considerations for energy improvements are often difficult to distinguish from overall project costs. If future development projects approach design with sustainability as a premise from the onset, approaches like proper orientation, restraint from over-glazing, envelope effectiveness, and right-sizing of systems,- can actually reduce capital costs, through smaller mechanical plants. Energy efficient HVAC systems require an initial investment, but can yield long-term operational savings.
Since the LEED rating system was unveiled over 15 years ago, there have been numerous studies to quantify the cost premium of achieving the various LEED certification levels. These studies are fleeting as costs continue to come down as conservation measures become more commonplace. Since LEED offers more points for energy efficiency strategies than any other credit, one could infer the cost premiums for the proposed energy targets of 20%, 35%, and 50% by equating these thresholds with LEED Silver, Gold, and Platinum. Refer to the chart below. Using studies that describe cost premiums for the various LEED levels, a portion of those costs might be attributed to energy efficiency strategies.
Excerpt from the USGBC LEED v3 BD+C Reference Guide showing available points for energy performance
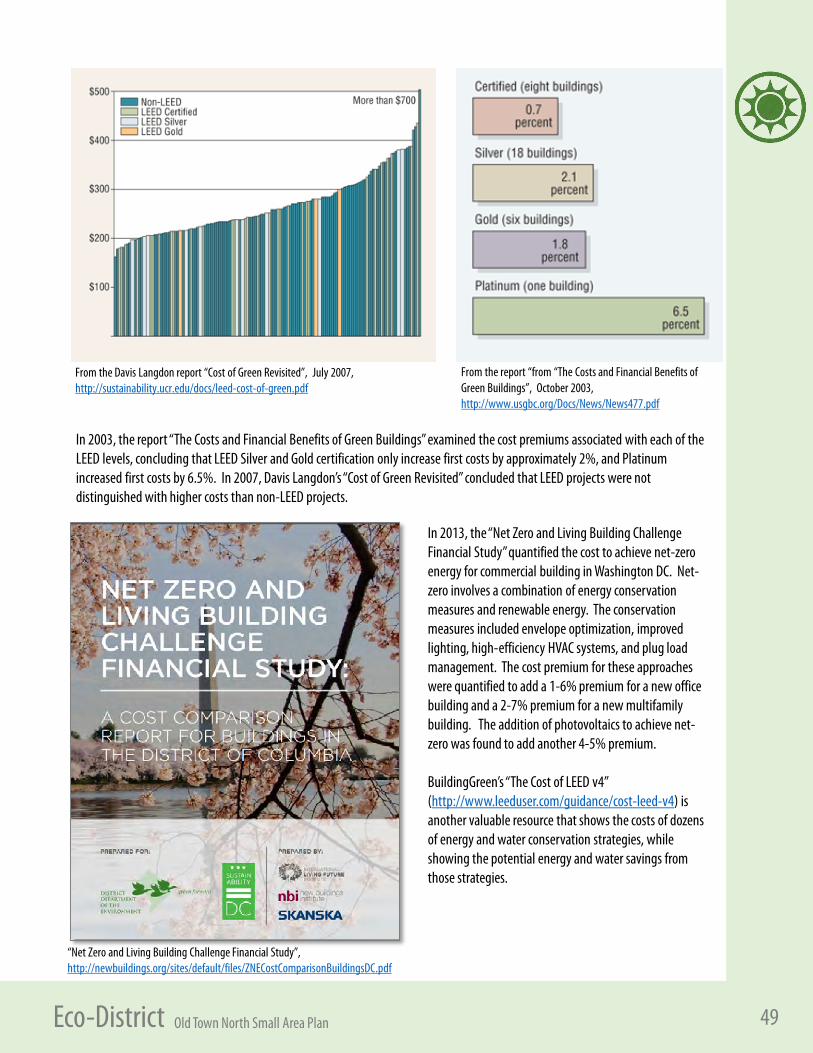
49Old Town North Small Area Plan Eco-District
From the Davis Langdon report “Cost of Green Revisited”, July 2007, http://sustainability.ucr.edu/docs/leed-cost-of-green.pdf
From the report “from “The Costs and Financial Benefits of Green Buildings”, October 2003, http://www.usgbc.org/Docs/News/News477.pdf
“Net Zero and Living Building Challenge Financial Study”, http://newbuildings.org/sites/default/files/ZNECostComparisonBuildingsDC.pdf
In 2003, the report “The Costs and Financial Benefits of Green Buildings” examined the cost premiums associated with each of theLEED levels, concluding that LEED Silver and Gold certification only increase first costs by approximately 2%, and Platinum increased first costs by 6.5%. In 2007, Davis Langdon’s “Cost of Green Revisited” concluded that LEED projects were not distinguished with higher costs than non-LEED projects.
In 2013, the “Net Zero and Living Building Challenge Financial Study” quantified the cost to achieve net-zero energy for commercial building in Washington DC. Net-zero involves a combination of energy conservation measures and renewable energy. The conservation measures included envelope optimization, improved lighting, high-efficiency HVAC systems, and plug load management. The cost premium for these approaches were quantified to add a 1-6% premium for a new office building and a 2-7% premium for a new multifamily building. The addition of photovoltaics to achieve net-zero was found to add another 4-5% premium.
BuildingGreen’s “The Cost of LEED v4” (http://www.leeduser.com/guidance/cost-leed-v4) is another valuable resource that shows the costs of dozens of energy and water conservation strategies, while showing the potential energy and water savings from those strategies.

50Old Town North Small Area Plan Eco-District
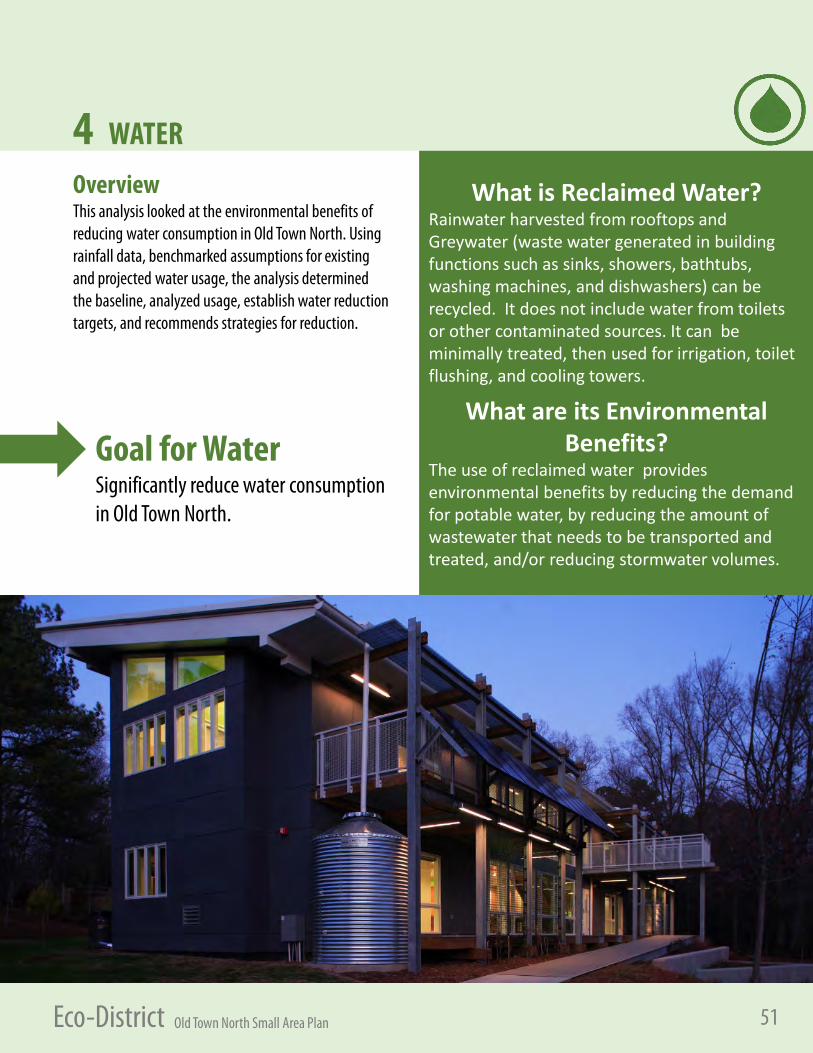
51Old Town North Small Area Plan Eco-District
4 WATER
OverviewThis analysis looked at the environmental benefits of reducing water consumption in Old Town North. Using rainfall data, benchmarked assumptions for existing and projected water usage, the analysis determined the baseline, analyzed usage, establish water reduction targets, and recommends strategies for reduction.
What is Reclaimed Water?Rainwater harvested from rooftops and Greywater (waste water generated in building functions such as sinks, showers, bathtubs, washing machines, and dishwashers) can be recycled. It does not include water from toilets or other contaminated sources. It can be minimally treated, then used for irrigation, toilet flushing, and cooling towers.
What are its Environmental Benefits?
The use of reclaimed water provides environmental benefits by reducing the demand for potable water, by reducing the amount of wastewater that needs to be transported and treated, and/or reducing stormwater volumes.
Goal for WaterSignificantly reduce water consumption in Old Town North.
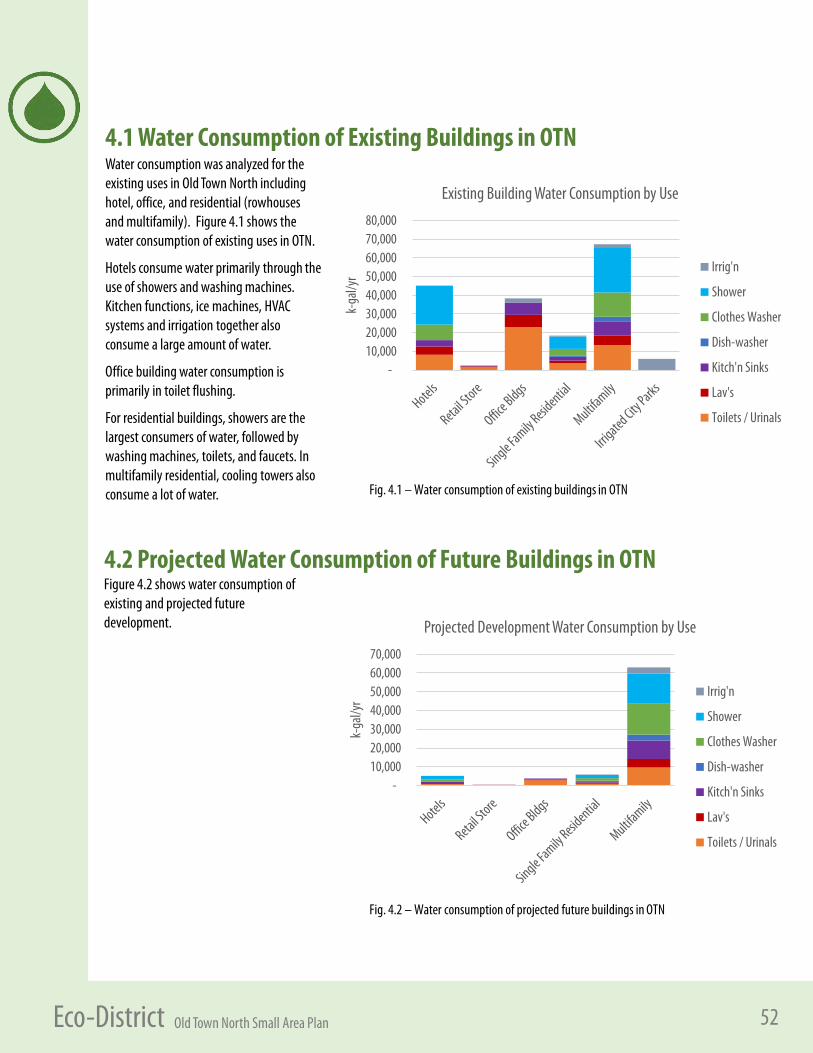
52Old Town North Small Area Plan Eco-District
- 10,000 20,000 30,000 40,000 50,000 60,000 70,000 80,000
k-ga
l/yr
Existing Building Water Consumption by Use
Irrig'n
Shower
Clothes Washer
Dish-washer
Kitch'n Sinks
Lav's
Toilets / Urinals
Water consumption was analyzed for the existing uses in Old Town North including hotel, office, and residential (rowhouses and multifamily). Figure 4.1 shows the water consumption of existing uses in OTN.
Hotels consume water primarily through the use of showers and washing machines. Kitchen functions, ice machines, HVAC systems and irrigation together also consume a large amount of water.
Office building water consumption is primarily in toilet flushing.
For residential buildings, showers are the largest consumers of water, followed by washing machines, toilets, and faucets. In multifamily residential, cooling towers also consume a lot of water. Fig. 4.1 – Water consumption of existing buildings in OTN
Fig. 4.2 – Water consumption of projected future buildings in OTN
- 10,000 20,000 30,000 40,000 50,000 60,000 70,000
k-ga
l/yr
Projected Development Water Consumption by Use
Irrig'n
Shower
Clothes Washer
Dish-washer
Kitch'n Sinks
Lav's
Toilets / Urinals
4.1 Water Consumption of Existing Buildings in OTN
4.2 Projected Water Consumption of Future Buildings in OTNFigure 4.2 shows water consumption of existing and projected future development.
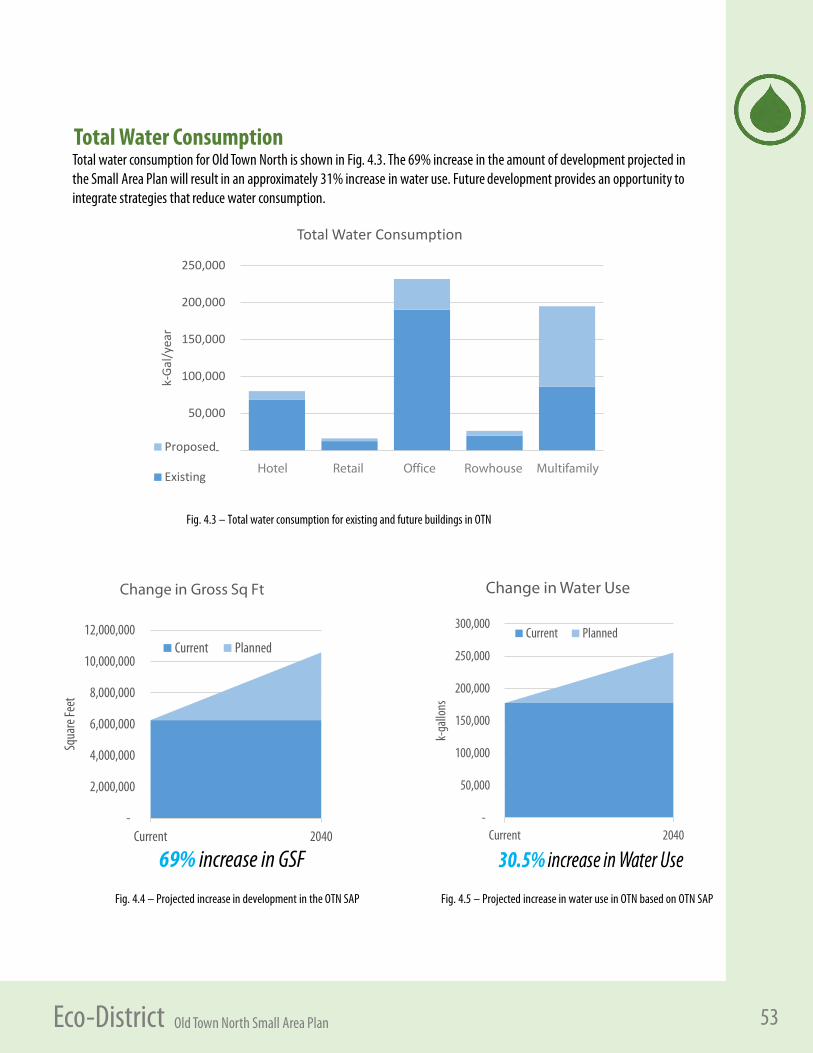
53Old Town North Small Area Plan Eco-District
Fig. 4.4 – Projected increase in development in the OTN SAP
-
2,000,000
4,000,000
6,000,000
8,000,000
10,000,000
12,000,000
Current 2040
Squa
re Fe
et
Change in Gross Sq Ft
Current Planned
69% increase in GSF
-
50,000
100,000
150,000
200,000
250,000
300,000
Current 2040
k-ga
llons
Change in Water Use
Current Planned
Fig. 4.5 – Projected increase in water use in OTN based on OTN SAP
Total water consumption for Old Town North is shown in Fig. 4.3. The 69% increase in the amount of development projected in the Small Area Plan will result in an approximately 31% increase in water use. Future development provides an opportunity to integrate strategies that reduce water consumption.
Fig. 4.3 – Total water consumption for existing and future buildings in OTN
Total Water Consumption
-
50,000
100,000
150,000
200,000
250,000
k-Ga
l/yea
r
Total Water Consumption
Proposed
Existing Hotel Retail Office Rowhouse Multifamily
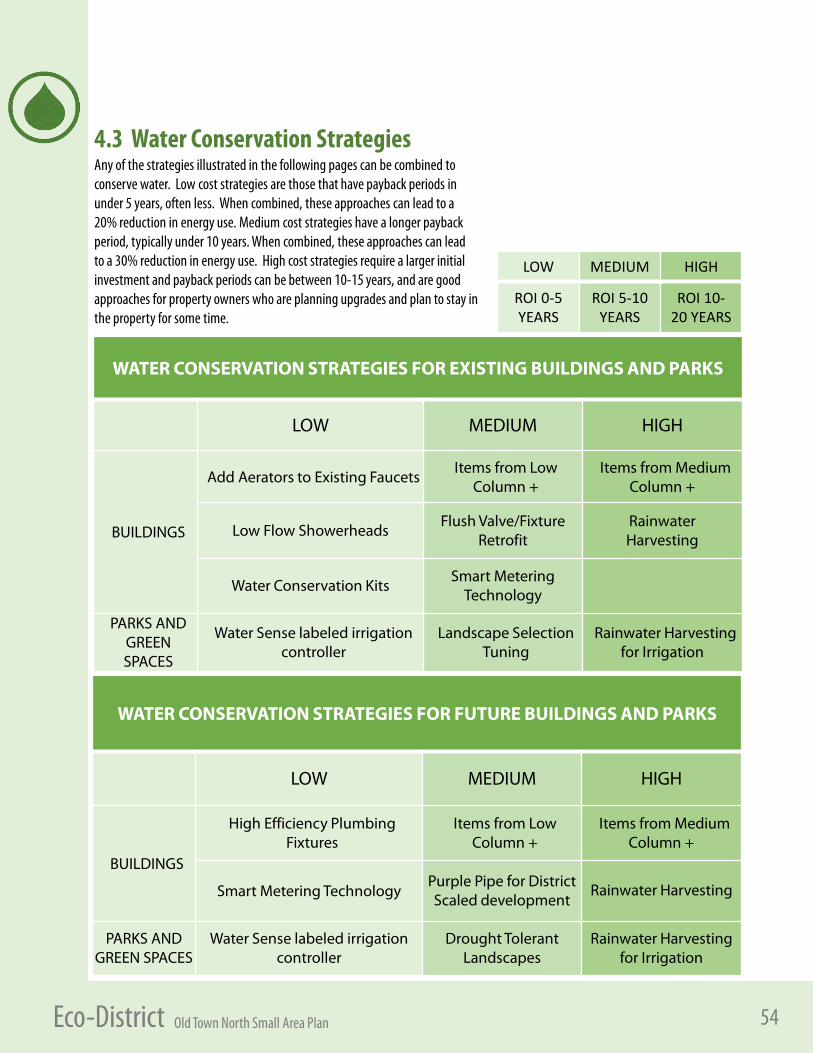
54Old Town North Small Area Plan Eco-District
WATER CONSERVATION STRATEGIES FOR EXISTING BUILDINGS AND PARKS
LOW MEDIUM HIGH
BUILDINGS
Add Aerators to Existing FaucetsItems from Low
Column +Items from Medium
Column +
Low Flow ShowerheadsFlush Valve/Fixture
RetrofitRainwater Harvesting
Water Conservation KitsSmart Metering
Technology
PARKS AND GREEN SPACES
Water Sense labeled irrigation controller
Landscape Selection Tuning
Rainwater Harvesting for Irrigation
WATER CONSERVATION STRATEGIES FOR FUTURE BUILDINGS AND PARKS
LOW MEDIUM HIGH
BUILDINGS
High Efficiency Plumbing Fixtures
Items from Low Column +
Items from MediumColumn +
Smart Metering TechnologyPurple Pipe for District Scaled development
Rainwater Harvesting
PARKS AND GREEN SPACES
Water Sense labeled irrigation controller
Drought Tolerant Landscapes
Rainwater Harvesting for Irrigation
4.3 Water Conservation StrategiesAny of the strategies illustrated in the following pages can be combined to conserve water. Low cost strategies are those that have payback periods in under 5 years, often less. When combined, these approaches can lead to a 20% reduction in energy use. Medium cost strategies have a longer payback period, typically under 10 years. When combined, these approaches can lead to a 30% reduction in energy use. High cost strategies require a larger initial investment and payback periods can be between 10-15 years, and are good approaches for property owners who are planning upgrades and plan to stay in the property for some time.
LOW MEDIUM HIGH
ROI 0-5 YEARS
ROI 5-10 YEARS
ROI 10-20 YEARS
55Old Town North Small Area Plan Eco-District
Flush FixturesNew technology in urinals has resulted in a water efficient urinal, called a High Efficiency Urinal (HEU) that uses 1/8 the water of a conventional urinal. HEUs are designed to optimize the distribution of a pint of water, providing a sanitary rinse and complete water exchange. While waterless urinals are also available on the market, some studies have found that un-diluted urine can result in crystallized deposits within the waste piping. HEUs avoid this concern using one pint of water to adequately dilute waste.
Dual-flush toilets can flush using either 1.6 or 0.8 gals per flush. Using dual-flush toilets in women’s toilet rooms and in all residential bathrooms can result in a 33% reduction in water use for toilet flushing, allowing users to choose appropriate flush volumes for liquid or for solid waste. Since men’s toilet rooms in non-residential facilities already have urinals, dual-flush toilets do not result in water savings. Instead, high-efficiency toilets that use 1.1 gallons per flush were modeled. High efficiency toilets, like HEUs, have been redesigned to ensure they adequately convey waste using less water than a conventional toilet.
HEUs, dual-flush toilets, and high-efficiency toilets cost only marginally more than conventional toilet fixtures, so there is no measurable cost premium for implementing this strategy for new construction projects.
Toilet fixtures in existing building stock installed before the Energy Policy Act of 1992 (EPA 1992) can be retrofitted to reduce water consumption. The water conservation benefits of retrofitting these water intensive fixtures are therefore more pronounced. Urinal flush valves can be replaced with HEU flush valves, fitting most 4-bolt pattern urinals. Similarly dual-flush flush valves and high performance flush valves can be retrofitted replacing conventional flush valves on toilets.
The cost premium for retrofitting flush valves is more intensive – on average the cost of a new efficient flush valve is around $200. Flush valves can be replaced over time as a maintenance project, replacing faulty conventional flush-valves.
Flow FixturesWater consumption of sinks can be reduced by 80% through the
use of low-flow aerators. Standard faucet aerators allow flow rates of 2.5 gpm. Low-flow aerators can deliver 0.5 gpm, yet will deliver the same force of spray, incorporating more air into the stream.
A similar technology has been applied to shower heads. Typical shower heads use 2.5 gpm while low-flow heads use 1.6 gpmor less. By incorporating more air in the water stream, the shower heads have been designed to create air bubbles coated by water. This design results in larger droplet size and denser spray coverage creating a satisfying shower that uses 36% less water than conventional showers.
There is no significant cost premium for implementing this strategy since low-flow fixtures do not cost more than conventional fixtures.
For the existing building stock, lavatory water consumption can be significantly reduced by adding aerators to existing faucets. Aerator replacement is very simple and the cost of a new aerator is around $20 per piece. As discussed in the energy section, shower head replacement is another simple, cost-effective technique to reduce the water consumption of existing buildings. Low-flow shower heads are available for under $100 per fixture.
IrrigationWhile irrigation use is limited within the OTN District, four City parks and one private park that use irrigation were identified. Irrigation in future development should seek to reduce or eliminate potable water use for irrigation. City parks should serve as a model for best practices in irrigation.
Irrigation ControllersResidential outdoor water use in the United States accounts for more than 9 billion gallons of water each day, mainly for landscape irrigation. Experts estimate that as much as 50 percent of this water is wasted due to overwatering caused by inefficiencies in irrigation methods and systems. Irrigation control technologies can significantly reduce overwatering by applying water only when plants need it. Replacing a standard clock timer with a WaterSense labeled irrigation controller can save an average home nearly 8,800 gallons of water annually.
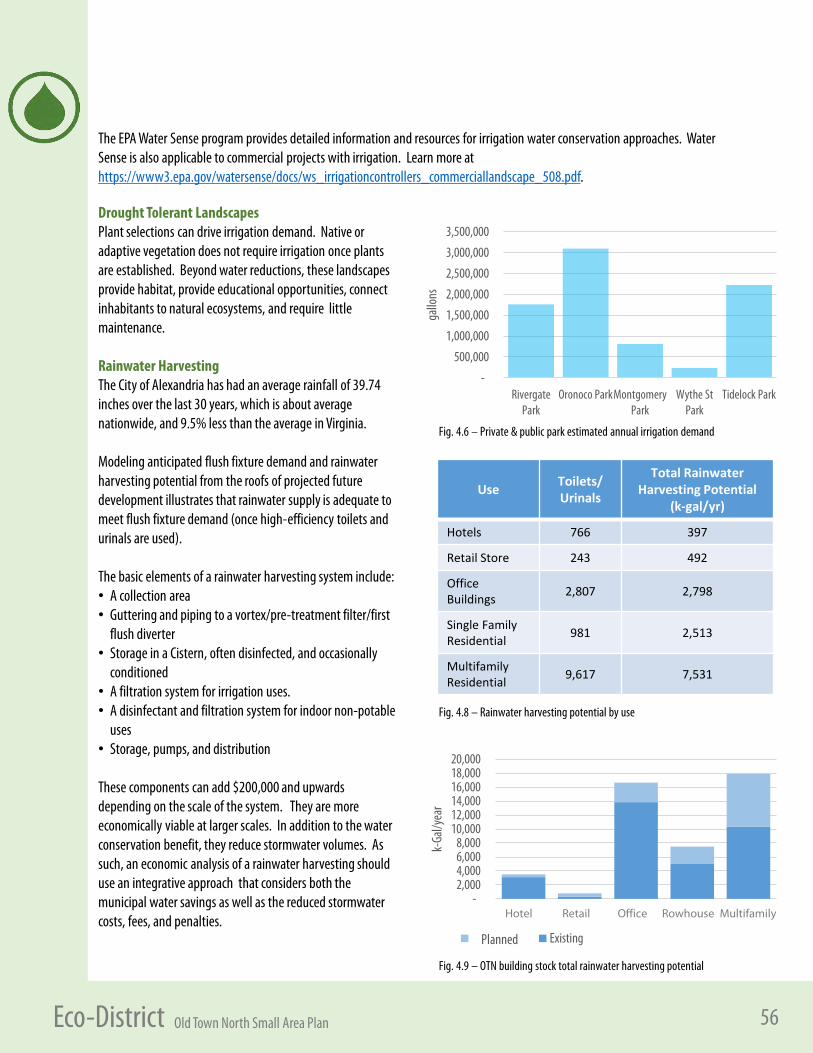
56Old Town North Small Area Plan Eco-District
Drought Tolerant LandscapesPlant selections can drive irrigation demand. Native or adaptive vegetation does not require irrigation once plants are established. Beyond water reductions, these landscapes provide habitat, provide educational opportunities, connect inhabitants to natural ecosystems, and require little maintenance.
Rainwater HarvestingThe City of Alexandria has had an average rainfall of 39.74 inches over the last 30 years, which is about average nationwide, and 9.5% less than the average in Virginia.
Modeling anticipated flush fixture demand and rainwater harvesting potential from the roofs of projected future development illustrates that rainwater supply is adequate to meet flush fixture demand (once high-efficiency toilets and urinals are used).
The basic elements of a rainwater harvesting system include:• A collection area• Guttering and piping to a vortex/pre-treatment filter/first
flush diverter• Storage in a Cistern, often disinfected, and occasionally
conditioned• A filtration system for irrigation uses. • A disinfectant and filtration system for indoor non-potable
uses• Storage, pumps, and distribution
These components can add $200,000 and upwards depending on the scale of the system. They are more economically viable at larger scales. In addition to the water conservation benefit, they reduce stormwater volumes. As such, an economic analysis of a rainwater harvesting should use an integrative approach that considers both the municipal water savings as well as the reduced stormwater costs, fees, and penalties.
- 2,000 4,000 6,000 8,000
10,000 12,000 14,000 16,000 18,000 20,000
k-Ga
l/yea
r
Proposed Existing
Hotel Retail Office Rowhouse Multifamily
Fig. 4.8 – Rainwater harvesting potential by use
Use Toilets/ Urinals
Total RainwaterHarvesting Potential
(k-gal/yr)
Hotels 766 397
Retail Store 243 492
Office Buildings 2,807 2,798
Single Family Residential 981 2,513
Multifamily Residential 9,617 7,531
Fig. 4.9 – OTN building stock total rainwater harvesting potential
-
500,000
1,000,000
1,500,000
2,000,000
2,500,000
3,000,000
3,500,000
RivergatePark
Oronoco ParkMontgomeryPark
Wythe StPark
Tidelock Park
gallo
nsFig. 4.6 – Private & public park estimated annual irrigation demand
The EPA Water Sense program provides detailed information and resources for irrigation water conservation approaches. Water Sense is also applicable to commercial projects with irrigation. Learn more at https://www3.epa.gov/watersense/docs/ws_irrigationcontrollers_commerciallandscape_508.pdf.
Planned
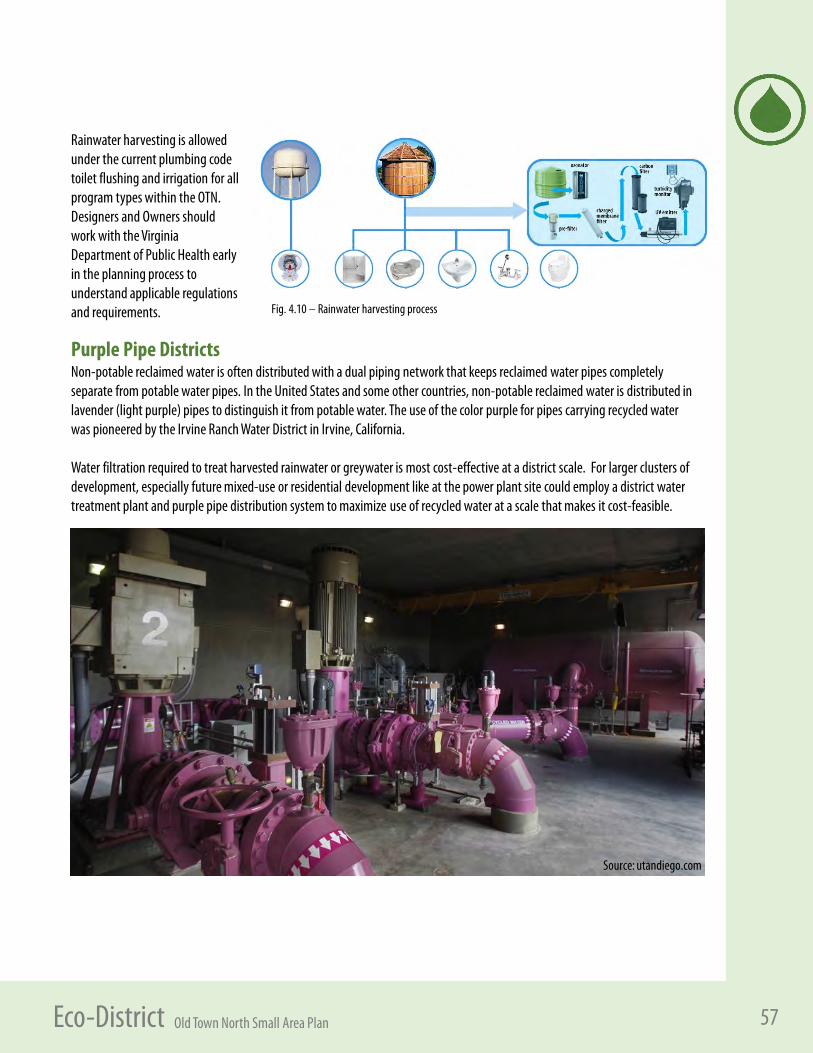
57Old Town North Small Area Plan Eco-District
Non-potable reclaimed water is often distributed with a dual piping network that keeps reclaimed water pipes completely separate from potable water pipes. In the United States and some other countries, non-potable reclaimed water is distributed in lavender (light purple) pipes to distinguish it from potable water. The use of the color purple for pipes carrying recycled water was pioneered by the Irvine Ranch Water District in Irvine, California.
Water filtration required to treat harvested rainwater or greywater is most cost-effective at a district scale. For larger clusters of development, especially future mixed-use or residential development like at the power plant site could employ a district water treatment plant and purple pipe distribution system to maximize use of recycled water at a scale that makes it cost-feasible.
Purple Pipe Districts
Fig. 4.10 – Rainwater harvesting process
Rainwater harvesting is allowed under the current plumbing code toilet flushing and irrigation for all program types within the OTN. Designers and Owners should work with the Virginia Department of Public Health early in the planning process to understand applicable regulations and requirements.
Source: utandiego.com
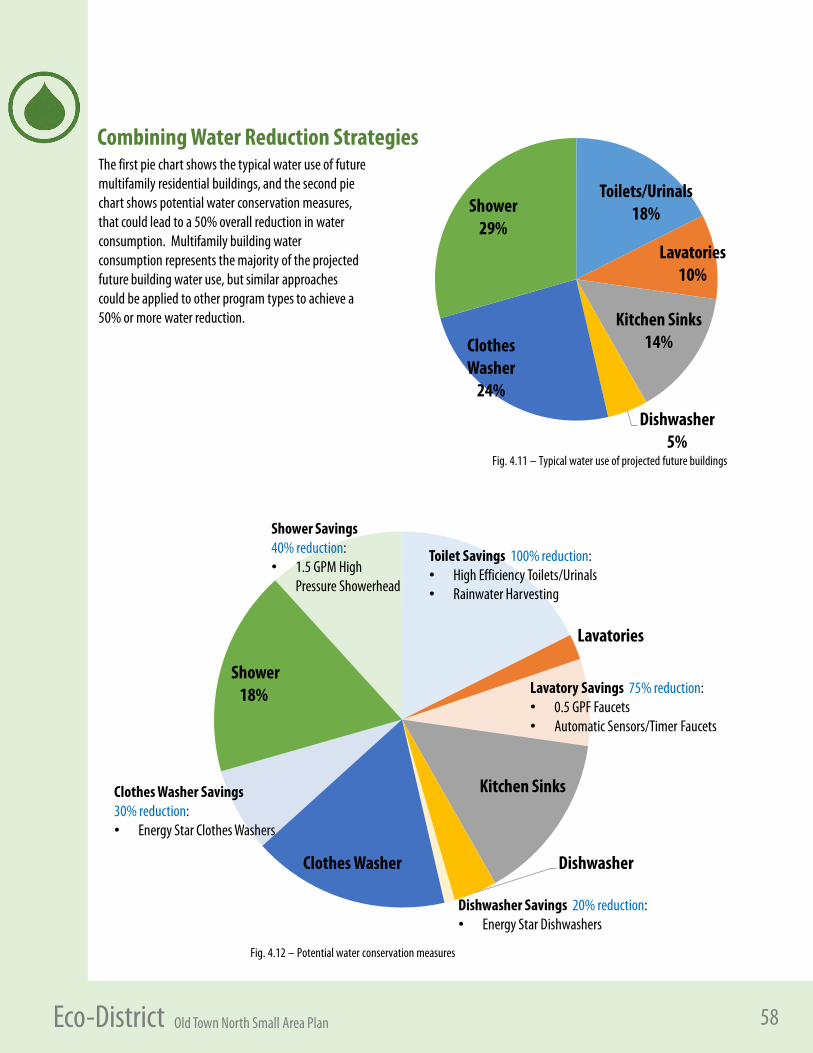
58Old Town North Small Area Plan Eco-District
Combining Water Reduction Strategies
Toilets/Urinals18%
Lavatories10%
Kitchen Sinks14%
Dishwasher5%
Clothes Washer
24%
Shower29%
Lavatories
Kitchen Sinks
DishwasherClothes Washer
Shower 18%
Toilet Savings 100% reduction:• High Efficiency Toilets/Urinals• Rainwater Harvesting
Lavatory Savings 75% reduction:• 0.5 GPF Faucets• Automatic Sensors/Timer Faucets
Dishwasher Savings 20% reduction:• Energy Star Dishwashers
Clothes Washer Savings 30% reduction:• Energy Star Clothes Washers
Shower Savings 40% reduction:• 1.5 GPM High
Pressure Showerhead
The first pie chart shows the typical water use of future multifamily residential buildings, and the second pie chart shows potential water conservation measures, that could lead to a 50% overall reduction in water consumption. Multifamily building water consumption represents the majority of the projected future building water use, but similar approaches could be applied to other program types to achieve a 50% or more water reduction.
Fig. 4.11 – Typical water use of projected future buildings
Fig. 4.12 – Potential water conservation measures
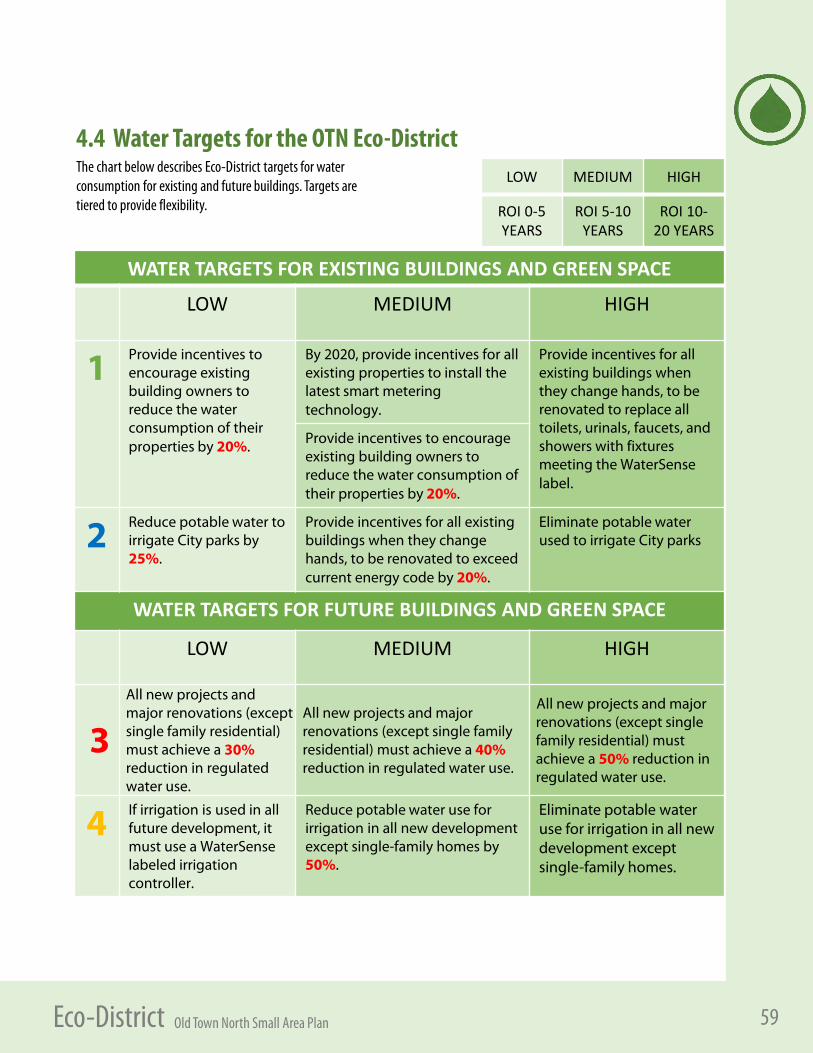
59Old Town North Small Area Plan Eco-District
The chart below describes Eco-District targets for water consumption for existing and future buildings. Targets are tiered to provide flexibility.
WATER TARGETS FOR EXISTING BUILDINGS AND GREEN SPACE
LOW MEDIUM HIGH
1 Provide incentives to encourage existing building owners to reduce the water consumption of their properties by 20%.
By 2020, provide incentives for all existing properties to install the latest smart metering technology.
Provide incentives for all existing buildings when they change hands, to be renovated to replace all toilets, urinals, faucets, and showers with fixtures meeting the WaterSense label.
Provide incentives to encourage existing building owners to reduce the water consumption of their properties by 20%.
2 Reduce potable water to irrigate City parks by 25%.
Provide incentives for all existing buildings when they change hands, to be renovated to exceed current energy code by 20%.
Eliminate potable water used to irrigate City parks
WATER TARGETS FOR FUTURE BUILDINGS AND GREEN SPACE
LOW MEDIUM HIGH
3All new projects and major renovations (except single family residential) must achieve a 30% reduction in regulated water use.
All new projects and major renovations (except single family residential) must achieve a 40%reduction in regulated water use.
All new projects and major renovations (except single family residential) must achieve a 50% reduction in regulated water use.
4 If irrigation is used in all future development, it must use a WaterSense labeled irrigation controller.
Reduce potable water use for irrigation in all new development except single-family homes by 50%.
Eliminate potable water use for irrigation in all new development except single-family homes.
LOW MEDIUM HIGH
ROI 0-5 YEARS
ROI 5-10 YEARS
ROI 10-20 YEARS
4.4 Water Targets for the OTN Eco-District
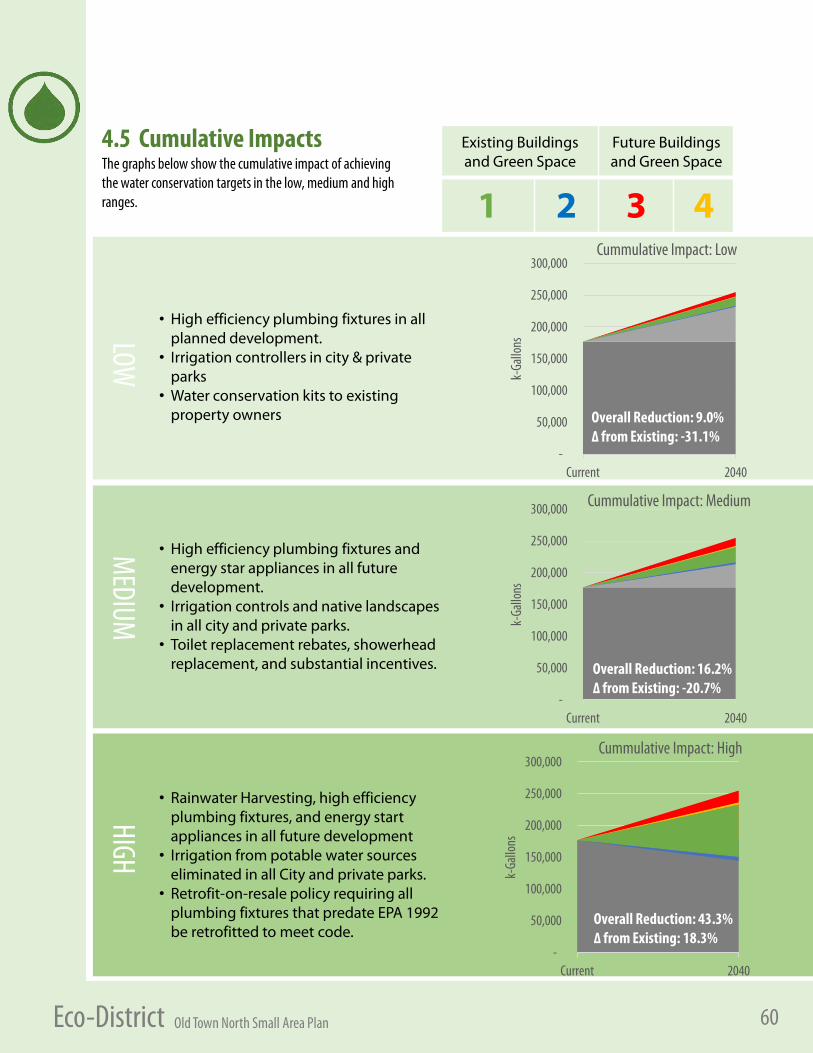
60Old Town North Small Area Plan Eco-District
• High efficiency plumbing fixtures in all planned development.
• Irrigation controllers in city & private parks
• Water conservation kits to existing property owners
• High efficiency plumbing fixtures and energy star appliances in all future development.
• Irrigation controls and native landscapes in all city and private parks.
• Toilet replacement rebates, showerhead replacement, and substantial incentives.
• Rainwater Harvesting, high efficiency plumbing fixtures, and energy start appliances in all future development
• Irrigation from potable water sources eliminated in all City and private parks.
• Retrofit-on-resale policy requiring all plumbing fixtures that predate EPA 1992 be retrofitted to meet code.
-
50,000
100,000
150,000
200,000
250,000
300,000
Current 2040
k-Ga
llons
Cummulative Impact: Low
-
50,000
100,000
150,000
200,000
250,000
300,000
Current 2040
k-Ga
llons
Cummulative Impact: Medium
-
50,000
100,000
150,000
200,000
250,000
300,000
Current 2040
k-Ga
llons
Cummulative Impact: High
Overall Reduction: 9.0%∆ from Existing: -31.1%
Overall Reduction: 16.2%∆ from Existing: -20.7%
Overall Reduction: 43.3%∆ from Existing: 18.3%
LOW
MEDIUM
HIGH
4.5 Cumulative Impacts The graphs below show the cumulative impact of achieving the water conservation targets in the low, medium and high ranges.
Existing Buildingsand Green Space
Future Buildings and Green Space
1 2 3 4
61Old Town North Small Area Plan Eco-District
The environmental benefits of water conservation are significant and critical for an urban environment on the banks of the Potomac, a major tributary of the Chesapeake Bay. While the economics of water scarcity are slowly surfacing, today water remains inexpensive diminishing the economic return on investment of water conservation approaches.
Retrofitting pre-1992 plumbing fixtures within the existing building stock is by far the most cost-effective means of achieving water savings. Aerators and replacement fixtures or fittings are affordable and can yield noticeable reductions in water bills. In new construction, high-efficiency plumbing
fixtures should be mandated given they are widely used and have little cost premium. Irrigation controllers are another cost-effective approach to achieve water conservation, with very quick paybacks and small upfront costs.
Rainwater harvesting is more costly and a measurable return on investment may occur only for high-water consuming properties, and at a larger scale, such as the future development at the power plant site. Economic analysis of a district wide water harvesting should use an integrative approach that considers both the municipal water savings as well as the reduced stormwater costs, fees, and penalties.
4.7 Incentives for Water Conservation
4.6 Payback of Water Conservation Approaches
WaterSense RebatesInformation on WaterSense rebates can be found here: https://www3.epa.gov/watersense/rebate_finder_saving_money_water.html
ENERGY STAR and WaterSense Sales Tax Holiday -This Virginia sales tax holiday will be a recurring event. The 3-day sales tax holiday begins the first Friday in August and ends the following Sunday each year. During this period, consumers may purchase certain Energy Star qualified products exempt of the Retail Sales and Use Tax. The exempt items include: any dishwasher, clothes washer, air conditioner, ceiling fan, compact fluorescent light bulb, dehumidifier, programmable
thermostat, or refrigerator, the energy efficiency of which has been designated by the United States Environmental Protection Agency and the United States Department of Energy as meeting or exceeding each such agency’s requirements under the Energy Star program. The exemption is also available for WaterSense qualified products containing a WaterSense label. In order to be eligible for the Energy Star or WaterSense sales tax holiday exemptions, products must cost $1,500 or less per item and be purchased for noncommercial home or personal use.
For information regarding this program, visit http://www.tax.virginia.gov/.

62Old Town North Small Area Plan Eco-District
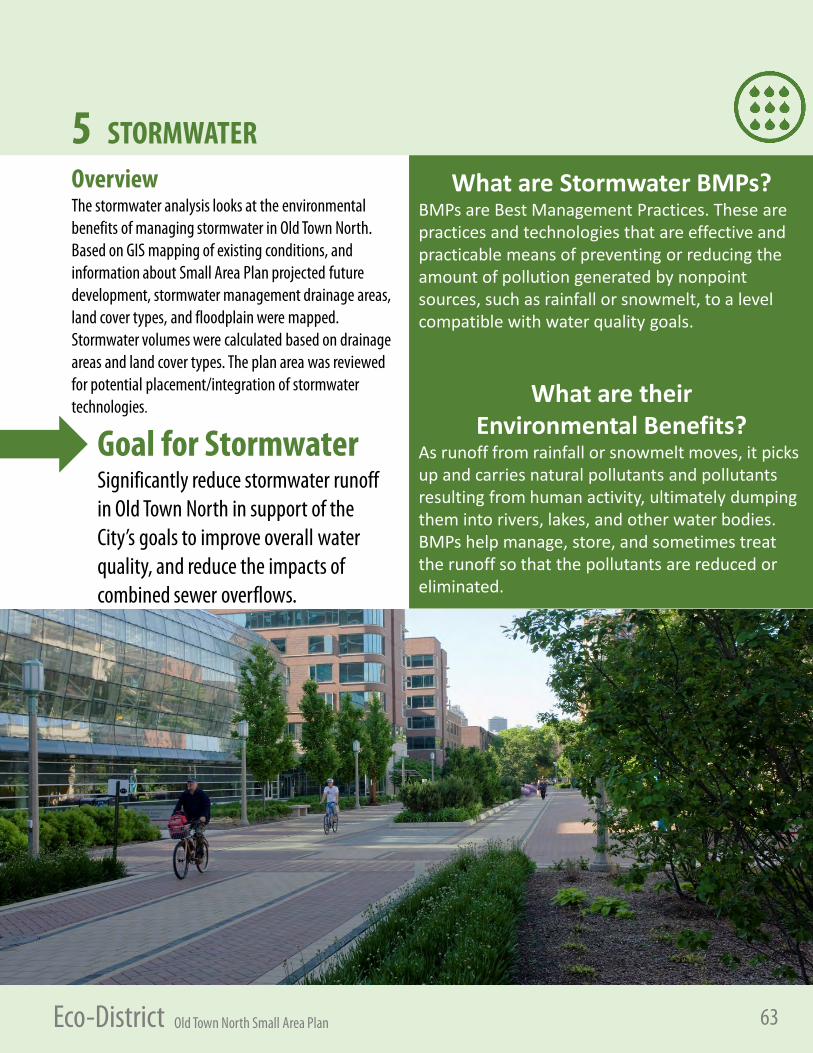
63Old Town North Small Area Plan Eco-District
OverviewThe stormwater analysis looks at the environmental benefits of managing stormwater in Old Town North. Based on GIS mapping of existing conditions, and information about Small Area Plan projected future development, stormwater management drainage areas, land cover types, and floodplain were mapped. Stormwater volumes were calculated based on drainage areas and land cover types. The plan area was reviewed for potential placement/integration of stormwater technologies.
5 STORMWATER
Goal for StormwaterSignificantly reduce stormwater runoff in Old Town North in support of the City’s goals to improve overall water quality, and reduce the impacts of combined sewer overflows.
What are Stormwater BMPs?BMPs are Best Management Practices. These are practices and technologies that are effective and practicable means of preventing or reducing the amount of pollution generated by nonpoint sources, such as rainfall or snowmelt, to a level compatible with water quality goals.
What are theirEnvironmental Benefits?
As runoff from rainfall or snowmelt moves, it picks up and carries natural pollutants and pollutants resulting from human activity, ultimately dumping them into rivers, lakes, and other water bodies. BMPs help manage, store, and sometimes treat the runoff so that the pollutants are reduced or eliminated.
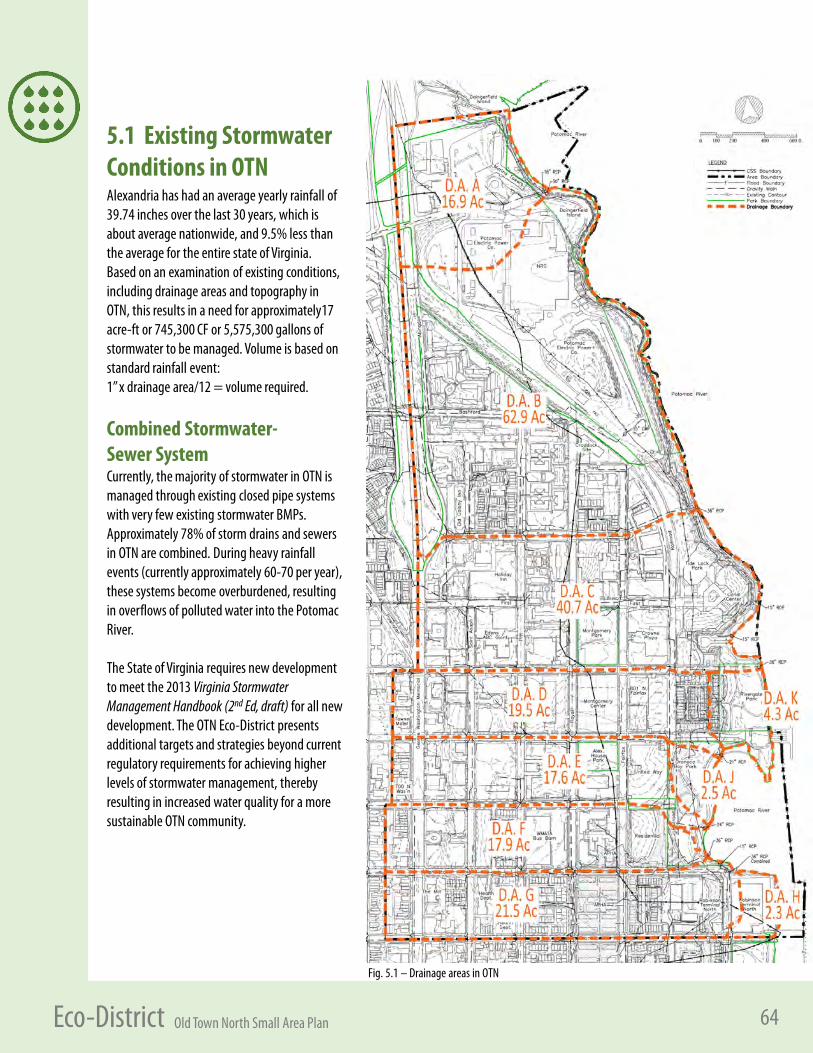
64Old Town North Small Area Plan Eco-District
Alexandria has had an average yearly rainfall of 39.74 inches over the last 30 years, which is about average nationwide, and 9.5% less than the average for the entire state of Virginia. Based on an examination of existing conditions, including drainage areas and topography in OTN, this results in a need for approximately17 acre-ft or 745,300 CF or 5,575,300 gallons of stormwater to be managed. Volume is based on standard rainfall event: 1” x drainage area/12 = volume required.
Combined Stormwater-Sewer SystemCurrently, the majority of stormwater in OTN is managed through existing closed pipe systems with very few existing stormwater BMPs. Approximately 78% of storm drains and sewers in OTN are combined. During heavy rainfall events (currently approximately 60-70 per year), these systems become overburdened, resulting in overflows of polluted water into the Potomac River.
The State of Virginia requires new development to meet the 2013 Virginia Stormwater Management Handbook (2nd Ed, draft) for all new development. The OTN Eco-District presents additional targets and strategies beyond current regulatory requirements for achieving higher levels of stormwater management, thereby resulting in increased water quality for a more sustainable OTN community.
5.1 Existing Stormwater Conditions in OTN
Fig. 5.1 – Drainage areas in OTN
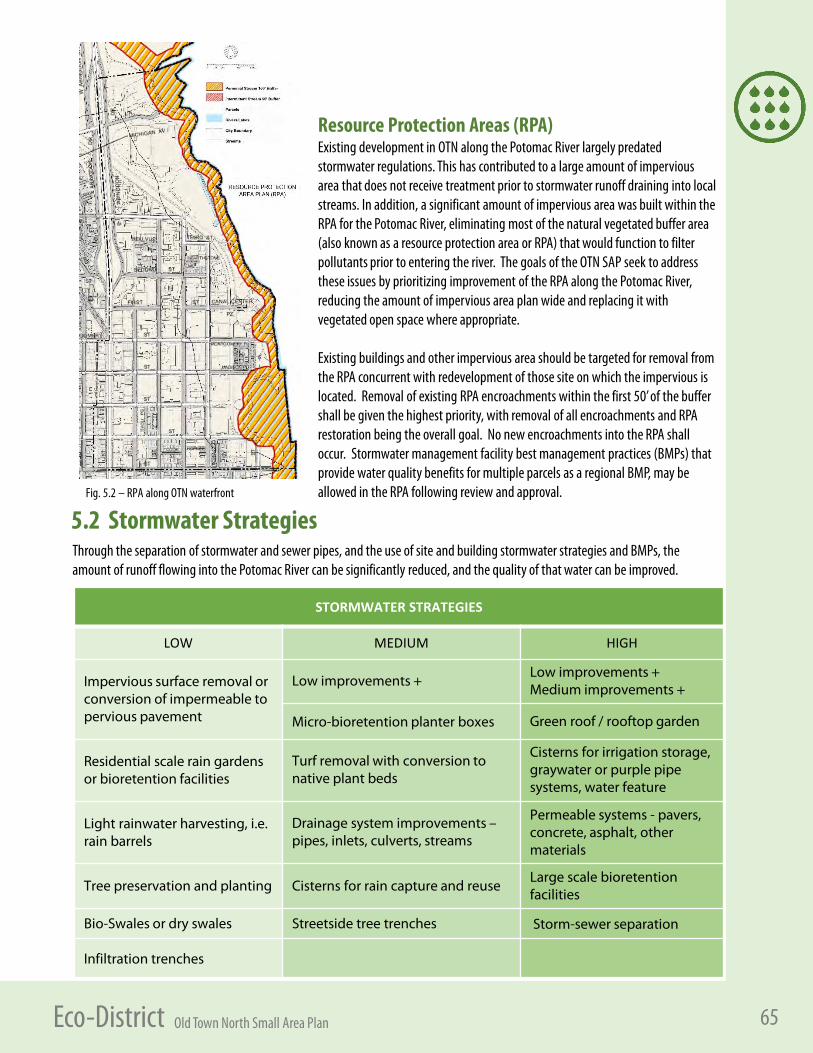
65Old Town North Small Area Plan Eco-District
STORMWATER STRATEGIES
LOW MEDIUM HIGH
Impervious surface removal or conversion of impermeable to pervious pavement
Low improvements +Low improvements + Medium improvements +
Micro-bioretention planter boxes Green roof / rooftop garden
Residential scale rain gardens or bioretention facilities
Turf removal with conversion to native plant beds
Cisterns for irrigation storage, graywater or purple pipe systems, water feature
Light rainwater harvesting, i.e. rain barrels
Drainage system improvements –pipes, inlets, culverts, streams
Permeable systems - pavers, concrete, asphalt, other materials
Tree preservation and planting Cisterns for rain capture and reuseLarge scale bioretention facilities
Bio-Swales or dry swales Streetside tree trenches Storm-sewer separation
Infiltration trenches
Through the separation of stormwater and sewer pipes, and the use of site and building stormwater strategies and BMPs, the amount of runoff flowing into the Potomac River can be significantly reduced, and the quality of that water can be improved.
5.2 Stormwater StrategiesFig. 5.2 – RPA along OTN waterfront
Resource Protection Areas (RPA)Existing development in OTN along the Potomac River largely predated stormwater regulations. This has contributed to a large amount of impervious area that does not receive treatment prior to stormwater runoff draining into local streams. In addition, a significant amount of impervious area was built within the RPA for the Potomac River, eliminating most of the natural vegetated buffer area (also known as a resource protection area or RPA) that would function to filter pollutants prior to entering the river. The goals of the OTN SAP seek to address these issues by prioritizing improvement of the RPA along the Potomac River, reducing the amount of impervious area plan wide and replacing it with vegetated open space where appropriate.
Existing buildings and other impervious area should be targeted for removal from the RPA concurrent with redevelopment of those site on which the impervious is located. Removal of existing RPA encroachments within the first 50’ of the buffer shall be given the highest priority, with removal of all encroachments and RPA restoration being the overall goal. No new encroachments into the RPA shall occur. Stormwater management facility best management practices (BMPs) that provide water quality benefits for multiple parcels as a regional BMP, may be allowed in the RPA following review and approval.
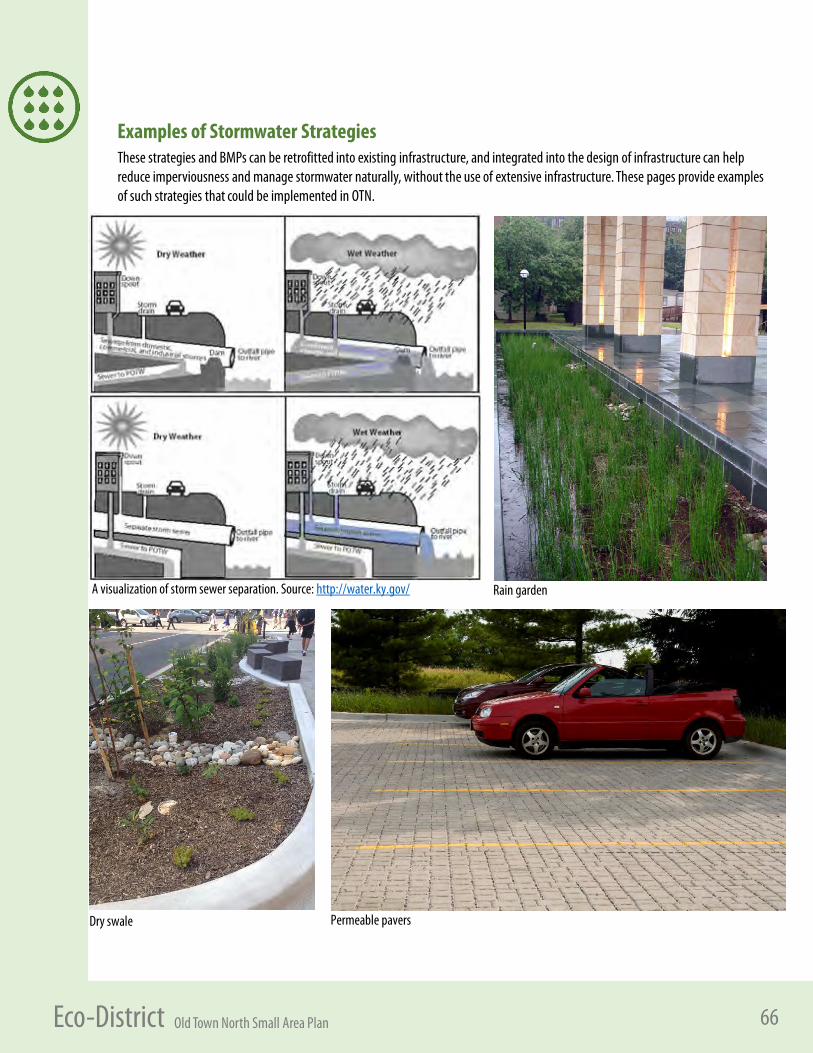
66Old Town North Small Area Plan Eco-District
A visualization of storm sewer separation. Source: http://water.ky.gov/
Examples of Stormwater Strategies
Permeable pavers
Rain garden
Dry swale
These strategies and BMPs can be retrofitted into existing infrastructure, and integrated into the design of infrastructure can help reduce imperviousness and manage stormwater naturally, without the use of extensive infrastructure. These pages provide examples of such strategies that could be implemented in OTN.
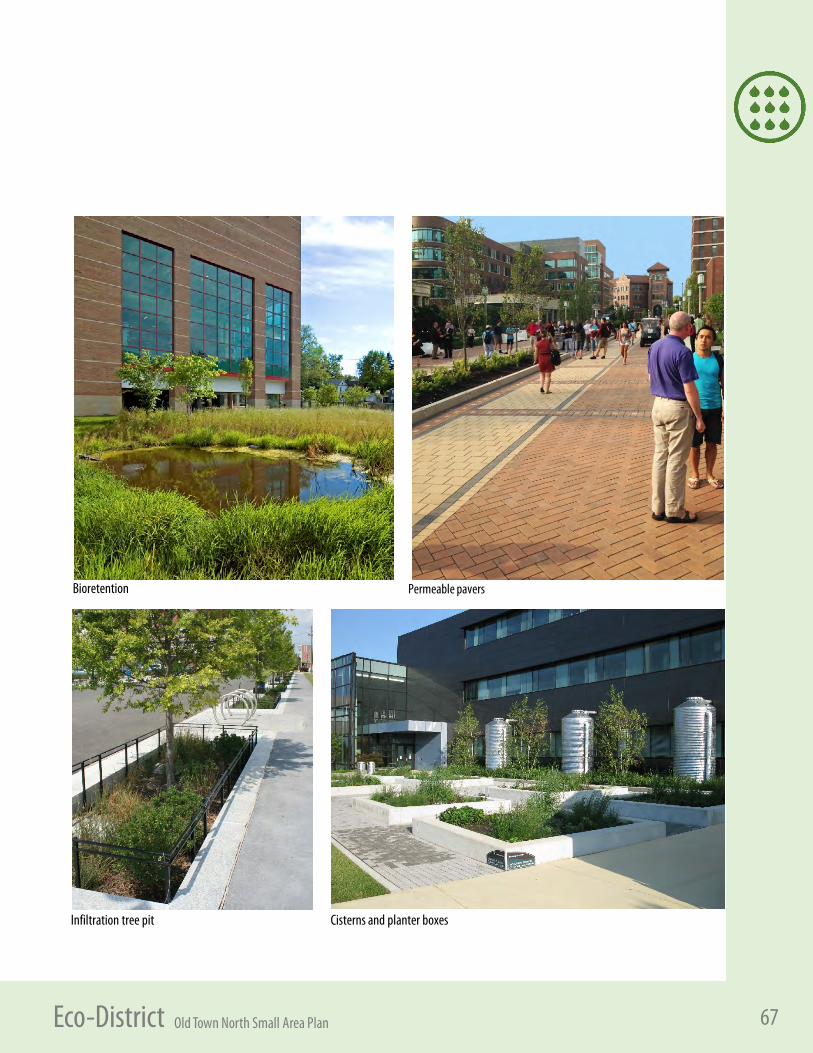
67Old Town North Small Area Plan Eco-District
Infiltration tree pit Cisterns and planter boxes
Permeable paversBioretention
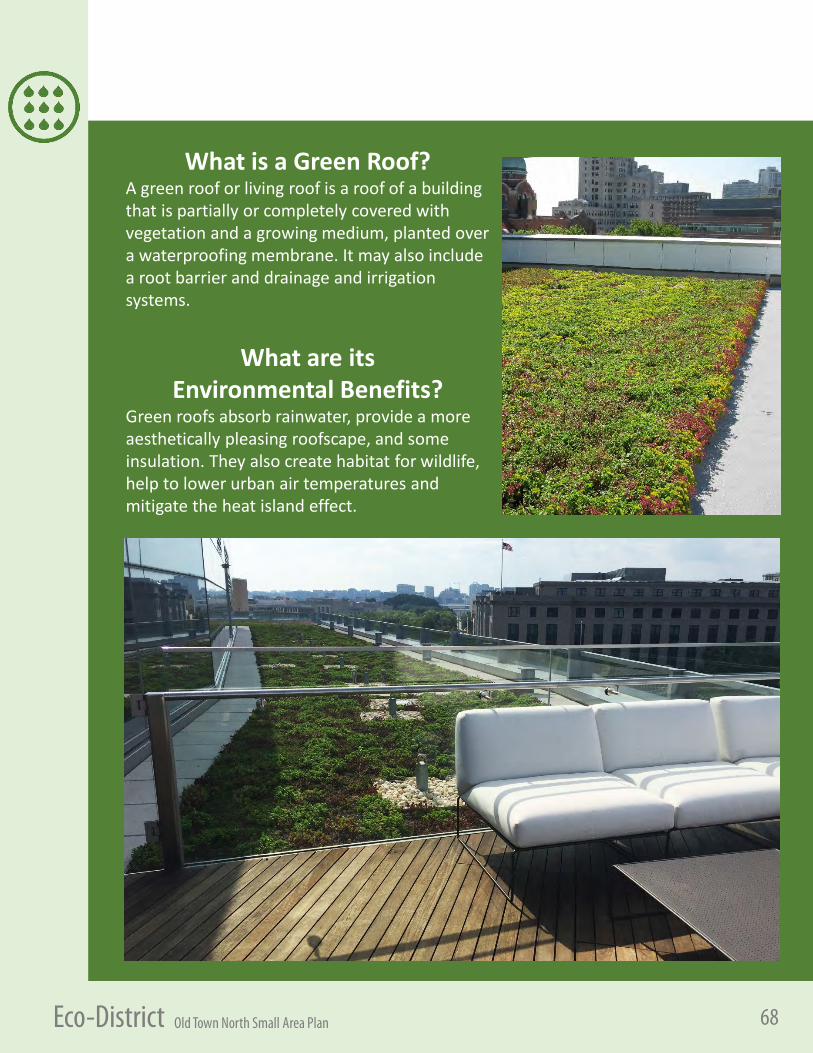
68Old Town North Small Area Plan Eco-District
What is a Green Roof?A green roof or living roof is a roof of a building that is partially or completely covered with vegetation and a growing medium, planted over a waterproofing membrane. It may also include a root barrier and drainage and irrigation systems.
What are itsEnvironmental Benefits?
Green roofs absorb rainwater, provide a more aesthetically pleasing roofscape, and some insulation. They also create habitat for wildlife, help to lower urban air temperatures and mitigate the heat island effect.
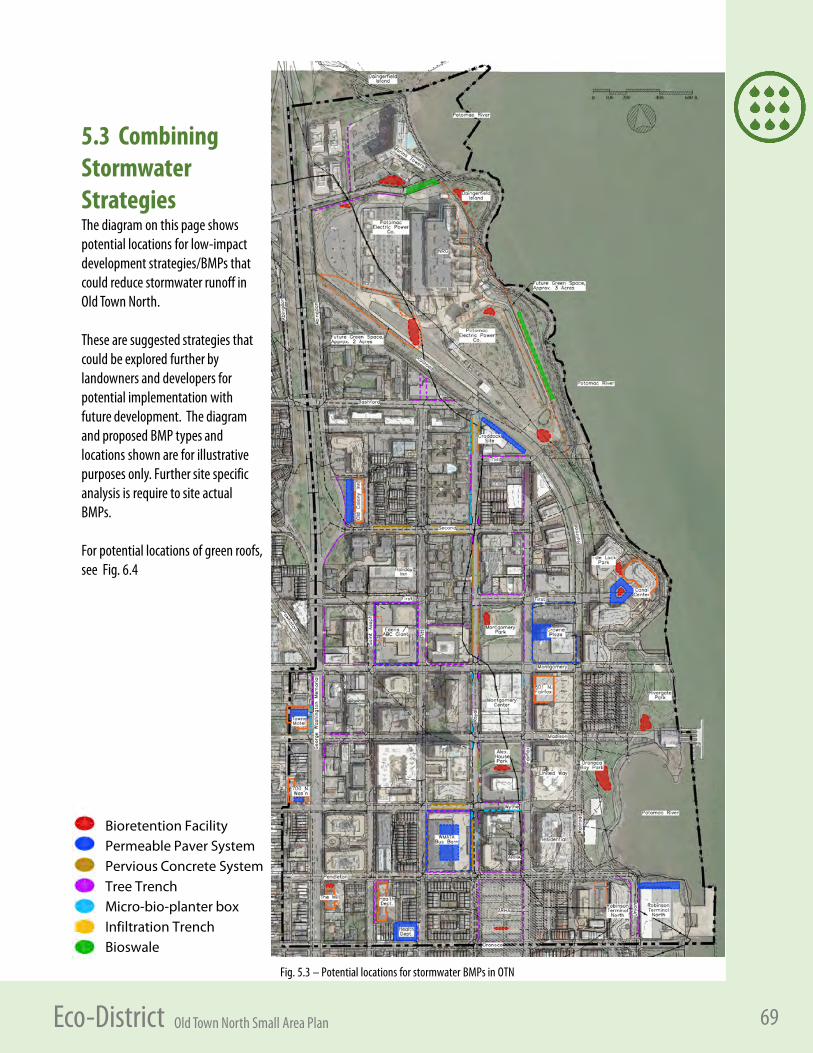
69Old Town North Small Area Plan Eco-District
5.3 Combining Stormwater StrategiesThe diagram on this page shows potential locations for low-impact development strategies/BMPs that could reduce stormwater runoff in Old Town North.
These are suggested strategies that could be explored further by landowners and developers for potential implementation with future development. The diagram and proposed BMP types and locations shown are for illustrative purposes only. Further site specific analysis is require to site actual BMPs.
For potential locations of green roofs, see Fig. 6.4
Bioretention FacilityPermeable Paver SystemPervious Concrete SystemTree TrenchMicro-bio-planter boxInfiltration TrenchBioswale
Fig. 5.3 – Potential locations for stormwater BMPs in OTN
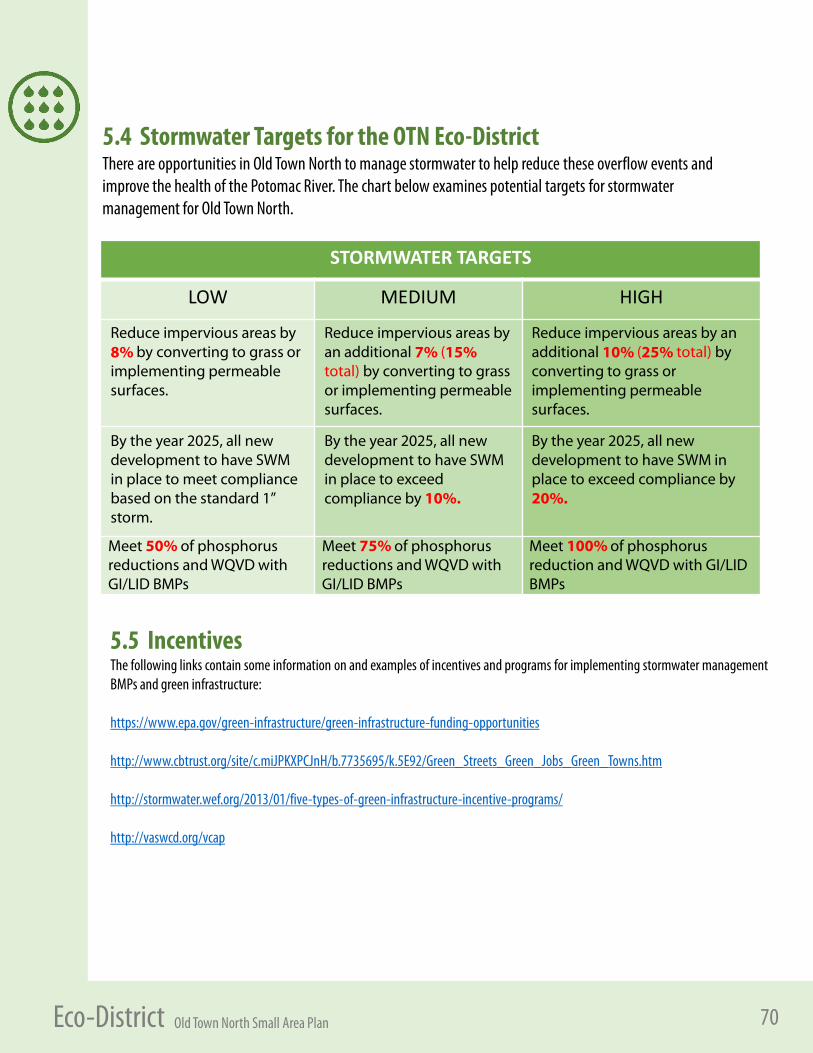
70Old Town North Small Area Plan Eco-District
There are opportunities in Old Town North to manage stormwater to help reduce these overflow events and improve the health of the Potomac River. The chart below examines potential targets for stormwater management for Old Town North.
STORMWATER TARGETS
LOW MEDIUM HIGH
Reduce impervious areas by 8% by converting to grass or implementing permeable surfaces.
Reduce impervious areas by an additional 7% (15%total) by converting to grass or implementing permeable surfaces.
Reduce impervious areas by an additional 10% (25% total) by converting to grass or implementing permeable surfaces.
By the year 2025, all new development to have SWM in place to meet compliance based on the standard 1” storm.
By the year 2025, all new development to have SWM in place to exceed compliance by 10%.
By the year 2025, all new development to have SWM in place to exceed compliance by 20%.
Meet 50% of phosphorus reductions and WQVD with GI/LID BMPs
Meet 75% of phosphorus reductions and WQVD with GI/LID BMPs
Meet 100% of phosphorus reduction and WQVD with GI/LID BMPs
5.4 Stormwater Targets for the OTN Eco-District
The following links contain some information on and examples of incentives and programs for implementing stormwater management BMPs and green infrastructure:
https://www.epa.gov/green-infrastructure/green-infrastructure-funding-opportunities
http://www.cbtrust.org/site/c.miJPKXPCJnH/b.7735695/k.5E92/Green_Streets_Green_Jobs_Green_Towns.htm
http://stormwater.wef.org/2013/01/five-types-of-green-infrastructure-incentive-programs/
http://vaswcd.org/vcap
5.5 Incentives
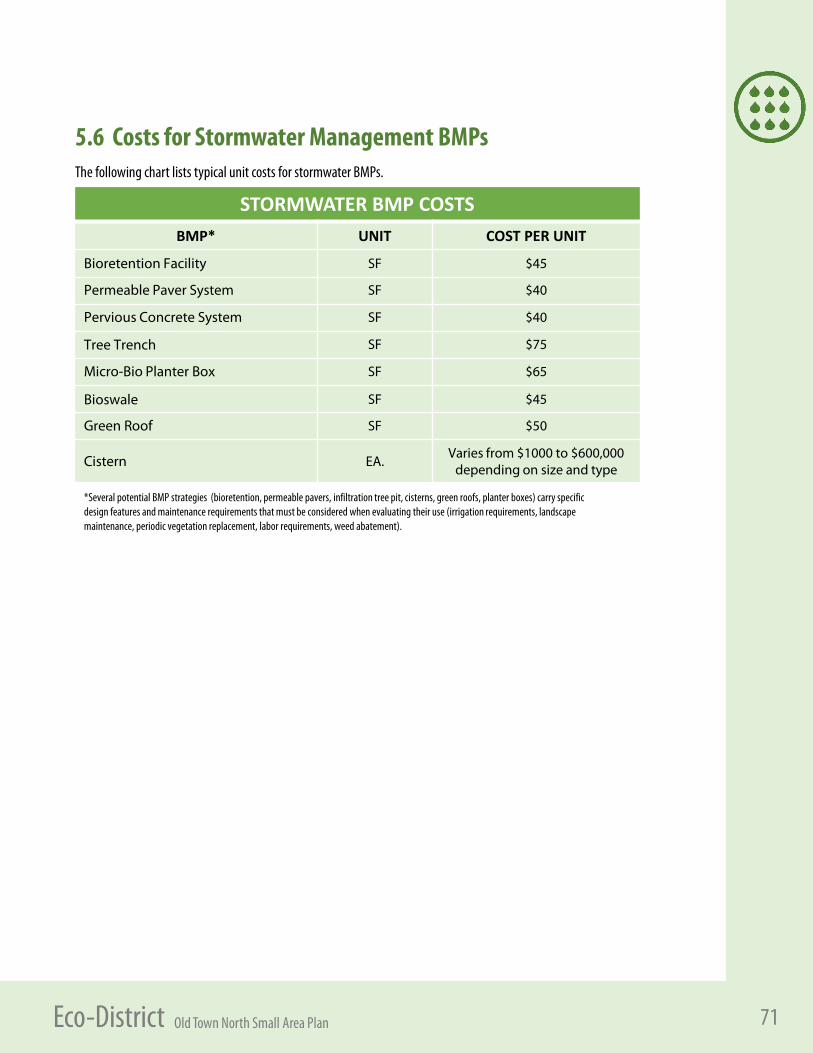
71Old Town North Small Area Plan Eco-District
5.6 Costs for Stormwater Management BMPs
STORMWATER BMP COSTSBMP* UNIT COST PER UNIT
Bioretention Facility SF $45
Permeable Paver System SF $40
Pervious Concrete System SF $40
Tree Trench SF $75
Micro-Bio Planter Box SF $65
Bioswale SF $45
Green Roof SF $50
Cistern EA.Varies from $1000 to $600,000
depending on size and type
*Several potential BMP strategies (bioretention, permeable pavers, infiltration tree pit, cisterns, green roofs, planter boxes) carry specific design features and maintenance requirements that must be considered when evaluating their use (irrigation requirements, landscape maintenance, periodic vegetation replacement, labor requirements, weed abatement).
The following chart lists typical unit costs for stormwater BMPs.

72Old Town North Small Area Plan Eco-District
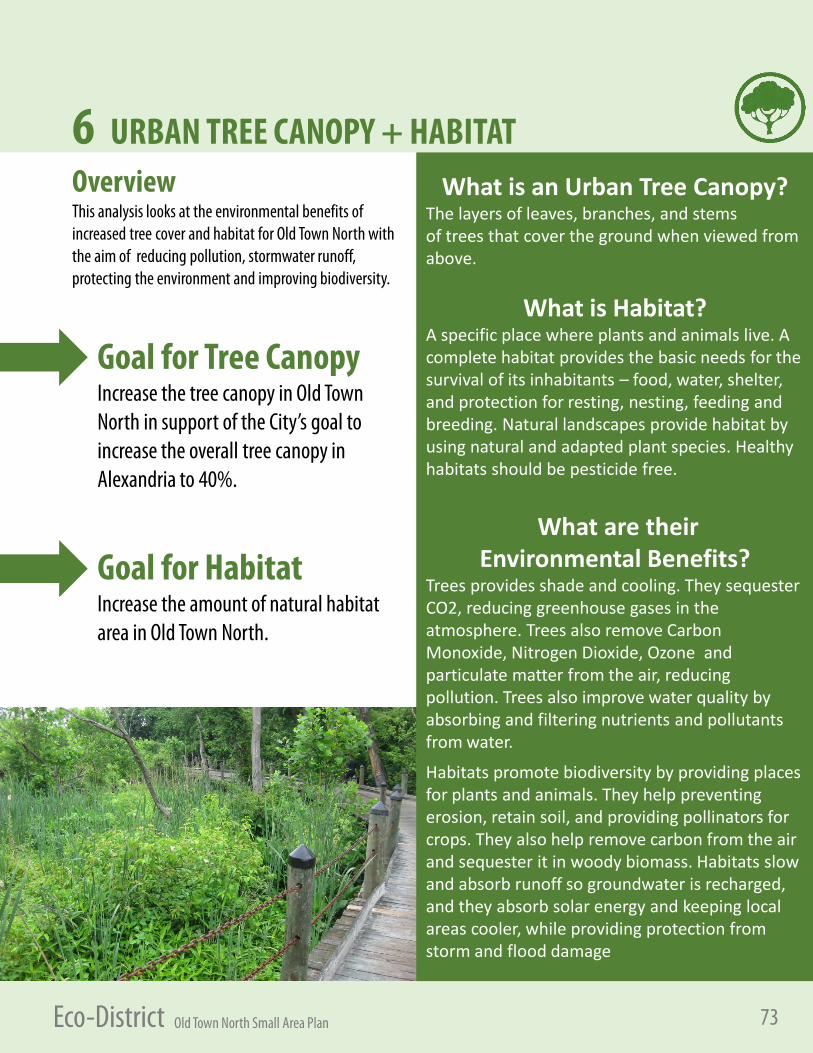
73Old Town North Small Area Plan Eco-District
OverviewThis analysis looks at the environmental benefits of increased tree cover and habitat for Old Town North with the aim of reducing pollution, stormwater runoff, protecting the environment and improving biodiversity.
6 URBAN TREE CANOPY + HABITATWhat is an Urban Tree Canopy?
The layers of leaves, branches, and stems of trees that cover the ground when viewed from above.
What is Habitat?A specific place where plants and animals live. A complete habitat provides the basic needs for the survival of its inhabitants – food, water, shelter, and protection for resting, nesting, feeding and breeding. Natural landscapes provide habitat by using natural and adapted plant species. Healthy habitats should be pesticide free.
What are their Environmental Benefits?
Trees provides shade and cooling. They sequester CO2, reducing greenhouse gases in the atmosphere. Trees also remove Carbon Monoxide, Nitrogen Dioxide, Ozone and particulate matter from the air, reducing pollution. Trees also improve water quality by absorbing and filtering nutrients and pollutants from water.
Habitats promote biodiversity by providing places for plants and animals. They help preventing erosion, retain soil, and providing pollinators for crops. They also help remove carbon from the air and sequester it in woody biomass. Habitats slow and absorb runoff so groundwater is recharged, and they absorb solar energy and keeping local areas cooler, while providing protection from storm and flood damage
Goal for Tree Canopy Increase the tree canopy in Old Town North in support of the City’s goal to increase the overall tree canopy in Alexandria to 40%.
Goal for HabitatIncrease the amount of natural habitat area in Old Town North.
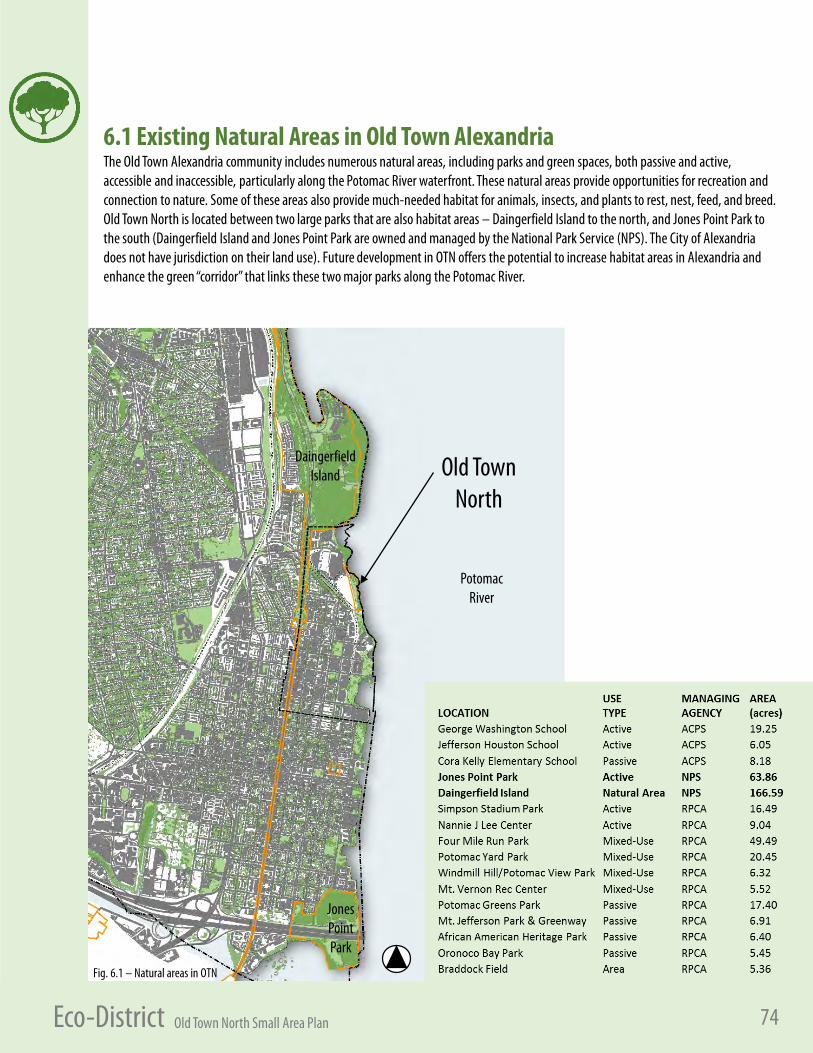
74Old Town North Small Area Plan Eco-District
6.1 Existing Natural Areas in Old Town AlexandriaThe Old Town Alexandria community includes numerous natural areas, including parks and green spaces, both passive and active,accessible and inaccessible, particularly along the Potomac River waterfront. These natural areas provide opportunities for recreation and connection to nature. Some of these areas also provide much-needed habitat for animals, insects, and plants to rest, nest, feed, and breed. Old Town North is located between two large parks that are also habitat areas – Daingerfield Island to the north, and Jones Point Park to the south (Daingerfield Island and Jones Point Park are owned and managed by the National Park Service (NPS). The City of Alexandria does not have jurisdiction on their land use). Future development in OTN offers the potential to increase habitat areas in Alexandria and enhance the green “corridor” that links these two major parks along the Potomac River.
Daingerfield Island
Jones Point Park
Potomac River
Old Town North
Fig. 6.1 – Natural areas in OTN
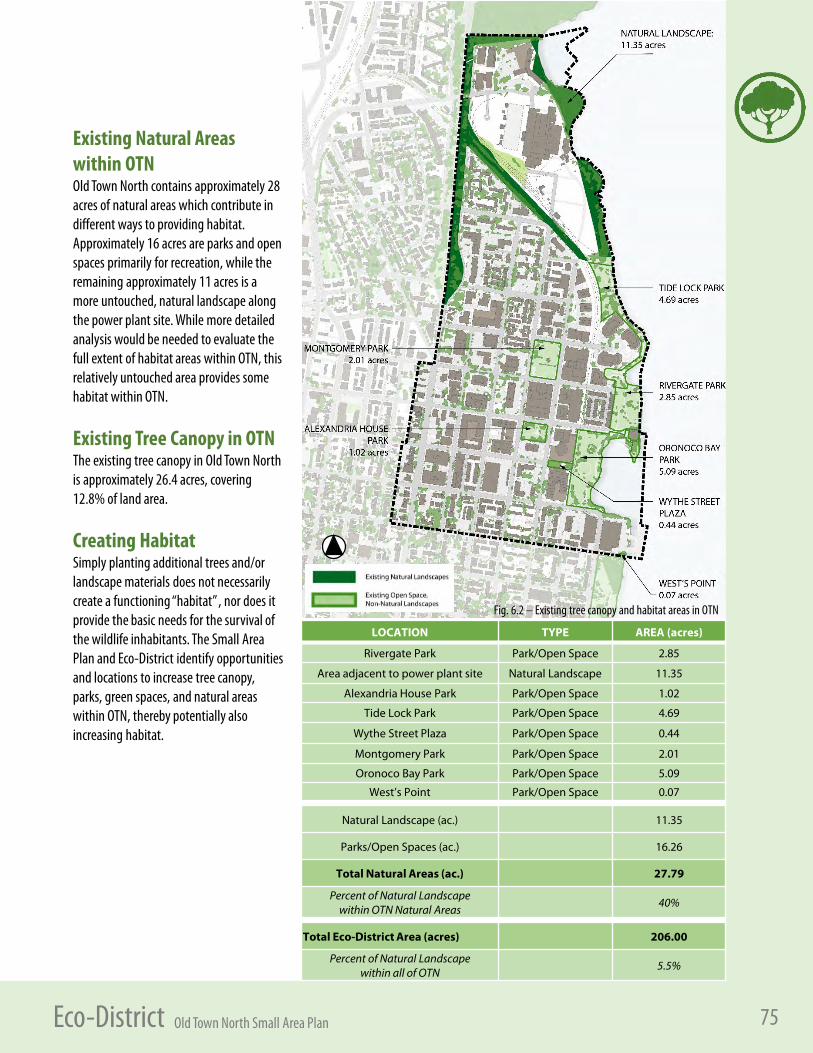
75Old Town North Small Area Plan Eco-District
Existing Natural Areas within OTNOld Town North contains approximately 28 acres of natural areas which contribute in different ways to providing habitat. Approximately 16 acres are parks and open spaces primarily for recreation, while the remaining approximately 11 acres is a more untouched, natural landscape along the power plant site. While more detailed analysis would be needed to evaluate the full extent of habitat areas within OTN, this relatively untouched area provides some habitat within OTN.
Existing Tree Canopy in OTNThe existing tree canopy in Old Town North is approximately 26.4 acres, covering 12.8% of land area.
Creating HabitatSimply planting additional trees and/or landscape materials does not necessarily create a functioning “habitat” , nor does it provide the basic needs for the survival of the wildlife inhabitants. The Small Area Plan and Eco-District identify opportunities and locations to increase tree canopy, parks, green spaces, and natural areas within OTN, thereby potentially also increasing habitat.
LOCATION TYPE AREA (acres)
Rivergate Park Park/Open Space 2.85
Area adjacent to power plant site Natural Landscape 11.35
Alexandria House Park Park/Open Space 1.02
Tide Lock Park Park/Open Space 4.69
Wythe Street Plaza Park/Open Space 0.44
Montgomery Park Park/Open Space 2.01
Oronoco Bay Park Park/Open Space 5.09
West’s Point Park/Open Space 0.07
Natural Landscape (ac.) 11.35
Parks/Open Spaces (ac.) 16.26
Total Natural Areas (ac.) 27.79
Percent of Natural Landscape within OTN Natural Areas 40%
Total Eco-District Area (acres) 206.00
Percent of Natural Landscape within all of OTN 5.5%
Fig. 6.2 – Existing tree canopy and habitat areas in OTN
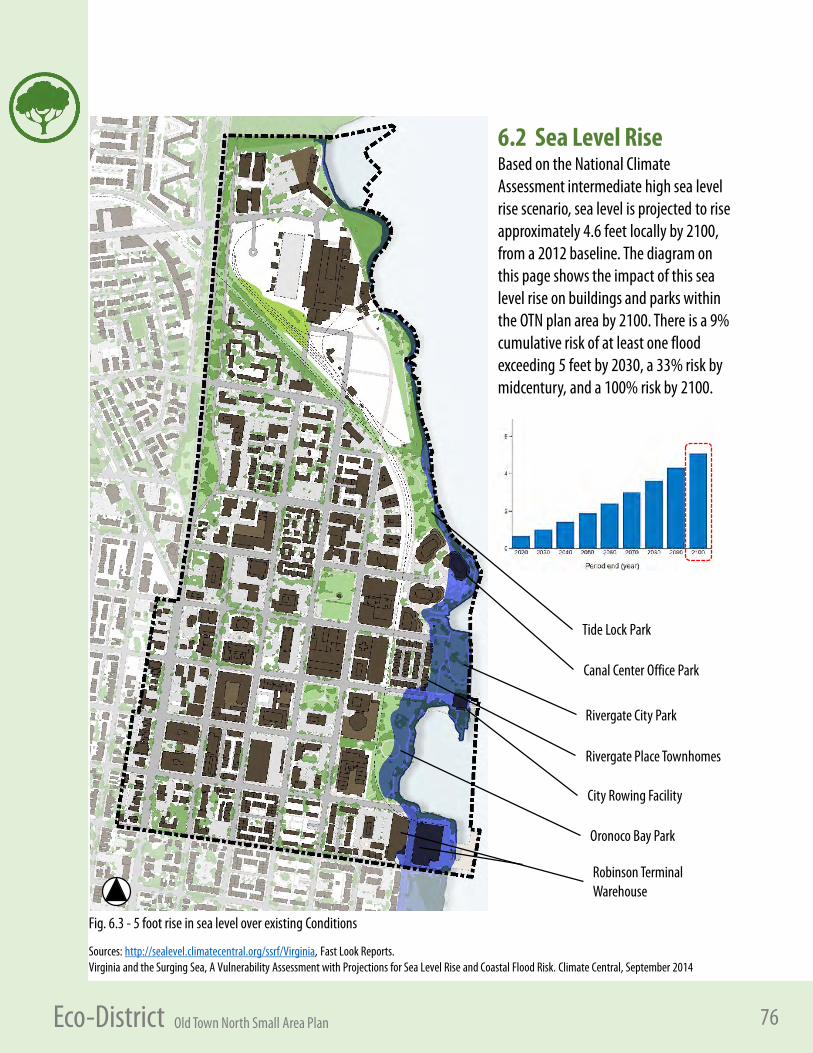
76Old Town North Small Area Plan Eco-District
6.2 Sea Level RiseBased on the National Climate Assessment intermediate high sea level rise scenario, sea level is projected to rise approximately 4.6 feet locally by 2100, from a 2012 baseline. The diagram on this page shows the impact of this sea level rise on buildings and parks within the OTN plan area by 2100. There is a 9% cumulative risk of at least one flood exceeding 5 feet by 2030, a 33% risk by midcentury, and a 100% risk by 2100.
Sources: http://sealevel.climatecentral.org/ssrf/Virginia, Fast Look Reports.Virginia and the Surging Sea, A Vulnerability Assessment with Projections for Sea Level Rise and Coastal Flood Risk. Climate Central, September 2014
Fig. 6.3 - 5 foot rise in sea level over existing Conditions
Robinson Terminal Warehouse
Oronoco Bay Park
Rivergate City Park
City Rowing Facility
Rivergate Place Townhomes
Canal Center Office Park
Tide Lock Park
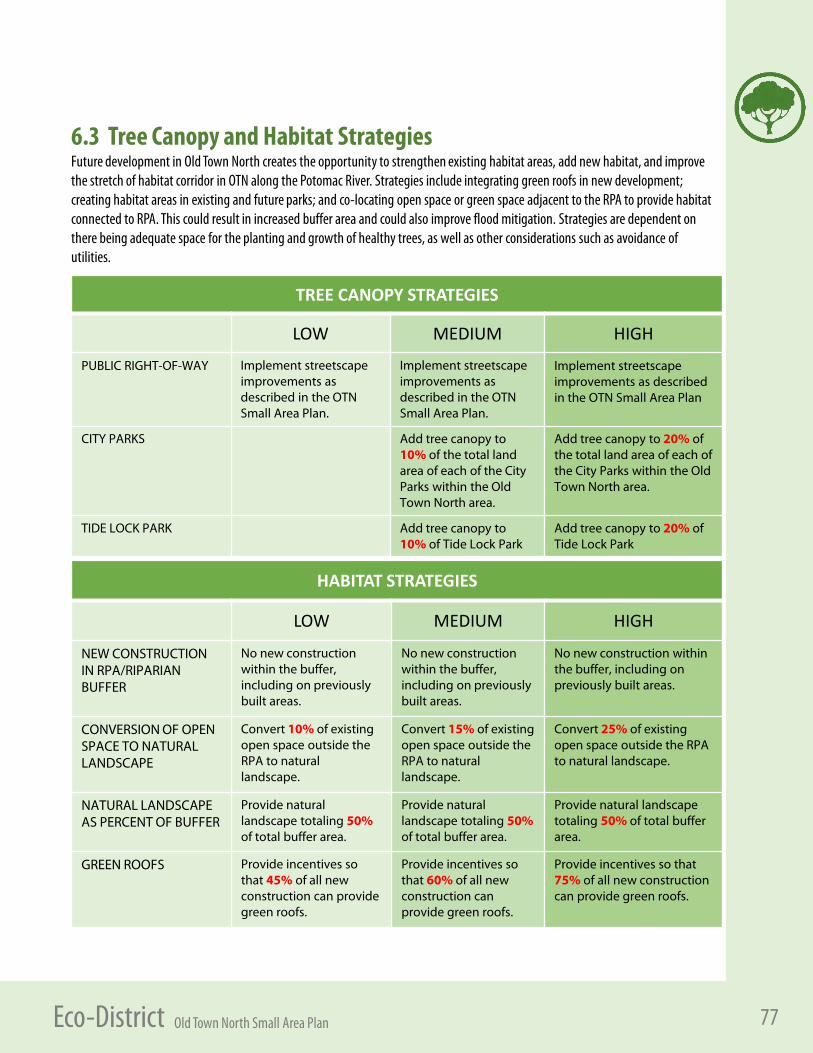
77Old Town North Small Area Plan Eco-District
6.3 Tree Canopy and Habitat StrategiesFuture development in Old Town North creates the opportunity to strengthen existing habitat areas, add new habitat, and improve the stretch of habitat corridor in OTN along the Potomac River. Strategies include integrating green roofs in new development; creating habitat areas in existing and future parks; and co-locating open space or green space adjacent to the RPA to provide habitat connected to RPA. This could result in increased buffer area and could also improve flood mitigation. Strategies are dependent on there being adequate space for the planting and growth of healthy trees, as well as other considerations such as avoidance ofutilities.
HABITAT STRATEGIES
LOW MEDIUM HIGH
NEW CONSTRUCTION IN RPA/RIPARIANBUFFER
No new construction within the buffer, including on previously built areas.
No new construction within the buffer, including on previously built areas.
No new construction within the buffer, including on previously built areas.
CONVERSION OF OPENSPACE TO NATURAL LANDSCAPE
Convert 10% of existing open space outside the RPA to natural landscape.
Convert 15% of existing open space outside the RPA to natural landscape.
Convert 25% of existing open space outside the RPA to natural landscape.
NATURAL LANDSCAPE AS PERCENT OF BUFFER
Provide natural landscape totaling 50%of total buffer area.
Provide natural landscape totaling 50%of total buffer area.
Provide natural landscape totaling 50% of total buffer area.
GREEN ROOFS Provide incentives sothat 45% of all new construction can provide green roofs.
Provide incentives sothat 60% of all new construction can provide green roofs.
Provide incentives so that 75% of all new construction can provide green roofs.
TREE CANOPY STRATEGIES
LOW MEDIUM HIGH
PUBLIC RIGHT-OF-WAY Implement streetscape improvements as described in the OTN Small Area Plan.
Implement streetscape improvements as described in the OTN Small Area Plan.
Implement streetscape improvements as described in the OTN Small Area Plan
CITY PARKS Add tree canopy to 10% of the total land area of each of the City Parks within the Old Town North area.
Add tree canopy to 20% of the total land area of each of the City Parks within the Old Town North area.
TIDE LOCK PARK Add tree canopy to 10% of Tide Lock Park
Add tree canopy to 20% of Tide Lock Park
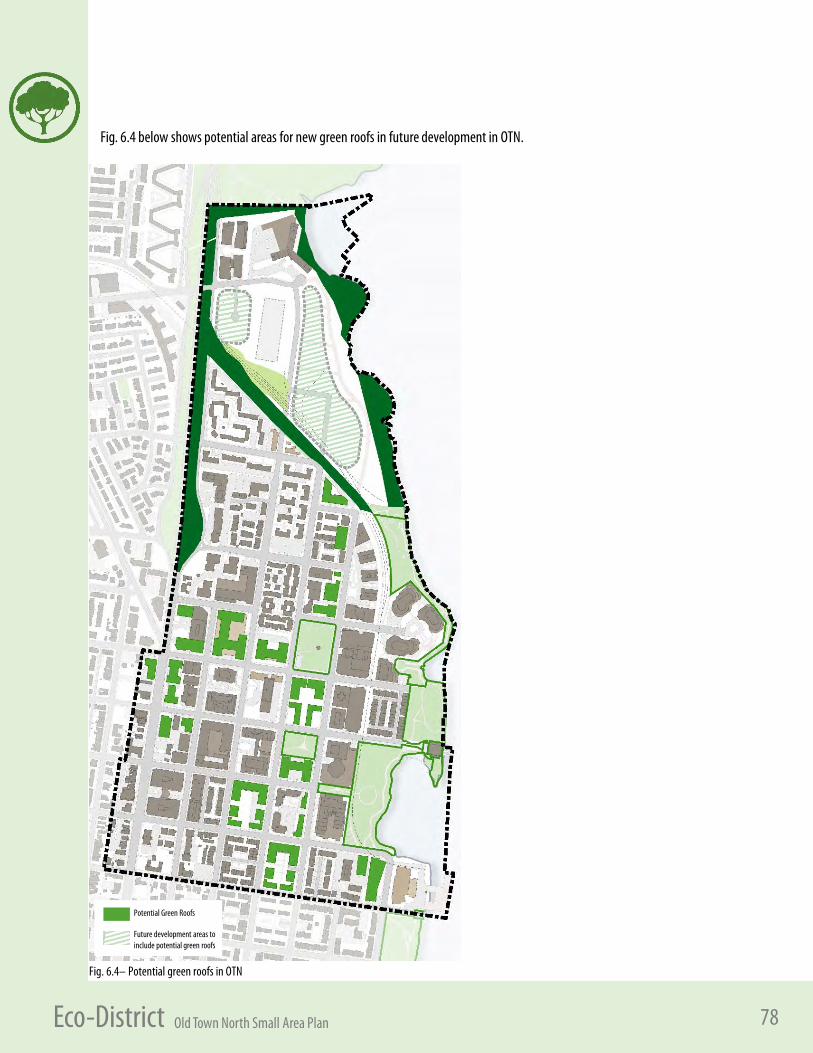
78Old Town North Small Area Plan Eco-District
Fig. 6.4 below shows potential areas for new green roofs in future development in OTN.
Potential Green Roofs
Future development areas to include potential green roofs
Fig. 6.4– Potential green roofs in OTN
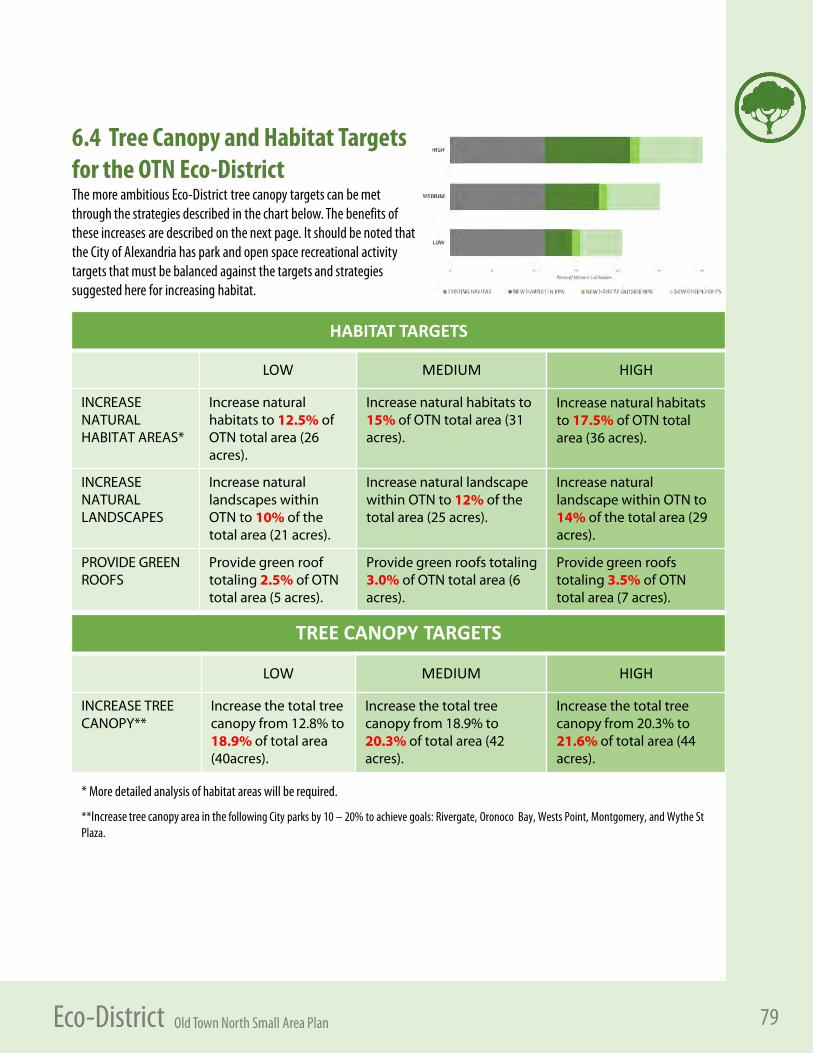
79Old Town North Small Area Plan Eco-District
6.4 Tree Canopy and Habitat Targets for the OTN Eco-District The more ambitious Eco-District tree canopy targets can be met through the strategies described in the chart below. The benefits of these increases are described on the next page. It should be noted that the City of Alexandria has park and open space recreational activity targets that must be balanced against the targets and strategies suggested here for increasing habitat.
* More detailed analysis of habitat areas will be required.
**Increase tree canopy area in the following City parks by 10 – 20% to achieve goals: Rivergate, Oronoco Bay, Wests Point, Montgomery, and Wythe St Plaza.
TREE CANOPY TARGETS
LOW MEDIUM HIGH
INCREASE TREE CANOPY**
Increase the total tree canopy from 12.8% to 18.9% of total area (40acres).
Increase the total tree canopy from 18.9% to 20.3% of total area (42 acres).
Increase the total tree canopy from 20.3% to 21.6% of total area (44 acres).
HABITAT TARGETS
LOW MEDIUM HIGH
INCREASE NATURAL HABITAT AREAS*
Increase natural habitats to 12.5% of OTN total area (26acres).
Increase natural habitats to 15% of OTN total area (31 acres).
Increase natural habitats to 17.5% of OTN total area (36 acres).
INCREASE NATURAL LANDSCAPES
Increase natural landscapes within OTN to 10% of the total area (21 acres).
Increase natural landscape within OTN to 12% of the total area (25 acres).
Increase natural landscape within OTN to 14% of the total area (29 acres).
PROVIDE GREENROOFS
Provide green roof totaling 2.5% of OTN total area (5 acres).
Provide green roofs totaling 3.0% of OTN total area (6 acres).
Provide green roofs totaling 3.5% of OTN total area (7 acres).
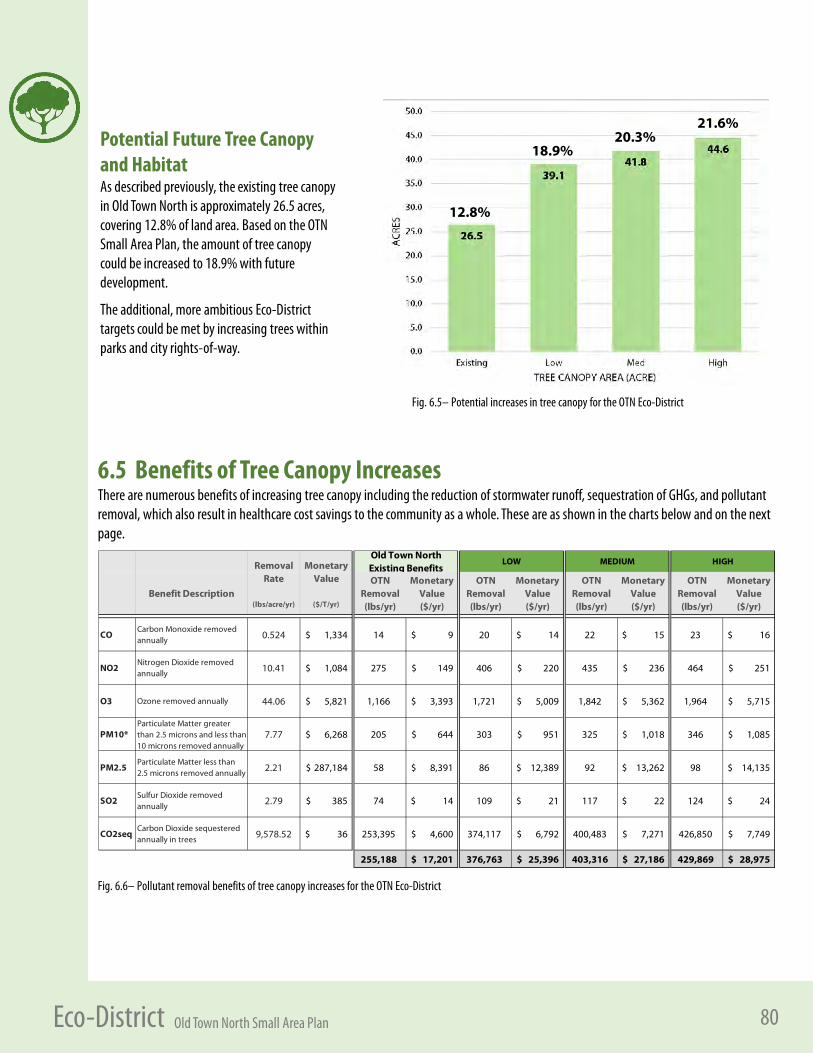
80Old Town North Small Area Plan Eco-District
Potential Future Tree Canopy and Habitat As described previously, the existing tree canopy in Old Town North is approximately 26.5 acres, covering 12.8% of land area. Based on the OTN Small Area Plan, the amount of tree canopy could be increased to 18.9% with future development.
The additional, more ambitious Eco-District targets could be met by increasing trees within parks and city rights-of-way.
Fig. 6.5– Potential increases in tree canopy for the OTN Eco-District
12.8%
18.9%20.3%
21.6%
6.5 Benefits of Tree Canopy IncreasesThere are numerous benefits of increasing tree canopy including the reduction of stormwater runoff, sequestration of GHGs, and pollutant removal, which also result in healthcare cost savings to the community as a whole. These are as shown in the charts below and on the next page.
Fig. 6.6– Pollutant removal benefits of tree canopy increases for the OTN Eco-District
(lbs/acre/yr) ($/T/yr)
COCarbon Monoxide removed annually 0.524 1,334$ 14 9$ 20 14$ 22 15$ 23 16$
NO2Nitrogen Dioxide removed annually 10.41 1,084$ 275 149$ 406 220$ 435 236$ 464 251$
O3 Ozone removed annually 44.06 5,821$ 1,166 3,393$ 1,721 5,009$ 1,842 5,362$ 1,964 5,715$
PM10*Particulate Matter greater than 2.5 microns and less than 10 microns removed annually
7.77 6,268$ 205 644$ 303 951$ 325 1,018$ 346 1,085$
PM2.5Particulate Matter less than 2.5 microns removed annually 2.21 287,184$ 58 8,391$ 86 12,389$ 92 13,262$ 98 14,135$
SO2Sulfur Dioxide removed annually 2.79 385$ 74 14$ 109 21$ 117 22$ 124 24$
CO2seqCarbon Dioxide sequestered annually in trees 9,578.52 36$ 253,395 4,600$ 374,117 6,792$ 400,483 7,271$ 426,850 7,749$
255,188 17,201$ 376,763 25,396$ 403,316 27,186$ 429,869 28,975$
MEDIUM
OTN Removal (lbs/yr)
Monetary Value ($/yr)
HIGH
OTN Removal (lbs/yr)
Monetary Value ($/yr)
Benefit Description
Removal Rate
Monetary Value
Old Town North Existing Benefits
LOW
OTN Removal (lbs/yr)
Monetary Value ($/yr)
OTN Removal (lbs/yr)
Monetary Value ($/yr)
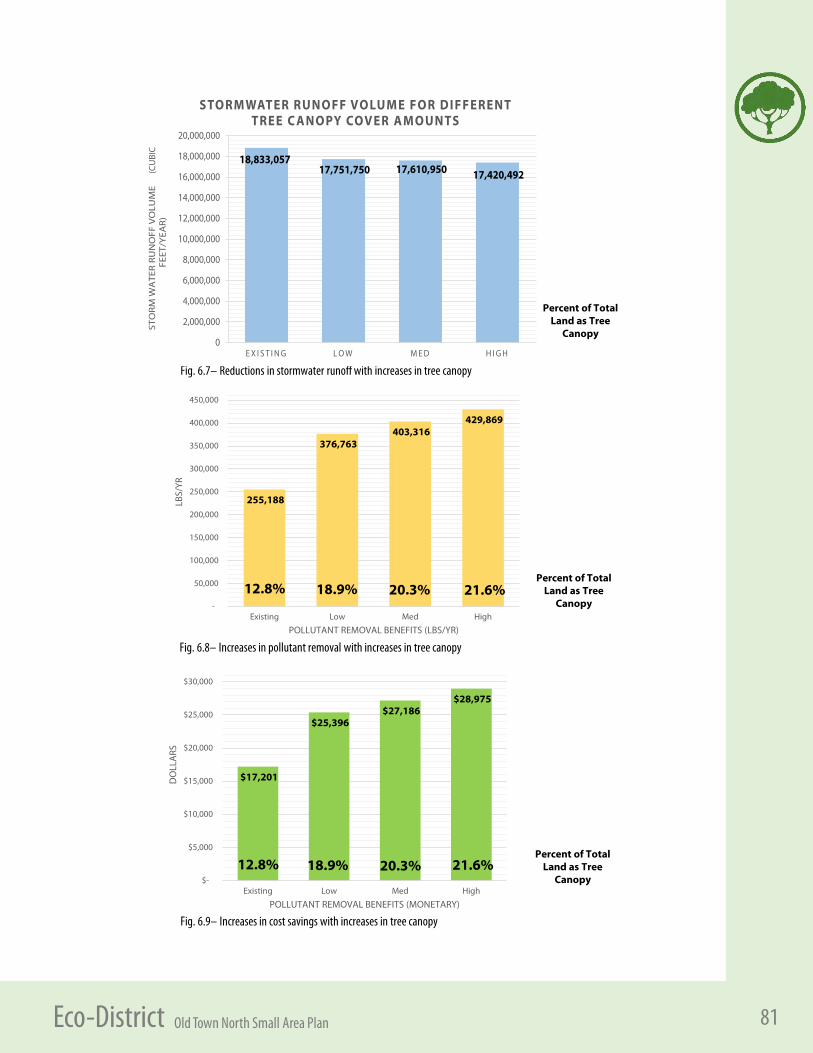
81Old Town North Small Area Plan Eco-District
12.8% 18.9% 20.3% 21.6%
$17,201
$25,396 $27,186
$28,975
$-
$5,000
$10,000
$15,000
$20,000
$25,000
$30,000
Existing Low Med High
DO
LLA
RS
POLLUTANT REMOVAL BENEFITS (MONETARY)
255,188
376,763 403,316
429,869
-
50,000
100,000
150,000
200,000
250,000
300,000
350,000
400,000
450,000
Existing Low Med High
LBS/
YR
POLLUTANT REMOVAL BENEFITS (LBS/YR)
Fig. 6.7– Reductions in stormwater runoff with increases in tree canopy
Fig. 6.8– Increases in pollutant removal with increases in tree canopy
Fig. 6.9– Increases in cost savings with increases in tree canopy
12.8% 18.9% 20.3% 21.6%
Percent of Total Land as Tree
Canopy12.8% 18.9% 20.3% 21.6%
Percent of Total Land as Tree
Canopy12.8% 18.9% 20.3% 21.6%
18,833,057 17,751,750 17,610,950 17,420,492
0
2,000,000
4,000,000
6,000,000
8,000,000
10,000,000
12,000,000
14,000,000
16,000,000
18,000,000
20,000,000
E X I S T I N G L O W M E D H I G H
STO
RM
WA
TER
RU
NO
FF V
OLU
ME
(CU
BIT
FE
ET/Y
EAR
)
STO RM WAT ER RUNO F F VO LUM E F O R D I F F ERENT T REE C A NO PY COV ER A M O UNTS
(CU
BIC
Percent of Total Land as Tree
Canopy