oliver milton, annie steinberg, jeff wilson. project overview addressing the challenges of climate...
Post on 19-Dec-2015
219 views
TRANSCRIPT
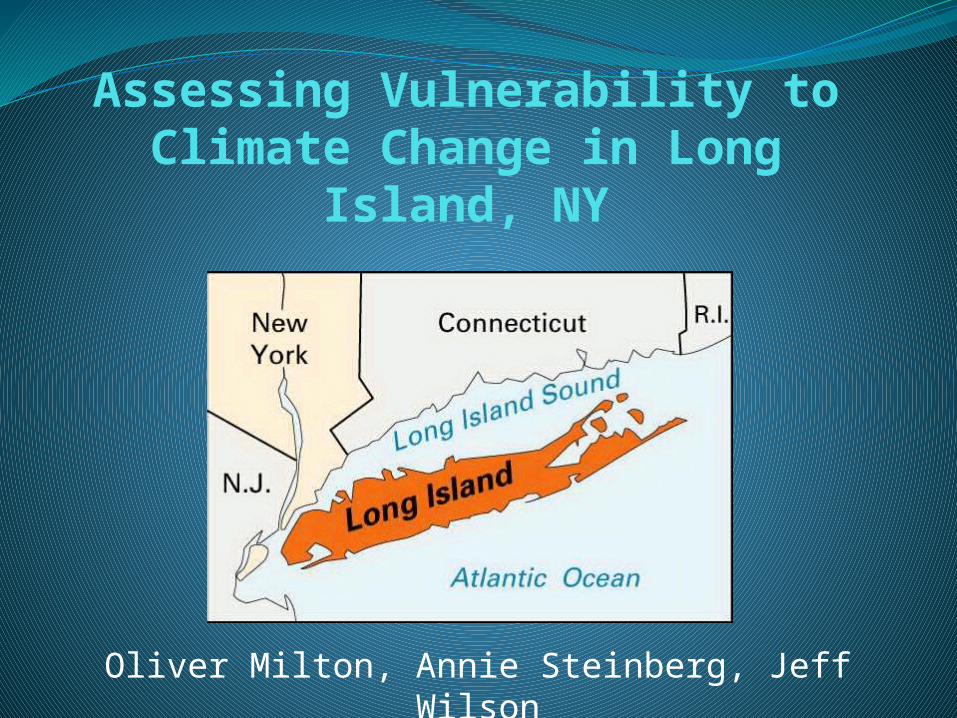
Assessing Vulnerability to Climate Change in Long
Island, NY
Oliver Milton, Annie Steinberg, Jeff Wilson

Project Overview
Addressing the challenges of climate change in Long Island –specifically sea level riseHabitat fragmentationLoss of ecosystemsThreat to human communities
Goal/PurposeCreate a synthesis of methods for
characterizing, quantifying, and illustrating community vulnerability to sea level rise in Long Island, NY.
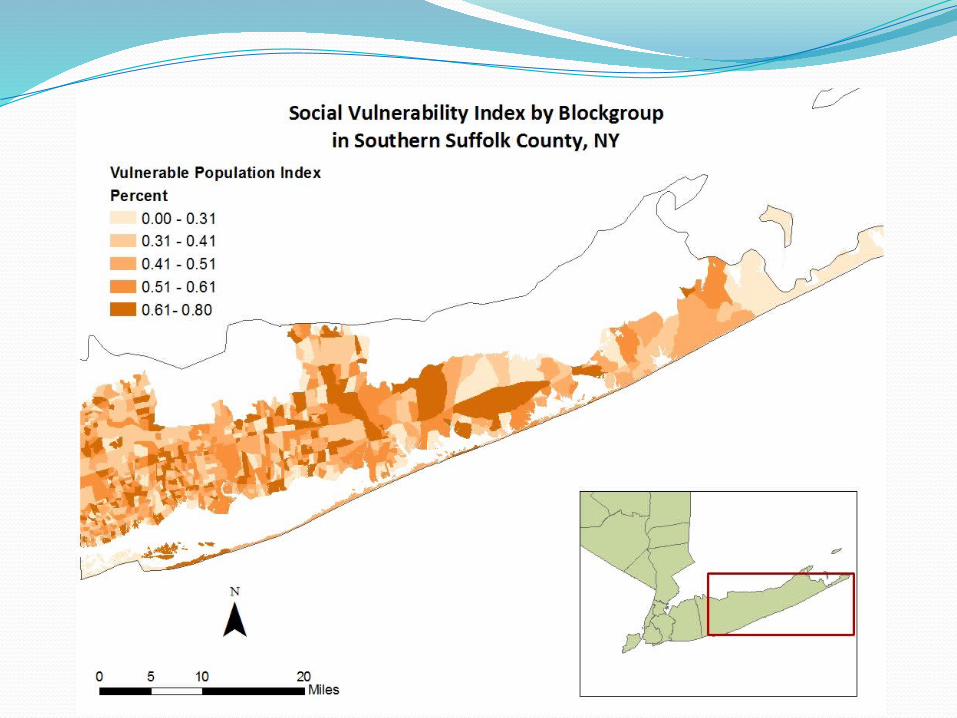
Spatially represent region’s most vulnerable communities
Synthesize method for combining sea level rise data and community vulnerability
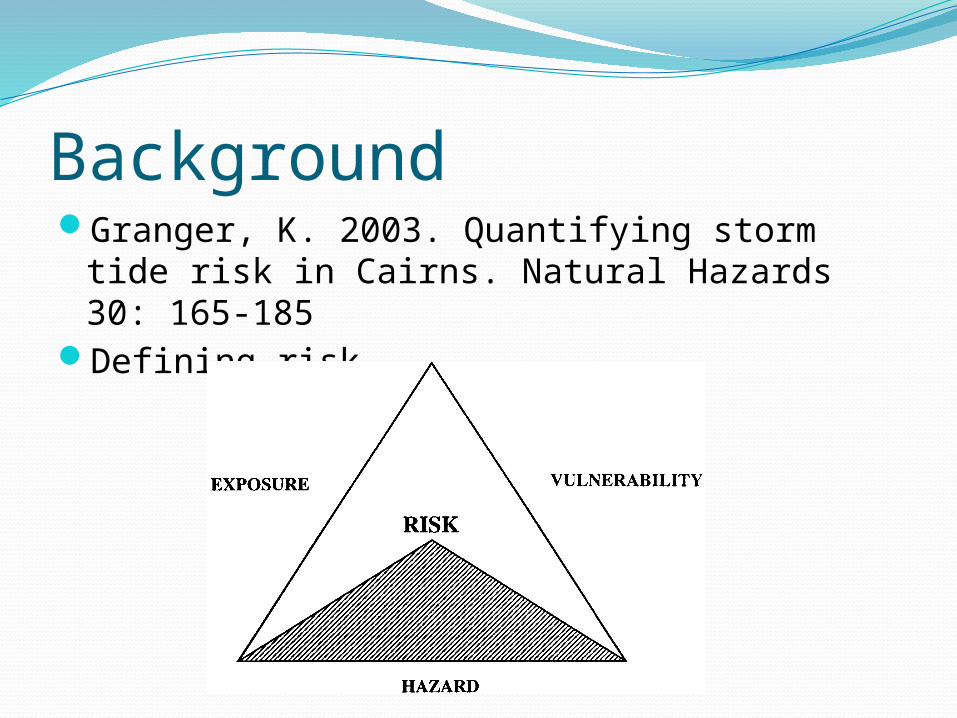
BackgroundGranger, K. 2003. Quantifying storm tide risk
in Cairns. Natural Hazards 30: 165-185Defining risk
Need to Know QuestionsWhat method (attribute scheme) is best for
identifying vulnerable communities in the Long Island area?
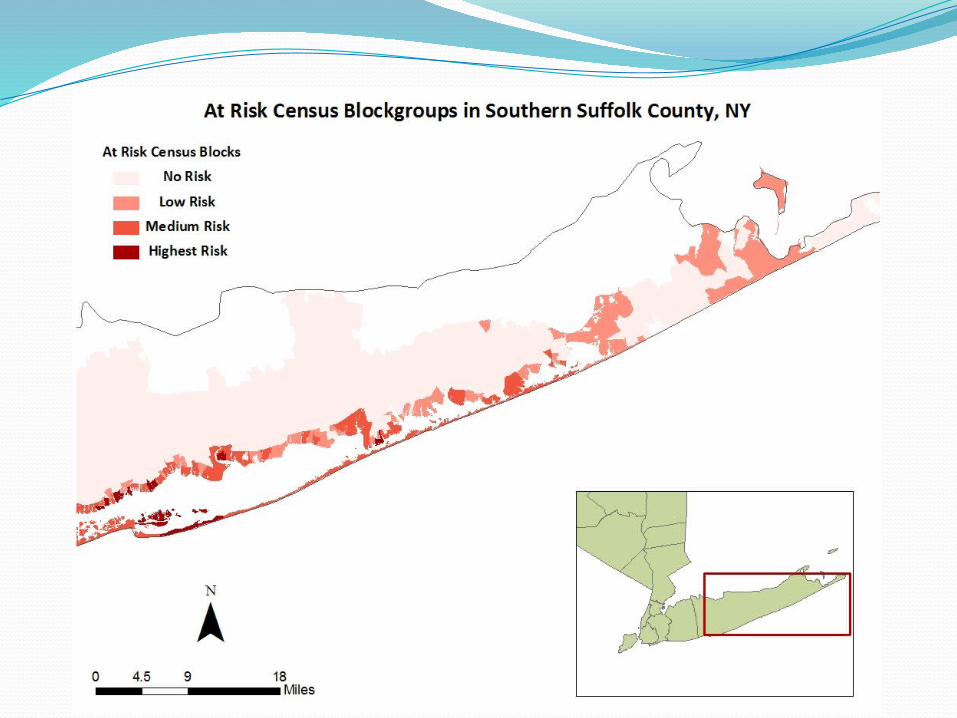
Where are the vulnerable communities located on the map?
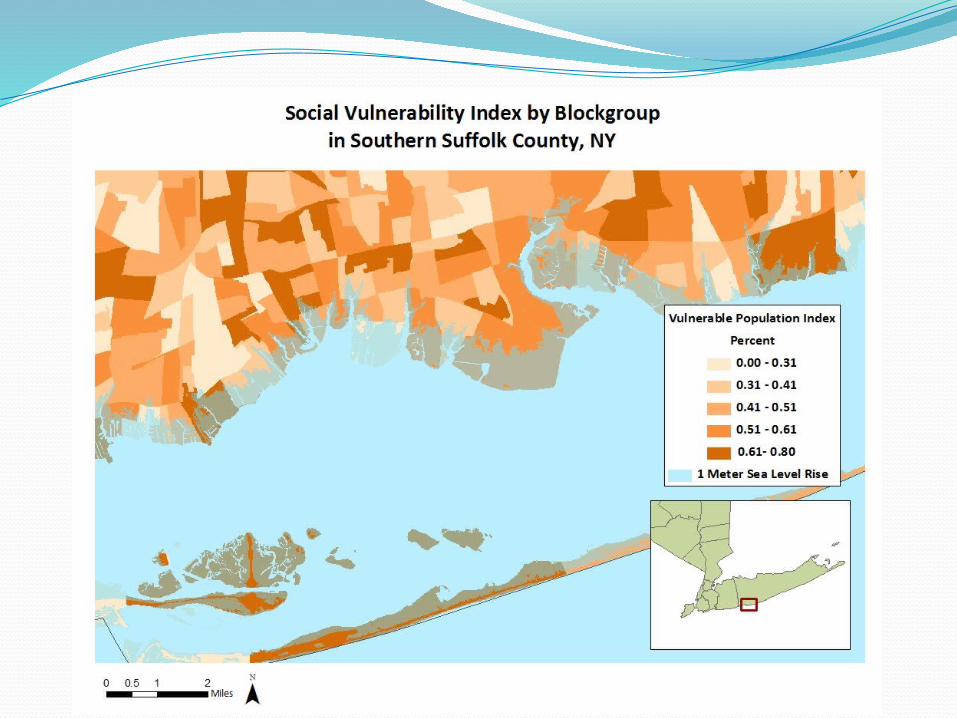
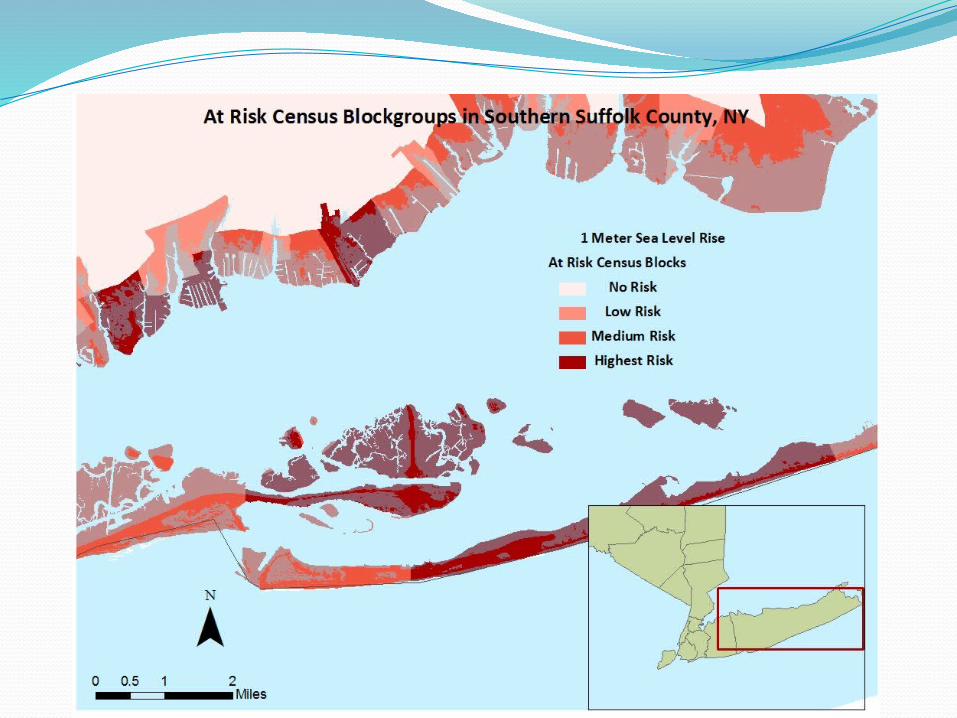
By what percent are each census blockgroups covered by the 1m sea level rise projection?
Where do vulnerable populations and sea-level rise projections intersect?
Where should coastal managers implement protection techniques using natural green infrastructure?
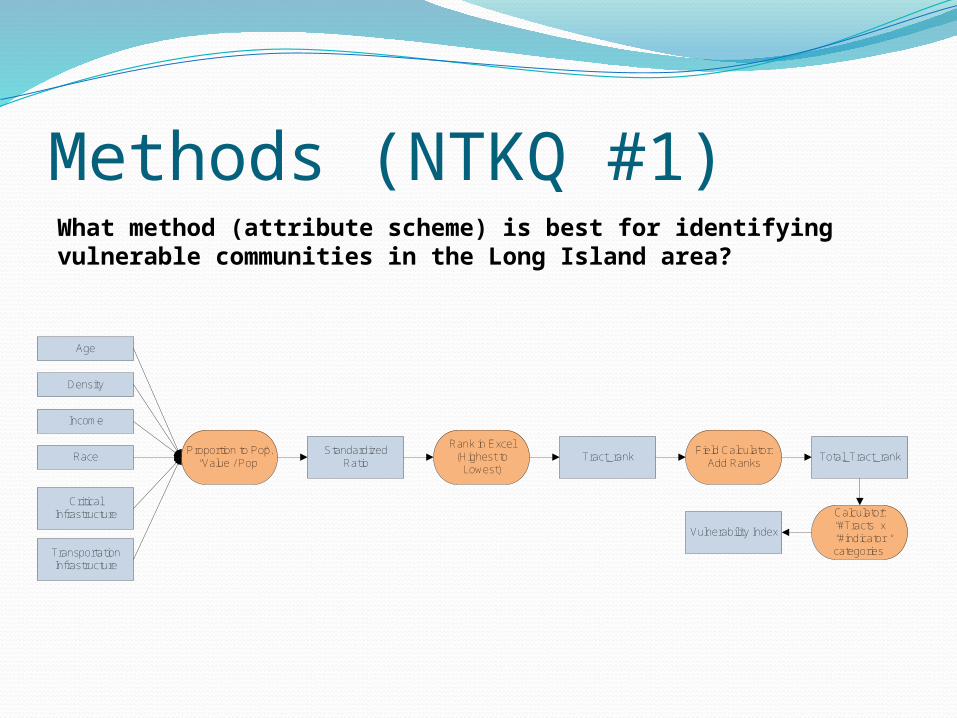
Methods (NTKQ #1)What method (attribute scheme) is best for identifying vulnerable communities in the Long Island area?
Age
Density
Income
RaceProportion to Pop.
“Value / Pop”
Critical Infrastructure
Transportation Infrastructure
Standardized Ratio
Rank in Excel (Highest to
Lowest)Tract_rank
Field Calculator:Add Ranks
Total_Tract_rank
Calculator: “#Tracts” x “#indicator categories”
Vulnerability Index
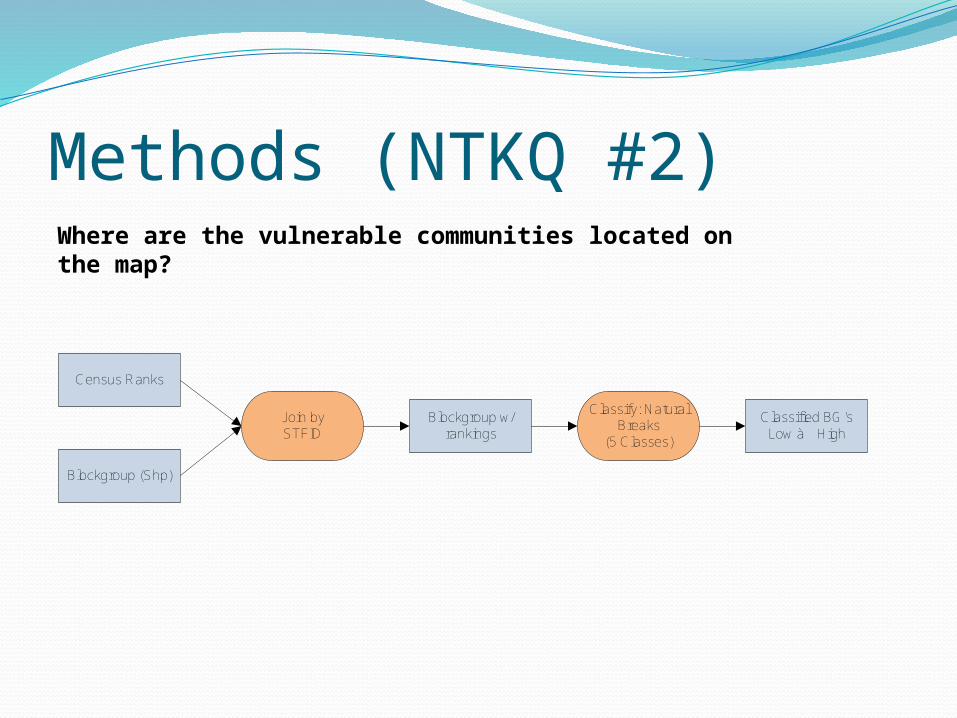
Methods (NTKQ #2)Where are the vulnerable communities located on the map?
Census Ranks
Blockgroup (Shp)
Join bySTFID
Blockgroup w/ rankings
Classify: Natural Breaks
(5 Classes)
Classified BG’sLow à High
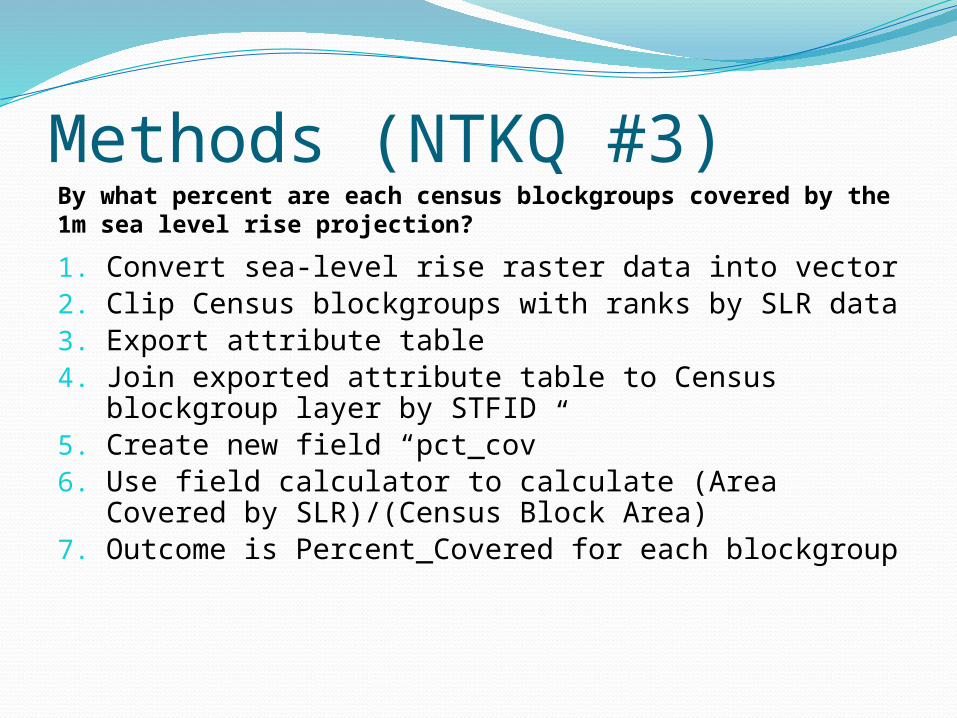
Methods (NTKQ #3)
1. Convert sea-level rise raster data into vector2. Clip Census blockgroups with ranks by SLR
data3. Export attribute table 4. Join exported attribute table to Census
blockgroup layer by STFID5. Create new field “pct_cov”6. Use field calculator to calculate (Area Covered
by SLR)/(Census Block Area)7. Outcome is Percent_Covered for each
blockgroup
By what percent are each census blockgroups covered by the 1m sea level rise projection?
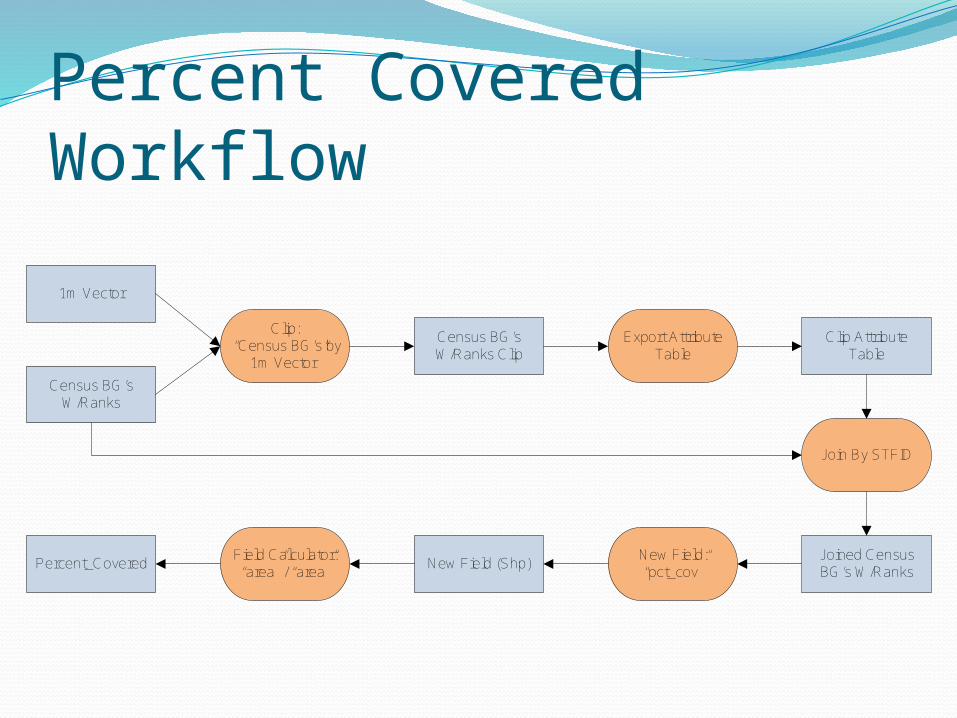
Percent Covered Workflow
Clip: “Census BG’s by
1m Vector”
Census BG’sW/Ranks
1m Vector
Census BG’sW/Ranks Clip
Export AttributeTable
Clip Attribute Table
Join By STFID
Joined Census BG’s W/Ranks
New Field:“pct_cov”
New Field (Shp)Field Calculator:“area” / “area”
Percent_Covered
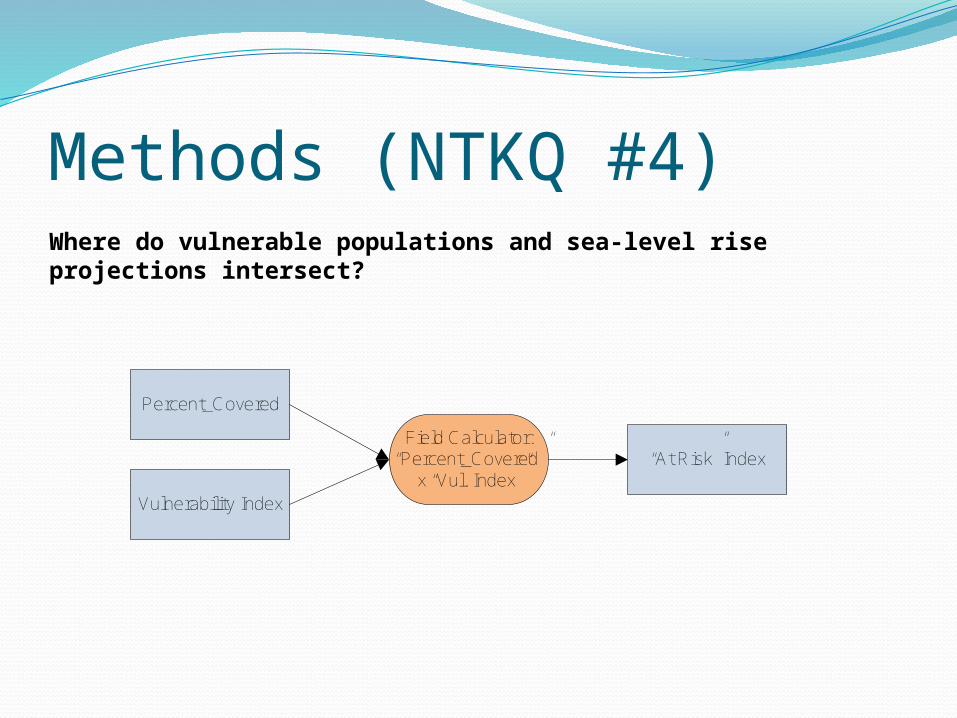
Methods (NTKQ #4)Where do vulnerable populations and sea-level rise projections intersect?
Percent_Covered
Vulnerability Index
Field Calculator:“Percent_Covered”
x “Vul. Index”“At Risk” Index
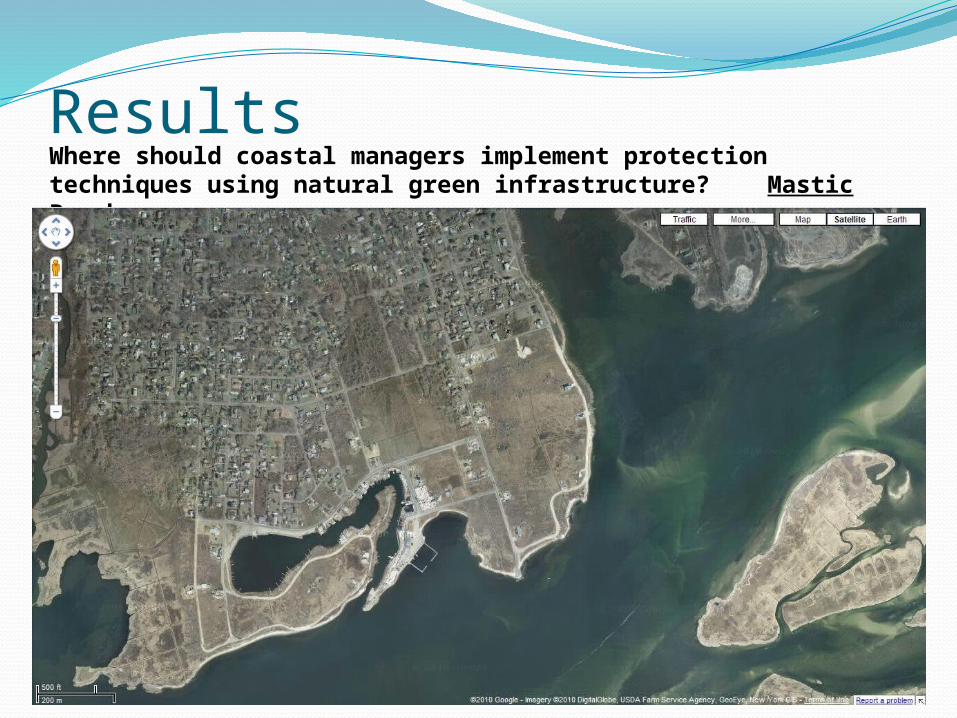
Results
(Show google maps, city names where clusters exist)
Where should coastal managers implement protection techniques using natural green infrastructure?Mastic Beach
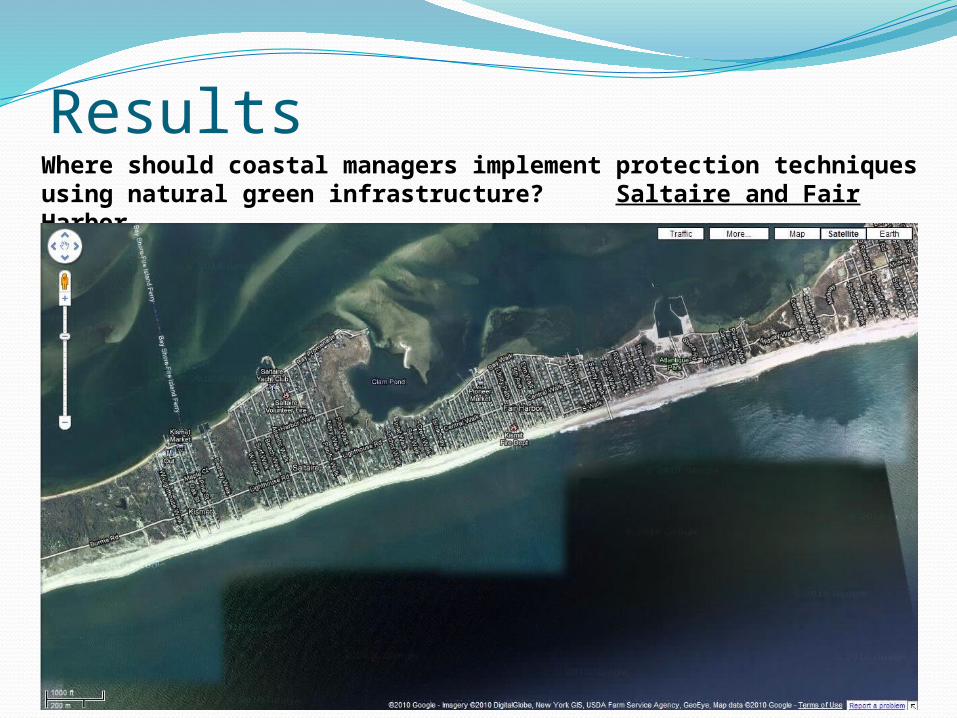
ResultsWhere should coastal managers implement protection techniques using natural green infrastructure? Saltaire and Fair Harbor
ConclusionsSignificant loss of infrastructure and life will
occur in Southern Suffolk County without interventionMany blockgroups of high vulnerability and
high riskObvious cluster areas
Points for intervention by coastal managersRequire more investigation
Ranking methods work well for identifying areas of most need
GIS is extremely useful in indentifying which areas will need intervention planning
RecommendationsIncorporate weightings
Survey community members/stakeholdersHigher resolution dataIncorporate multiple scenariosCombine ecosystem vulnerability with social
vulnerability