omegaplus 2.0 - scientific computing – hits...
TRANSCRIPT

1
OmegaPlus 2.0.0
Pavlos Pavlidis & Nikolaos Alachiotis


Contents
1 Introduction 1
2 The linkage disequilibrium (LD) pattern of selective sweeps 3
3 Features 73.1 Command line options . . . . . . . . . . . . . . . . . . . . . . . . . . . . . . . . . 73.2 Input file formats . . . . . . . . . . . . . . . . . . . . . . . . . . . . . . . . . . . . 9
3.2.1 FASTA format . . . . . . . . . . . . . . . . . . . . . . . . . . . . . . . . . 93.2.2 ms-like format . . . . . . . . . . . . . . . . . . . . . . . . . . . . . . . . . 103.2.3 MaCS-like format . . . . . . . . . . . . . . . . . . . . . . . . . . . . . . . 11
3.3 Output files . . . . . . . . . . . . . . . . . . . . . . . . . . . . . . . . . . . . . . . 123.3.1 Information file . . . . . . . . . . . . . . . . . . . . . . . . . . . . . . . . . 123.3.2 Warning file . . . . . . . . . . . . . . . . . . . . . . . . . . . . . . . . . . . 133.3.3 Report file . . . . . . . . . . . . . . . . . . . . . . . . . . . . . . . . . . . . 14
4 How to use OmegaPlus 174.1 Installation . . . . . . . . . . . . . . . . . . . . . . . . . . . . . . . . . . . . . . . 17
4.1.1 Linux platforms . . . . . . . . . . . . . . . . . . . . . . . . . . . . . . . . . 174.1.2 Windows platforms . . . . . . . . . . . . . . . . . . . . . . . . . . . . . . . 17
4.2 Execution examples . . . . . . . . . . . . . . . . . . . . . . . . . . . . . . . . . . 174.2.1 Standard . . . . . . . . . . . . . . . . . . . . . . . . . . . . . . . . . . . . 184.2.2 Enable imputation . . . . . . . . . . . . . . . . . . . . . . . . . . . . . . . 184.2.3 Force binary deduction . . . . . . . . . . . . . . . . . . . . . . . . . . . . . 184.2.4 Enable omega search approximation . . . . . . . . . . . . . . . . . . . . . 194.2.5 Deploy multiple threads . . . . . . . . . . . . . . . . . . . . . . . . . . . . 19
4.3 Execution details . . . . . . . . . . . . . . . . . . . . . . . . . . . . . . . . . . . . 19
Bibliography 22

Chapter 1
Introduction
OmegaPlus implements the ω statistic which detects complete selective sweeps using linkage-disequilibrium (LD) patterns of single nucleotide polymorphisms (SNPs). It is based on theω statistic as it was implemented by Pavlidis et al. [2010]. The ω statistic was originallyproposed by Kim and Nielsen [2004].
• OmegaPlus is a command-line C program.
• There is a sequential and a parallel implementation.
• Supported input file formats: ms-like, FASTA, MaCS.
• It can process several alignments in a single run.
• It can analyze data with alignment gaps or incomplete information (denoted by ‘-’ and‘N’ characters in an alignment).
• OmegaPlus is memory efficient and can analyze whole-genome datasets.
1


Chapter 2
The linkage disequilibrium (LD)pattern of selective sweeps
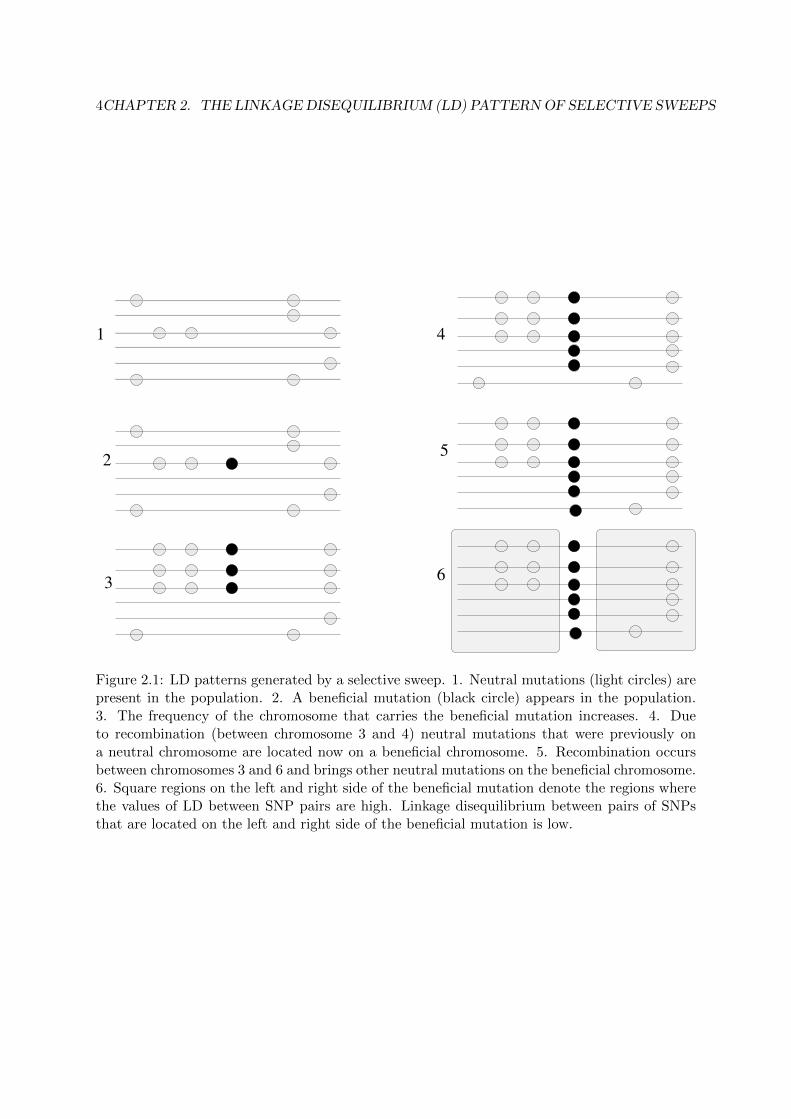
Figure 2.1 shows the generation of SNP patterns that can be used to localize a selective sweep.The figure consists of 6 snapshots that illustrate a population of chromosomes at different pointsin time. Snapshot 1 is the oldest since it refers to further in the past, whereas snapshot 6 refers topresent. Thus, in snapshot 1, neutral mutations were segregating in a population. At some timepoint (snapshot 2), a beneficial mutation appears (black circle). Since this mutation is beneficial,the frequency of the chromosome that carries it will increase in the population (snapshot 3).However, recombination between the beneficial chromosome and the neutral chromosomes mayoccur. At snapshot 4, recombination occurs on the left side of the beneficial mutation while onsnapshot 5 recombination occurs on the right side. Finally, at snapshot 6 we denote the regionswhere LD between pairs of SNPs is high on the left and right side of the beneficial mutation.LD between pairs of SNPs that are located on either sides of the beneficial mutation is low.
Assume a genomic window with S segregating sites that is split into a left and right sub-region with l and S − l segregating sites, respectively. The ω statistic (equation 2.1) quantifiesto what extent average LD is elevated on each side of the selective sweep (see numerator ofequation 2.1) but not across the selected site (see denominator of equation 2.1). The areabetween the left and right sub-regions is considered the center of the selective sweep. Thus, agenomic region may be scanned and scores are reported for each position.
ω =((l2
)+(S−l2
))−1(
∑i,j∈L r2ij +
∑i,j∈R r2ij)
(l(S − l))−1∑
i∈L,j∈R r2ij. (2.1)
In sub-genomic regions, that is, candidate regions of limited length (some thousand baseslong), the ω statistic can be assessed at each interval between two SNPs. S refers to thetotal number of SNPs and the goal is to find l that maximizes the ω statistic. When whole-genome data are concerned, the analysis becomes more complicated. Evaluating ω statisticat each interval between two SNPs can become computationally expensive since there mightbe hundrends of thousands of SNPs in a chromosome. Furthermore, S can not refer to thetotal amount of SNPs in the whole chromosome. This would be meaningless not only becausea selective sweep usually affects the polymorphism patterns only locally around the beneficialmutation but also because such computational approach would require a prohibitive amount ofresources. To process a whole-genome dataset, we first assume a grid of equidistant locationsLi, 1 < i < k, k defined by the user, where the ω statistic will be assessed. We also assume a
3
4CHAPTER 2. THE LINKAGEDISEQUILIBRIUM (LD) PATTERNOF SELECTIVE SWEEPS
1
2
3
4
5
6
Figure 2.1: LD patterns generated by a selective sweep. 1. Neutral mutations (light circles) arepresent in the population. 2. A beneficial mutation (black circle) appears in the population.3. The frequency of the chromosome that carries the beneficial mutation increases. 4. Dueto recombination (between chromosome 3 and 4) neutral mutations that were previously ona neutral chromosome are located now on a beneficial chromosome. 5. Recombination occursbetween chromosomes 3 and 6 and brings other neutral mutations on the beneficial chromosome.6. Square regions on the left and right side of the beneficial mutation denote the regions wherethe values of LD between SNP pairs are high. Linkage disequilibrium between pairs of SNPsthat are located on the left and right side of the beneficial mutation is low.
5
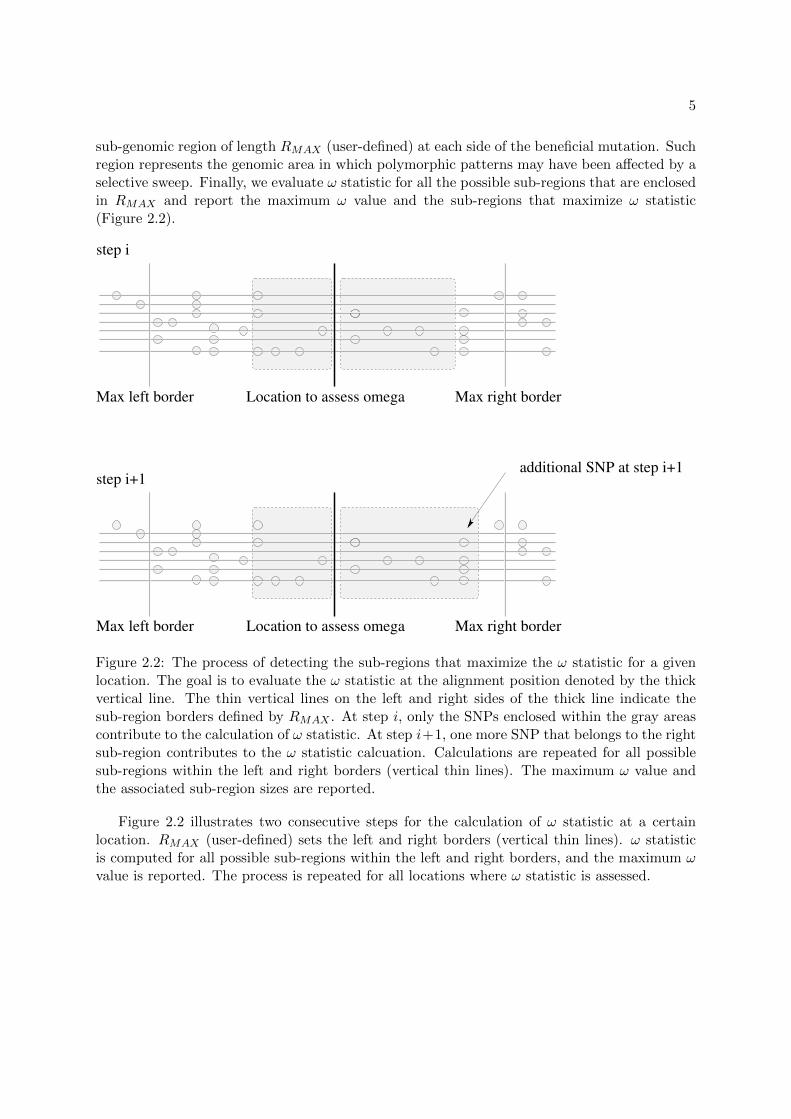
sub-genomic region of length RMAX (user-defined) at each side of the beneficial mutation. Suchregion represents the genomic area in which polymorphic patterns may have been affected by aselective sweep. Finally, we evaluate ω statistic for all the possible sub-regions that are enclosedin RMAX and report the maximum ω value and the sub-regions that maximize ω statistic(Figure 2.2).
Location to assess omegaMax left border Max right border
step i+1
Location to assess omegaMax left border Max right border
step i
additional SNP at step i+1
Figure 2.2: The process of detecting the sub-regions that maximize the ω statistic for a givenlocation. The goal is to evaluate the ω statistic at the alignment position denoted by the thickvertical line. The thin vertical lines on the left and right sides of the thick line indicate thesub-region borders defined by RMAX . At step i, only the SNPs enclosed within the gray areascontribute to the calculation of ω statistic. At step i+1, one more SNP that belongs to the rightsub-region contributes to the ω statistic calcuation. Calculations are repeated for all possiblesub-regions within the left and right borders (vertical thin lines). The maximum ω value andthe associated sub-region sizes are reported.
Figure 2.2 illustrates two consecutive steps for the calculation of ω statistic at a certainlocation. RMAX (user-defined) sets the left and right borders (vertical thin lines). ω statisticis computed for all possible sub-regions within the left and right borders, and the maximum ωvalue is reported. The process is repeated for all locations where ω statistic is assessed.


Chapter 3
Features
3.1 Command line options
Typing OmegaPlus -h or OmegaPlus -help the following help message is displayed:
OmegaPlus | OmegaPlus-F | OmegaPlus-C | OmegaPlus-M
-name runName
-input inputFile
-grid gridNumber
-minwin mininumWindow
-maxwin maximumWindow
[-length alignmentLength]
[-impute N|GAP]
[-seed randomSeed]
[-threads numberOfThreads]
[-binary]
[-h|-help]
[-all]
[-minsnps minimumNumber]
[-ld ldType]
[-b maxSNPdiff]
[-v|version]
-name Specifies a name for the run and the output files.
-input Specifies the name of the input alignment file.
Supported file formats: MS-like and MaCS-like for binary data and
FASTA for DNA data.
-grid Specifies the number of omegas to be computed in the alignment.
-minwin Specifies the minimum window to be used for computing linkage
disequilibrium values between SNPs.
7

8 CHAPTER 3. FEATURES
-maxwin Specifies the maximum window to be used for computing linkage
disequilibrium values between SNPs.
-length Specifies the alignment length. Required only for MS-like and
MaCS-like input files.
-impute Enables the random imputation of the following character (N or GAP)
to valid alphabet characters. To enable the imputation of both N
and GAP symbols use -impute twice.
-seed Specifies a seed to initialize the random number generator used for
the imputation of N and GAP symbols as well as the deduction of DNA
alignments to binary. Required with -impute and -binary.
-threads Specifies the number of threads. Required only by OmegaPlus-F or
OmegaPlus-C.
-binary Converts DNA alignments to binary format.
-h|-help Displays this help message.
-all Displays additional information in the result file.
-minsnps Specifies the minimum number of SNPs per sub-region to calculate
omega values.
-ld Specifies the type of linkage disequilibrium measurement.
Supported types:
RSQUARE - the r^2 which is the correlation coefficient between
a pair of sites (default)
D - the D statistic
ABSD - the absolute value of D
DOM - the D_omega statistic
ABSDOM - the absolute value of D_omega
ABSDOM2 - the absolute value of D_omega normalized by the
product of frequencies
-b <INTEGER> Enables approximate search for the best omega value per position:
the number of SNPs on the left and right windows does not differ
more than <INTEGER>.
-v|-version Displays version information.
3.2. INPUT FILE FORMATS 9
3.2 Input file formats
OmegaPlus can process alignment files containing DNA or binary data.
Supported file formats for DNA: FASTASupported file formats for BINARY: ms-like, MaCS-like
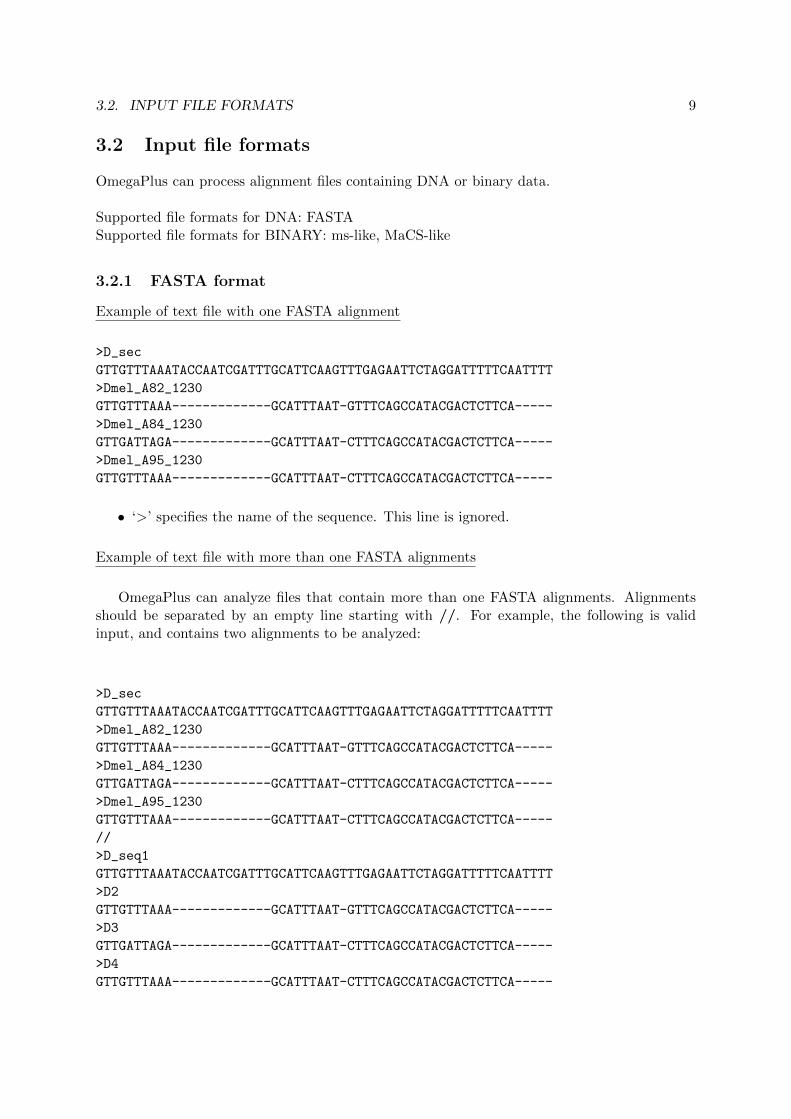
3.2.1 FASTA format
Example of text file with one FASTA alignment
>D_sec
GTTGTTTAAATACCAATCGATTTGCATTCAAGTTTGAGAATTCTAGGATTTTTCAATTTT
>Dmel_A82_1230
GTTGTTTAAA-------------GCATTTAAT-GTTTCAGCCATACGACTCTTCA-----
>Dmel_A84_1230
GTTGATTAGA-------------GCATTTAAT-CTTTCAGCCATACGACTCTTCA-----
>Dmel_A95_1230
GTTGTTTAAA-------------GCATTTAAT-CTTTCAGCCATACGACTCTTCA-----
• ‘>’ specifies the name of the sequence. This line is ignored.
Example of text file with more than one FASTA alignments
OmegaPlus can analyze files that contain more than one FASTA alignments. Alignmentsshould be separated by an empty line starting with //. For example, the following is validinput, and contains two alignments to be analyzed:
>D_sec
GTTGTTTAAATACCAATCGATTTGCATTCAAGTTTGAGAATTCTAGGATTTTTCAATTTT
>Dmel_A82_1230
GTTGTTTAAA-------------GCATTTAAT-GTTTCAGCCATACGACTCTTCA-----
>Dmel_A84_1230
GTTGATTAGA-------------GCATTTAAT-CTTTCAGCCATACGACTCTTCA-----
>Dmel_A95_1230
GTTGTTTAAA-------------GCATTTAAT-CTTTCAGCCATACGACTCTTCA-----
//
>D_seq1
GTTGTTTAAATACCAATCGATTTGCATTCAAGTTTGAGAATTCTAGGATTTTTCAATTTT
>D2
GTTGTTTAAA-------------GCATTTAAT-GTTTCAGCCATACGACTCTTCA-----
>D3
GTTGATTAGA-------------GCATTTAAT-CTTTCAGCCATACGACTCTTCA-----
>D4
GTTGTTTAAA-------------GCATTTAAT-CTTTCAGCCATACGACTCTTCA-----

10 CHAPTER 3. FEATURES
3.2.2 ms-like format
ms-like format matches the output format of the widely used ms software [Hudson, 2002] (hence-forth denoted as Hudson’s ms). Hudson’s ms implements coalescent simulations for variousdemographic scenarios. The software can be downloaded from https://webshare.uchicago.
edu/users/rhudson1/Public/ms.folder/ms.tar.gz. Hudson’s ms outputs binary data (0and 1) instead of DNA data (A, C, G, or T). This is because an infinite site model is imple-mented. Thus, each site in the alignment will contain maximum two states. State 0 correspondsto no mutation while state 1 is used when a mutation has occured. Usually, state 1 is called‘derived’ and state 0 is called ‘ancestral’. Note that, the ω statistic is independent of whichstate is the derived and which is the ancestral. This means that OmegaPlus results will beidentical if you just invert the 1’s and 0’s in a binary alignment. Hudson’s ms can output morethan one binary alignments in one file. These alignments are separated by //.
Example of ms-like file
ms 5 2 -t 3
53303 53650 13864
//
segsites: 6
positions: 0.4478 0.5128 0.5537 0.6123 0.7253 0.7368
000100
101010
010001
101000
101010
//
segsites: 4
positions: 0.0747 0.1319 0.4368 0.5681
0000
1100
0000
0010
0011
The above example contains two binary alignments. The first one consists of 6 segregatingsites while the second alignment of 4. The word ‘segsites’ defines the number of segregating sites.The word ‘positions’ denotes the relative positions of the segregating sites ranging from 0.0 to1.0. In other words, the entire simulated alignment is assumed to be of length 1. Therefore, theSNP positions appear as floating-point numbers between 0.0 and 1.0.
WARNING
Hudson’s ms outputs the relative positions using 4 decimal digits. This means that if yousimulate many SNPs, then several of them will be exactly at the same alignment position.

3.2. INPUT FILE FORMATS 11
This might create problems to the calculation of the ω statistic when your analysis containshundrends of thousands of SNPs.
To solve this problem, one can replace the line in ms.c that prints the positions of the SNPs:
• Open the ms.c file with your favorite editor. e.g. textpad, emacs, vim, gedit, . . .
• Find line: fprintf(pf,"%6.4lf ",posit[i] );. This should be around line 191.
• Replace this line with: fprintf(pf,"%e ",posit[i] );
• Compile ms.c using the command ./clms
3.2.3 MaCS-like format
MaCS [Chen et al., 2009] is a Markovian coalescent simulator. It is similar to Hudson’s msbut it only generates approximations of the ancestral recombination graph by assuming thatcoalescent has a Markovian property along the sequence. Thus, MaCS can be many ordersof magnitude faster than Hudson’s ms when the recombination rate between the ends of thesimulated regions is large (for example when whole chromosomes are simulated). On the otherhand, MaCS is less accurate than Hudson’s ms, especially when recombination values are small.
Example of MaCS-like file
COMMAND: macs 40 22422 -t 0.0001 -r 0.043 -h 5e4 -eN 0.036744 0.00204
-eN 0.0375 8.0 -eN 0.1395 1.5 -s 417790 -i 2
SEED: 417790
SITE: 0 1.197754e-1 1000000000000000000000000000000000000000
SITE: 1 0.232366639 0000000000000000100000000000000000000000
SITE: 2 0.244833485 0110110100011101011110000101110100010001
SITE: 3 0.30002599 0000000000000000000010000000000000000000
SITE: 4 0.878531842 1110000000100001000010000010011001100011
SITE: 5 0.914214234 1000010000100001000110001110010001110111
TOTAL_SAMPLES: 40
TOTAL_SITES: 6
BEGIN_SELECTED_SITES
0 1 2 3 4 5
END_SELECTED_SITES
SITE: 0 0.117200364 1100110000001010000001001001000000000000
SITE: 1 0.295165608 1000100000100001000011000001010000010001
SITE: 2 0.424410309 1110111100111111101111011010111011011011
SITE: 3 0.562284003 0000001000000100100000000000000000000000
SITE: 4 0.704560616 0000000010000000000000000000000000000000
TOTAL_SAMPLES: 40
TOTAL_SITES: 5
BEGIN_SELECTED_SITES
0 1 2 3 4
END_SELECTED_SITES

12 CHAPTER 3. FEATURES
OmegaPlus uses only the data in the lines that begin with the word ‘SITE:’. The MaCS-likeformat is similar to the ms-like format but the SNPs appear transposed. In MaCS files, a linerepresents a SNP. For example, line:SITE: 0 0.117200364 1100110000001010000001001001000000000000
represents the first SNP (SITE: 0) and the relative position of this SNP is 0.117200364.
File format recognition in OmegaPlus
• FASTA files are recognized from the symbol ‘>’.
• ms-like files are recognized from the //.
• FASTA files with more than one alignments are recognized from the // as well. The‘>’ symbol appears before // in FASTA files and therefore no confussion betweenms-like and FASTA files can occur.
• MaCS-like files are recognized from the word COMMAND:. Files with more than onealignments are recognized from: SITE: 0.
3.3 Output files
A single run of OmegaPlus outputs 3 files:
• an information file (OmegaPlus Info.runName), which contains information related to therun of the program (the command line for instance)
• a warning file (OmegaPlus Warnings.runName), which contains warnings about the inputfiles, and
• a report file (OmegaPlus Report.runName), which consists the main output file of theprogram (the score of the statistic at each position).
runName is the name of the run that is provided by the user via the -name argument.
3.3.1 Information file
The information file contains details related to the run of the program such as the commandline, the number of sequences and SNPs of the alignment, the number of non-polymorphic sitesthat were discarded, and the total run time of the program.Example:
_______________
OmegaPlus
_______________
3.3. OUTPUT FILES 13
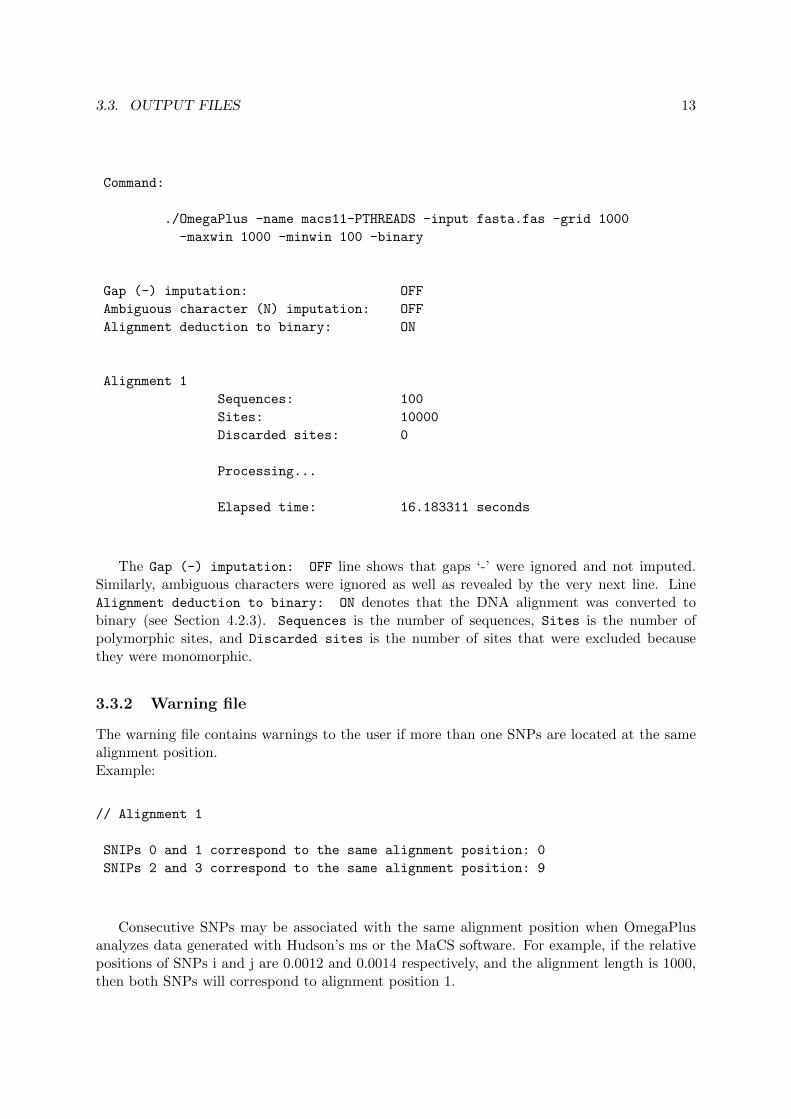
Command:
./OmegaPlus -name macs11-PTHREADS -input fasta.fas -grid 1000
-maxwin 1000 -minwin 100 -binary
Gap (-) imputation: OFF
Ambiguous character (N) imputation: OFF
Alignment deduction to binary: ON
Alignment 1
Sequences: 100
Sites: 10000
Discarded sites: 0
Processing...
Elapsed time: 16.183311 seconds
The Gap (-) imputation: OFF line shows that gaps ‘-’ were ignored and not imputed.Similarly, ambiguous characters were ignored as well as revealed by the very next line. LineAlignment deduction to binary: ON denotes that the DNA alignment was converted tobinary (see Section 4.2.3). Sequences is the number of sequences, Sites is the number ofpolymorphic sites, and Discarded sites is the number of sites that were excluded becausethey were monomorphic.
3.3.2 Warning file
The warning file contains warnings to the user if more than one SNPs are located at the samealignment position.Example:
// Alignment 1
SNIPs 0 and 1 correspond to the same alignment position: 0
SNIPs 2 and 3 correspond to the same alignment position: 9
Consecutive SNPs may be associated with the same alignment position when OmegaPlusanalyzes data generated with Hudson’s ms or the MaCS software. For example, if the relativepositions of SNPs i and j are 0.0012 and 0.0014 respectively, and the alignment length is 1000,then both SNPs will correspond to alignment position 1.

14 CHAPTER 3. FEATURES
If more than one SNPs correspond to the same alignment position,OmegaPlus results are NOT seriously affected.
Note however that, if big datasets (e.g. several thousands of SNPs) that have beengenerated by Hudson’s ms are analyzed, it is possible that a large number of SNPs willcorrespond to exactly the same alignment position (because of Hudson’s ms 4-digit relativeposition precision). This may cause problems and lead to significant deviations in theresults. (See warning in Subsection 3.2.2).
3.3.3 Report file
The report file consists the main output file of OmegaPlus. It can either be in a standard(reduced) or in an extendend form.
Standard report file form
For each alignment, the standard form report file contains:
1. the alignment positions where the ω statistic is calculated, and
2. the corresponding ω statistic value.
The columns are TAB delimited. Results from different alignments are separated by alignmentIndex,where alignmentIndex is the index of the alignment in the input text file (e.g. //1, //2, . . . )Example:
//1
0 0.000000
10 1.033204
20 1.017006
30 1.017818
40 1.017173
50 1.037558
60 1.031463
70 1.047257
80 1.042029
90 1.032714
100 1.014927
//2
0 0.000000
10 2.033204
20 0.090000
30 1.093874
40 4.938384
50 2.393837
60 3.031463
70 5.047257

3.3. OUTPUT FILES 15
80 0.042029
90 1.032714
100 1.014927
Extended report file form
To generate the extended report file form use the −all argument. In addition to the twocolumns present in the standard form, the extended form also contains:
1. the position of the left-most border of the left window.
2. the position of the right-most border of the right window.
3. a binary value that denotes whether the calculation of the ω statistic at the specificposition is valid or not.


Chapter 4
How to use OmegaPlus
4.1 Installation
OmegaPlus can run on Linux and Windows platforms.
4.1.1 Linux platforms
To compile the source code use one of the provided makefiles as follows:
make -f makefile
Valid ‘makefile’ input is:
• Makefile.gcc: Use this makefile to generate the sequential version (OmegaPlus).
• Makefile.PTHREADS.FINE.gcc: Use this makefile to generate the fine-grained parallelpthreads version (OmegaPlus-F).
• Makefile.PTHREADS.COARSE.gcc: Use this makefile to generate the coarse-grained par-allel pthreads version (OmegaPlus-C).
• Makefile.PTHREADS.MULTI.gcc: Use this makefile to generate the multi-grained parallelpthreads version (OmegaPlus-M).
4.1.2 Windows platforms
To compile the source code (only sequential verion of OmegaPlus available for Windows) youmay use any Windows C compiler as for example Microsoft Visual Studio. An executable file isprovided as well. Note that, we are developing OmegaPlus targeting Linux platforms thereforethe Windows version might not be as exhaustively optimized and thus not as fast as the Linuxcode.
4.2 Execution examples
OmegaPlus is a command-line tool. All supported command-line flags are provided in subsec-tion 3.1. In the following we provide some command-line examples.
17

18 CHAPTER 4. HOW TO USE OMEGAPLUS
4.2.1 Standard
DNA data
To carry out a typical DNA analysis, five input arguments are required: the input alignmentfile, the number of positions to assess the ω statistic at, a name for the run, and two argumentsto define the size of the genomic region around an omega position.Example:
./OmegaPlus -name test -input alignment.fas -minwin 100 -maxwin 1000 -grid 10000
This command line requires the computation of ω statistic at 10000 (-grid) positions along thealignment in the alignment.fas file (-input). The name of this run is ‘test’ (-name) and theminimum and maximum size of the regions around every omega position are 100 (-minwin) and1000 (-maxwin).
Binary data
In addition to the five basic arguments for DNA analyses, when binary data are used the lengthof the alignment must be also provided (-length).Example:
./OmegaPlus -name test2 -input ms.out -minwin 100 -maxwin 1000 -grid 10000 -length 2000000
4.2.2 Enable imputation
To enable imputation of gaps (-) or ambiguous characters, the -impute option can be used asfollows:
./OmegaPlus -name test -input alignment.fas -minwin 100 -maxwin 1000 -grid 10000
-impute N
or
./OmegaPlus -name test -input alignment.fas -minwin 100 -maxwin 1000 -grid 10000
-impute GAP
or
./OmegaPlus -name test -input alignment.fas -minwin 100 -maxwin 1000 -grid 10000
-impute all
4.2.3 Force binary deduction
To force the deduction of a DNA alignment to binary (for faster execution), the -binary optioncan be used as follows:
./OmegaPlus -name test -input alignment.fas -minwin 100 -maxwin 1000 -grid 10000
-binary

4.3. EXECUTION DETAILS 19
4.2.4 Enable omega search approximation
To enable an approximate search for the best omega value per grid position, the -b option canbe used as follows:
./OmegaPlus -name test -input alignment.fas -minwin 100 -maxwin 1000 -grid 10000
-b 10
Exhaustive search for the best omega value per grid position may result in left and right windowswith very different numbers of SNPs. The option -b < INTEGER > forces the number ofSNPs on the right window to be ± < INTEGER > the number of SNPs on the left window,i.e. #SNPsleft − INTEGER < #SNPsright < #SNPsleft + INTEGER. Effectively, thenumbers of SNPs on the left and right windows will be approximately the same. Using -b optionresults in 2 to 10 times faster code.
4.2.5 Deploy multiple threads
To deploy multiple threads for faster execution you can call the program as follows:
./OmegaPlus-F -name test -input alignment.fas -minwin 100 -maxwin 1000 -grid 10000
-threads 4
or
./OmegaPlus-C -name test -input ms.out -minwin 100 -maxwin 1000 -grid 10000
-threads 4
or
./OmegaPlus-M -name test -input ms.out -minwin 100 -maxwin 1000 -grid 10000
-threads 4
• Usually OmegaPlus-F analyzes DNA data faster than OmegaPlus-C.
• Usually OmegaPlus-C analyzes binary data faster than OmegaPlus-F.
• Most times OmegaPlus-M outperforms both OmegaPlus-F and OmegaPlus-C.
• OmegaPlus-F requires less memory than OmegaPlus-C and OmegaPlus-M.
4.3 Execution details
1. The -name option specifies a suffix for the output files. This is to avoid overwriting filesfrom previous analyses.
2. -minwin specifies the minimum size (number of bases) of the sub-region around a positionwhich will contribute to the calculation of ω statistic. Figure 4.1 illustrates the role of-minwin.

20 CHAPTER 4. HOW TO USE OMEGAPLUS
Location to assess omegaMax left border Max right border
minwin minwin
maxwin maxwin
Figure 4.1: The roles of -minwin and -maxwin. The user defines the length of -minwin(number of bases). This is the minimum region on the left or on the right of a given location thata sweep might affect. For example, for -minwin 1000, the SNPs located at least at a distance< 1000 bp (1000 bp on the right, and 1000 bp on the left) from each grid point will contributeto the calculation of ω value. In this figure, the first ω value that will be calculated (its positionis denoted as ‘location to assess omega’) will include 3 SNP positions on the left and 3 SNPpositions on the right. Subsequently, OmegaPlus will gradually include in the calculations allSNPs on the left and right sub-regions one after the other until the ‘Max left’ and ‘Max right’borders are reached. ‘Max left border’ and ‘Max right border’ are defined by the -maxwinflag. For this position, the highest ω value is reported.
3. -maxwin specifies the maximum size of a sub-region around a position which will con-tribute to the calculation of ω statistic. Figure 4.1 illustrates the role of -maxwin.
4. The -minwin argument affects the results a lot. Small values result in high ω values,whereas large values have the opposite effect. Small values may increase the false positivesand high values may increase the false negatives. In any case, you should use the samevalue of -minwin in both real-world and simulated datasets (to define a threshold value).
5. 2× MAXWIN is the largest area that a sweep might have affected. Increasing MAXWIN,increases memory and time requirements. For Drosophila for instance, we used somethinglike -maxwin 30000.
6. DNA analyses take approximately 16X more time compared to binary data (ms-like orMaCS-like). If your data are more or less consistent with the infinite site model (2 statesat each site maximum) you may want to use the -binary option to have OmegaPlusconvert DNA to binary internally.
7. -length denotes the length of the alignment. A length must be provided when the formatis ms-like or MaCS-like. Each SNP position is multiplied by the length to obtain thereal position of the SNPs in the alignment. When FASTA format data are analyzed the-length is not required.
8. -grid specifies the number of positions where the ω statistic will be calculated. The firstand last positions correspond to the first and last SNP positions respectively. Thus, thenumber of positions must be equal or greater than 2.

4.3. EXECUTION DETAILS 21
9. -input specifies the input file. This can be an ms-like file (produced by Hudson’s ms),a MaCS-like file (produced by the Markovian coalescent simulator MaCS [Chen et al.,2009]) or a FASTA format file with one more alignments per file separated by //.
10. Calculations on DNA data are based on formula (3) of [Zaykin et al., 2008]. We evaluatethe statistic T2:
T2 =(k − 1)(m− 1)
km
k∑i=1
m∑j=1
r2ij
k is the number of states at the first SNP, m the number of states at the second SNP, andrij the correlation coefficient between pairs of states in these two SNPs. To calculate T2
we need km operations for DNA data. On the other hand, we need only 1 operation forbinary data. If there are 4 nucleotides in the first SNP and 4 in the second, then we need16 times more operations for DNA data than binary. Therefore, if the vast majority ofSNPs contains only two states, or if the remaining states are in very low frequency, theuser can enable the deduction of DNA to binary with the -binary flag. Conversion ofDNA data to binary is a non-deterministic process. The states are divided into ‘major’and ‘minor’. Major states are the two most frequent states whereas we denote as ‘minor’the rest. The probability of replacing a minor state with a major state is proportional tothe frequency of the major state.
11. By default, OmegaPlus ignores gaps (‘-’) and ambiguous characters. Alternatively, youcan choose the -impute option to replace either gaps or ambiguity characters with anothercharacter from the column. The replacement is probabilistic (proportional to the frequencyof the states of the column). When -impute or -binary is used, a seed (-seed) is requiredto generate random numbers for the replacement of the states.
12. OmegaPlus implements several linkage disequilibrium measurements between two SNPs.The r2 is used by default. If there are two states at each site, for example 1 and 0, r2 isdefined as folows:
r2 =(p11 − p1q1)
2
p1q1(1− p1)(1− q1)
p11 is the frequency of ‘11’ pairs, p1 is the frequency of 1s at the first site, and q1 is thefrequency of 1s at the second site. The numerator (p11 − p1q1) is also known as D. Thedenominator Q = p1q1(1− p1)(1− q1) normalizes r2 such as to obtain values in [0, 1]. Inaddition to r2 (default, RSQUARE) OmegaPlus can calculate D (D), |D| (ABSD), Dω
(DOM) [Langley and Crow, 1974], |Dω/Q| (ABSDOM2), and |Dω| (ABSDOM).


Bibliography
Gary K Chen, Paul Marjoram, and Jeffrey D Wall. Fast and flexible simulation of dna sequencedata. Genome Res, 19(1):136–142, Jan 2009. doi: 10.1101/gr.083634.108. URL http://dx.
doi.org/10.1101/gr.083634.108.
Richard R Hudson. Generating samples under a wright-fisher neutral model of genetic variation.Bioinformatics, 18(2):337–338, Feb 2002.
Yuseob Kim and Rasmus Nielsen. Linkage disequilibrium as a signature of selective sweeps.Genetics, 167(3):1513–1524, Jul 2004. doi: 10.1534/genetics.103.025387. URL http://dx.
doi.org/10.1534/genetics.103.025387.
C. H. Langley and J. F. Crow. The direction of linkage disequilibrium. Genetics, 78(3):937–941,Nov 1974.
Pavlos Pavlidis, Jeffrey D Jensen, and Wolfgang Stephan. Searching for footprints of posi-tive selection in whole-genome snp data from nonequilibrium populations. Genetics, 185(3):907–922, Jul 2010. doi: 10.1534/genetics.110.116459. URL http://dx.doi.org/10.1534/
genetics.110.116459.
Dmitri V Zaykin, Alexander Pudovkin, and Bruce S Weir. Correlation-based inference forlinkage disequilibrium with multiple alleles. Genetics, 180(1):533–545, Sep 2008. doi: 10.1534/genetics.108.089409. URL http://dx.doi.org/10.1534/genetics.108.089409.
23