omnilink - demand transdemandtrans.com/wp-content/uploads/2017/04/bruun_omnilink.pdf · omnilink...
TRANSCRIPT

Potomac and Rappahannock Transportation Commission’s OmniLinkis an intelligent transportation system (ITS) assisted, hybrid public trans-portation service that permits flexible routing combined with the timepoints of conventional fixed-route services. OmniLink promotes main-streaming of a significant portion of the disabled population eligible forparatransit under the Americans with Disabilities Act (ADA) whilereducing the cost of accommodating these passengers. State-of-the-artITS technology is used to accommodate passenger requests for off-routetrips (route deviations). It gives an accept or reject decision to call-takerswhile the caller is on the phone; schedules all pickups and drop-offs;provides dispatcher oversight; conveys on-time performance and com-municates all other relevant information between drivers and the controlcenter; and incorporates passenger counting, navigation assistance tothe operator, vehicle inspection documentation, and other utilities. TheITS package includes full post-processing capability to support serviceanalysis and optimization. Initial service began in 1995, but full ITSfunctionality was achieved only in 2003 after the second procurementattempt. The identified monetary benefits exceed monetary costs by a widemargin. This success can be attributed to more mature technologies, aturnkey project contract model, and refined, firm specifications based onboth practical and academic experience. ITS configurations similar toOmniLink’s have the potential to solve several common bus transporta-tion problems in lower-demand areas. Examples of benefits include for-going or reducing ADA paratransit costs, substituting for large buses atnight, serving pedestrian-unfriendly streets, and probing for demand inpreviously unserved areas.
Potomac and Rappahannock Transportation Commission (PRTC)serves Prince William and Stafford Counties and the cities ofManassas, Manassas Park, and Fredericksburg, Virginia. PRTC oper-ates OmniRide and OmniLink bus services and Virginia RailwayExpress (VRE) commuter rail services. PRTC’s primary market isweekday commuters to central Washington, D.C., the Pentagon, andother major traffic generators. The commission is also responsiblefor intracounty transit services. Whereas VRE serves all five PRTCjurisdictions, bus service is operated only in the eastern Prince WilliamCounty and Manassas areas. Figure 1 is a system map of PRTC busservices.
In the early 1990s, PRTC studied a proposed intracounty servicearea that had no regular transit service, only demand-responsivetransportation provided by human service agencies. The gross densityof eastern Prince William County was about 2,700 persons per squaremile at the time of the original service design, with the overall servicearea having a density of less than three persons per acre (1). Devel-opment continues to expand into new areas. Most of the local busservice area was built up in the post–World War II style of numerouslooping roads, cul-de-sacs, residential areas without sidewalks, andlarge arterials that can be difficult for pedestrians to cross.
At about the same time, the FTA had an Intelligent TransportationSystem (ITS) Operational Test Grant program. In 1993, PRTC plan-ners submitted a proposal for one of these grants. The proposal calledfor an innovative service that could address the needs of riders eligibleunder the Americans with Disabilities Act (ADA) for complementaryparatransit, as well as other unmet service needs. The FTA awardedPRTC a grant for procurement, testing, and evaluation of the ITS.
The study eventually resulted in what is now known as OmniLink.The service design principle is to create fixed time points, as with aconventional route; to locate other fixed stops between them sparingly;and to allow off-route pickups and drop-offs between all stops. Thebus operator need not return to the route at the point at which the busdeparted the route. The concept is shown schematically in Figure 2.Some slack is added to the schedule to facilitate deviations. If devi-ations are not made, the driver is instructed to slow down or to holdat time points.
The number of minutes of slack varies by route and time of day.On average, about 10 extra minutes are built in. When PRTC started,its rough rule of thumb was a 25% cushion between time points. Thisamount is adjusted based on ongoing operating statistics.
There are currently five such “flex routes” or “route-deviation ser-vices”: two in the western Prince William/Manassas area and threein eastern Prince William County. The former operate hourly onweekdays. The latter three use a timed-transfer, or pulse system, atPRTC’s Transit Center and operate on 45-min headways on weekdays(every 90 min on Saturdays). A map of one of the routes is shownin Figure 3. The deviation corridor is 3⁄4 mi on both sides of eachroute. Buses 30 ft (9 m) long are used, to maneuver off the mainarterials.
ITS PROCUREMENT: FIRST TRIAL
OmniLink services began in April 1995 using conventional manualdispatching and manual call-taking for off-route trip requests. In thebeginning, reservations required 24-h notice because call-backswere needed to confirm pickup and drop-off times and locations. In
OmniLinkCase Study of Successful Flex Route–Capable Intelligent Transportation System Implementation
Eric Bruun and Eric Marx
E. Bruun, Delta Services Group, 930 South 49th Street, Philadelphia, PA 19143.E. Marx, Potomac and Rappahannock Transportation Commission, 14700 PotomacMills Road, Woodbridge, VA 22192.
91
Transportation Research Record: Journal of the Transportation Research Board,No. 1971, Transportation Research Board of the National Academies, Washington,D.C., 2006, pp. 91–98.

92 Transportation Research Record 1971
FIGURE 1 PRTC bus service system map.

Bruun and Marx 93
late 1997 the first component of the ITS system, the flex-route call-taking and trip reservation system, was implemented. This systemprovided automated trip booking that allowed confirmation of timesand locations while the caller was still on the phone and providedthe means to routinely accommodate trip requests up to 2 h beforedeparture time.
During this period, the true “high technology” elements of the ITSproject were being developed and tested. The system was designedto perform several functions: assist both customer service agents anddispatchers with the acceptance or rejection decision process; providethe dispatcher with up-to-date location information for each vehiclevia Global Positioning System equipment; and automatically updateand transmit manifest information to drivers through a mobile dataterminal (MDT).
The MDT performs several important functions, including relievingthe bus operator and dispatcher of the burden of voice communica-tion for routine information; relieving the operators of the need toupdate paper manifests by providing up-to-the-minute information;monitoring schedule adherence for the benefit of the operator; andtransmitting the entire time and location record for each stoppingevent and each block of work performed by the vehicle to the dataarchives, for use in planning analysis and dispute resolution.
By mid-1998, full integration of the prototype ITS seemed immi-nent, but the system’s performance had never been fully satisfactory.
dropoff
pickup
fixed stop
FIGURE 2 Flex-route concept.
SCALE
= 3⁄4 mile
FIGURE 3 Sample route showing flex-route boundaries.

Several chronic problems existed, perhaps the most important ofwhich was an unwieldy project management structure. The systemdesign required significant refinement and fine tuning because of thefirst-time nature of its implementation. However, there was no clearway to assess the responsibility of individual contractors for makingchanges or meeting timelines; the firm hired by PRTC to manage theproject was not connected contractually to the companies developingthe systems. Another problem was that PRTC did not have access toa municipal radio system. An awkward private radio system wasused for voice and data communication. In summer 1998, the radioservice provider went out of business, and the operations departmenthad no choice but to cease integration and testing efforts. At the sametime PRTC—which contracts all transportation services—switchedproviders, and needed to focus significant attention on monitoring andimproving on-street operations. This resulted in an approximately3-year hiatus, during which there was little project advancement.
An evaluation of service improvements to the public, and of anybenefits and cost savings to PRTC, was to have been conducted aspart of the ITS Operational Test, once testing and implementation werecomplete for the first trial of ITS in revenue service. This evaluationhad to be deferred because full functionality had not been achieved,but an independent evaluation of the partial system was conducted(2). The report of the partial evaluation gives further details aboutthe ITS developed on the first trial and about the role the projectmanagement structure played in the outcome.
ITS PROCUREMENT: SECOND TRIAL
As a result of their several years of experience, PRTC had made greatstrides toward perfecting flex-route operations without the benefit ofITS. In 2001, PRTC was ready to prepare specifications and procurea new ITS system. But this time, there were several advantages. First,PRTC had a firm conception of how the system should function,so their technical consultants could prepare a precise performancespecification. Second, the technology for computer-aided dispatchingand automatic vehicle location (CAD/AVL) had matured. Third, andperhaps most important, was the use of a turnkey approach in whichthe technical management firm had subcontracts with the systemdevelopment companies, eliminating many of the subcontractorcoordination issues that arose in the first attempt.
The ITS that currently supports OmniLink was designed specificallyfor this precise application, but with the intention that it would notbe an orphan system but would contain features of interest to othertransit agencies. In this way, vendors would have an ongoing incen-tive to support and improve their components. Features include fullCAD/AVL capability. All vehicles can be tracked on or off route,and warning flags can be generated automatically using dispatcher-selectable parameters. Vehicles that are x minutes behind or y minutesahead of schedule at the last time point or off-route trip address, orare projected to be more than z minutes late, are typically selected. Allvehicles also are equipped with a covert alarm. When an alarm isactivated, it appears on the dispatcher screen and produces an audiblesiren until cleared. The polling rate for vehicle location is reducedto every few seconds, instead of every 60 s.
Customer service agents enter off-route trip requests into thescheduling software. Using the software, they can decide to accept,reject, or select alternatives for the requested trip while the customeris on the telephone line. Requests for cancellations made while thevehicle is on-route are readily accommodated, with the cancellationappearing on the updated manifest. On occasion, new requests are also
94 Transportation Research Record 1971
accommodated in near real-time, but this requires discussion betweenthe dispatcher and customer service agents. Customers who have apoor record of no-shows or cancellations can also be identified.
Bus operators, using a flat-panel, touch-screen computer display,exchange information with the control center on the latest generationof MDT. The MDT is particularly important for operating a flex-routesystem because schedule adherence must be monitored and the man-ifest is updated continually. The manifest on the MDT is updatedautomatically, with executed activities scrolling off the top of thescreen and future activities entering the bottom. Figure 4 shows thetypes of activities transmitted to the manifest. At fixed stops, detectionof arrival and departure is fully automatic within a user-definablerange. Communications are often sent via predefined data messages(for example, “no-show”). At off-route trip locations, the operatormust either push a button when departing or ask for permission todepart if there is a no-show. In this way the system operates similarlyto many fully demand-responsive systems. Voice communicationsare possible when desired, but are usually minimal.
Log-on to the CAD/AVL system requires a user ID. At the begin-ning of the service day, a vehicle inspection check-off screen mustbe filled out before the first run can be started. There is an optionalscreen to enter passenger counts by type of fare and type of mobilitydevice (if any). A sample screen is shown in Figure 5. This can beused on days designated for passenger-count sampling.
The importance of the capability for showing directional instruc-tions on an electronic map was not understood during the trial of ITSprocurement. Turnover of bus operators would prove to be high, andnew operators tended to get lost frequently, significantly degradingon-time performance and system reliability. (This is no longer an issueat PRTC.) With the push of a button, a map can appear that orientsthe front of the bus toward the top of the screen. The recommendedinstructions on where to turn are then easy to follow.
Rare for a CAD/AVL system installed in North America, the PRTCsystem includes a postprocessing software package that can be usedfor service planning. Other agencies historically had to develop theirown software at significant expense, or made limited use of their
FIGURE 4 Features of flex-route manifest: first fixed-route stop(F); one pickup (P), off-route trip; one time point (T), fixed-routestop; one drop-off (D), off-route trip. The initial manifestconfiguration was for a maximum of 10 activities; the currentconfiguration is for up to 20 activities.

archived data. Using the PRTC software package, a transit plannerwithout special programming or database expertise can request aver-age and standard deviations of running times between time points,averages and standard deviations of passenger counts between seg-ments, boarding and alighting counts, numbers and types of passengersneeding mobility aids, and so on. This level of information, althoughdesirable for any operation, is of particular value for flex services. Thesystem can be used to optimize slack times and deviation acceptancerules, to select fixed stops, to identify bottlenecks that cause recurringdelays, and to gather other data for planning route improvements.
The new CAD/AVL system has been in revenue service sinceMarch 2003. In the testing period and during the first months ofoperation, it experienced a few reliability problems, some caused bymechanical connections and excessive internal vibration. The MDTwas located directly over the forward engine compartment in busesthat have recently been retired. Now the engine is in the rear, and thereare no longer problems with heat and vibration. The MDT is nowalmost always accessible and, on the basis of feedback from operators,it has been well accepted by all of them.
The communications system has needed changing again. With thephasing out of cellular digital package data by the incumbent phonecompany, the General Packet Radio Service system is now used forcommunications. In theory, only the modem within the MDT had tobe changed, but the opportunity was taken to install an even moreadvanced processor and to separate the processor and modem fromthe MDT screen, thus eliminating the potential connection problemsdescribed earlier.
The Washington, D.C.–area transit agencies are in the process ofinstalling a region-wide smart farebox system, and PRTC expects totake delivery of its boxes in 2006. Log-on to this device will be mergedwith the MDT. The farebox will receive locational information toappend to its database, to analyze ridership patterns and eliminatebus operator duplication of data entry.
FINANCIAL PERFORMANCE
Figure 6 shows a daily ridership history for all five routes. It has hada steady upward trend. There were about 667,000 rides in FY 2005.On the basis of the results from the first half of the year, ridership willexceed 700,000 in FY 2006. The slight downward turn in FY 2004
Bruun and Marx 95
was not due to any service deterioration related to ITS implementa-tion. Rather, it was the result of a work stoppage by operators of anincoming contract management firm; a fare increase; and some dataerrors due to manual data processing difficulties, as the ITS-assistedservice began without the postprocessing module in place. The sub-stantial increase in patronage that took place in FY 2001 was due toexpanded hours of operation. Before July 2000, service operated from7:30 a.m. to 6:00 p.m.; beginning in July 2000, service expanded to5:30 a.m. to 10:45 p.m., although headways were doubled for mostadditional hours.
The fare was increased from $0.75 to $1.00 in October 2003, andtransfers were eliminated. Compensating somewhat was the institutionof a $2.25 all-day pass. Also recently implemented was an additionalcharge of $1.00 for off-route trips. The double fare was not institutedto maximize revenue that can legally be collected under the ADA, asit does not apply to the elderly or the disabled. Rather, it was institutedto encourage able-bodied users to walk to a bus stop. While devia-tions were not being abused, both passengers and bus operators werefrustrated by customers who could walk to the bus stop but chose torequest that the bus come closer. Few complaints were received afterthe surcharge was implemented, and the change has had the desiredeffect of providing more off-route capability for those who need it most(elderly, disabled, those who truly have a long walk, etc.). Personswho are capable and feel secure doing so tend to walk to the neareststop. In FY 2003 about 10.1% of riders requested deviations, and about7.9% were actual riders. The difference was due to cancellations,no-shows, and the occasional rejected offer of accommodation. Afterthe fare increase, the corresponding figures dropped to 8.1% and6.5%. The route can be readjusted in accordance with demand, ifdeviations prove to be concentrated at particular locations.
As shown in Figure 7, this service has a respectable average pro-ductivity given the low density of the operating area and the long
FIGURE 5 Boarding and alighting count screen.
0500
100015002000250030003500
Tri
ps
FY
95
FY
97
FY
99
FY
01
FY
03
FY
05
Year
FIGURE 6 Ridership history of OmniLink (3).
0.02.04.06.08.0
10.012.014.016.0
Tri
ps
FY
95
FY
97
FY
99
FY
01
FY
03
FY
05
Year
FIGURE 7 Productivity history of OmniLink (3).

headways. Average passengers per vehicle service hour across allfive routes have ranged from 12 to 14 passengers per hour the pastthree fiscal years. As of the first half of FY 2006, the figure hasclimbed to more than 15 passengers per hour. The averages wouldno doubt be somewhat lower if the service operated on Sundays. Itis interesting to note that productivity actually increased when servicehours were expanded—an indication of how much latent demandexisted. The productivity loss in FY 2004 is another manifestationof the strike and the fare increase, but it has recovered in the currentfiscal year.
Due to demographics and operating environment, the three easternroutes perform significantly better than those to the west (17 passen-gers per hour versus eight for FY 2005). Specifically, the density islower in the Manassas area. That area is also bisected by a majorroadway with as many as nine through and turn lanes to cross, makingit less pedestrian friendly and increasing running times for off-routeservice. Additionally, headways are longer at 1 h, even in the peakperiod, and they do not pulse as they do on the eastern side.
The OmniLink budget was approximately $3.5 million in FY 2005.The operating cost per hour for the current fleet of 30-ft-long midibusesis about $84 per revenue hour in FY 2006, and the farebox recoveryratio is about 12% (15% in the east and 7% in the west). But the costcannot be compared directly with costs of other public agencies in theNational Transit Database because OmniLink is a contracted oper-ation. A few minor additional overhead and supply costs are borneby PRTC as joint costs with their other operations and therefore arenot included in this estimate. Note also that the revenue hour cost isthe same for all PRTC services, about 60% of which are commuterexpress trips with around 50% deadhead time.
BENEFIT-VERSUS-COST ANALYSIS
PRTC was awarded a one-time competitive grant from the FTA ofapproximately $1.3 million for the first trial of ITS procurement. Itwould not have been economical for PRTC to pay the entire ITSdevelopment cost itself, because the costs would have been spreadover too small a fleet. However, the second trial was fully funded byPRTC and state of Virginia funds at an additional one-time capitalcost of about $500,000. This was sufficient to develop the new sys-tem and equip 19 vehicles, plus spares, training equipment, and onedispatcher workstation.
It is not possible to do a precise cost-versus-benefit calculation forthe implementation of the ITS-assisted version of OmniLink. PRTCis a moderate-size agency, in which IT support, maintenance, planningstaff, and management all have multiple responsibilities among thevarious operations. The best estimate is that 20% of one person’s timemust be dedicated to administering the ITS, and 3 h of training areneeded for new bus operators. The additional annual labor by elec-tronics technicians and mechanics on board buses has not requiredadditional staff. The best estimate for the value of time used by seniorstaff during the specification, procurement, and project oversightphases is a total of 1 person-year among several individuals, for afully loaded one-time cost of $200,000. The consulting contracts forassistance in specification, procurement, and project oversight totaled$60,000. The CAD/AVL life is estimated at 12 years, or about thesame as the buses. At a minimum allowable rate of return of 7%, theamortization is about $63,000 per year. Similarly, the senior staffcosts can be amortized with the same interest rate and system life at$25,000 per year and the consultant costs at $7,500 per year. Added
96 Transportation Research Record 1971
to these is the software and hardware service contract of about$25,000 per year.
The number of dispatchers is unchanged between fixed-route andflex-route operations. A case could be made that the cost of customerservice agents should be included because they are not required fortraditional fixed-route services. However, doing so would probablyoverstate the cost. First, most agencies need people to provide cus-tomer information. The ITS has improved the productivity of thecustomer service agents who take reservations to the degree that theycan perform the customer information role as well. Second, shouldPRTC have chosen to provide pure demand-responsive ADA para-transit instead, it may well have had to hire customer service agents,or pay an additional fee to the contracted operating firm to provide it.
Balancing these liabilities is the obviation of the need for ADAparatransit. A close estimate of the ADA-eligible demand using puredemand-responsive paratransit would require a separate researcheffort, but a reasonable range can be estimated. Given a 2004 pop-ulation in the OmniLink service area (Prince William County) of336,000 persons (4), a low estimate of monthly demand would be2,000 riders and a high estimate would be 4,000 riders per month.These compare with an average of about 4,375 off-route deviationrequests per month based on the current request rate of roughly 7% (3)of all trips, but this also includes an uncertain, but relatively lownumber of able-bodied people. Based on the productivity of theadjacent demand-responsive services provided under contract to theWashington Metropolitan Area Transit Authority (WMATA) of about1.5 riders per vehicle-hour and WMATA’s corresponding fully allo-cated cost of $54 per contracted vehicle-hour (5), the avoided costwould range from $840,000 to $1.68 million per year.
Also contributing to the offset is the obviation of the need for man-ual passenger counts, travel time analyses, National Transit Databasestatistics, and other tasks performed automatically by the ITS. Thisis estimated to save about 1 person-year annually, at a fully loadedcost of $100,000.
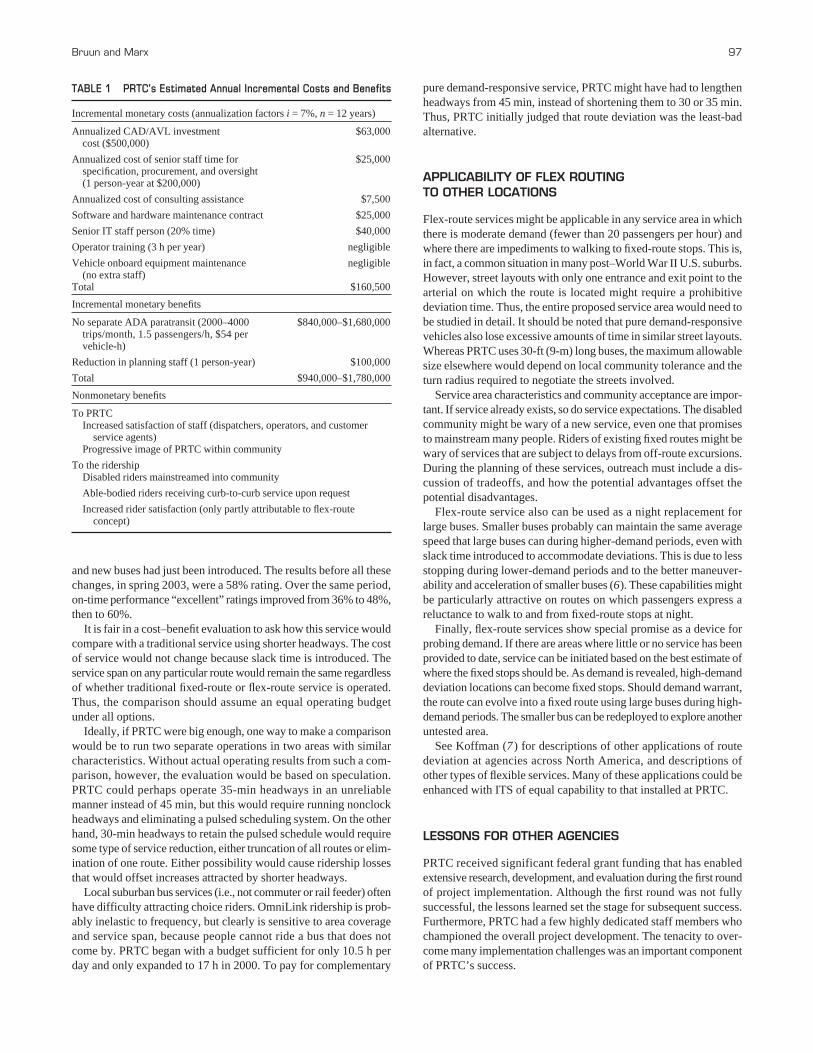
The cost-versus-benefit accounting is summarized in Table 1.Based strictly on monetary costs versus benefits, the ITS far morethan covers its expenses when all annualized costs and benefits aresummed algebraically. The results are compelling, even when the min-imal ADA-eligible demand is assumed. An additional $840,000to $1.68 million per year added to $3.5 million would be a majorincrease in operating costs, almost 50% more if the higher demandis assumed. The results are also robust, because even major errors incost assumptions would not close the gap between benefits and costs.
The nonmonetary benefits also must be added. There are significantbenefits both to the agency and the ridership.
The quality of life of the bus operators, dispatchers, and customerservice agents has improved at PRTC. This probably contributes to thelower turnover of staff once ITS became operational. OmniLink hasalso presented an image of PRTC as a progressive, technologicallyadvanced transit agency to the community.
Certainly, those people who have been mainstreamed into societywith this service, or who have otherwise needed the deviations, havebenefited, although this cannot readily be translated into monetaryterms. It does not appear that the extra time needed for the devia-tions has decreased satisfaction by the rest of the riders, either. PRTCperforms random on-board surveys three times per year. The surveyconducted in September 2005 resulted in 82% of riders rating over-all service quality “excellent.” The previous year, satisfaction was72%. It should be noted that although this was about 1 year into ITS-assisted operations, the ITS cannot take all the credit. Driver stabil-ity had improved substantially following a new operating contract,
and new buses had just been introduced. The results before all thesechanges, in spring 2003, were a 58% rating. Over the same period,on-time performance “excellent” ratings improved from 36% to 48%,then to 60%.
It is fair in a cost–benefit evaluation to ask how this service wouldcompare with a traditional service using shorter headways. The costof service would not change because slack time is introduced. Theservice span on any particular route would remain the same regardlessof whether traditional fixed-route or flex-route service is operated.Thus, the comparison should assume an equal operating budgetunder all options.
Ideally, if PRTC were big enough, one way to make a comparisonwould be to run two separate operations in two areas with similarcharacteristics. Without actual operating results from such a com-parison, however, the evaluation would be based on speculation.PRTC could perhaps operate 35-min headways in an unreliablemanner instead of 45 min, but this would require running nonclockheadways and eliminating a pulsed scheduling system. On the otherhand, 30-min headways to retain the pulsed schedule would requiresome type of service reduction, either truncation of all routes or elim-ination of one route. Either possibility would cause ridership lossesthat would offset increases attracted by shorter headways.
Local suburban bus services (i.e., not commuter or rail feeder) oftenhave difficulty attracting choice riders. OmniLink ridership is prob-ably inelastic to frequency, but clearly is sensitive to area coverageand service span, because people cannot ride a bus that does notcome by. PRTC began with a budget sufficient for only 10.5 h perday and only expanded to 17 h in 2000. To pay for complementary
Bruun and Marx 97
pure demand-responsive service, PRTC might have had to lengthenheadways from 45 min, instead of shortening them to 30 or 35 min.Thus, PRTC initially judged that route deviation was the least-badalternative.
APPLICABILITY OF FLEX ROUTING TO OTHER LOCATIONS
Flex-route services might be applicable in any service area in whichthere is moderate demand (fewer than 20 passengers per hour) andwhere there are impediments to walking to fixed-route stops. This is,in fact, a common situation in many post–World War II U.S. suburbs.However, street layouts with only one entrance and exit point to thearterial on which the route is located might require a prohibitivedeviation time. Thus, the entire proposed service area would need tobe studied in detail. It should be noted that pure demand-responsivevehicles also lose excessive amounts of time in similar street layouts.Whereas PRTC uses 30-ft (9-m) long buses, the maximum allowablesize elsewhere would depend on local community tolerance and theturn radius required to negotiate the streets involved.
Service area characteristics and community acceptance are impor-tant. If service already exists, so do service expectations. The disabledcommunity might be wary of a new service, even one that promisesto mainstream many people. Riders of existing fixed routes might bewary of services that are subject to delays from off-route excursions.During the planning of these services, outreach must include a dis-cussion of tradeoffs, and how the potential advantages offset thepotential disadvantages.
Flex-route service also can be used as a night replacement forlarge buses. Smaller buses probably can maintain the same averagespeed that large buses can during higher-demand periods, even withslack time introduced to accommodate deviations. This is due to lessstopping during lower-demand periods and to the better maneuver-ability and acceleration of smaller buses (6). These capabilities mightbe particularly attractive on routes on which passengers express areluctance to walk to and from fixed-route stops at night.
Finally, flex-route services show special promise as a device forprobing demand. If there are areas where little or no service has beenprovided to date, service can be initiated based on the best estimate ofwhere the fixed stops should be. As demand is revealed, high-demanddeviation locations can become fixed stops. Should demand warrant,the route can evolve into a fixed route using large buses during high-demand periods. The smaller bus can be redeployed to explore anotheruntested area.
See Koffman (7 ) for descriptions of other applications of routedeviation at agencies across North America, and descriptions ofother types of flexible services. Many of these applications could beenhanced with ITS of equal capability to that installed at PRTC.
LESSONS FOR OTHER AGENCIES
PRTC received significant federal grant funding that has enabledextensive research, development, and evaluation during the first roundof project implementation. Although the first round was not fullysuccessful, the lessons learned set the stage for subsequent success.Furthermore, PRTC had a few highly dedicated staff members whochampioned the overall project development. The tenacity to over-come many implementation challenges was an important componentof PRTC’s success.
TABLE 1 PRTC’s Estimated Annual Incremental Costs and Benefits
Incremental monetary costs (annualization factors i = 7%, n = 12 years)
Annualized CAD/AVL investment $63,000cost ($500,000)
Annualized cost of senior staff time for $25,000specification, procurement, and oversight(1 person-year at $200,000)
Annualized cost of consulting assistance $7,500
Software and hardware maintenance contract $25,000
Senior IT staff person (20% time) $40,000
Operator training (3 h per year) negligible
Vehicle onboard equipment maintenance negligible(no extra staff)
Total $160,500
Incremental monetary benefits
No separate ADA paratransit (2000–4000 $840,000–$1,680,000trips/month, 1.5 passengers/h, $54 pervehicle-h)
Reduction in planning staff (1 person-year) $100,000
Total $940,000–$1,780,000
Nonmonetary benefits
To PRTCIncreased satisfaction of staff (dispatchers, operators, and customer
service agents)Progressive image of PRTC within community
To the ridershipDisabled riders mainstreamed into community
Able-bodied riders receiving curb-to-curb service upon request
Increased rider satisfaction (only partly attributable to flex-route concept)
Ultimately, this FTA ITS Operational Test Grant must be consid-ered a success. As a result of one agency’s pioneering effort, an ITS-assisted flex-route implementation will cost less to the next agency.The specifications for a CAD/AVL system that is field tested andreliable are now available as a starting point to follow-on transitagencies. Modifications to the specifications should be limited, asthese can increase project risk and will require vendors to price usinga risk premium.
The $500,000 capital investment in the second trial was reducedsubstantially from the first trial. There is every reason to expect thatcosts can be reduced substantially even further. With mass production,hardware costs will decrease. The system integration will be morestraightforward at other agencies now that many questions requiringtesting have been answered and open architecture hardware–softwareinterfaces are becoming the norm. The largest uncertainty is in thefuture of the scheduling and call-taking software. As of this writing,there are at most two vendors in North America offering suitablesoftware with flex-route capability.
It is best to include the postprocessing package in the initial spec-ification. Once it has been developed for one agency, it makes sensefor other agencies to order something similar. The costs to developsuch a package in-house or to hire a third party to develop such apackage would, no doubt, be much higher.
This paper mentioned that using a turnkey procurement was believedto be central to successful implementation. This needs some elabo-ration. The selected firm should have a project manager who acts asa single point of contact and who keeps abreast of all subcontractors’work. All timetables for achieving key milestones and for resolvingaction items should be reached in mutual consultation with agencystaff. In this way, realistic rates of progress are maintained and ten-sion is minimized. The contract with this firm should have a liquidateddamages clause or some other incentive toward project completion.The contract should specify that all subcontractors also have an incen-tive structure. Although this requirement might appear to the primesubcontractor to be interference, the transit agency can reduce itsrisk substantially. Subcontractors have the potential to disrupt eventhe best-laid plans and intentions of a prime contractor. In the end,a transit agency should still allow for project delays with generousinstallation and testing schedules. There are always unforeseendelays, some of which may be beyond the control of either agencyor contracting firm.
The entire CAD/AVL system combined with the hybrid schedulingsoftware would qualify as a capital investment item rather than anoperating expenditure. However, there will be ongoing maintenanceand support costs. Whether it is necessary to hire additional staff forhardware maintenance and IT support will depend on the agency.An additional person was not required at PRTC, but it was neces-sary to raise the knowledge level required of the IT support staff andmaintenance staff.
The total time involved in project management and developmentfrom staff during the specification, procurement, and implementa-tion phases can be substantial. Allowances should be made in staffwork responsibilities and annual staff budgets until the ITS becomesoperational and used routinely.
PRTC was able to use a stand-alone system because it did not haveseparate paratransit and fixed-route divisions. However, many transitagencies have separate CAD/AVL systems in place. At agencies withexisting demand-responsive CAD/AVL, the supporting IT infrastruc-ture and software must be adapted to receive the full benefits of a
98 Transportation Research Record 1971
flex-route system. Specifically, to make a decision between assigninga trip to a flex-route vehicle or to a pure demand-responsive vehicle,the scheduling and dispatching software for both services must sharea rider database. (PRTC specified such a system but has not tested thesecapabilities because the agency does not operate a pure demand-responsive service.) This database should include disabled ridersand any special needs they have, as well as other frequent requestorsof off-route trips. Furthermore, dispatchers should be able to see allvehicles operating in a service area instead of having separate dis-patching for demand-responsive and flex-route operations. Theseenhancements may, in fact, require acquisition of a combined softwarepackage from one vendor. However, such modifications to existinginstallations are less complicated than acquiring an entirely newCAD/AVL system.
The increased software complexity and compatibility issues raisedby hybrid services have some offsetting benefits. Rather than main-taining two different types of dispatcher stations and on-board equip-ment for the fixed-route and demand-responsive services, the samesoftware, spares, and maintenance practices would be usable for theentire fleet.
A flex-route service can be tried in a pilot area. But it would requirea dedicated subfleet equipped with stand-alone on-board equipmentand training of drivers assigned specifically to this service. The PRTCexperience clearly shows that it would also require an outreach effortto users in the service area to explain the nature of this service. Flexroutes cannot be tested on a casual basis; if the outreach is not ade-quate, then the true level of public interest and effectiveness will notbe discovered.
PRTC did not have to worry about organizational divisions becauseit had no demand-responsive operations prior to OmniLink. But to useflex route to its full potential, there must be a blurring of the distinc-tion between transit and paratransit. New productivity indicators thattrack performance of the combined, hybrid operations should beconsidered. These should be able to demonstrate to the agency thatimplements flex services whether any reduction in fixed-route pro-ductivity due to the deviations is compensated by lower paratransitcosts or by better service to the public.
REFERENCES
1. Farwell, R. G. Evaluation of OmniLink Demand-Driven Transit Operations:Route Deviation Services. Transportation Quarterly, Vol. 52, No. 1, 1998,pp. 31–43.
2. Casey, R., J. Schwenk, M. Harris, and M. Hardy. A Ride Through SAFires:An APTS Operational Test in Prince William County, VA. Report FTA-MA26-7007-02.2. Volpe National Transportation Systems Center, Cambridge,Mass., 2002.
3. Marx, E. PRTC Statistics Developed for Reports to the Board of Directors.Potomac and Rappahannock Transportation Commission, Prince WilliamCounty, Woodbridge, Va., 2005.
4. Bureau of the Census. www.census.gov. Accessed July 28, 2005.5. Federal Transit Administration. National Transit Database. Profiles of the
30 Largest Agencies, 2003. www.ntdprogram/NTD/Profiles.nsf. AccessedApril 2005.
6. Morlok, E., E. Bruun, and F. Vanek. The Advanced Minibus Concept: ANew ITS-Based Service for Low Density Markets. Report PA-26-700D,FTA, 1997.
7. Koffman, D. TCRP Synthesis 53: Operational Experience with FlexibleTransit Services. TRB, National Research Council, Washington, D.C.,2004. http://www.tcrpoline.org.
The Paratransit Committee sponsored publication of this paper.