omya ustralia ty td bajool qld€¦ · figure 1: aerial overview of the bajool marble mine ......
TRANSCRIPT

Page: 1 of 59 Airlabs Environmental
OMYA AUSTRALIA PTY LTD
BAJOOL, QLD
AIR QUALITY IMPACT ASSESSMENT – EXISTING AND PROPOSED
OPERATIONS
DOCUMENT CONTROL
Report Number Date Issued Version Prepared Checked Released
SEP17190.1 20 December 2017 Draft A Aitharaju, B Bhensdadia
A Aitharaju, B Bhensdadia A Aitharaju
SEP17190.2 09 January 2018 Final – Addressed Client Comments
A Aitharaju, B Bhensdadia
A Aitharaju, B Bhensdadia A Aitharaju
PREPARED FOR Omya Australia Pty Ltd
1879 South Ulam Road, Bajool, QLD C/-Post Office Bajool 4699
Phone: 07 4934 6233 Fax: 07 4934 6299

Airlabs Environmental Omya Australia, Bajool, QLD SEP17190.2 Air Quality Impact Assessment Report
Page: 2 of 59 Airlabs Environmental
TABLE OF CONTENTS
EXECUTIVE SUMMARY ........................................................................................................................................ 6
1. INTRODUCTION .......................................................................................................................................... 8
2. ASSESSMENT OBJECTIVE ....................................................................................................................... 10
3. ASSESSMENT METHODOLOGY ............................................................................................................ 11
4. MINE OVERVIEW AND OPERATIONS ................................................................................................. 11
4.1 Existing Operations ............................................................................................................................. 12
4.1.1 Scale of Operations ....................................................................................................................... 12
4.1.2 Mining Equipment ............................................................................................................................ 12
4.1.3 Description of Mining Activities ..................................................................................................... 14
4.1.4 Operational Hours .......................................................................................................................... 16
4.1.5 Dust Control Measures .................................................................................................................... 16
4.2 Proposed Operations ......................................................................................................................... 21
5. STUDY AREA AND SURROUNDS .......................................................................................................... 22
5.1 Existing Land Use and Topography ................................................................................................. 22
5.2 Sensitive Receptors ............................................................................................................................. 22
6. REGULATORY GUIDELINES .................................................................................................................... 26
6.1 National Legislation ............................................................................................................................ 26
6.2 Legislation in Queensland .................................................................................................................. 26
6.3 Air Quality Objectives Applicable for the Assessment ................................................................ 26
7. EXISTING AIR QUALITY .......................................................................................................................... 27
8. EMISSION ESTIMATION .......................................................................................................................... 28
8.1 Fugitive Dust Sources – Existing Operations .................................................................................. 28
8.2 Fugitive Dust Sources – Proposed Operations ............................................................................... 29
8.3 Dust Emissions Inventory – Existing and Proposed Operations ................................................... 29
8.4 Dust Emissions – Construction Phase ................................................................................................. 34
9. METEOROLOGICAL MODELLING ......................................................................................................... 34
9.1 Assessment Methodology ................................................................................................................... 34
9.2 TAPM ..................................................................................................................................................... 34
9.3 CALMET ................................................................................................................................................. 35
9.4 Modelled Meteorology ...................................................................................................................... 35
10. DISPERSION MODELLING ................................................................................................................... 39
11. PREDICTED IMPACTS............................................................................................................................ 40
11.1 Predicted Impacts – Existing Operations .................................................................................... 40
11.2 Predicted Impacts – Proposed Operations ................................................................................ 42
11.3 Recommendations ............................................................................................................................ 44
Airlabs Environmental Omya Australia, Bajool, QLD SEP17190.2 Air Quality Impact Assessment Report
Page: 3 of 59 Airlabs Environmental
12. CONCLUSION ....................................................................................................................................... 44
13. BIBLIOGRAPHY ..................................................................................................................................... 46
APPENDIX A ....................................................................................................................................................... 48
APPENDIX B ....................................................................................................................................................... 50
LIST OF TABLES
Table 1: Minimum Requirements for Applications involving Air Emissions in QLD and Sections of the Assessment Report addressing the Requirements .................................................................................. 10
Table 2: Inventory of Current Mining Equipment and their Functions ......................................................... 12
Table 3: Operational Hours – Current Operations ....................................................................................... 16
Table 4: Details of Identified Sensitive Receptors ......................................................................................... 25
Table 5: Criteria Adopted for this Assessment ............................................................................................... 27
Table 6: Background Air Quality Levels Adopted for this Assessment ...................................................... 28
Table 7: Annual TSP, PM10 and PM2.5 Emissions Inventory – Existing Operations ................................... 30
Table 8: Annual TSP, PM10 and PM2.5 Emissions Inventory – Proposed Operations (incl. Existing) ...... 30
Table 9: TAPM Model Configuration ............................................................................................................... 35
Table 10: CALMET Model Configuration ......................................................................................................... 35
Table 11: Predicted Impacts at Identified Sensitive Receptors – Existing Operations ........................... 41
Table 12: Predicted Impacts at Identified Sensitive Receptors – Proposed Operations ....................... 43
LIST OF FIGURES
Figure 1: Aerial Overview of the Bajool Marble Mine.................................................................................... 9
Figure 2: Mining Tenements of the Bajool Marble Mine ............................................................................... 13
Figure 3: Process Flow Diagram – Existing Operations at Bajool Marble Mine ...................................... 19
Figure 4: Aerial Overview Showing Locations of Existing Operational Activities at Bajool Marble Mine ............................................................................................................................................................... 20
Figure 5: Aerial Overview of the Proposed WREA Expansion ................................................................... 21
Figure 6: Land Use Overview ............................................................................................................................ 23
Figure 7: 3-Dimension Topographical Features surrounding the Bajool Marble Mine ........................... 24
Figure 8: Aerial Overview of the Selected Sensitive Receptors ................................................................. 25
Figure 9: Comparison of Annual TSP, PM10 and PM2.5 Emissions – Existing and Proposed Operations – All Sources .................................................................................................................................................... 31
Figure 10: Comparison of Source Contribution – Annual TSP Emissions – Existing and Proposed Operations ................................................................................................................................................... 32
Figure 11: Comparison of Source Contribution – Annual PM10 Emissions – Existing and Proposed Operations ................................................................................................................................................... 32
Figure 12: Comparison of Source Contribution – Annual PM2.5 Emissions – Existing and Proposed Operations ................................................................................................................................................... 33
Figure 13: Comparison of Annual TSP, PM10 and PM2.5 Emissions for Existing and Proposed Operations at WREA ................................................................................................................................. 33

Airlabs Environmental Omya Australia, Bajool, QLD SEP17190.2 Air Quality Impact Assessment Report
Page: 4 of 59 Airlabs Environmental
Figure 14: CALMET Predicted Wind Rose – Five Years (2012 to 2016) ................................................. 37
Figure 15: Frequency of Stability Class – Annual 2016 CALMET .............................................................. 38
Figure 16: CALMET Predicted Diurnal Variations in Mixing Heights – 2016 ........................................... 39

Airlabs Environmental Omya Australia, Bajool, QLD SEP17190.2 Air Quality Impact Assessment Report
Page: 5 of 59 Airlabs Environmental
ABBREVIATIONS AHD Australian Height Datum
AJ Laner AJ Laner Professional Services
Airlabs Airlabs Environmental Pty Ltd
CALMET California Meteorological Model
CALPUFF California Puff Dispersion Model
CSIRO Commonwealth Scientific and Industrial Research Organisation
EA Environmental Authority
EHP QLD Department of Environment and Heritage Protection
EMP Bajool Marble Mine – Environmental Management Plan
EPA Act QLD Environmental Protection Act 1994
EPP (Air) (2008) Environmental Protection (Air) Policy 2008
ERA Environmentally Relevant Activities
FEL Front-end loader
g/sec Emission rate in grams per second
ha Hectares
m3 cubic metre
ML Mining Lease
MLA Mining Lease Application
mg/m2/day Units for dust deposition
NEPC National Environment Protection Council
NEPM National Environment Protection Measure – Ambient Air Quality
NSW – EPA New South Wales Environment Protection Authority
NSW – OEH New South Wales Office of Environment and Heritage
Omya Australia Omya Australia Pty Ltd
PM Particulate matter
PM10 Particulate matter with an equivalent diameter of 10 microns
PM2.5 Particulate matter with an equivalent diameter of 2.5 microns
QLD Queensland
ROM Run of Mine
SRC Sigma Research Corporation (now Exponent)
SRTM Shuttle Radar Topography Mission
TAPM The Air Pollution Model
tpa tonnes per annum
TSP Total Suspended Particulates
g/m3 micrograms per cubic metre
US-EPA United States Environmental Protection Agency
UTM Universal Transverse Mercator
WREA Waste Rock Emplacement Area

Airlabs Environmental Omya Australia, Bajool, QLD SEP17190.2 Air Quality Impact Assessment Report
Page: 6 of 59 Airlabs Environmental
EXECUTIVE SUMMARY Airlabs Environmental Pty Ltd was commissioned by Omya Australia Pty Ltd to undertake an air quality impact assessment for their marble mine operations located at 1879 South Ulam Road, Bajool, Queensland.
Omya Australia has been operating the Bajool Marble Mine since 1980, principally to produce high purity crushed marble. The mine is located circa. 17km south of the village of Bajool, midway between Rockhampton and Gladstone in Central Queensland.
Omya Australia proposes to bring in their Enivoronmental Authority (EPML00657813) in-line with their current on-site Environmnetally relevant activities (ERAs) and also to expand their existing waste rock emplacement area (WREA).
This assessment aims to quantify the air quality impacts from the existing operations and to determine the increase in air quality impacts resulting from the proposed expansion. The proposal is only for an increase in the footprint of the WREA (approximately by 5.5-6 ha in addition to the existing footprint) and there would be no change (i.e. increase / decrease) in the amount of reject material emplaced at the WREA and no additional activities are being proposed.
This assessment principally aims to achieve the following objectives:
• Quantifying air quality impacts from the mine’s existing operational activities as a part of a major amendment application to include the mine’s operations under ERA 33; and
• Determining air quality impacts resulting from the proposed expansion of the WREA.
To determine air quality impacts from the existing and proposed operations, air dispersion modelling was conducted, and the following specific tasks were undertaken:
• Detailed appreciation of the mine and its operations – existing and proposed.
• Identifying key pollutants of concern based on review of the operations.
• Determination of relevant assessment criteria.
• Development of site-specific meteorology – using the combination of TAPM/CALMET models.
• Identification of particulate matter / dust emission sources for existing and proposed operations, including reviewing the existing dust control measures and the effectiveness in reducing dust emissions and development of emissions inventory.
• Identification of sensitive receptors and characterisation of the mine and the surrounding environment including topography and land-use
• Determination of background / existing air quality levels.
• Dispersion modelling of the mine’s existing and proposed operational activities using the US-EPA CALPUFF dispersion model.
• Quantitative assessment of operational particulate matter impacts – existing and proposed operations and comparing with assessment criteria to check for compliance.
• Preparation of assessment report.
From the modelling undertaken, the following observations have been made:
• Modelling of dust emissions from the existing operations (which includes the ERA 33 activities) show that the predicted ground level TSP, PM10, PM2.5 and deposited dust levels at identified sensitive receptors are well below the relevant assessment criteria.
• Modelling of dust emissions from the proposed operations (i.e. existing operations + expansion of the WREA) show that the predicted ground level TSP, PM10, PM2.5 and deposited dust levels at identified sensitive receptors are well below the relevant assessment criteria.

Airlabs Environmental Omya Australia, Bajool, QLD SEP17190.2 Air Quality Impact Assessment Report
Page: 7 of 59 Airlabs Environmental
Though modelling demonstrates compliance with the assessment criteria for both existing and proposed operations, Airlabs recommends that the existing dust control measures should continue to be diligently implemented at all times to effectively manage and mitigate release of dust emissions from the various operational activities at the site. The measures should be periodically reviewed to ensure that they are achieving their intended purpose / objectives.

Airlabs Environmental Omya Australia, Bajool, QLD SEP17190.2 Air Quality Impact Assessment Report
Page: 8 of 59 Airlabs Environmental
1. INTRODUCTION Airlabs Environmental Pty Ltd (Airlabs) was commissioned by Omya Australia Pty Ltd (Omya Australia) to undertake an air quality impact assessment (hereafter ‘the assessment’) for their marble mine operations located at 1879 South Ulam Road, Bajool, Queensland.
Omya Australia, owner / operator of the Bajool Marble Mine holds the following permits:
• Registered Suitable Operator Number: 341494
• Non-Standard Environmental Authority (EA): EPML00657813 (formerly MIM800074702).
Omya Australia has been operating the Bajool Marble Mine since 1980, principally to produce high purity crushed marble. The mine is located circa. 17km south of the village of Bajool, midway between Rockhampton and Gladstone in Central Queensland.
The mine site consists of two mining areas (only one of which is currently active), haul roads, waste rock emplacement areas (WREA), crushing plant and a small stone dust mill. As per estimates provided by Omya Australia annual production has increased from around 15,000 tonnes per annum (tpa) in 1980 to 260,000 tpa in 2017.
Omya Australia proposes to bringing in their their Enivoronmental Authority (EPML00657813) in-line with their current on-site Environmentally relevant activities (ERAs) and for that, requires a quantitative assessment of air quality impacts from their existing operational activities. The assessment is to be provided as a part of a major amendment application to include an Environmentally relevant activity (ERA) as per the Department of Environment and Heritage Protection (EHP), Queensland.
According to EHP, ERA’s1 are prescribed activities that are generally industrial or intensive animal
industries with the potential to release emissions which impact on the environment and surrounding land
uses.
As the production throughput of the mine was 260,000 tpa in 2017, according to Schedule 2 of the Environmental Protection Regulation 2008, Environmental Protection Act 1994, existing operations at Omya Australia would be categorised under ERA 33 – Crushing, milling, grinding or screening.
As-such, one of the objectives of this assessment was to include the existing operations undertaken at the mine under ERA 33.
Additionally, Omya Australia are proposing to expand their existing WREA and this assessment aims to quantify the increase in air quality impacts resulting from the proposed expansion.
In summary, this assessment aims to achieve the following objectives:
• Quantification of air quality impacts from the mine’s existing operational activities as a part of a major amendment application to include the mine’s operations under ERA 33.
• Determination of air quality impacts resulting from the proposed expansion of the WREA.
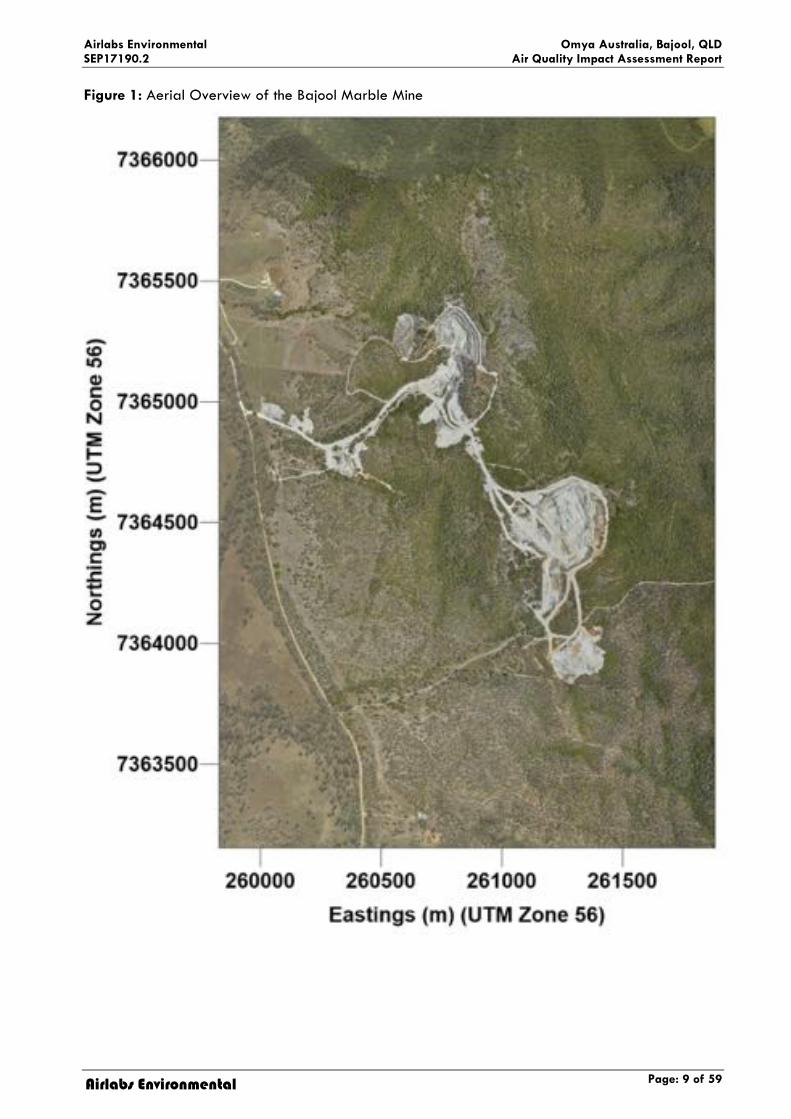
An aerial overview of the Bajool Marble Mine is presented in Figure 1.
1 Environmentally relevant activities – Prescribed, Department of Environment and Heritage Protection, Queensland Government (https://www.ehp.qld.gov.au/licences-permits/business-industry/)
Airlabs Environmental Omya Australia, Bajool, QLD SEP17190.2 Air Quality Impact Assessment Report
Page: 9 of 59 Airlabs Environmental
Figure 1: Aerial Overview of the Bajool Marble Mine

Airlabs Environmental Omya Australia, Bajool, QLD SEP17190.2 Air Quality Impact Assessment Report
Page: 10 of 59 Airlabs Environmental
2. ASSESSMENT OBJECTIVE This assessment principally aims to achieve the following objectives:
• Quantifying air quality impacts from the mine’s existing operational activities as a part of a major amendment application to include the mine’s operations under ERA 33; and
• Determining air quality impacts resulting from the proposed expansion of the WREA.
The assessment has been informed by the following regulatory guideline documents:
• Environmental Authority EPML 00657813, issued by EHP
• EHP Guideline Application requirements for activities with impacts to air (ESR/2015/1840) (hereafter ‘EHP Guideline – activities with impacts to air’)
• EHP Guideline (Mining) Model mining conditions (ESR/2016/1936)
• Environmental Protection (Air) Policy 2008 (hereafter ‘EPP (Air) 2008’)
Additionally, reference has been drawn to the following documents, where necessary:
• Approved Methods for the Modelling and Assessment of Air Pollutants in NSW, Environment Protection Authority, January 2017 (NSW-EPA, 2017)
• Generic Guidance and Optimum Model Settings for the CALPUFF Modelling System for Inclusion into the ‘Approved Methods for the Modelling and Assessment of Air Pollutants in NSW, Australia’ (NSW-OEH, 2011)
This assessment has been undertaken in accordance with the requirements listed in the aforementioned regulatory guidelines.
The EHP Guideline – activities with impacts to air prescribes minimum requirements that are to be presented in applications involving air emissions in QLD. Sections of this assessment report, which address those minimum requirements, are summarised below in Table 1.
Table 1: Minimum Requirements for Applications involving Air Emissions in QLD and Sections of the Assessment Report addressing the Requirements
Required Minimum Information and Corresponding Sections of the EHP Guideline – activities with impacts to air
Sections of the Assessment Report Addressing the
Minimum Requirements Environmental objectives and performance outcomes – Section 2 Section 2
Surrounding land – Section 3 Section 5
Scaled map – Section 3 Section 1 and Section 4
Site topography – Section 3 Section 5
Wind direction – Section 3 Section 9
Description of ambient air quality – Section 3 Section 7
Overview of emissions and processes – Section 4 Section 4 and Section 8
Emissions – Section 4 Section 8
Chemical properties of contaminants – Section 4 Section 6
Physical properties of contaminants – Section 4 Section 6
Evaluating impacts of emissions – Section 4 Section 11
Air dispersion modelling – Section 4 Section 9 and Section 10
Control measures and contingency plans – Section 5 Section 4 and Section 11

Airlabs Environmental Omya Australia, Bajool, QLD SEP17190.2 Air Quality Impact Assessment Report
Page: 11 of 59 Airlabs Environmental
3. ASSESSMENT METHODOLOGY Air dispersion modelling has been conducted to quantify air quality impacts from the existing and proposed operations at the Bajool Marble Mine. The following tasks have been undertaken to determine impacts from the mine:
• Detailed appreciation of the mine and its operations – obtained through a site inspection conducted on 24 October 2017 and reviewing the provided documentation.
• Identifying key pollutants of concern based on review of the operations.
• Determination of relevant assessment criteria.
• Development of site-specific meteorology.
• Identification of particulate matter / dust emission sources for existing and proposed operations and development of emissions inventory.
• Identification of sensitive receptors and characterisation of the mine and the surrounding environment including topography and land-use
• Determination of background / existing air quality levels.
• Dispersion modelling of the mine’s existing and proposed operational activities.
• Quantitative assessment of operational particulate matter impacts – existing and proposed operations and comparing with assessment criteria to check for compliance.
• Preparation of assessment report.
4. MINE OVERVIEW AND OPERATIONS The Bajool Marble Mine has been operational since 1980 to produce white high purity crushed marble. The mine incorporates five granted mining leases covering a total area of 232.94 ha (refer Figure 2). Mining Lease Application (MLA) 80167 has been lodged to cover the extended footprint of the WREA. The location of MLA 80167 is shown in Figure 2.
The mine site consists of two mining areas (only one of which is currently active), haul roads, waste rock emplacement areas (WREA), crushing plant and a small stone dust mill.
The marble deposit has been traced over 52 ha by surface geological mapping and extends to at least 100m depth, the limit of the existing drill holes. Based on the large size of the geological resources and the small annual rate of production – details of which are provided below, it is expected that the life of the mine is considered to be indefinite. The mine is well established, with activities primarily associated with the operations of the mine. Rehabilitation of disturbed areas is an ongoing process and done in conjunction with other mining activities.
An overview of the existing operations and the proposed WREA expansion is provided in the following sections. The appreciation of existing operations has been through the information gathered during the site inspection conducted on 24 October 2017 by Airlabs personnel and upon reviewing the documentation provided by Omya Australia.

Airlabs Environmental Omya Australia, Bajool, QLD SEP17190.2 Air Quality Impact Assessment Report
Page: 12 of 59 Airlabs Environmental
4.1 Existing Operations
Current operational activities and on-site infrastructure at the mine are detailed in this section. As per the Plan of Operations, the mine site comprises two principal mine excavations:
• The Northern Quarry; and
• The Wells Quarry.
According to the Plan of Operations, all activities in the Northern Quarry were placed on hold in May 1998 due to problems achieving consistency in raw materials quality, the nature of topography surrounding the mine, the company’s acquisition of the Wells Quarry and results of geological assessments of the acquired leases.
It is envisaged that no further development in the Northern Mine would take place in the medium term and the void currently acts as an important water catchment and storage facility for the site. All water for the processing plant is sourced from this void.
The Wells Quarry currently covers an area of 13.8 ha. The mine area currently extends down to 110m Australian Height Datum (AHD) and the elevation of the pit perimeter varies between 145m and 160m AHD.
4.1.1 Scale of Operations
During the term of the Plan of Operations (i.e. 2014 to 2019), extraction activities will be confined to Wells Mine. With regards to production marble extraction, it is estimated that an average of approximately 300,000 tpa of production rock will be mined each year over the period of the Plan of Operations.
Approximately 150,000 tpa will be high grade product, 40,000 tpa will be low grade product processed on-site into stone dust, 73,750 tpa will approximately constitute reject material from the crusher and the photo-sorter and 75,000 tpa will constitute quarry waste visually selected by an excavator for emplacement in the existing WREA.
4.1.2 Mining Equipment
Inventory of mining equipment currently used at the Bajool mine site is summarised in Table 2.
Table 2: Inventory of Current Mining Equipment and their Functions
Type Number Function / Purpose
Komatsu Front-End Loaders 2 Loading mine material
Komatsu 40 tonne Haul Trucks 2 Haulage of mine material
Komatsu 50 tonne Excavator 1 Loading mine material
Doosan 30 tonne Excavator 1 Loading mine material
Keestran Mobile Screen 1 Mobile screening
Caterpillar C 370 Haul Truck 1 Haulage of mine material
Mack R 600 Haul Truck 1 Water truck, dust suppression
Service Truck 1 Servicing contractors mobile equipment
Hydraulic Drill Rig 1 Blast hole drilling
Grader 1 Grading roads - required for grading road surfaces after rain, used occasionally

Airlabs Environmental Omya Australia, Bajool, QLD SEP17190.2 Air Quality Impact Assessment Report
Page: 13 of 59 Airlabs Environmental
Figure 2: Mining Tenements of the Bajool Marble Mine
Source: Plan of Operations – Bajool Marble Mine 2014 to 2019

Airlabs Environmental Omya Australia, Bajool, QLD SEP17190.2 Air Quality Impact Assessment Report
Page: 14 of 59 Airlabs Environmental
4.1.3 Description of Mining Activities
A detailed description of the current mining activities has been sourced from the Draft Environmental Management Plan for 2017 (Bajool Marble Mine, Environmental Management Plan, 2017) (hereafter ‘the EMP’)
According to the EMP, Omya Australia proposes to continue its mining and processing operations with the existing mining equipment (refer Table 2) and fixed crushing and processing plants in compliance with its Plan of Operations.
The main activities that are undertaken on the mining tenements (refer Figure 2) at the site include:
• Exploration drilling.
• Mine planning.
• Development of the mine and selective open cut mining of marble.
• Removal and management of waste rock.
• On-site processing of the mined marble.
• Maintaining on-site infrastructure.
• Road transportation of marble products from the mine; and
• Progressive rehabilitation of the disturbed areas of the mine.
A brief description of the aforementioned activities is presented below:
Exploration Drilling:
Limited exploration activities are undertaken within the Company’s leases to delineate the extent of the resource, assess resource quality and assist mine planning. Depending on the purpose of the exploration, activities undertaken comprise limited amounts of clearing for drill rig access and drilling.
Extraction Activities:
As noted in Section 4.1, extraction activities are confined to the Wells Mine and comprises the following activities:
• Topsoil removal: Stripped vegetation and topsoil are directly placed on available rehabilitation areas where possible. If such areas are not available, vegetation and topsoil are pushed up into windrows around the perimeter of the WREA and temporarily stockpiled.
• Cap rock blasting: During the period of the Plan of Operations (2014 -2019), cap rock blasting will be done within the pre-strip area of the pit and inside the perimeter haul road. Approximately 12,000 m3 will be blasted each year. All cap rock waste will be hauled into the WREA.
• Production blasting: Production blasting continued from ten metre benches in 2014 and has been developed down to the 110m AHD level in the centre of the pit. It is expected that there would be approximately 5 blasts per annum, however Omya Australia advised Airlabs that they are allowed to conduct up to a maximum of 12 blasts per annum.
• Production marble extraction: As per the Plan of Operations (2014 -2019), it is estimated that an average of approximately 300,000 tpa of production rock will be mined each year over. Approximately 150,000 tpa will be high grade product, 40,000 tpa will be low grade product processed on-site into stone dust, 73,750 tpa will approximately constitute reject material from the crusher and the photo-sorter and 75,000 tpa will constitute quarry waste visually selected by an excavator for emplacement in the existing WREA.

Airlabs Environmental Omya Australia, Bajool, QLD SEP17190.2 Air Quality Impact Assessment Report
Page: 15 of 59 Airlabs Environmental
Waste Rock Emplacement:
Wastes generated from the mining of marble to produce high-whiteness industrial fillers comprise cap rock (generally the upper 2m) of material overlying the high-quality marble and production wastes selectively separated by the excavator within the open cut quarry and at the photo-sorter.
Blasted waste rock ranges in size from clay particles to boulder size, with a significant proportion less than 30mm that is suitable substrate for the propagation of local flora. Other waste materials include stone rejected by the photo sorter following crushing and screening.
There are three existing waste rock emplacements at the mine. The Northern Waste Rock Emplacement, within ML 80028 (refer Figure 2), was formerly used for the storage of waste materials produced from the Northern Mine. This waste rock emplacement is no longer active.
The Southern Waste Rock Emplacement within ML’s 80028 and 3663 formerly received waste material from the small pit east of the current crusher site. It has been successfully revegetated below the 142m AHD level. The crusher rejects are placed on the 142m AHD level and the Run of Mine (ROM) or oversize stockpiles are located on the 166m AHD level.
The Wells Waste Rock Emplacement – WREA located near the southern boundary of the mine is the only active waste rock emplacement area. It is noted that no tailings waste is produced at the mine. The waste rock is chemically stable. The rock types do not become a source of salt or acid mine drainage upon weathering.
During the site inspection, Airlabs personnel were informed that a mobile screen is deployed at the existing WREA, which is used for screening reject materials emplaced at the WREA. The screening is done to maximise the usage of reject materials. The mobile screen has a maximum capacity of screening up to 100 tonnes /hour and is expected to screen approximately 73,000 tpa of reject material (estimated from the rated screening capacity and a maximum usage of 6 hours in any given day).
On-Site Processing:
The processing of production marble from the Bajool Marble Mine is dependent on the product demand, market and quality considerations.
In 1999, Omya Australia commissioned a crushing, screening and optical sorting plant. A comparatively smaller and re-built plant located near the site office is used to mill marble to a nominal particle size of 40 microns. This milled product is sold locally for coal mine stone dusting and agriculture.
Operations at the on-site processing plant comprise the following:
• The mined Run of Mine (ROM) marble is transported from the Wells Quarry either to the primary crusher or onto a ROM stockpile.
• Stockpiled ROM marble is eventually loaded to the primary crusher by a front-end-loader (FEL) / excavator.
• The ROM marble passes through a primary and secondary crusher and then screened into three size fractions, including:
o 0-8mm
o 8-20mm
o >20mm (20mm – 80mm)
• The acceptable quantities of the <8mm fraction considered as high-grade white product is transported off-site.
• If the <8mm size fraction has unacceptable colour, but is free of impurities, it is transferred to the stone dust plant for milling, as the stone dust market is not sensitive to colour

Airlabs Environmental Omya Australia, Bajool, QLD SEP17190.2 Air Quality Impact Assessment Report
Page: 16 of 59 Airlabs Environmental
• Generally, the 8-20mm size fraction material contains excess amounts of black mafic rock and cannot be used to make a marketable marble product. As-such the accepted material in that size fraction is transferred to the stone dust plant. The rejected material within that size fraction it transferred to the WREA.
• The size fraction greater than 20mm (>20mm) reports to the photosorter as the current optical sorting technology is not amenable for size fractions less than 20mm. Post optical sorting, the acceptable quantities are transported off-site and the remaining are categorised as rejects and are emplaced at the WREA.
• Packaged processed marble products are stored in a small shed adjacent to the processing plant to dispatch from the mill. Bulk products are blown through a 100mm pipe to the silo above the weighbridge. Approximately, 50% of the stone dust mill output is dispatched in one tonne bulk bags, 35% in 20 kg paper sacks and the remaining 15% in bulk tankers.
On-Site Infrastructure:
Haul roads are considered to be the biggest infrastructure on the mine site with a combined length of 4km and a typical running width of approximately 15m, or three times the width of the quarry trucks. Perimeter safety bunds extend a further 1m of each side of the haul roads.
Product Transportation:
Marble products are loaded onto road-registered trucks, super-dogs and semi-trailers capable of carrying 38 tonnes per load for dispatch from the mine. Over 80% of the mine output is transported to Omya Australia’s plants in Geelong, VIC and Boyer, TAS. The product is transported by road to a stockpile at the Auckland Point wharf in Gladstone and transported by sea to Geelong and Boyer.
4.1.4 Operational Hours
The mine’s current operational hours with respect to the current activities are summarised in Table 3.
Table 3: Operational Hours – Current Operations
Activity Operational Hours
Quarrying 6AM – 6PM, Monday to Sunday
Blasting 6AM – 3PM Monday to Friday; 9AM – 1PM on Saturday
Crushing
24 – hours, 7 days a week Milling
Loading and transport
4.1.5 Dust Control Measures
As the mine is located within a rural setting, airborne dust emissions are a key pollutant of concern. To manage the dust emissions generated from the various operational activities at the mine site, a range of dust control measures have been identified and are currently implemented.
Airlabs have been informed by Omya Australia that the site has no recorded air or dust related complaints from the surrounding properties.
Dust control measures currently implemented at the mine site include the following:
• Application of automated water sprays during crushing and screening operations.
• Use of a cyclone on the drill rig.
• Avoiding or minimising dust generating activities (i.e. stripping, excavation etc.) during high-risk conditions such as dry and windy conditions.
Airlabs Environmental Omya Australia, Bajool, QLD SEP17190.2 Air Quality Impact Assessment Report
Page: 17 of 59 Airlabs Environmental
• Use of natural protection from existing topography from surrounding ridgelines (i.e. windbreaks) to disrupt prevailing winds and minimise wind erosion of exposed areas and stockpiles.
• The site maintains a buffer of remnant and /or undisturbed vegetation around the mine site and infrastructure to provide a natural barrier for airborne dust emissions.
• Undertaking re-vegetation works in a timely manner.
• Topsoil stockpiles are stabilised by contouring to promote the natural regeneration of vegetation.
• The WREA is maintained in such a way that the height of the stockpiles and the final profiles are below that of the surrounding protective ridgelines providing windbreaks to manage wind erosion emissions.
• Restricting the movement of heavy vehicles to designated and restricted roads wherever practicable.
• Limiting maximum vehicle speeds on haul roads to 40 km/hour.
• Permanent on-site water truck used as required during dry and windy periods and to routinely water the main haul roads and frequently trafficked areas.
• Application of the Polo Citrus2 chemical suppressant (added to water truck) for use on main haul roads.
• Enforcement of a covered load policy on all bulk product dispatches where by all product loads are in sealed trucks, packaged in bulk bags or covered by tarpaulins.
• All diesel used on the mine site contains sulfur content of no more than 500 mg/kg.
• Fuel burn and blasting powder factors are regularly monitored by Omya along with the mobile plant.
• Baghouses are fitted on the stone dust mill discharge vent along with filters on storage silo air vents.
• Bag leak detection systems are present with the stone dust mill baghouse alarmed back to the control room.
• Interlocking of the baghouses prevent the operation of the mill without the use of baghouse.
In addition to implementing the aforementioned dust control measures, the following operational procedures are regularly carried out to manage dust emissions caused by the activities:
• Undertaking visual inspections of the site and process areas to verify if the dust control measures are appropriate and adequate for the weather conditions and the type of work being undertaken at that time.
• Monthly monitoring of discharge vent filters and baghouses.
• Conducting on-site dust deposition monitoring in accordance with AS 3580.10.1:2003 – Methods for Sampling and Analysis of Ambient Air Determination of Particulate Matter –
Deposited Matter – Gravimetric Method.
• Maintaining an on-site weather station to determine wind speed and direction in the event of a high dust event or public complaint.
2 Polo Citrus Australia (https://www.polocitrus.com.au/)

Airlabs Environmental Omya Australia, Bajool, QLD SEP17190.2 Air Quality Impact Assessment Report
Page: 18 of 59 Airlabs Environmental
• Commissioning of an annual personal occupational dust monitoring program for the on-site employees.
• Ensuring that the stone dust mill exhaust fitted with a sampling port in the exhaust vent is in line with the necessary regulatory standards (i.e. AS 4323.1 – 1995 – Stationary Source Emissions
– Selection of Sampling Positions).
• Any complaints made in relation to dust emissions would be logged in the Omya Incident Management System and addressed in consultation with the Director of Operations.
A flow diagram of the existing operations is presented in Figure 3 and the location of the existing operational activities within the mine site in Figure 4.

Airlabs Environmental Omya Australia, Bajool, QLD SEP17190.2 Air Quality Impact Assessment Report
Page: 19 of 59 Airlabs Environmental
Figure 3: Process Flow Diagram – Existing Operations at Bajool Marble Mine
Geo / Mine Planning Exploration Drilling
Drill and Blast
Load and Haul
Secondary Breakage
Crushing /Screening
WREA – Waste
Dump
0mm – 8mm
Fines Storage
8mm – 20mm
Intermediate Stockpile
20mm- - 80mm
Sorter
Stone Dust Grinding
Gladstone Port
Stockpile
Landscape Sales
White Sorted
OMYA Plants
Black Reject
Fines Classification
0mm – 10mm
Course Fines
Slurry Fines
Sediment Basin
Water Fines Low Grad Ag Sales
Onsite Landscape/
Road Base
Grinding
Bulk Silo
1 Tonne Bulk Bags
20 /25kg Paper Bags
Weighbridge Bulk Tanker (Road)
Mill Feed
Forklift Flat Bed Truck
Laboratory Control Room
Maintenance
WorkshopFuel Facility
Administration
Emergency Wells Pit
Discharge
Site Water Storage
Tank 20000L
Northern Pit (Old
Pit) 25ML
Road Dust
Suppression –
Water Truck
Wells Pit De-
Watering Pump
Site ServicesSite Services
OMYA – BAJOOL MARBLE MINE PROCESS FLOW
OMYA – BAJOOL MARBLE MINE PROCESS FLOW
Source: 2017 Draft Environmental Management Plan, Bajool Marble Mine, Omya Australia Pty Ltd

Airlabs Environmental Omya Australia, Bajool, QLD SEP17190.2 Air Quality Impact Assessment Report
Page: 20 of 59 Airlabs Environmental
Figure 4: Aerial Overview Showing Locations of Existing Operational Activities at Bajool Marble Mine
Source: 2017 Draft Environmental Management Plan, Bajool Marble Mine, Omya Australia Pty Ltd

Airlabs Environmental Omya Australia, Bajool, QLD SEP17190.2 Air Quality Impact Assessment Report
Page: 21 of 59 Airlabs Environmental
4.2 Proposed Operations
As per information provided to Airlabs, Omya Australia are proposing to expand the footprint of the existing WREA. The footprint expansion would be progressing towards the south of the existing WREA. Based on information provided to Airlabs and through aerial imagery, it is estimated that the extent of the proposed footprint would be approximately 5.5-6 ha in addition to the existing footprint.
The proposal allows for the reject material to be spatially distributed across the existing and the proposed footprint of the WREA.
Airlabs have been advised that the proposal is only for an increase in the footprint of the WREA and that there would be no change (i.e. increase / decrease) in the amount of reject material to be emplaced at the WREA and no additional activities are proposed as a part of the WREA expansion.
It is expected that there would be a modest increase in the haulage activity at the WREA due to the proposal as the trucks would have to travel a longer distance than existing operations because of the increase in the footprint area. An aerial overview of the proposed WREA expansion is presented in Figure 5.
Figure 5: Aerial Overview of the Proposed WREA Expansion
Source: 2017 Draft Environmental Management Plan, Bajool Marble Mine, Omya Australia Pty Ltd

Airlabs Environmental Omya Australia, Bajool, QLD SEP17190.2 Air Quality Impact Assessment Report
Page: 22 of 59 Airlabs Environmental
5. STUDY AREA AND SURROUNDS 5.1 Existing Land Use and Topography
The Bajool Marble Mine leases are located on the south facing timbered slopes of Mt. McCamley and Mt. Kelly, with elevations ranging between 92m AHD and 319m AHD.
The land-use surrounding the mine site can be principally classified as Rangeland typically characterised by grasslands, shrubs and bushes. There is presence of forest land to the immediate north of the mine and to a greater extent on the west and north-east of the mine site.
Manually generated land-use at 150m grid resolution overlaid on aerial imagery over a 15km x 15km domain is illustrated in Figure 6.
A 3-dimensional representation of the topographical features surrounding the mine site over a 2km x 3km domain is illustrated in Figure 7. Topography can have a significant influence on air dispersion, especially during night-time and stable conditions when wind speeds are low, air tends to drain (katabatic drainage) towards low-lying areas.
The topography of the mine is complex, comprising elevated terrain to the north of the Wells quarry due to the presence of Mt. McCamley and Mt. Kelly and gradually sloping towards the south, where the WREA is located. Elevated terrain is observed immediately west and south-west of the Wells quarry before gently sloping towards the site office and the stone dust plant area. The elevated terrain especially to the north and west, south-west provides natural mitigation by inhibiting wind speeds in the immediate vicinity.
5.2 Sensitive Receptors
To predict air quality impacts from the existing and proposed operations, sensitive receptors surrounding the mine site were identified and discussed with Omya Australia for validation (i.e. to ensure selected receptors are not site-owned i.e. not acquired / owned by Omya Australia).
Typically, in air quality assessments, the selection of the sensitive receptor depends on the places where humans may be present for a period of time representative of the averaging period of the pollutant being as assessed, and consequently appropriate sensitive receptors have been identified.
Air quality impacts from the existing and proposed operations have been determined at each of the identified sensitive receptors as presented in Table 4 and Figure 8.

Airlabs Environmental Omya Australia, Bajool, QLD SEP17190.2 Air Quality Impact Assessment Report
Page: 23 of 59 Airlabs Environmental
Figure 6: Land Use Overview

Airlabs Environmental Omya Australia, Bajool, QLD SEP17190.2 Air Quality Impact Assessment Report
Page: 24 of 59 Airlabs Environmental
Figure 7: 3-Dimension Topographical Features surrounding the Bajool Marble Mine

Airlabs Environmental Omya Australia, Bajool, QLD SEP17190.2 Air Quality Impact Assessment Report
Page: 25 of 59 Airlabs Environmental
Table 4: Details of Identified Sensitive Receptors
Receptor I.D. Receptor Type Eastings (m) (UTM Zone 56) Northings (m) (UTM Zone 56)
R1 Residential Dwelling 257586 7364133 R2 Residential Dwelling 260660 7363289 R3 Residential Dwelling 259049 7362124
Figure 8: Aerial Overview of the Selected Sensitive Receptors

Airlabs Environmental Omya Australia, Bajool, QLD SEP17190.2 Air Quality Impact Assessment Report
Page: 26 of 59 Airlabs Environmental
6. REGULATORY GUIDELINES The main pollutants to be emitted from the existing and proposed activities will be dust (particulate matter (PM)) emissions. PM emissions can be released from a range of operational activities including – drilling, blasting, crushing / screening, material transfer (loading / unloading / conveying), haulage and wind erosion of exposed areas and stockpiles.
Airborne particulate matter, typically consist of particles of varying size fractions. From a health and nuisance perspective, particles are categorised primarily by size as total suspended particulates (TSP), PM10 and PM2.5 and deposited dust levels.
Although, TSP is defined as the total mass of all particles suspended in air, an effective upper limit of 30 microns aerodynamic diameter is assigned. Within the TSP matter, lie two sub-categories; particulate matter with an equivalent diameter of 10 microns or less (PM10) and particulate matter with an equivalent diameter of 2.5 microns or less (PM2.5)
Dust deposition rate is the mass of particulate matter that collects over an area for a one-month period. Dust deposition is used as a measure of the potential for dust to affects amenity.
Based on the operations undertaken at the mine site, it is understood that there is no processing of any putrescible materials, as-such, no odour emissions are expected from the operations – both existing and proposed.
6.1 National Legislation
In June 1998 (revised in 2003), the National Environment Protection Council (NEPC) developed the Ambient Air Quality National Environmental Protection Measure (NEPM) which sets out uniform standards for air quality at the national levels and has included ambient air quality standards for carbon monoxide (CO), nitrogen dioxide (NO2), photochemical oxidants (as ozone – O3), sulfur dioxide (SO2), lead and particulate matter with a nominal aerodynamic diameter of less than or equal to 10 microns (PM10). The NEPM was revised in 2003 to include an advisory reporting goal for particulate matter with a nominal aerodynamic diameter of less than or equal to 2.5 microns (PM2.5)
6.2 Legislation in Queensland
In Queensland, air quality is managed under the Environment Protection Act 1994, the Environmental Protection Regulation 2008 and the EPP (Air) 2008 which came into effect on January 1, 2009.
The Act provides for long-term protection for the environment in Queensland in a manner that is consistent with the principles of ecologically sustainable development. The primary purpose of the EPP (Air) 2008 is to achieve the objectives of the Act in relation to Queensland’s air environment.
Schedule 1 of the EPP (Air) 2008 specifies the air quality objectives that are to be (progressively) achieved though no timeframe for achievement of these objectives is specified. The Schedule includes objectives designed to protect the environmental values of:
• Health and well-being; • Aesthetic environment;
• Health and biodiversity of ecosystems; and • Agriculture
6.3 Air Quality Objectives Applicable for the Assessment
Air quality objectives (hereafter ‘assessment criteria’) referenced from Schedule 1 of the EPP (Air) 2008 applicable for the assessment are summarised in Table 5.
Modelled ground-level concentrations predicted at the sensitive receptors would be compared against the assessment criteria in Table 5 to assess compliance.

Airlabs Environmental Omya Australia, Bajool, QLD SEP17190.2 Air Quality Impact Assessment Report
Page: 27 of 59 Airlabs Environmental
Table 5: Criteria Adopted for this Assessment
Indicator Environmental Value Air Quality Objective
Averaging Period
Source / Reference
TSP Health and wellbeing 90 g/m3 Annual EPP (Air) 2008
PM10 Health and wellbeing 50g/m3 24-hours EPP (Air) 2008
PM2.5 Health and wellbeing 25g/m3 24-hours
EPP (Air) 2008 8 g/m3 Annual
Deposited Dust * Amenity 120 mg/m2/day (a) Monthly NSW EPA 2017
* There are no dust deposition guidelines in the EPP (Air) 2008 and therefore criteria were adopted from the Bajool Marble Mine Environmental Authority
(EPML0067813) condition A1
(a) Expressed as maximum total deposited dust level
7. EXISTING AIR QUALITY Characterisation of the existing air quality levels (background concentrations) surrounding the mine site is essential, especially for determination of cumulative TSP, PM10 and PM2.5 concentrations. The background concentrations are added to the predicted incremental concentrations from the existing and proposed operational activities at the mine and are assessed for compliance against the relevant air quality objectives (refer Table 5).
Ambient monitoring of TSP, PM10 and PM2.5 concentrations are not undertaken at the Bajool Marble Mine by Omya Australia. Consequently, reference was drawn to the nearest and representative ambient air quality (NEPM) monitoring station operated and managed by EHP.
Background concentrations for PM10 and PM2.5 for calendar year 2016 were extracted from the South Gladstone monitoring station (Queensland Air Monitoring, 2016). The station is located in an industrial / residential area in the Gladstone region and has been operational since July 1992. The station measures ambient concentrations of NO2, SO2, PM10 and PM2.5.
Using the data from the South Gladstone monitoring station to determine the background concentrations is considered a conservative approach, as the monitoring station is located in an industrial environment as opposed to the mine and its surrounding area which is typically characterised as a range land / forest land environment (refer Figure 6).
No TSP monitoring is undertaken at the South Gladstone monitoring station. As no monitoring data is available either from the site or from the NEPM station, the annual average TSP background concentration has been determined assuming that the annual average TSP concentrations are twice the corresponding annual average PM10 concentrations.
Typically for air quality assessments in Queensland and Victoria, the 75th percentile value measured at the NEPM monitoring stations is adopted as the background concentration for 24-hour averaging pollutants. As-such, the 75th percentile value for the 24-hour average PM10 and PM2.5 concentrations recorded in 2016 at the South Gladstone NEPM station have been considered as the background concentrations for this assessment.
As per information from the EMP, on-site dust deposition monitoring is undertaken at the Bajool Marble Mine. However, Airlabs have been informed that the dust deposition monitors are located within the mining lease boundary, as-such, the deposited dust levels would not be reflective of the ambient deposited dust levels in the surrounding environment.
Consequently, to determine background deposited dust levels, reference has been drawn to similar air quality assessments undertaken by Airlabs in the past. A conservative background value of 2 g/m2/month (approximately. 60 mg/m2/day) (Heggies, 2010; Airlabs, 2017) has been adopted to determine the cumulative deposited dust levels at the identified sensitive receptors.

Airlabs Environmental Omya Australia, Bajool, QLD SEP17190.2 Air Quality Impact Assessment Report
Page: 28 of 59 Airlabs Environmental
A summary of the background air quality levels adopted for the assessment is presented in Table 6.
Table 6: Background Air Quality Levels Adopted for this Assessment
Pollutant Averaging Period
Adopted Background
Concentration Source / Reference
PM10 24-hours 17.7g/m3
75th percentile value measured at South Gladstone NEPM monitoring station in 2016
Annual 14.5 g/m3 Annual average concentration at South Gladstone NEPM monitoring station in 2016
PM2.5 24-hours 6.7g/m3
75th percentile value measured at South Gladstone NEPM monitoring station in 2016
Annual 5.6 g/m3 Annual average concentration at South Gladstone NEPM monitoring station in 2016
TSP Annual 29 g/m3 Assumed value – twice of the annual average PM10 concentrations (14.5 g/m3) at South Gladstone NEPM monitoring station in 2016
Deposited Dust Annual 60 mg/m2/day Assumed value from air quality assessments
similar to the Bajool Marble Mine
8. EMISSION ESTIMATION Sources associated with the existing and proposed operations that have the potential to generate dust emissions have been quantified with the aid of Emission Estimation Technique (EET) manuals.
Emissions have been quantified for TSP, PM10 and PM2.5 size fractions. Dust control measures (refer Section 4.1.5) currently implemented have been accounted for while developing the emissions inventory.
8.1 Fugitive Dust Sources – Existing Operations
Based on reviewing the existing operations undertaken at the Bajool Marble Mine (as outlined in Section 4.1), the activities / operations that have the potential to generate dust emissions include:
• Drilling and blasting emissions.
• Material transfer and handling activities (including excavator operations, loading and unloading materials from and to stockpiles, conveyor transfer and product loadout) across all the areas within the mine site.
• Primary crushing and screening operations (including the mobile crusher at the existing WREA)
• Emissions from milling at the stone dust plant.
• Heavy vehicle haulage – transporting raw, product and reject materials across all the areas of the mine.
• Wind erosion emissions from exposed areas and raw, product and reject stockpiles.
Dust control measures currently implemented by Omya Australia at the Bajool Marble Mine which have been accounted for while developing the emissions inventory include:
• Application of cyclone on the drill rig.
• Application of water sprays on exposed areas and stockpiles.
• Use of natural windbreaks to disrupt prevailing winds and minimise wind erosion of exposed areas and stockpiles.
• Enclosed conveyors in the stone dust plant area.
Airlabs Environmental Omya Australia, Bajool, QLD SEP17190.2 Air Quality Impact Assessment Report
Page: 29 of 59 Airlabs Environmental
• Enclosed milling operations, with baghouses fitted on the stone dust mill discharge vent along with filters on storage silo air vents. Due to the presence of the baghouse and filters, it is unlikely that there would be considerable amounts of particulate emissions released from the discharge vent and the storage silo air vents.
• Imposing speed restrictions (maximum limit of 40 km/hour) on major haul routes.
• Application of Level 1 watering (< 2L/m2/hour) with a dedicated water cart.
• Application of automated water sprays during crushing and screening operations, including mobile crusher at the existing WREA.
Additional information on the emission reduction factors applied for the dust control measures are presented in Appendix A.
8.2 Fugitive Dust Sources – Proposed Operations
As mentioned in Section 4.2, Omya Australia are proposing to expand the footprint of the existing WREA progressing towards the south (refer Figure 5).
The proposed operations allows for the reject material to be spatially distributed across the existing and the proposed footprint of the WREA.
Based on a review of the proposed operations, it is understood that the proposal only corresponds to an increase in the footprint (circa. 5 ha in addition to the existing WREA) and that there would be no change in the amount of reject material to be emplaced at the WREA.
Consequently, emissions from the proposed operations have been developed taking into account the increase in the footprint of the WREA and a modest increase in the haulage activity. All other activities / operations have been assumed to be similar to existing operations.
As the proposed operations would not comprise any new operations and are considered as an extension of existing operations, no additional dust control measures have been identified exclusive to the proposed operations. Additional information on the emission reduction factors applied for the dust control measures are presented in Appendix A
8.3 Dust Emissions Inventory – Existing and Proposed Operations
Reference has been drawn to the following EET manuals to determine fugitive dust emisisons from the identified activities / operations for both existing and proposed operations.
• National Pollutant Inventory (NPI), Emission Estimation Technique Manual for Mining, Version 3.1, Australian Government – Department of Sustainability, Environment, Water, Population & Communities, January 2012 (NPI, 2012).
• AP-42 Emission Factors, Chapter 11.19.2 Crushed Stone Processing and Pulverised Mineral
Processing, United States Environmental Protection Agency (US-EPA 2004).
• AP-42 Emission Factors, Chapter 13.2.2 Unpaved Roads, United States Environmental Protection Agency (US-EPA 2006 (a)).
• AP-42 Emission Factors, Chapter 13.2.4 Aggregate Handling and Storage Piles, United States Environmental Protection Agency (US-EPA 2006 (b)); and
• AP-42 Emission Factors, Chapter 13.2.5 Industrial Wind Erosion, United States Environmental Protection Agency (US-EPA 2006 (c)).
Emission rates have been quantified based on emission factors corresponding to specific operational activities referenced from the above EET manuals, production volumes / throughputs – as mentioned in Section 4.1.1, estimation of vehicle kilometres travelled (vkt) and footprint of exposed areas and stockpiles. Emission reduction factors have been applied for existing and proposed control measures in developing the emissions inventory.

Airlabs Environmental Omya Australia, Bajool, QLD SEP17190.2 Air Quality Impact Assessment Report
Page: 30 of 59 Airlabs Environmental
TSP, PM10 and PM2.5 annual emission rates estimated for existing and proposed operations at the Bajool Marble Mine are summarised in Table 7 and Table 8 respectively. A visual comparison of the estimated annual emission rates for existing and proposed operations is presented in Figure 9.
The contribution of key sources to annual TSP, PM10 and PM2.5 emissions for existing and proposed operations is illustrated in Figure 10, Figure 11 and Figure 12 respectively.
As the proposed operations are relate to only the WREA, an illustrative comparison between existing and proposed TSP, PM10 and PM2.5 emissions generated from WREA is presented in Figure 13.
Table 7: Annual TSP, PM10 and PM2.5 Emissions Inventory – Existing Operations
Activity / Source TSP
Emissions (kg/year)
PM10 Emissions (kg/year)
PM2.5 Emissions (kg/year)
Drilling 307 161 9.2
Blasting 434 226 13.0 Material transfers / handling (including loading, excavator operations, loading and unloading materials from and to stockpiles, conveyor transfer and product loadout)
1,865 882 134
Primary crushing, screening (including mobile screening at WREA) and milling operations at the stone dust plant 591 220 25
Heavy vehicle haulage 33,918 9,645 965 Wind erosion – exposed areas and stockpiles (ROM, product and reject) 10,494 5,247 787
Total Emissions 47,609 16,380 1,933
Table 8: Annual TSP, PM10 and PM2.5 Emissions Inventory – Proposed Operations (incl. Existing)
Activity / Source TSP
Emissions (kg/year)
PM10 Emissions (kg/year)
PM2.5 Emissions (kg/year)
Drilling 307 161 9.2
Blasting 434 226 13.0 Material transfers / handling (including loading, excavator operations, loading and unloading materials from and to stockpiles, conveyor transfer and product loadout)
1,865 882 134
Primary crushing, screening (including mobile screening at WREA) and milling operations at the stone dust plant 591 220 25
Heavy vehicle haulage 34,752 9,882 988 Wind erosion – exposed areas and stockpiles (ROM, product and reject) 17,992 8,996 1,349
Total Emissions 55,941 20,367 2,518

Airlabs Environmental Omya Australia, Bajool, QLD SEP17190.2 Air Quality Impact Assessment Report
Page: 31 of 59 Airlabs Environmental
Figure 9: Comparison of Annual TSP, PM10 and PM2.5 Emissions – Existing and Proposed Operations – All Sources
Airlabs Environmental Omya Australia, Bajool, QLD SEP17190.2 Air Quality Impact Assessment Report
Page: 32 of 59 Airlabs Environmental
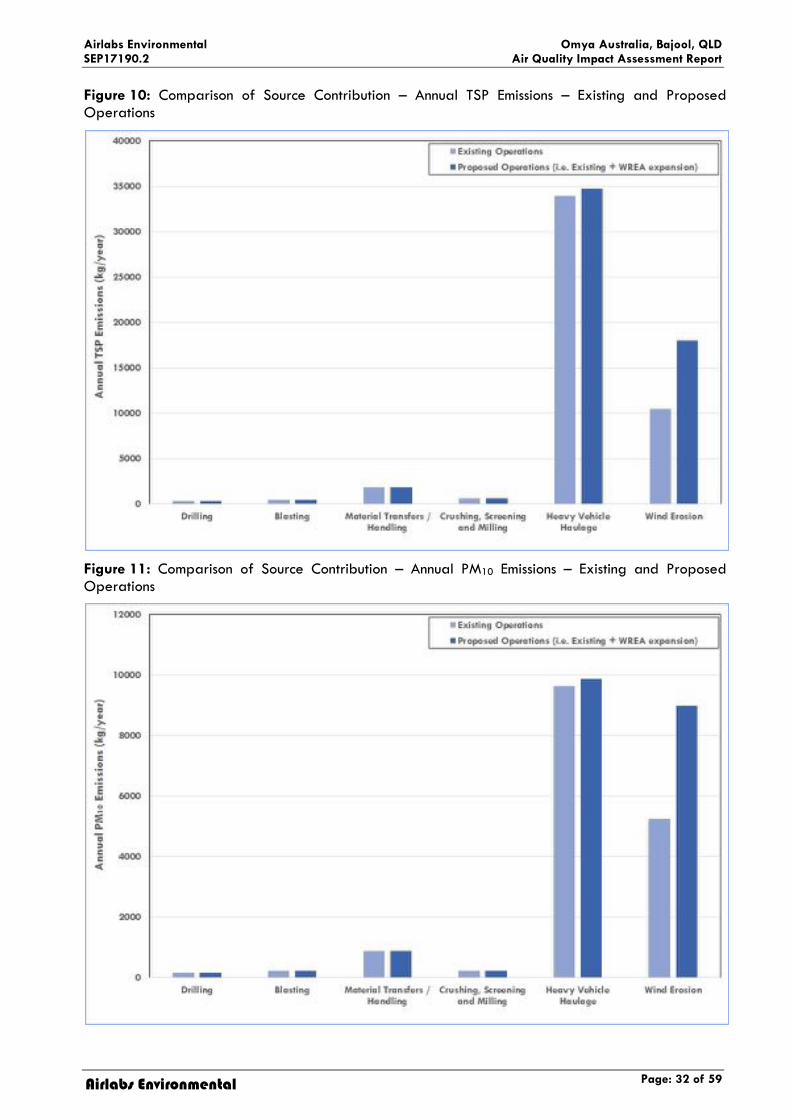
Figure 10: Comparison of Source Contribution – Annual TSP Emissions – Existing and Proposed Operations
Figure 11: Comparison of Source Contribution – Annual PM10 Emissions – Existing and Proposed Operations

Airlabs Environmental Omya Australia, Bajool, QLD SEP17190.2 Air Quality Impact Assessment Report
Page: 33 of 59 Airlabs Environmental
Figure 12: Comparison of Source Contribution – Annual PM2.5 Emissions – Existing and Proposed Operations
Figure 13: Comparison of Annual TSP, PM10 and PM2.5 Emissions for Existing and Proposed Operations at WREA
From the estimated emissions, the following observations are made:

Airlabs Environmental Omya Australia, Bajool, QLD SEP17190.2 Air Quality Impact Assessment Report
Page: 34 of 59 Airlabs Environmental
• Compared to existing operations, there is an increase in the annual TSP (circa 17%), PM10 (circa 24%) and PM2.5 (circa 30%) emissions estimated for the proposed operations.
• For both – existing and proposed operations, heavy vehicle haulage followed by wind erosion of exposed areas and stockpiles have been identified as the primary dust generating sources for all the assessed size fractions -. i.e. TSP, PM10 and PM2.5 as observed from Figure 10 to Figure 12.
• By comparing the existing and proposed annual TSP, PM10 and PM2.5 emissions by source type as shown in Figure 10, Figure 11 and Figure 12 respectively, it is noted that the difference in the estimated emissions for all the size fractions is observed only for – heavy vehicle haulage and wind erosion sources. As the proposal only incorporates the expansion of the existing WREA footprint with no changes to the current activities and material throughputs, wind erosion of exposed areas and stockpiles and a modest increase in heavy vehicle haulage activity are considered to be the likely sources of dust emissions exclusive to the proposal.
8.4 Dust Emissions – Construction Phase
For the proposed expansion of the WREA, there might be some construction phase activities (e.g. land clearing etc.) which may generate dust emissions. However, when compared to operational activities, construction activities would occur only for a limited period of time and consequently the dust generating sources would also be temporary and short-term in nature.
Therefore, owing to the transient and temporary nature of any potential construction activities, it is very unlikely that they would have a significant impact on the surrounding environment and therefore have been excluded from this assessment.
9. METEOROLOGICAL MODELLING 9.1 Assessment Methodology
Meteorological mechanisms govern the generation, dispersion, transformation and eventual removal of pollutants from the atmosphere. The local meteorology at the site plays a significant role in understanding the pollutant transport and dispersion mechanisms, and in order to adequately characterise the local meteorological conditions, information is needed on key parameters such as prevailing wind regime, mixing depth, atmospheric stability, ambient temperatures, rainfall and relative humidity. The following sections outline the methodology for characterising the meteorological conditions at the Bajool Marble Mine site.
Meteorological modelling was conducted using a combination of ‘The Air Pollution Model (TAPM) (Version 4) and CALMET meteorological models.
9.2 TAPM
For this modelling assessment, the meteorological model ‘The Air Pollution Model (TAPM) (Version 4.0.5)’ was used to generate the prognostic output. TAPM, developed by the Commonwealth Scientific and Industrial Research Organisation (CSIRO) is a prognostic model which is used to predict three-dimensional meteorological data and air pollution concentrations. TAPM allows users to generate synthetic observations by referencing in-built databases (e.g. terrain information, synoptic scale meteorological observations, vegetation and soil type etc.) which are subsequently used in generating site-specific hourly meteorological data (Hurley P.J., 2008).
Technical details of the model equations, parameterisations and numerical methods are described in the Hurley (2008).
Details of the TAPM model configuration are outlined in Table 9.

Airlabs Environmental Omya Australia, Bajool, QLD SEP17190.2 Air Quality Impact Assessment Report
Page: 35 of 59 Airlabs Environmental
Table 9: TAPM Model Configuration
Parameter Value
Year of Analysis 2012 to 2016 (01/01/2012 to 31/12/2016)
Grid Centre Coordinates (latitude, Longitude) (degree) -23deg -48.5min, 150deg 39.0min
Number of grids (spacing) 4 (30km, 10km, 3km, 1km)
Grid dimensions (nx, ny, nz) 25, 25, 25
9.3 CALMET
CALMET (version 6.4.0) was used to derive higher resolution meteorological fields at 150 m resolution over a 15-km x 15-km modelling domain centred over the Bajool Marble Mine site. CALMET was run in no-observations (NO-OBS) mode with prognostic output from TAPM used as an input to the CALMET model.
The CALMET model settings were in general accordance with the NSW - Environment Protection Agency (NSW-EPA) (formerly Office of Environment and Heritage – OEH) ‘Generic Guidance and Optimum
Settings for the CALPUFF Modelling System for Inclusion into the ‘Approved Methods for the Modelling and Assessment of Air Pollutants in NSW, Australia’ (OEH, 2011).
Details of the CALMET model configuration are outlined in Table 10.
Table 10: CALMET Model Configuration
Parameter Value
Year of Analysis 2012 to 2016
No. X Grid Cells (NX), No. Y Grid Cells (NY) 101,101
Grid spacing (DGRIDKM) (km) 0.15
XORIG (km), YORIG (km) 253.353, 7357.138
No. of Vertical Levels 10
Meteorological Data Option NO-OBS
Upper Air and Surface Data TAPM generated MM4/MM5/3D
Geophysical Datasets Aerial imagery generated (land use) &
SRTM3 (terrain)
The geophysical dataset for CALMET contains terrain and land use information for the modelling domain. For this assessment, terrain data for the CALMET grid was extracted from 1- arc second (30m) spaced elevation data obtained via NASA’s Shuttle Radar Topography Mission (SRTM) in 2000 (downloaded from USGS website). The land use or land cover data for the modelling domain was derived manually from aerial imagery. The geotechnical parameters for the land use classification were adopted from the default CALMET corresponding land use categories.
Manually generated land-use at 150m grid resolution overlaid on aerial imagery over a 15km x 15km domain is illustrated in Figure 6 and a 3-dimensional representation of the topographical features surrounding the mine site over a 2km x 3km domain is illustrated in Figure 7.
9.4 Modelled Meteorology
Hourly wind speeds and direction for calendar year 2012 to 2016 were extracted from the CALMET output at the centre of the mine site and are visually presented in the form of wind roses in Figure 14.

Airlabs Environmental Omya Australia, Bajool, QLD SEP17190.2 Air Quality Impact Assessment Report
Page: 36 of 59 Airlabs Environmental
Annual wind roses for each of the modelled five years (2012 to 2016) show winds predominantly from the south-southeast and southeast sectors. Inter-annual wind roses in Figure 14 show good agreeability over the modelled five years. Calm wind conditions (wind speeds less than 0.5 m/sec) ranged between 2% to 3.1% over the modelled five years from 2012 to 2016, further corroborating the similarity between the modelled years.

Airlabs Environmental Omya Australia, Bajool, QLD SEP17190.2 Air Quality Impact Assessment Report
Page: 37 of 59 Airlabs Environmental
Figure 14: CALMET Predicted Wind Rose – Five Years (2012 to 2016)
2016 - CALMET
2015 - CALMET
2014 - CALMET

Airlabs Environmental Omya Australia, Bajool, QLD SEP17190.2 Air Quality Impact Assessment Report
Page: 38 of 59 Airlabs Environmental
2013 - CALMET
2012 – CALMET
The comparison of the annual wind roses for the five modelled years (2012 to 2016) demonstrate similarity and good aggregability in the wind profile, therefore the latest available meteorological year – 2016 was selected for the dispersion modelling.
Stability of the atmosphere is determined by a combination of horizontal turbulence caused by the wind and vertical turbulence caused by the solar heating of the ground surface. Stability cannot be measured directly; instead, it must be inferred from available data, either measured or numerically simulated.
The Pasquill-Gifford scale defines stability on a scale from A to G, with stability class A being the least stable, occurring during strong daytime sun and stability class G being the most stable condition, occurring during low wind speeds at night. For any given wind speed, the stability category may be characterised by two or three categories depending on the time of day and the amount of cloud present. In meteorological models such as CALMET, the stability classes F and G are combined.
A summary of the numerically simulated hourly stability class data using CALMET for the selected meteorological year (i.e. 2016) is presented in Figure 15. A higher frequency (40%) of stability class F was predicted by CALMET.
Figure 15: Frequency of Stability Class – Annual 2016 CALMET

Airlabs Environmental Omya Australia, Bajool, QLD SEP17190.2 Air Quality Impact Assessment Report
Page: 39 of 59 Airlabs Environmental
The mixing height quantifies the vertical height of mixing in the atmosphere and is a modelled parameter that cannot be measured directly. The mixing height decreases in the late afternoon, particularly after sunset, due to the change from surface heating from the sun to a net heat loss overnight. Low mixing heights typically translate to stagnant air with little vertical motion, while high mixing heights allow vertical mixing and good dispersion of pollutants.
CALMET simulated hourly mixing height data (CALMET) are presented in in Figure 16 for the modelled year - 2016.
Figure 16 shows the mixing height as a function of the hour of the day at the Bajool Marble Mine site. The graph represents the typical growth of the boundary layer, whereby the mixing height is generally lowest during the night and into the early morning and highest during the late afternoon.
Figure 16: CALMET Predicted Diurnal Variations in Mixing Heights – 2016
10. DISPERSION MODELLING To model the emissions estimated for existing (refer Table 7) and proposed (refer Table 8) operations and to predict impacts at the identified sensitive receptors (refer Table 4), dispersion modelling was undertaken using the US-EPA CALPUFF dispersion model.
CALPUFF is the dispersion model that calculates the dispersion of plumes within the three-dimensional (3D) meteorological field calculated by CALMET. CALPUFF is a non-steady state US-EPA approved dispersion model, which “advects” puffs of material emitted from modelled sources, simulating dispersion and transformation processes along the way. In doing so, it typically uses the wind fields generated by CALMET. Temporal and spatial variations in the meteorological fields selected are explicitly incorporated in the resulting distribution of puffs throughout a simulation period (SRC, 2011).
The CALPUFF model domain was set up as a sub-set of the CALMET model domain, with a computational grid spanning 9-km x 9-km centred at the mine site. The sampling grid had a similar resolution as the computational grid, with a grid spacing of 150m (using a nesting factor of 1). Additionally, ground level concentrations were also predicted at the identified sensitive receptors (refer Table 4).
Sources associated with existing and proposed operations (refer Table 7 and Table 8) were represented in the CALPUFF model as volume-sources. Sources related to quarrying operations were modelled between 6AM – 6PM, Monday to Sunday, whereas the operations at the processing plant,

Airlabs Environmental Omya Australia, Bajool, QLD SEP17190.2 Air Quality Impact Assessment Report
Page: 40 of 59 Airlabs Environmental
stone dust plant, heavy vehicle haulage and wind erosion emissions were modelled as ‘continuous’ sources i.e. releasing emissions all year round – 24 hours x 365 days.
With regards to blasting, Airlabs have been advised by Omya Australia that typically there would be about 5 blasts per annum. However, for the purpose of modelling, it has been assumed that there would be 12 blasts per annum, which is well over the actual blast frequency.
All other CALPUFF model settings were referenced from the ‘Generic Guidance and Optimum Model
Settings for the CALPUFF Modelling System for Inclusion into the Approved Methods for the Modelling
and Assessments of Air Pollutants in NSW, Australia’ (NSW-OEH, 2011).
11. PREDICTED IMPACTS The predicted ground-level concentrations of TSP, PM10, PM2.5 and dust deposition rates at the nearest sensitive receptors for the existing and the proposed operations are discussed below.
11.1 Predicted Impacts – Existing Operations
Predicted ground-level concentrations of TSP, PM10, PM2.5 and dust deposition rates at the nearest sensitive receptors for the existing operations are summarised in Table 11.
From the modelling of the existing operations, the following observations are made:
• TSP concentrations: Predicted annual average cumulative TSP concentrations at all the identified sensitive receptors (R1 – R3) comply with the assessment criteria of 90 g/m3. The maximum predicted cumulative concentration is 29. 47 g/m3 at R2, which is around 33% of the assessment criteria, of which the contribution from Omya Australia (incremental concentration) is about 2%.
• PM10 concentrations: Predicted maximum 24-hour average cumulative PM10 concentrations at all the identified sensitive receptors (R1 – R3) comply with the assessment criteria of 50 g/m3. The maximum predicted cumulative concentration is 20.86 g/m3 at R2, which is around 42% of the assessment criteria, of which the contribution from Omya Australia (incremental concentration) is about 15%.
• PM2.5 concentrations (Annual average): Predicted annual average cumulative PM2.5 concentrations at all the identified sensitive receptors (R1 – R3) comply with the assessment criteria of 8 g/m3. The maximum predicted cumulative concentration is 5.76 g/m3 at R2, which is around 72% of the assessment criteria, of which the contribution from Omya Australia (incremental concentration) is about 1%.
• PM2.5 concentrations (24-hour average): Predicted maximum 24-hour average cumulative PM2.5 concentrations at all the identified sensitive receptors (R1 – R3) comply with the assessment criteria of 25 g/m3. The maximum predicted cumulative contribution is 7.12 g/m3 at R2, which is around 28% of the assessment criteria, of which the contribution from Omya Australia (incremental concentration) is about 6%.
• Deposited dust levels: Predicted monthly average cumulative deposited dust levels at all the identified sensitive receptors (R1 – R3) comply with the assessment criteria of 120 mg/m2/day. The maximum predicted cumulative deposited dust level is 63.26 mg/m2/day, which is around 53% of the assessment criteria, of which the contribution from Omya Australia is about approximately 5%
Incremental (Omya Australia contribution) and cumulative concentration isopleths for TSP, PM10, PM2.5 and deposited dust for the existing operations are presented in Appendix B.

Airlabs Environmental Omya Australia, Bajool, QLD SEP17190.2 Air Quality Impact Assessment Report
Page: 41 of 59 Airlabs Environmental
Table 11: Predicted Impacts at Identified Sensitive Receptors – Existing Operations
Pollutant Averaging Period
Assessment Criteria (µg/m3)
Background (µg/m3)
Predicted Incremental Concentration (µg/m3)
Predicted Cumulative Concentration (µg/m3)
R1 R2 R3 R1 R2 R3
TSP Annual 90 29.0 0.06 0.47 0.09 29.0 29.47 29.09
PM10 24-Hour 50 17.7 0.54 3.16 0.71 18.24 20.86 18.41
PM2.5 Annual 8 5.7 0.01 0.06 0.02 5.71 5.76 5.72
24-Hour 25 6.7 0.06 0.42 0.19 6.76 7.12 6.89
Predicted Deposited Dust Levels (mg/m2/day)
Deposited Dust Monthly 120 mg/m2/day 60 mg/m2/day 0.37 3.26 0.69 60.37 63.26 60.69

Airlabs Environmental Omya Australia, Bajool, QLD SEP17190.2 Air Quality Impact Assessment Report
Page: 42 of 59 Airlabs Environmental
11.2 Predicted Impacts – Proposed Operations
Predicted ground-level concentrations of TSP, PM10, PM2.5 and dust deposition rates at the nearest sensitive receptors for the existing operations are summarised in Table 12.
From the modelling of the existing operations, the following observations are made:
• TSP concentrations: Predicted annual average cumulative TSP concentrations at all the identified sensitive receptors (R1 – R3) comply with the assessment criteria of 90 g/m3. The maximum predicted cumulative concentration is 29. 70 g/m3 at R2, which is around 33% of the assessment criteria, of which the contribution from Omya Australia (incremental concentration) is about 2%.
• PM10 concentrations: Predicted maximum 24-hour average cumulative PM10 concentrations at all the identified sensitive receptors (R1 – R3) comply with the assessment criteria of 50 g/m3. The maximum predicted cumulative concentration is 21.46 g/m3 at R2, which is around 43% of the assessment criteria, of which the contribution from Omya Australia (incremental concentration) is about 18%.
• PM2.5 concentrations (Annual average): Predicted annual average cumulative PM2.5 concentrations at all the identified sensitive receptors (R1 – R3) comply with the assessment criteria of 8 g/m3. The maximum predicted cumulative concentration is 5.78 g/m3 at R2, which is around 72% of the assessment criteria, of which the contribution from Omya Australia (incremental concentration) is about 1.3%.
• PM2.5 concentrations (24-hour average): Predicted maximum 24-hour average cumulative PM2.5 concentrations at all the identified sensitive receptors (R1 – R3) comply with the assessment criteria of 25 g/m3. The maximum predicted cumulative contribution is 7.23 g/m3 at R2, which is around 29% of the assessment criteria, of which the contribution from Omya Australia (incremental concentration) is about 7%.
• Deposited dust levels: Predicted monthly average cumulative deposited dust levels at all the identified sensitive receptors (R1 – R3) comply with the assessment criteria of 120 mg/m2/day. The maximum predicted cumulative deposited dust level is 64.58 mg/m2/day, which is around 54% of the assessment criteria, of which the contribution from Omya Australia is about 7%
Incremental (Omya Australia contribution) and cumulative concentration isopleths for TSP, PM10, PM2.5 and deposited dust for the existing operations are presented in Appendix B.

Airlabs Environmental Omya Australia, Bajool, QLD SEP17190.2 Air Quality Impact Assessment Report
Page: 43 of 59 Airlabs Environmental
Table 12: Predicted Impacts at Identified Sensitive Receptors – Proposed Operations
Pollutant Averaging Period
Assessment Criteria (µg/m3)
Background (µg/m3)
Predicted Incremental Concentration (µg/m3)
Predicted Cumulative Concentration (µg/m3)
R1 R2 R3 R1 R2 R3
TSP Annual 90 29.0 0.07 0.70 0.11 29.07 29.70 29.11
PM10 24-Hour 50 17.7 0.58 3.76 0.85 18.28 21.46 18.55
PM2.5 Annual 8 5.7 0.01 0.08 0.02 5.71 5.78 5.72
24-Hour 25 6.7 0.08 0.53 0.23 6.78 7.23 6.93
Predicted Deposited Dust Levels (mg/m2/day)
Deposited Dust Monthly 120 mg/m2/day 60 mg/m2/day 0.45 4.58 0.84 60.45 64.58 60.84

Airlabs Environmental Omya Australia, Bajool, QLD SEP17190.2 Air Quality Impact Assessment Report
Page: 44 of 59 Airlabs Environmental
From the results summarised in Table 11 and Table 12, it is noted that modelled pollutants for both the existing and proposed operations comply with the relevant assessment criteria.
From the modelling, it is observed that there is a noticeable increase in the predicted concentrations for the proposed operations – especially for receptor R2, as the proposed expansion of the WREA is in the direction of that receptor.
11.3 Recommendations
Dispersion modelling of existing and proposed operations have been based on the production volumes (refer Section 4.1.1 and Section 4.2) and the reductions achieved in the emissions due to the dust control measures listed in Section 4.2.
Airlabs recommends that the current proactive and reactive dust control measures should be diligently implemented at all times to effectively manage and mitigate release of dust emissions from the various operational activities at the site. The measures should be periodically reviewed to ensure that they are achieving their intended purpose / objectives.
Measures should be managed and maintained, such that there is no breach of the Environmental Authority: EPML00657813 condition A1 at any given time, which states that the holder of this
environmental authority must ensure that all reasonable and feasible avoidance and mitigation measures
are employed so that the dust and particulate matter emissions generated by the mining activities do not
cause exceedance of the 120 mg/m2/day dust deposition value, when measured at any sensitive or
commercial place.
12. CONCLUSION Airlabs was commissioned by Omya Australia to undertake an air quality impact assessment for their marble mine operations located at 1879 South Ulam Road, Bajool, Queensland.
Omya Australia has been operating the Bajool Marble Mine since 1980, principally to produce high purity crushed marble. The mine is located circa. 17km south of the village of Bajool, midway between Rockhampton and Gladstone in Central Queensland.
The air quality assessment would form a part of a major amendment application to include the existing operations under ERA 33. Additionally, Omya Australia are proposing to expand their existing WREA and this assessment aims to quantify the increase in air quality impacts resulting from the proposed expansion.
In summary, the objectives of this assessment were:
• Quantification of air quality impacts from the mine’s existing operational activities as a part of a major amendment application to include the mine’s operations under ERA 33 (assessment of existing operations).
• Determination of air quality impacts resulting from the proposed expansion of the WREA (assessment of proposed operations).
Airborne particulate matter (dust) emissions from the existing and proposed operations were estimated based on the mine’s operational activities, production volumes and dust control measures currently implemented.
To determine air quality impacts from the existing operations and proposed operations, air dispersion modelling was conducted using the US-EPA approved CALPUFF dispersion model.
From the modelling undertaken, the following observations have been made:
• Modelling of dust emissions from the existing operations show that the predicted ground level TSP, PM10, PM2.5 and deposited dust levels at identified sensitive receptors are well below the relevant assessment criteria.

Airlabs Environmental Omya Australia, Bajool, QLD SEP17190.2 Air Quality Impact Assessment Report
Page: 45 of 59 Airlabs Environmental
• Modelling of dust emissions from the proposed operations (i.e. existing + expansion of the WREA) show that the predicted ground level TSP, PM10, PM2.5 and deposited dust levels at identified sensitive receptors are well below the relevant assessment criteria.
Though modelling demonstrates compliance with the assessment criteria for both existing and proposed operations, Airlabs recommends that the existing dust control measures should be diligently implemented at all times to effectively manage and mitigate release of dust emissions from the various operational activities at the site. The measures should be periodically reviewed to ensure that they are achieving their intended purpose / objectives.

Airlabs Environmental Omya Australia, Bajool, QLD SEP17190.2 Air Quality Impact Assessment Report
Page: 46 of 59 Airlabs Environmental
13. BIBLIOGRAPHY
Airlabs (2017): Proposed Resource Recovery Facility – South Nowra, NSW, Air Quality Assessment, Cowman Stoddart Pty Ltd, April 2017
Environmental Authority EPML 00657813 – Permit Environmental Protection Act 1994, Department of Environment and Heritage Protection, QLD Government, 17 January 2017
Environmental Management Plan: Bajool Marble Mine, Omya Australia Pty Ltd, Version 1.0, 24 March 2017
EPA Act: Environmental Protection Act 1994, Queensland Legislation – Queensland Government, o3 July 2017
EHP Guideline – Activities with impacts to air: Guideline, Application requirements for activities with impacts to air, Version 4.00, 06 March 2017 (ESR/2015/1840)
EHP Guideline (Mining) – Model mining conditions: Guideline, Model mining conditions, Version 6.01, 07 March 2017 (ESR/2016/1936)
EPP Air (2008): Environmental Protection (Air) Policy 2008, Environmental Protection Act 1994, Current as at 08 July 2016
Heggies (2010): Oberon White Granite Quarry, Air Quality Assessment, Mudgee Stone Company Pty Ltd, Heggies Pty Ltd, August 2010
Hurley P.J. (2008): TAPM V4. Part 1: Technical Description, CSIRO Marine and Atmospheric Research Paper No. 25
NEPM (1998): National Environment Protection Measure for Ambient Air Quality. National Environment Protection Council.
NEPM (2011): National Environmental Protection (Air Toxics) Measure. National Environmental Protection Council
NPI (2012): Emission Estimation Technique Manual for Mining, Version 3.1, Australian Government – Department of Sustainability, Environment, Water, Population & Communities, January 2012
NSW Coal Mining Benchmarking Study: NSW Coal Mining Benchmark Study: International Best Practice Measures to Prevent and / or Minimise Emissions of Particulate Matter from Coal Mining, Report No: KE1006953, Prepared by Katestone Environmental Pty Ltd, June 2011
NSW-EPA (2017): Approved Methods for the Modelling and Assessment of Air Pollutants in New South Wales, NSW- Environment Protection Authority, EPA 2016/0666, January 2017
NSW-OEH (2011): Generic Guidance and Optimum Model Settings for the CALPUFF Modelling System for Inclusion into the ‘Approved Methods for the Modelling and Assessments of Air Pollutants in NSW, Australia
Plan of Operations: Bajool Marble Mine, 2014 to 2019, Environmental Authority EPML00657813 (formerly MIM800074702), Omya Australia Pty Ltd
Queensland Air Monitoring (2016): Queensland Air Monitoring 2016 – National Environment Protection (Ambient Air Quality) Measure, Air Quality Monitoring, Science Delivery Division, Department of Science, Information, Technology and Innovation, Queensland Government, May 2017

Airlabs Environmental Omya Australia, Bajool, QLD SEP17190.2 Air Quality Impact Assessment Report
Page: 47 of 59 Airlabs Environmental
SLR (2011): Teralba Quarry Extensions, Air Quality Assessment, Metromix Pty Ltd, SLR Consulting Pty Ltd, November 2011
Standard Operating Procedure (BJ – SOP – 009 Dust Control): Standard Operating Procedure, Dust Control, Version No. 1, May 2012, Omya Australia Pty Ltd.
SRC (2000): A User’s Guide for the CALMET Meteorological Model
SRC (2011): CALPUFF Modeling System Version 6 User Instructions, April 2011
SRTM (2000): Shuttle Radar Topography Mission SRTM 1 Arc-Second Global data, downloaded from USGS website.
US-EPA (2004) United States Environmental Protection Agency AP-42 Emission Factors – Chapter 11.19.2 Crushed Stone Processing and Pulverised Mineral Processing
US-EPA (2006(a)) United States Environmental Protection Agency AP-42 Emission Factors – Chapter 13.2.2 Unpaved Roads
US-EPA (2006(b)) United States Environmental Protection Agency AP-42 Emission Factors – Chapter 13.2.4 Aggregate Handling and Storage Piles
US-EPA (2006(c)) United States Environmental Protection Agency AP-42 Emission Factors – Chapter 13.2.5 Industrial Wind Erosion

Airlabs Environmental Omya Australia, Bajool, QLD SEP17190.2 Air Quality Impact Assessment Report
Page: 48 of 59 Airlabs Environmental
APPENDIX A Emission Reduction Factors

Airlabs Environmental Omya Australia, Bajool, QLD SEP17190.2 Air Quality Impact Assessment Report
Page: 49 of 59 Airlabs Environmental
Table A-1: Control Measures and Corresponding Emission Reduction Factors
Dust Control Measure Emission Reduction Efficiency
Reference
Application of cyclone on the drill rig 80%
NSW Coal Mining Benchmarking Study:
International Best Practice Measures to Prevent
and / or Minimise Emissions of Particulate Matter
from Coal Mining, Report No: KE1006953, June 2011, Katestone Environmental Pty Ltd
Application of water sprays on exposed areas and stockpiles 50%
National Pollutant Inventory (NPI), Emission
Estimation Technique Manual for Mining, Version 3.1, Australian Government – Department of Sustainability, Environment, Water, Population & Communities, January 2012
Use of natural windbreaks to disrupt prevailing winds and minimise wind erosion of exposed areas and stockpiles
30%
National Pollutant Inventory (NPI), Emission
Estimation Technique Manual for Mining, Version 3.1, Australian Government – Department of Sustainability, Environment, Water, Population & Communities, January 2012
Enclosed conveyors in the stone dust plant area 70%
National Pollutant Inventory (NPI), Emission
Estimation Technique Manual for Mining, Version 3.1, Australian Government – Department of Sustainability, Environment, Water, Population & Communities, January 2012
Enclosed milling operations 99% (a)
National Pollutant Inventory (NPI), Emission
Estimation Technique Manual for Mining, Version 3.1, Australian Government – Department of Sustainability, Environment, Water, Population & Communities, January 2012
Imposing speed restrictions (maximum limit of 40 km/hour) on major haul routes
44% (b) Teralba Quarry Extensions, Air Quality Assessment, Metromix Pty Ltd, Report Prepared by: SLR Consulting Pty Ltd, November 2011
Application of Level 1 watering (< 2L/m2/hour) with a dedicated water cart
50% (b)
National Pollutant Inventory (NPI), Emission
Estimation Technique Manual for Mining, Version 3.1, Australian Government – Department of Sustainability, Environment, Water, Population & Communities, January 2012
Application of automated water sprays during crushing and screening operations, including mobile crusher at the existing WREA
50%
National Pollutant Inventory (NPI), Emission
Estimation Technique Manual for Mining, Version 3.1, Australian Government – Department of Sustainability, Environment, Water, Population & Communities, January 2012
(a) 99% emission reduction achievable for enclosure and use of fabric filters
(b) For haulage – combined control efficiency applied. The combined control efficiency is multiplicative. For example, if water sprays are used in
conjunction with wind breaks, the resultant emissions will be (1-0.5) x (1-0.3) = 0.35 of the uncontrolled emissions (65% efficiency)

Airlabs Environmental Omya Australia, Bajool, QLD SEP17190.2 Air Quality Impact Assessment Report
Page: 50 of 59 Airlabs Environmental
APPENDIX B Concentration Isopleths

Airlabs Environmental Omya Australia, Bajool, QLD SEP17190.2 Air Quality Impact Assessment Report
Page: 51 of 59 Airlabs Environmental
Figure B-1: Predicted Annual Average TSP Incremental Concentrations (g/m3) – Existing Operations
Figure B-2: Predicted Annual Average TSP Cumulative Concentrations (g/m3) – Existing Operations (Assessment Criteria: 90 g/m3)
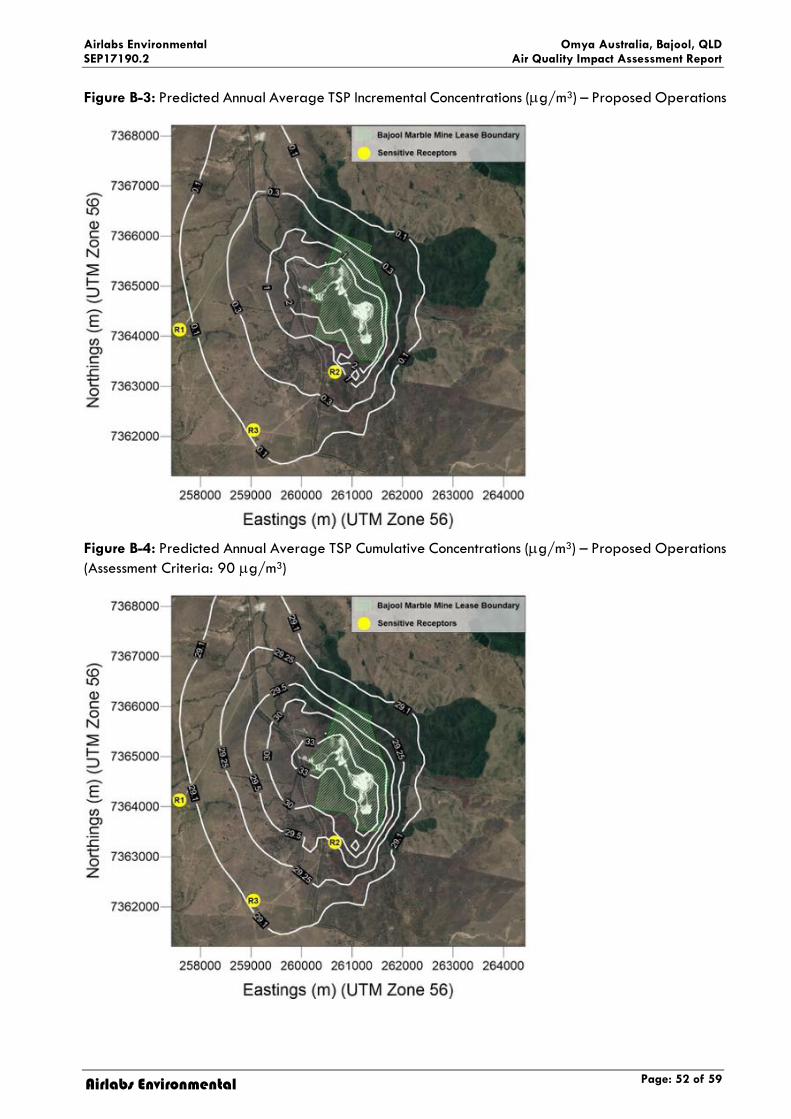
Airlabs Environmental Omya Australia, Bajool, QLD SEP17190.2 Air Quality Impact Assessment Report
Page: 52 of 59 Airlabs Environmental
Figure B-3: Predicted Annual Average TSP Incremental Concentrations (g/m3) – Proposed Operations
Figure B-4: Predicted Annual Average TSP Cumulative Concentrations (g/m3) – Proposed Operations (Assessment Criteria: 90 g/m3)

Airlabs Environmental Omya Australia, Bajool, QLD SEP17190.2 Air Quality Impact Assessment Report
Page: 53 of 59 Airlabs Environmental
Figure B-5: Predicted Maximum 24-Hour Average PM10 Incremental Concentrations (g/m3) – Existing Operations
Figure B-6: Predicted Maximum 24-Hour Average PM10 Cumulative Concentrations (g/m3) – Existing Operations (Assessment Criteria: 50 g/m3)

Airlabs Environmental Omya Australia, Bajool, QLD SEP17190.2 Air Quality Impact Assessment Report
Page: 54 of 59 Airlabs Environmental
Figure B-7: Predicted Maximum 24-Hour Average PM10 Incremental Concentrations (g/m3) – Proposed Operations
Figure B-8: Predicted Maximum 24-Hour Average PM10 Cumulative Concentrations (g/m3) – Proposed Operations (Assessment Criteria: 50 g/m3)

Airlabs Environmental Omya Australia, Bajool, QLD SEP17190.2 Air Quality Impact Assessment Report
Page: 55 of 59 Airlabs Environmental
Figure B-9: Predicted Annual Average PM2.5 Incremental Concentrations (g/m3) – Existing Operations
Figure B-10: Predicted Annual Average PM2.5 Cumulative Concentrations (g/m3) – Existing Operations (Assessment Criteria: 8 g/m3)

Airlabs Environmental Omya Australia, Bajool, QLD SEP17190.2 Air Quality Impact Assessment Report
Page: 56 of 59 Airlabs Environmental
Figure B-11: Predicted Annual Average PM2.5 Incremental Concentrations (g/m3) – Proposed Operations
Figure B-12: Predicted Annual Average PM2.5 Cumulative Concentrations (g/m3) – Proposed Operations (Assessment Criteria: 8 g/m3)

Airlabs Environmental Omya Australia, Bajool, QLD SEP17190.2 Air Quality Impact Assessment Report
Page: 57 of 59 Airlabs Environmental
Figure B-13: Predicted Maximum 24-Hour Average PM2.5 Incremental Concentrations (g/m3) – Existing Operations
Figure B-14: Predicted Maximum 24-Hour Average PM2.5 Cumulative Concentrations (g/m3) – Existing Operations (Assessment Criteria: 25 g/m3)

Airlabs Environmental Omya Australia, Bajool, QLD SEP17190.2 Air Quality Impact Assessment Report
Page: 58 of 59 Airlabs Environmental
Figure B-15: Predicted Maximum 24-Hour Average PM2.5 Incremental Concentrations (g/m3) – Proposed Operations
Figure B-16: Predicted Maximum 24-Hour Average PM2.5 Cumulative Concentrations (g/m3) – Proposed Operations (Assessment Criteria: 25 g/m3)

Airlabs Environmental Omya Australia, Bajool, QLD SEP17190.2 Air Quality Impact Assessment Report
Page: 59 of 59 Airlabs Environmental
Figure B-17: Predicted Maximum Monthly Average Cumulative Deposited Dust Levels (mg/m2/day) – Existing Operations (Assessment Criteria: 120 mg/m2/day)
Figure B-18: Predicted Maximum Monthly Average Cumulative Deposited Dust Levels (mg/m2/day) – Proposed Operations (Assessment Criteria: 120 mg/m2/day)