on cepheid distance scale bias due to stellar … · on cepheid distance scale bias due to stellar...
TRANSCRIPT
Draft version May 17, 2018Typeset using LATEX twocolumn style in AASTeX61
ON CEPHEID DISTANCE SCALE BIAS DUE TO STELLAR COMPANIONS AND CLUSTER POPULATIONS
Richard I. Anderson1, 2 and Adam G. Riess2, 3
1European Southern Observatory, Karl-Schwarzschild-Str. 2, D-85748 Garching b. Munchen, Germany2Department of Physics and Astronomy, The Johns Hopkins University, 3400 N Charles St, Baltimore, MD 21218, USA3Space Telescope Science Institute, 3700 San Martin Dr, Baltimore, MD 21218, USA
(Received December 1, 2017; Revised April 20, 2018; Accepted May 15, 2018)
Submitted to ApJ
ABSTRACT
State-of-the art photometric measurements of extragalactic Cepheids account for the mean additional light due to
chance superposition of Cepheids on crowded backgrounds through the use of artificial star measurements. However,
light from stars physically associated with Cepheids may bias relative distance measurements if the changing spatial
resolution along the distance ladder significantly alters the amount of associated blending. We have identified two
regimes where this phenomenon may occur: Cepheids in wide binaries and open clusters.
We estimate stellar association bias using the photometric passbands and reddening-free Wesenheit magnitudes used
to set up the distance scale. For wide binaries, we rely on Geneva stellar evolution models in conjunction with detailed
statistics on intermediate-mass binary stars. For the impact of cluster stars, we have compiled information on the
clustered Cepheid fraction and measured the typical cluster contribution in M31 via deep HST imaging provided by
the PHAT project.
We find that the dominant effect on the distance scale comes from Cepheids in clusters, despite cluster Cepheids
being a relatively rare phenomenon. Wide binaries have a negligible effect of 0.004% on H0 for long-period Cepheids
observed in the near-infrared or when considering Wesenheit magnitudes. We estimate that blending due to cluster
populations has previously resulted in a 0.23% overestimate of H0. Correcting for this bias, we obtain H0 = 73.07 ±1.76 km s−1 Mpc−1, which remains in 3.3σ tension with the Planck value. We conclude that stellar association bias
does not constitute a limit for measuring H0 with an accuracy of 1%.
Keywords: Cepheids — cosmology — distance scale
Corresponding author: Richard I. Anderson
arX
iv:1
712.
0106
5v2
[as
tro-
ph.S
R]
16
May
201
8
2 R.I. Anderson & A.G. Riess
1. INTRODUCTION
The extragalactic distance scale provides a crucial
measure of the present-day expansion rate of the uni-
verse, i.e, the Hubble constant H0. Historically, there
has been great interest in measuring H0 with ever im-
proving accuracy (for recent reviews, cf. Freedman &
Madore 2010; Livio & Riess 2013). A significant im-
provement was the Hubble Key Project (Freedman et al.
2001), which reached the 10% accuracy level. Since
then, improved observing strategies that favor data ho-
mogeneity, better error analysis and propagation, larger
samples of Cepheids in SN-host galaxies (Riess et al.
2011, henceforth: R+11), and better trigonometric par-
allaxes of Cepheids in the Milky Way have enabled con-
siderable improvements, so that the current accuracy
of H0 now figures at 2.4% (73.24 ± 1.74 km s−1 Mpc−1,
cf. Riess et al. 2016, henceforth: R+16). In the R+16
implementation, classical Cepheids provide a geomet-
ric calibration for type-Ia supernovae peak luminosi-
ties and covariance is taken into account by model-
ing the distance scale globally. A distance-scale inde-
pendent estimate of H0 with 3.8% precision (72.8 ±2.4 km s−1 Mpc−1) has been obtained using time delays
observed in gravitationally lensed quasars using a prior
on ΩM (Bonvin et al. 2017), which is in good agree-
ment with R+16. Exchanging SNIa optical magnitudes
with near-IR data also yields a result consistent with
this value of H0 (Dhawan et al. 2018, 72.8 ± 1.6 ±2.7 km s−1 Mpc−1). Finally, gravitational wave events
may provide single digit accuracy on H0 in the future
(Del Pozzo 2012; Abbott et al. 2017). Of course, many
complementary efforts are under way to accurately mea-
sure H0, e.g. using standard candles belonging to older
stellar populations (e.g. Beaton et al. 2016).
There are two key motivations for continuing to push
H0 accuracy. First, H0 can serve as a powerful prior for
analyses of the Cosmic Microwave Background (CMB)
and knowing H0 to 1% accuracy would significantly im-
prove the uncertainties on the dark energy equation of
state σw (Suyu et al. 2012; Weinberg et al. 2013; Man-
zotti et al. 2016), which is crucial for understanding the
origin and nature of the universe’s accelerated expansion
(Riess et al. 1998; Perlmutter et al. 1999).
Second, R+16 have shown that H0 measured directly
using a state-of-the-art distance scale now differs by 3.4σ
from the value inferred from the Planck satellite’s mea-
surements of the CMB assuming ΛCDM (Planck Collab-
oration et al. 2016a,b). This has since been confirmed
independently (Feeney et al. 2018; Cardona et al. 2017;
Follin & Knox 2018). Moreover, this difference cannot
be explained solely by invoking systematic errors in the
Planck data (Addison et al. 2018). If this difference is
amplified by even more accurate determinations of H0,
then such a discrepancy could lead to the exciting con-
clusion that the presently-accepted cosmological model
is incomplete.
Of course, detailed investigations of systematics in-
tervening in H0 measurements are required before new
physics may be credibly invoked to explain this ob-
served difference. Large efforts are already underway
to this end, focusing on all aspects of the distance lad-
der. For Cepheids specifically, possible non-linearities
or metallicity-dependence of the Leavitt Law, i.e., the
Period-luminosity Relation of Cepheids (Leavitt & Pick-
ering 1912, PLR), have received much recent attention
(e.g. Sandage et al. 2004; Sakai et al. 2004; Storm et al.
2004; Ngeow & Kanbur 2006; Garcıa-Varela et al. 2013;
Inno et al. 2013; Kodric et al. 2015; Bhardwaj et al.
2016; Wielgorski et al. 2017). Yet, none of these effects
have been confirmed to significantly impact H0.
The crucial geometric footing for the cosmic distance
scale is currently being rebuilt thanks to technical ad-
vances in accurately measuring trigonometric parallaxes
of classical Cepheids. Specifically, observations made in
spatial scanning mode using HST/WFC3 (Riess et al.
2014; Casertano et al. 2016, Riess et al. in prep.)
are used to measure parallax of a number of Galactic
Cepheids with 30 − 40µarcsec accuracy (cf. also An-
derson et al. 2016b). On an even larger scale, the ESA
mission Gaia is currently measuring parallax of approx-
imately 300 Galactic Cepheids with better than 3% ac-
curacy (Gaia Collaboration et al. 2016b,a, 2017). Thus,
the Galactic calibration of the Leavitt law will be con-
siderably improved compared to the previous calibration
based on 10 Cepheids with parallaxes known to better
than 10% accuracy (Benedict et al. 2007).
The spatial coincidence of multiple light sources
within a detector resolution element or PSF (hence-
forth: blending) becomes increasingly likely with dis-
tance, since the physical scale (in pc) of a single pixel
increases with distance for a fixed plate scales (in arc-
sec per pixel). Thus, apparent Cepheid magnitudes are
expected to be increasingly affected by “parasitic” flux
contributions the farther away the galaxy in which they
reside.
Blending can occur due to chance superposition (e.g.
field stars in a distant galaxy of interest) or physical
association (e.g. companion stars in binaries or cluster
member stars). Notably, blending due to chance super-
position can be effectively corrected using local, arti-
ficial star tests (cf. Sec. 2.3 of Riess et al. 2009) that
estimate the average light contribution per pixel due to
field stars near the object of interest. However, stars
physically associated with Cepheids are necessarily close

Cepheid Distance Scale Bias due to Blending 3
Definitions
MMW(Pp) = mCep,MW − µ0,Gaia = −2.5 · log (FCep(Pp) + FComp,near)− 5 log dCep + 5
MLMC(Pp) = mCep,LMC − µ0,LMC = −2.5 · log (FCep(Pp) + FComp,near + FComp,wide)− 5 log dLMC + 5
MSN(Pp) = mCep,SN − µ0,Gaia = −2.5 · log (FCep(Pp) + FComp,near + FComp,wide + FClusters) −
−mCep,MW +MMW(Pp)
∆MSN = MSN −MMW = fwb ·∆Mwb + fCC ·∆MCl
fwb fraction of Cepheids with wide (400 . arel . 4000 AU) companions, cf. §2.1
∆Mwb typical brightening by a companion on a wide orbit, cf. §2.2
fCC fraction of Cepheids occurring in clusters, cf. §3.1
∆MCl typical brightening due to cluster stars. cf. §3.2
Table 1. Definition of stellar association bias. d denotes distance, F flux received, m apparent magnitude, M absolutemagnitude, µ distance modulus, and Pp pulsation period. Subscript SN refers to a typical SN-host galaxy, e.g. in the SH0ESproject (R+16). MSN is assumed to be computed using a Galactic PLR calibrated using Gaia parallaxes of Milky Way (MW)Cepheids.
(within a few parsecs) and thus potentially unresolved,
and the properties of their light contribution may differ
from that of the (possibly crowded) field stars. Given
a fixed plate scale, the ability to resolve physically as-
sociated stars depends on distance, so that flux con-
tributed by physically associated stars cannot always be
estimated directly from the observations of each galaxy.
Although it would be possible to apply a homogeneous
aperture of fixed physical scale to all galaxies (including
the MW), this would a) add considerable noise (in par-
ticular in the MW) and b) lack the external view of MW
Cepheids analogous to their extragalactic counterparts.
Table 1 provides an overview of the physically associ-
ated objects blending into a Cepheid’s PSF on different
“rungs” of the distance ladder.
Several previous studies have targeted blending ef-
fects due to chance superposition by estimating the
brightening of Cepheids as a function of angular res-olution by comparing apparent magnitudes measured
using observations from the ground and from Space
(Stanek & Udalski 1999; Mochejska et al. 2000, 2001;
Bresolin et al. 2005; Kiss & Bedding 2005; Vilardell
et al. 2007; Senchyna et al. 2015). The claim that
blending causes significant distance scale bias presented
in some of these studies—and refuted by others (e.g.
Gibson et al. 2000)—requires revision for several rea-
sons (cf. also Ferrarese et al. 2000). First, blending
by field stars is routinely corrected using artificial star
tests. Second, the distinction between physically asso-
ciated objects, such as cluster members and companion
stars, and nearby field stars had previously remained
somewhat unclear. This distinction is crucial, however,
and can be made much more clearly now thanks to up-
dated statistics on stellar multiplicity—in particular re-
∆F m M µ = m−M d = 100.2(µ+5) H0 = v/d
↑ ↓ = ↓ (closer) ↓ (closer) ↑ (faster)
Table 2. Visualizing the impact of added flux contributionsto Cepheids in SN Ia hosts due to wide companion stars orcluster members on H0, in case the Leavitt law is calibratedusing Cepheids that are not subject to such contamination.
garding wide companions—and cluster membership of
Cepheids, as well as deep HST imaging of a signifi-
cant portion of M31. Notably, the common assertion
that Cepheids frequently occur in star clusters has re-
mained largely unchecked and has led to the erroneous
(cf. Sec. 3.1) interpretation that previous blending esti-
mates were primarily sensitive to physically associated
objects instead of chance alignment. Finally, the discus-
sion of blending-related issues has not yet been updated
to reflect the current state-of-the-art calibration of the
distance scale, which utilizes artificial star corrections,
or the typical photometric passbands used to measure
H0. Thus, this article seeks to clarify the impact of
physically associated stars on the distance scale.
To this end, we estimate the photometric bias due to
blending of physically associated objects and its influ-
ence on the H0 measurement presented in R+16. The
bias exists because some physically associated objects
(wide binaries and cluster stars) are spatially resolved
on Galactic scales, whereas they cannot be identified
or de-biased in distant galaxies that set the luminosity
zero-point for type-Ia supernovae. Thus, stellar associa-
tion bias leads to systematic differences between Leavitt
laws observed along the distance ladder. Table 2 illus-
trates the direction of this bias for different quantities
of interest.

4 R.I. Anderson & A.G. Riess
We estimate separately the bias contribution due to
companion and cluster stars. §2 details the estimation
of bias due to companion stars on wide orbits (arel >
400 au) using binary statistics and state-of-the-art stel-
lar evolution models. We adopt a synthetic approach
for wide binaries, since photometric HST observations
of Galactic Cepheids are scant, whereas binary statis-
tics of intermediate-mass stars have been studied in de-
tail. Moreover, most visual companions to Cepheids are
likely not physically associated (Evans et al. 2016b,a).
§3 presents our empirical estimation of bias due to clus-
ter stars. To this end, we review the occurrence rate of
Cepheids in clusters in the Galaxy (MW), Large Mag-
ellanic Cloud (LMC), Small Magellanic Cloud (SMC),
and the Andromeda galaxy (M31), and employ deep
HST imaging of M31 by the PHAT project (Dalcanton
et al. 2012) to obtain an empirical estimate of the aver-
age light contribution from Cepheid host cluster popu-
lations. Unless otherwise specified, the term ‘Cepheid’
refers to type-I (classical) Cepheids pulsating in the fun-
damental mode throughout this paper. §4 discusses rel-
evant uncertainties and limitations of this work and pro-
vides recommendations for mitigating stellar association
bias. §5 summarizes our results.
2. BINARY STARS
Cepheids frequently occur in binary or higher order
multiple systems (e.g. Szabados 2003; Neilson et al.
2015), and despite long-standing efforts to detect com-
panions even well-studied cases such as the prototype
δCephei occasionally hold surprises (Anderson et al.
2015). Most companions of Galactic Cepheids are not
spatially resolved, although several companions have
been directly detected using long baseline optical in-
terferometry (Gallenne et al. 2015). Conversely, most
visual companions—i.e., spatially resolved stars located
near a Cepheids—appear to be not physically associ-
ated, since physically bound companions seem to be lim-
ited to relative semimajor axes arel . 4000 au (Evans
et al. 2016b,a).
Companions of high-interest long-period Galactic
Cepheids (typical distance ∼ 2.5 kpc, cf. Riess et al.
2014; Casertano et al. 2016) on orbits with relative
semimajor axes arel & 400 AU can be resolved using
HST/WFC3’s UVIS channel (0.04”/pixel, i.e., sep-
arations & 0.1” are resolved). Thus, the range of
companion semimajor axes contributing this bias is
400 . arel . 4000 AU. The threshold for resolving the
widest LMC companions would be arel & 10000 AU.
We estimate the bias due to wide binaries using pub-
lished multiplicity statistics of intermediate-mass stars
in conjunction with predictions from state-of-the-art
stellar evolution models. We expect this to be small
since a) wide binaries are rare and b) Cepheids outshine
typical companions by several magnitudes (e.g. Ander-
son et al. 2016b). We rely on a general compilation of
intermediate-mass1 star multiplicity statistics (Moe &
Di Stefano 2017) rather than on Cepheid-specific mul-
tiplicity information, since the range of possible orbital
semimajor axes—in particular the very wide orbits—has
been more completely explored for B-stars than for the
generally distant and evolved Cepheids. We further base
the estimate of the typical wide companion flux on stel-
lar model predictions, since empirical estimates of this
kind are not presently available.
We first discuss the occurrence rate of wide compan-
ions, fwb, in §2.1, and then estimate the average flux
contribution of a typical companion star, MPp, in §2.2
to assess the possible impact on H0.
2.1. Wide binary fraction
We adopt fwb = 0.15 as the fraction of MW Cepheids
that have wide (arel > 400 au), spatially resolved, com-
panions. This value is based on a recent compre-
hensive compilation of information on binary statistics
that employed results from spectroscopy, eclipses, long-
baseline interferometry, sparse aperture masking, adap-
tive optics, lucky imaging, and common proper motion
(Moe & Di Stefano 2017). The de-biased multiplic-
ity fraction of intermediate-mass stars with mass ra-
tios q = M2/M1 > 0.1 in the orbital period range
log (Po [d]) ∈ [6.5, 7.5] is flogPo=[6.5,7.5];q>0.1 = 0.11 ±0.03. We adopt a slightly higher fwb = 0.15 to ac-
count for a larger orbital period range of interest, i.e.,
log (Po [d]) ∈ [7.0, 8.5], for typical Cepheid companions
with arel ∈ [400, 4000] AU and M1 ∈ [5, 9]M. Note
that the adopted binary fraction is an upper limit in
the sense that flogPo=[6.5,7.5];q>0.1 also contains mass ra-
tios q = MCompanion/MCep ∈ [0.1, 0.3] rather than the
presently adopted q > 0.3. This limitation is related to
a) the limited mass range in the stellar isochrones and
b) differences in the mass function for lower q (Moe &
Di Stefano 2017).
2.2. Typical companion bias based on stellar models
We estimate the light contribution by companions on
wide orbits using stellar isochrones and random compan-
ion mass ratios, since the mass ratio distribution of very
wide companions (arel ≈ 200 − 5 000AU) is nearly con-
sistent with random pairing following the initial mass
function across the mass ratios of interest (Moe & Di
1 The mass range of Cepheid progenitors with Solar metallicityis approximately 5− 9M (Anderson et al. 2014, 2016a)

Cepheid Distance Scale Bias due to Blending 5
−0.5 0.0 0.5 1.0 1.5
B − V [mag]
−6
−5
−4
−3
−2
−1
0
1
2
MV
[mag
]
40d
20d
10d
5d
IS RE
IS BE
Figure 1. Solar metallicity Geneva isochrones with averageinitial rotation rate (Ω/Ωc = 0.5) corresponding to differentpulsation periods near the blue instability strip edge duringthe second crossing. The red (IS RE) and blue (IS BE) edgesof the instability strip shown are based on the same models(Anderson et al. 2016a).
0.2 0.4 0.6 0.8 1.0
q =M2/MCep
−8
−6
−4
−2
∆M
20
d[m
ag]
V -band, 2nd Xing
V -band, 3rd Xing
H-band, 2nd Xing
H-band, 3rd Xing
Figure 2. Contrast between a 20 d Cepheid and its MainSequence companion as a function of mass ratio q. The cor-responding isochrone is shown in Fig. 1. The label ‘Xing’ inthe legend indicates second or third IS crossings.
Stefano 2017). We adopt a power law distributions,
pq ∝ qγ , where γ = −2 for q > 0.3 for stars in the mass
range 5 − 9M. We draw 100,000 random mass ratios
using a power law normalized such that there is a 100%
chance of having a companion within q = [0.3, 1.0], i.e.,∫ 1.0
0.3const · q′−2dq′ = 1.
We estimate the typical flux contribution due to a
wide binary companion as follows. Predictions of stellar
properties are provided by Geneva isochrones (Ekstrom
et al. 2012; Georgy et al. 2013; Anderson et al. 2014) of
Solar metallicity (Z = 0.014) computed using a typical
initial (ZAMS) angular rotation rate ω = Ω/Ωcrit = 0.5.
For simplicity we assume that Cepheids are located
near the hot edge of the instability strip (IS) determined
for these models (Anderson et al. 2016a). Although
real Cepheids are distributed across the IS, this sim-
plifying assumption eliminates the uncertainty related
to the location of the cool IS edge and provides a more
conservative upper limit on the companion bias, which
tends to decrease for redder stars, in particular when
dealing with reddening-free Wesenheit magnitudes. The
blue edge of the IS was approximated by a linear fit:
log (Teff,BE [K]) = 3.9300− 0.0447 logL/L.
The isochrones used for this estimation have been
computed using a freely accessible online interpolation
tool2. The adopted isochrone ages were computed us-
ing period-age relations determined for the same mod-
els (Anderson et al. 2016a) and correspond to a range
of pulsation periods of interest (Pp = [40, 20, 10, 5] d).
Age differences between second and third IS crossings
are accounted for, i.e., a 40 d Cepheid on the second
crossing is slightly younger than a 40 d Cepheid on the
third crossing. Thus, the adopted isochrone ages are
log (t [yr]) = 7.36, 7.57, 7.78, and 7.99 for Cepheids
on second crossings, and log (t [yr]) = 7.41, 7.62, 7.83,
8.04 for third crossing Cepheids. The isochrone files list
VEGA magnitudes for UBVRI (Johnson-Cousins photo-
metric system) and JHK (Bessel) filters (Anderson et al.
2016b). Detailed comparisons with Cepheid properties
have shown excellent agreement for a host of different
observables (Anderson et al. 2016a).
All companion stars considered here are assumed to
be main sequence stars. This implies a practical upper
limit on the mass fraction q = M2/M1 . 0.97. Al-
though five eclipsing LMC binary systems composed of
Cepheid and red giant stars have been identified by the
Araucaria project (e.g. Gieren et al. 2014), the short
lifetime of the Cepheid evolutionary stage (104 − 106yr
depending on mass (9− 5M), cf. Tab. 4 in Anderson
et al. 2014) in practice limits observed pairs of evolved
binary components to the shortest period Cepheids. To
wit, the longest period Cepheid in such as system has
Pp = 3.8 d (Pietrzynski et al. 2010). However, such short
periods are not usually observable in distant SN host
galaxies and are not relevant to the present discussion.
Similarly, we do not consider white dwarf or other stel-
lar remnant companions, although it is known that the
2 https://obswww.unige.ch/Recherche/evoldb/index/
6 R.I. Anderson & A.G. Riess
0.6 0.8 1.0 1.2 1.4 1.6
log(Pp [d])
−6
−4
−2
0
∆M
[mm
ag]
Assumes fwb = 0.15 V-band
I-band
H-band
WVI
WHVI
0.6 0.8 1.0 1.2 1.4 1.6
log(Pp [d])
−0.3
−0.2
−0.1
0.0
∆d
[%p
c]
Assumes fwb = 0.15
V -band
I-band
H-bandWV I
WHV I
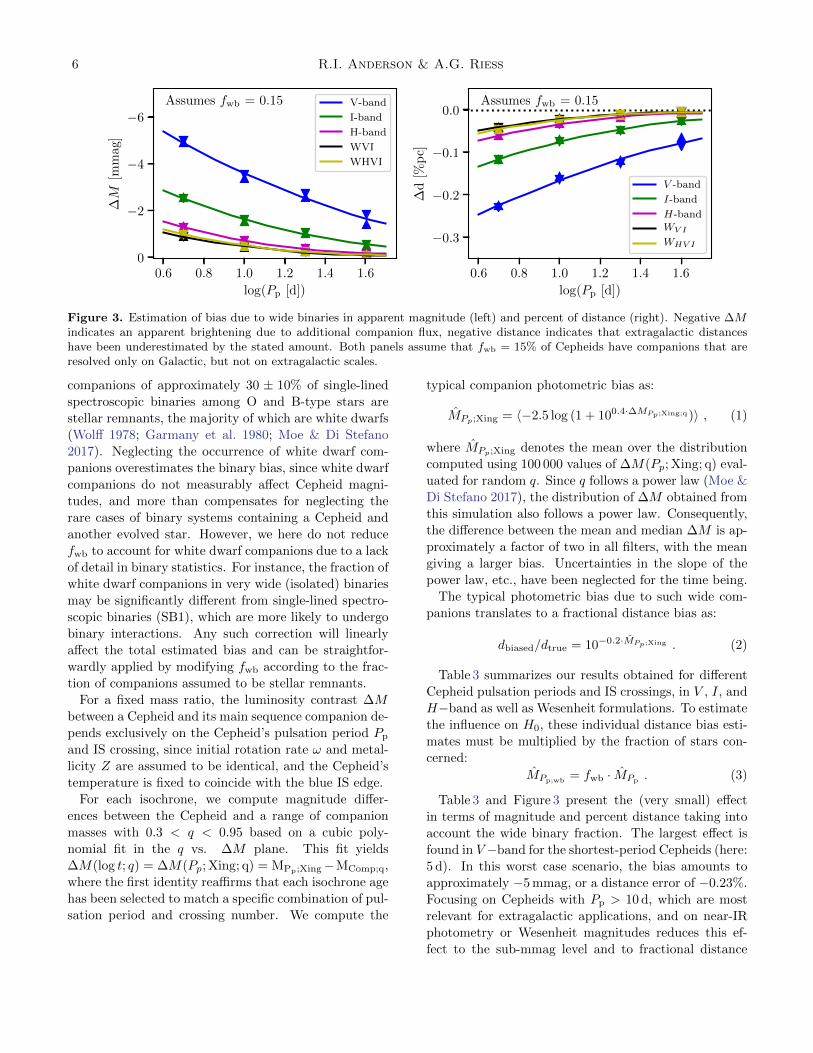
Figure 3. Estimation of bias due to wide binaries in apparent magnitude (left) and percent of distance (right). Negative ∆Mindicates an apparent brightening due to additional companion flux, negative distance indicates that extragalactic distanceshave been underestimated by the stated amount. Both panels assume that fwb = 15% of Cepheids have companions that areresolved only on Galactic, but not on extragalactic scales.
companions of approximately 30 ± 10% of single-lined
spectroscopic binaries among O and B-type stars are
stellar remnants, the majority of which are white dwarfs
(Wolff 1978; Garmany et al. 1980; Moe & Di Stefano
2017). Neglecting the occurrence of white dwarf com-
panions overestimates the binary bias, since white dwarf
companions do not measurably affect Cepheid magni-
tudes, and more than compensates for neglecting the
rare cases of binary systems containing a Cepheid and
another evolved star. However, we here do not reduce
fwb to account for white dwarf companions due to a lack
of detail in binary statistics. For instance, the fraction of
white dwarf companions in very wide (isolated) binaries
may be significantly different from single-lined spectro-
scopic binaries (SB1), which are more likely to undergo
binary interactions. Any such correction will linearly
affect the total estimated bias and can be straightfor-
wardly applied by modifying fwb according to the frac-
tion of companions assumed to be stellar remnants.
For a fixed mass ratio, the luminosity contrast ∆M
between a Cepheid and its main sequence companion de-
pends exclusively on the Cepheid’s pulsation period Pp
and IS crossing, since initial rotation rate ω and metal-
licity Z are assumed to be identical, and the Cepheid’s
temperature is fixed to coincide with the blue IS edge.
For each isochrone, we compute magnitude differ-
ences between the Cepheid and a range of companion
masses with 0.3 < q < 0.95 based on a cubic poly-
nomial fit in the q vs. ∆M plane. This fit yields
∆M(log t; q) = ∆M(Pp; Xing; q) = MPp;Xing−MComp;q,
where the first identity reaffirms that each isochrone age
has been selected to match a specific combination of pul-
sation period and crossing number. We compute the
typical companion photometric bias as:
MPp;Xing = 〈−2.5 log (1 + 100.4·∆MPp;Xing;q)〉 , (1)
where MPp;Xing denotes the mean over the distribution
computed using 100 000 values of ∆M(Pp; Xing; q) eval-
uated for random q. Since q follows a power law (Moe &
Di Stefano 2017), the distribution of ∆M obtained from
this simulation also follows a power law. Consequently,
the difference between the mean and median ∆M is ap-
proximately a factor of two in all filters, with the mean
giving a larger bias. Uncertainties in the slope of the
power law, etc., have been neglected for the time being.
The typical photometric bias due to such wide com-
panions translates to a fractional distance bias as:
dbiased/dtrue = 10−0.2·MPp;Xing . (2)
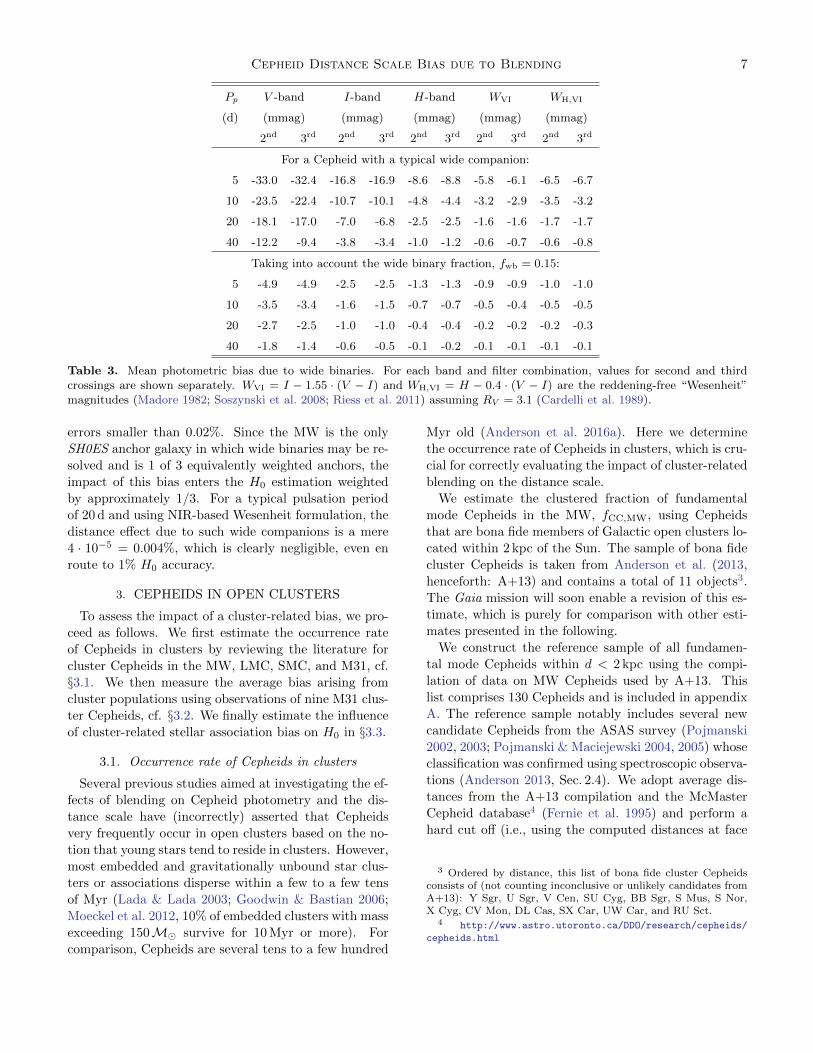
Table 3 summarizes our results obtained for different
Cepheid pulsation periods and IS crossings, in V , I, and
H−band as well as Wesenheit formulations. To estimate
the influence on H0, these individual distance bias esti-
mates must be multiplied by the fraction of stars con-
cerned:
MPp;wb= fwb · MPp . (3)
Table 3 and Figure 3 present the (very small) effect
in terms of magnitude and percent distance taking into
account the wide binary fraction. The largest effect is
found in V−band for the shortest-period Cepheids (here:
5 d). In this worst case scenario, the bias amounts to
approximately −5 mmag, or a distance error of −0.23%.
Focusing on Cepheids with Pp > 10 d, which are most
relevant for extragalactic applications, and on near-IR
photometry or Wesenheit magnitudes reduces this ef-
fect to the sub-mmag level and to fractional distance
Cepheid Distance Scale Bias due to Blending 7
Pp V -band I-band H-band WVI WH,VI
(d) (mmag) (mmag) (mmag) (mmag) (mmag)
2nd 3rd 2nd 3rd 2nd 3rd 2nd 3rd 2nd 3rd
For a Cepheid with a typical wide companion:
5 -33.0 -32.4 -16.8 -16.9 -8.6 -8.8 -5.8 -6.1 -6.5 -6.7
10 -23.5 -22.4 -10.7 -10.1 -4.8 -4.4 -3.2 -2.9 -3.5 -3.2
20 -18.1 -17.0 -7.0 -6.8 -2.5 -2.5 -1.6 -1.6 -1.7 -1.7
40 -12.2 -9.4 -3.8 -3.4 -1.0 -1.2 -0.6 -0.7 -0.6 -0.8
Taking into account the wide binary fraction, fwb = 0.15:
5 -4.9 -4.9 -2.5 -2.5 -1.3 -1.3 -0.9 -0.9 -1.0 -1.0
10 -3.5 -3.4 -1.6 -1.5 -0.7 -0.7 -0.5 -0.4 -0.5 -0.5
20 -2.7 -2.5 -1.0 -1.0 -0.4 -0.4 -0.2 -0.2 -0.2 -0.3
40 -1.8 -1.4 -0.6 -0.5 -0.1 -0.2 -0.1 -0.1 -0.1 -0.1
Table 3. Mean photometric bias due to wide binaries. For each band and filter combination, values for second and thirdcrossings are shown separately. WVI = I − 1.55 · (V − I) and WH,VI = H − 0.4 · (V − I) are the reddening-free “Wesenheit”magnitudes (Madore 1982; Soszynski et al. 2008; Riess et al. 2011) assuming RV = 3.1 (Cardelli et al. 1989).
errors smaller than 0.02%. Since the MW is the only
SH0ES anchor galaxy in which wide binaries may be re-
solved and is 1 of 3 equivalently weighted anchors, the
impact of this bias enters the H0 estimation weighted
by approximately 1/3. For a typical pulsation period
of 20 d and using NIR-based Wesenheit formulation, the
distance effect due to such wide companions is a mere
4 · 10−5 = 0.004%, which is clearly negligible, even en
route to 1% H0 accuracy.
3. CEPHEIDS IN OPEN CLUSTERS
To assess the impact of a cluster-related bias, we pro-
ceed as follows. We first estimate the occurrence rate
of Cepheids in clusters by reviewing the literature for
cluster Cepheids in the MW, LMC, SMC, and M31, cf.§3.1. We then measure the average bias arising from
cluster populations using observations of nine M31 clus-
ter Cepheids, cf. §3.2. We finally estimate the influence
of cluster-related stellar association bias on H0 in §3.3.
3.1. Occurrence rate of Cepheids in clusters
Several previous studies aimed at investigating the ef-
fects of blending on Cepheid photometry and the dis-
tance scale have (incorrectly) asserted that Cepheids
very frequently occur in open clusters based on the no-
tion that young stars tend to reside in clusters. However,
most embedded and gravitationally unbound star clus-
ters or associations disperse within a few to a few tens
of Myr (Lada & Lada 2003; Goodwin & Bastian 2006;
Moeckel et al. 2012, 10% of embedded clusters with mass
exceeding 150M survive for 10 Myr or more). For
comparison, Cepheids are several tens to a few hundred
Myr old (Anderson et al. 2016a). Here we determine
the occurrence rate of Cepheids in clusters, which is cru-
cial for correctly evaluating the impact of cluster-related
blending on the distance scale.
We estimate the clustered fraction of fundamental
mode Cepheids in the MW, fCC,MW, using Cepheids
that are bona fide members of Galactic open clusters lo-
cated within 2 kpc of the Sun. The sample of bona fide
cluster Cepheids is taken from Anderson et al. (2013,
henceforth: A+13) and contains a total of 11 objects3.
The Gaia mission will soon enable a revision of this es-
timate, which is purely for comparison with other esti-
mates presented in the following.
We construct the reference sample of all fundamen-
tal mode Cepheids within d < 2 kpc using the compi-
lation of data on MW Cepheids used by A+13. This
list comprises 130 Cepheids and is included in appendix
A. The reference sample notably includes several new
candidate Cepheids from the ASAS survey (Pojmanski
2002, 2003; Pojmanski & Maciejewski 2004, 2005) whose
classification was confirmed using spectroscopic observa-
tions (Anderson 2013, Sec. 2.4). We adopt average dis-
tances from the A+13 compilation and the McMaster
Cepheid database4 (Fernie et al. 1995) and perform a
hard cut off (i.e., using the computed distances at face
3 Ordered by distance, this list of bona fide cluster Cepheidsconsists of (not counting inconclusive or unlikely candidates fromA+13): Y Sgr, U Sgr, V Cen, SU Cyg, BB Sgr, S Mus, S Nor,X Cyg, CV Mon, DL Cas, SX Car, UW Car, and RU Sct.
4 http://www.astro.utoronto.ca/DDO/research/cepheids/
cepheids.html
8 R.I. Anderson & A.G. Riess
value) at 2 kpc. We limit this estimate to heliocentric
distances d < 2 kpc because of the apparent decrease in
MW cluster detection efficiency (see Figure 20 in A+13).
Pulsation modes are adopted from Klagyivik & Szaba-
dos (2009), except where Pp > 7.57 d, in which case we
assume FU mode pulsation (i.e., we adopt V440 Per as
the overtone Cepheid with the longest period following
Baranowski et al. 2009).
We thus find fCC,MW = 11/130 = 8.5% for funda-
mental mode Cepheids within 2 kpc of the Sun. Further
considerations regarding this fraction are presented in
§4.2.
There are two well studied LMC clusters that con-
tain up to 24 classical Cepheids each: NGC 1866 and
NGC 2031 (Welch & Stetson 1993; Testa et al. 2007;
Musella et al. 2016). These impressive cases contain
up to 8 times the number of Cepheids found in the
record-holding MW cluster NGC 7790 with its 3 member
Cepheids (Sandage 1958, A+13) and have thus received
much attention. However, it should be noted that there
is no known equivalent for such clusters in the MW, the
SMC, or M31. Moreover, these well-known special cases
are also not representative of the typical Cepheid host
clusters in the Magellanic Clouds. The most compre-
hensive survey of cluster Cepheids in the LMC and SMC
to date (Pietrzynski & Udalski 1999) indicates that the
vast majority of Cepheid-hosting clusters in both MCs
contain only one or two Cepheids, which is similar to
the MW.
Using the available data for LMC and SMC cluster
Cepheids based on phase two of the Optical Gravita-
tional Lensing Experiment (Udalski et al. 1997, 1999a,b;
Pietrzynski & Udalski 1999, OGLE-II), we determine
the following clustered Cepheid fractions, omitting clus-
ters containing more than 3 Cepheids: fCC,LMC =
81/740 = 11% and fCC,SMC = 76/1272 = 6.0%.
These numbers illustrate that the LMC and SMC clus-
ter Cepheid fraction are not so different from the MW.
Specifically for long-period Cepheids (Pp > 10 d), the
clustered fraction is fCC,LMC,longP = 4/55 = 7.2% in
the LMC and fCC,SMC,longP = 6/74 = 8.1%. While
these numbers would benefit from an update based on
the now completed survey of Cepheids in the Magellanic
system (Soszynski et al. 2017, OGLE-IV), it is obvious
that the occurrence of cluster Cepheids is also compar-
atively uncommon in the Magellanic clouds.
The Andromeda galaxy (M31) provides a useful ana-
log for both the MW and the SH0ES project’s SN-
host galaxies (Hoffmann et al. 2016), all of which are
relatively high-mass spiral galaxies with similar (high)
metallicity. To wit, log (Mstars/M) = 10.80 (MW)
and 11.1 (M31) (McMillan 2011; Tamm et al. 2012) com-
NC
ln
ear
45
3C
eph
eid
s
0.0 2.5 5.0 7.5 10.0Separation from Cepheid [arcsec]
0
2
4
0 100 200 300
Separation from Cepheid [arcsec]
0
200
400
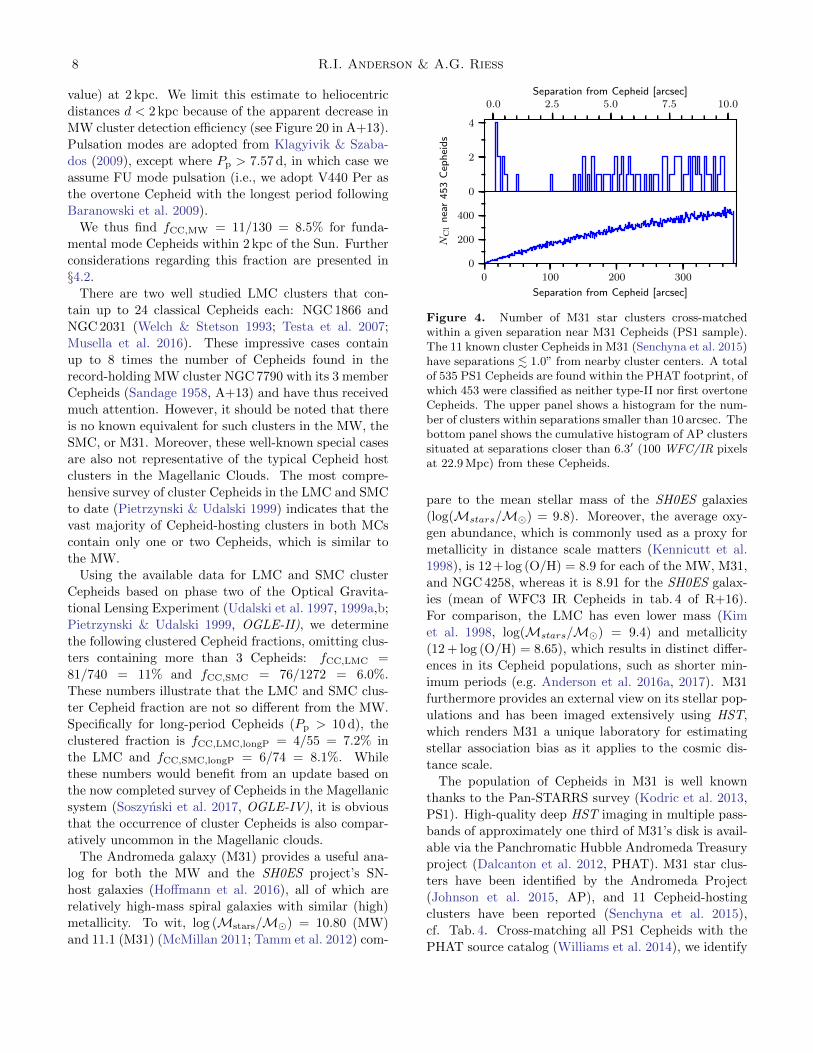
Figure 4. Number of M31 star clusters cross-matchedwithin a given separation near M31 Cepheids (PS1 sample).The 11 known cluster Cepheids in M31 (Senchyna et al. 2015)have separations . 1.0” from nearby cluster centers. A totalof 535 PS1 Cepheids are found within the PHAT footprint, ofwhich 453 were classified as neither type-II nor first overtoneCepheids. The upper panel shows a histogram for the num-ber of clusters within separations smaller than 10 arcsec. Thebottom panel shows the cumulative histogram of AP clusterssituated at separations closer than 6.3′ (100 WFC/IR pixelsat 22.9 Mpc) from these Cepheids.
pare to the mean stellar mass of the SH0ES galaxies
(log(Mstars/M) = 9.8). Moreover, the average oxy-
gen abundance, which is commonly used as a proxy for
metallicity in distance scale matters (Kennicutt et al.
1998), is 12+log (O/H) = 8.9 for each of the MW, M31,
and NGC 4258, whereas it is 8.91 for the SH0ES galax-
ies (mean of WFC3 IR Cepheids in tab. 4 of R+16).
For comparison, the LMC has even lower mass (Kim
et al. 1998, log(Mstars/M) = 9.4) and metallicity
(12 + log (O/H) = 8.65), which results in distinct differ-
ences in its Cepheid populations, such as shorter min-
imum periods (e.g. Anderson et al. 2016a, 2017). M31
furthermore provides an external view on its stellar pop-
ulations and has been imaged extensively using HST,
which renders M31 a unique laboratory for estimating
stellar association bias as it applies to the cosmic dis-
tance scale.
The population of Cepheids in M31 is well known
thanks to the Pan-STARRS survey (Kodric et al. 2013,
PS1). High-quality deep HST imaging in multiple pass-
bands of approximately one third of M31’s disk is avail-
able via the Panchromatic Hubble Andromeda Treasury
project (Dalcanton et al. 2012, PHAT). M31 star clus-
ters have been identified by the Andromeda Project
(Johnson et al. 2015, AP), and 11 Cepheid-hosting
clusters have been reported (Senchyna et al. 2015),
cf. Tab. 4. Cross-matching all PS1 Cepheids with the
PHAT source catalog (Williams et al. 2014), we identify

Cepheid Distance Scale Bias due to Blending 9
535 PHAT sources within angular separations of typ-
ically less than 0.2” (maximum separation 1.2”) from
the PS1 input positions. Of these, 365 are classified as
fundamental mode (FM) Cepheids, 88 are unclassified
(UN), and 82 are either classified as first overtone or as
type-II Cepheids. Given the 11 M31 cluster Cepheids,
we find fCC,M31 = 11/453 = 2.4% when including un-
classified Cepheids and 9/365 = 2.5% when using only
PS1 objects classified as fundamental mode Cepheids.
To ensure that these cluster counts were complete in
the vicinity of the Cepheids, we decided to visually in-
spect UV (F275W and F336W filters) postage stamps
similar to Fig. 7 for all 453 FM or UN PS1 Cepheids
for the presence of any additional clusters that were not
identified by the AP. Figure 5 uses the PHAT project’s
completeness estimations (cf. Fig. 12 in Dalcanton et al.
2012) and a comprehensive listing5 of spectral types
and temperatures (Pecaut & Mamajek 2013) to illus-
trate that F275W and F336W observations are highly
suitable for detecting the vast majority of M31 clusters
containing B-stars. The inspected UV postage stamps
are provided in the online appendix B for the reader’s
convenience and reproducibility. The inspection of the
UV postage stamps thus confirms that the overall clus-
tered Cepheid fraction within the PHAT footprint is a
factor of 3 to 4 lower than the MW and LMC/SMC
fractions established above. Further considerations re-
garding completeness of fCC,M31 are presented in §4.2.1.
Each of the aforementioned estimations of fCC are
subject to their own specific systematics and uncertain-
ties. However, variations of fCC among galaxies are
to be expected because of differences in cluster disper-
sal timescales that depend on various factors, including
galactic potentials and the presence of molecular clouds.
Notably for the MW, establishing a galaxy-wide average
including long-period Cepheids is complicated by the de-
tection of clusters against the foreground in the Galac-
tic disk and the rare occurrence of long-period Cepheids
near the Sun. In the case of the Magellanic clouds, a
collision may have happened roughly 100− 300 Myr ago
(Besla et al. 2012), i.e., during the time when many of
the presently observable Cepheids were born. However,
it is reasonable to expect a clustered Cepheid fraction in
the lower percent range, given the ∼ 10 Myr timescale
for cluster dissociation and typical ages of 50 − 75 Myr
for 20− 10 d Cepheids.
In the following, we adopt fCC,M31 = 2.5% for esti-
mating the impact of stellar association bias onH0. This
choice is based on three main arguments. First, fCC,M31
5 http://www.pas.rochester.edu/~emamajek/EEM_dwarf_
UBVIJHK_colors_Teff.txt
B2 B3 B5 B7 B8 B9 A1 A6 F6K0 M0
20
22
24
26
28F27
5W[m
ag]
PHAT 50%
50 Myr isochrone
5000100001500020000
Teff [K]
20
22
24
26
F33
6W[m
ag]
PHAT 50%
Figure 5. Predicted UV magnitudes at M31’s distance(µM31 = 24.36 mag as adopted in R+16) against tempera-ture and spectral type. A 50 Myr Solar metallicity PARSECisochrone was computed using the HST/WFC3 UVIS pass-bands F275W and F336W. Predicted Teff values are trans-lated to spectral types using the empirical calibration byPecaut & Mamajek (2013). The 50% completeness level(from Fig. 12 in Dalcanton et al. 2012) corresponds to a lateB spectral type and a stellar mass of approximately 2.5M.UV observations of Cepheids are particularly well suited todetect host cluster populations.
is consistent with (by construction) the average cluster
bias measured on M31 data in §3.2. Second, M31 is
more alike SN host galaxies than the Magellanic Clouds
with their potentially peculiar star formation histories
and low metallicities, and provides an external view sim-
ilar to distant galaxies that is not available for the MW.
Third, the impact of cluster contamination on H0 actu-
ally depends on the effective value of fCC as it applies to
SN host galaxies across the cosmic distance ladder, and
not necessarily on the true value of fCC. §4.2 discusses
this point in detail and shows that the M31 cluster pop-
ulation is highly suitable for estimating an upper limit
on stellar association bias due to clusters. §4.3 considers
further elements affecting the true fractions of Cepheids
occurring in clusters.
3.2. Measuring Cluster Cepheid Bias in M31
In contrast to the synthetic approach adopted for bi-
naries, we estimate the stellar association bias due to
clusters empirically using observations of M31 obtained
via the PHAT project (Dalcanton et al. 2012). M31 and
PHAT data provide a suitable empirical base for this es-
timation, since clusters in M31 are sufficiently spatially
resolved, optical and near-IR images are available in the
HST filter system, and M31 is an appropriate analog
for comparison with SN-host galaxies. Moreover, basing
this estimate on observations implies that certain typ-
10 R.I. Anderson & A.G. Riess
0 1 2 3 4 5
Cluster radius [pc]
0.0
0.2
0.4
0.6
0.8
1.0R
el.
Fre
qu
ency
M31 cl.
M31 CC
MW cl.
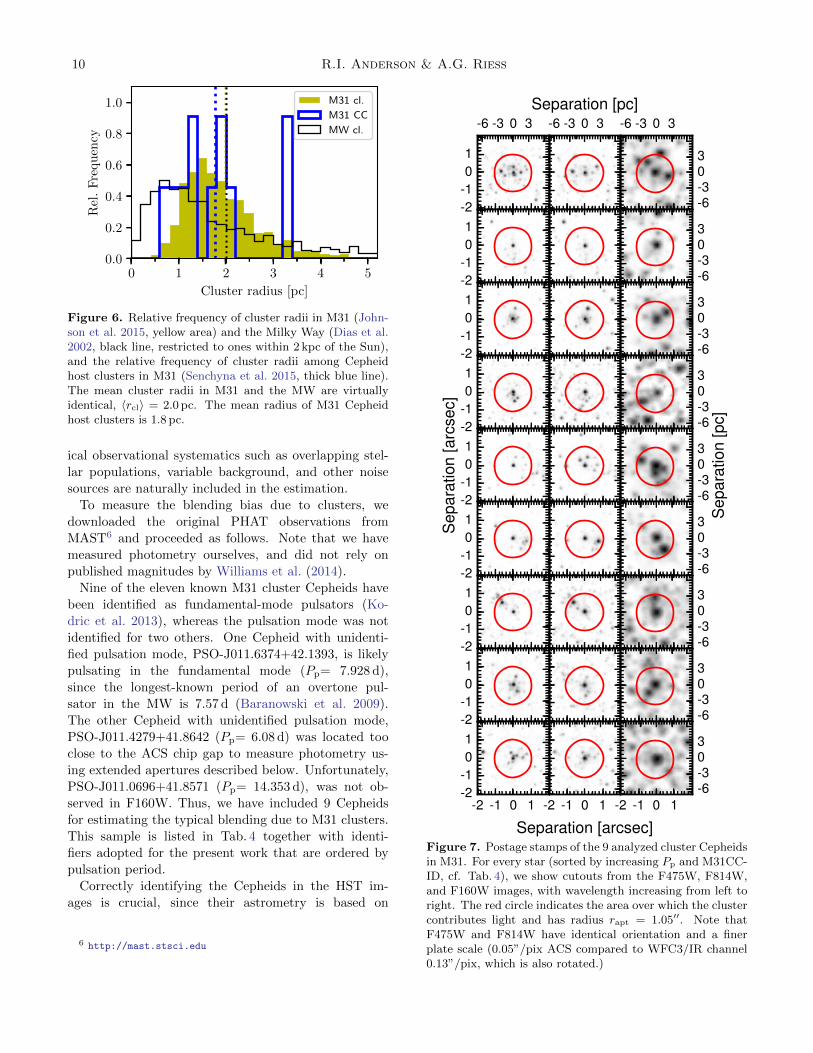
Figure 6. Relative frequency of cluster radii in M31 (John-son et al. 2015, yellow area) and the Milky Way (Dias et al.2002, black line, restricted to ones within 2 kpc of the Sun),and the relative frequency of cluster radii among Cepheidhost clusters in M31 (Senchyna et al. 2015, thick blue line).The mean cluster radii in M31 and the MW are virtuallyidentical, 〈rcl〉 = 2.0 pc. The mean radius of M31 Cepheidhost clusters is 1.8 pc.
ical observational systematics such as overlapping stel-
lar populations, variable background, and other noise
sources are naturally included in the estimation.
To measure the blending bias due to clusters, we
downloaded the original PHAT observations from
MAST6 and proceeded as follows. Note that we have
measured photometry ourselves, and did not rely on
published magnitudes by Williams et al. (2014).
Nine of the eleven known M31 cluster Cepheids have
been identified as fundamental-mode pulsators (Ko-
dric et al. 2013), whereas the pulsation mode was not
identified for two others. One Cepheid with unidenti-
fied pulsation mode, PSO-J011.6374+42.1393, is likely
pulsating in the fundamental mode (Pp= 7.928 d),
since the longest-known period of an overtone pul-
sator in the MW is 7.57 d (Baranowski et al. 2009).
The other Cepheid with unidentified pulsation mode,
PSO-J011.4279+41.8642 (Pp= 6.08 d) was located too
close to the ACS chip gap to measure photometry us-
ing extended apertures described below. Unfortunately,
PSO-J011.0696+41.8571 (Pp= 14.353 d), was not ob-
served in F160W. Thus, we have included 9 Cepheids
for estimating the typical blending due to M31 clusters.
This sample is listed in Tab. 4 together with identi-
fiers adopted for the present work that are ordered by
pulsation period.
Correctly identifying the Cepheids in the HST im-
ages is crucial, since their astrometry is based on
6 http://mast.stsci.edu
Separation [arcsec]
Sep
arat
ion
[arc
sec]
Separation [pc]
Sep
arat
ion
[pc]
-2-101
-6 -3 0 3 -6 -3 0 3 -6 -3 0 3
-6-303
-2-101
-6-303
-2-101
-6-303
-2-101
-6-303
-2-101
-6-303
-2-101
-6-303
-2-101
-6-303
-2-101
-6-303
-2 -1 0 1-2-101
-2 -1 0 1 -2 -1 0 1-6-303
Figure 7. Postage stamps of the 9 analyzed cluster Cepheidsin M31. For every star (sorted by increasing Pp and M31CC-ID, cf. Tab. 4), we show cutouts from the F475W, F814W,and F160W images, with wavelength increasing from left toright. The red circle indicates the area over which the clustercontributes light and has radius rapt = 1.05′′. Note thatF475W and F814W have identical orientation and a finerplate scale (0.05”/pix ACS compared to WFC3/IR channel0.13”/pix, which is also rotated.)
Cepheid Distance Scale Bias due to Blending 11
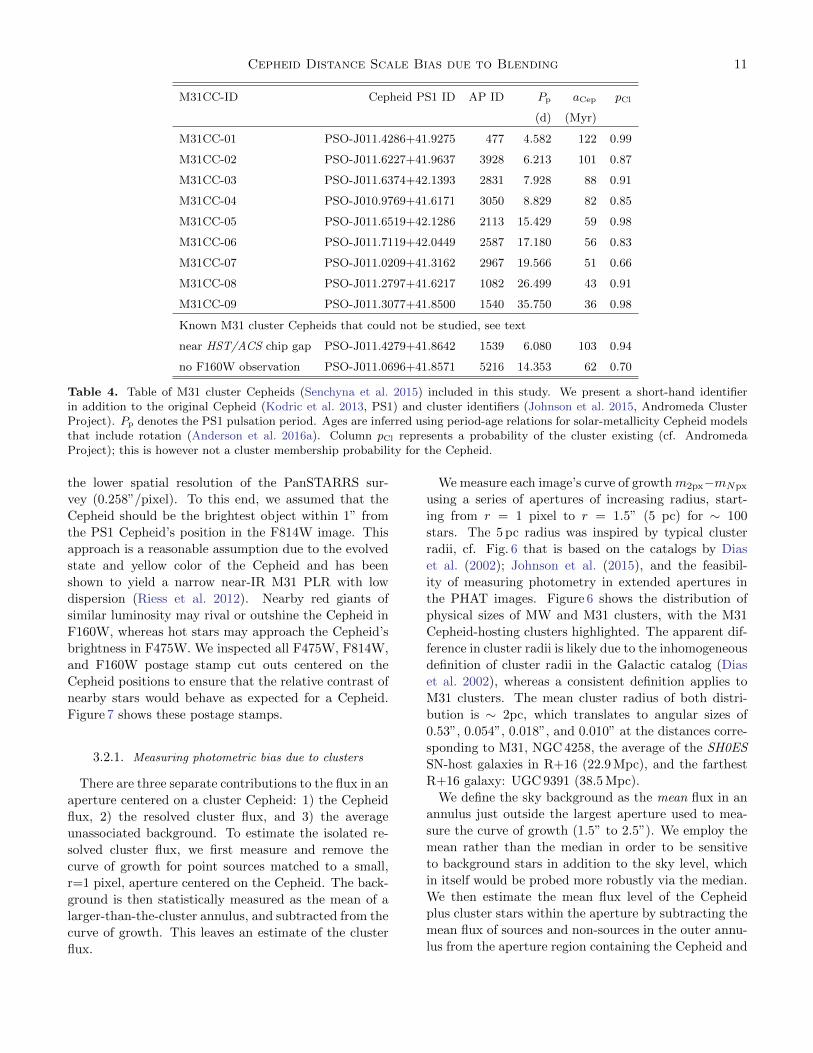
M31CC-ID Cepheid PS1 ID AP ID Pp aCep pCl
(d) (Myr)
M31CC-01 PSO-J011.4286+41.9275 477 4.582 122 0.99
M31CC-02 PSO-J011.6227+41.9637 3928 6.213 101 0.87
M31CC-03 PSO-J011.6374+42.1393 2831 7.928 88 0.91
M31CC-04 PSO-J010.9769+41.6171 3050 8.829 82 0.85
M31CC-05 PSO-J011.6519+42.1286 2113 15.429 59 0.98
M31CC-06 PSO-J011.7119+42.0449 2587 17.180 56 0.83
M31CC-07 PSO-J011.0209+41.3162 2967 19.566 51 0.66
M31CC-08 PSO-J011.2797+41.6217 1082 26.499 43 0.91
M31CC-09 PSO-J011.3077+41.8500 1540 35.750 36 0.98
Known M31 cluster Cepheids that could not be studied, see text
near HST/ACS chip gap PSO-J011.4279+41.8642 1539 6.080 103 0.94
no F160W observation PSO-J011.0696+41.8571 5216 14.353 62 0.70
Table 4. Table of M31 cluster Cepheids (Senchyna et al. 2015) included in this study. We present a short-hand identifierin addition to the original Cepheid (Kodric et al. 2013, PS1) and cluster identifiers (Johnson et al. 2015, Andromeda ClusterProject). Pp denotes the PS1 pulsation period. Ages are inferred using period-age relations for solar-metallicity Cepheid modelsthat include rotation (Anderson et al. 2016a). Column pCl represents a probability of the cluster existing (cf. AndromedaProject); this is however not a cluster membership probability for the Cepheid.
the lower spatial resolution of the PanSTARRS sur-
vey (0.258”/pixel). To this end, we assumed that the
Cepheid should be the brightest object within 1” from
the PS1 Cepheid’s position in the F814W image. This
approach is a reasonable assumption due to the evolved
state and yellow color of the Cepheid and has been
shown to yield a narrow near-IR M31 PLR with low
dispersion (Riess et al. 2012). Nearby red giants of
similar luminosity may rival or outshine the Cepheid in
F160W, whereas hot stars may approach the Cepheid’s
brightness in F475W. We inspected all F475W, F814W,
and F160W postage stamp cut outs centered on the
Cepheid positions to ensure that the relative contrast of
nearby stars would behave as expected for a Cepheid.
Figure 7 shows these postage stamps.
3.2.1. Measuring photometric bias due to clusters
There are three separate contributions to the flux in an
aperture centered on a cluster Cepheid: 1) the Cepheid
flux, 2) the resolved cluster flux, and 3) the average
unassociated background. To estimate the isolated re-
solved cluster flux, we first measure and remove the
curve of growth for point sources matched to a small,
r=1 pixel, aperture centered on the Cepheid. The back-
ground is then statistically measured as the mean of a
larger-than-the-cluster annulus, and subtracted from the
curve of growth. This leaves an estimate of the cluster
flux.
We measure each image’s curve of growthm2px−mNpx
using a series of apertures of increasing radius, start-
ing from r = 1 pixel to r = 1.5” (5 pc) for ∼ 100
stars. The 5 pc radius was inspired by typical cluster
radii, cf. Fig. 6 that is based on the catalogs by Dias
et al. (2002); Johnson et al. (2015), and the feasibil-
ity of measuring photometry in extended apertures in
the PHAT images. Figure 6 shows the distribution of
physical sizes of MW and M31 clusters, with the M31
Cepheid-hosting clusters highlighted. The apparent dif-
ference in cluster radii is likely due to the inhomogeneous
definition of cluster radii in the Galactic catalog (Dias
et al. 2002), whereas a consistent definition applies to
M31 clusters. The mean cluster radius of both distri-
bution is ∼ 2pc, which translates to angular sizes of
0.53”, 0.054”, 0.018”, and 0.010” at the distances corre-
sponding to M31, NGC 4258, the average of the SH0ES
SN-host galaxies in R+16 (22.9 Mpc), and the farthest
R+16 galaxy: UGC 9391 (38.5 Mpc).
We define the sky background as the mean flux in an
annulus just outside the largest aperture used to mea-
sure the curve of growth (1.5” to 2.5”). We employ the
mean rather than the median in order to be sensitive
to background stars in addition to the sky level, which
in itself would be probed more robustly via the median.
We then estimate the mean flux level of the Cepheid
plus cluster stars within the aperture by subtracting the
mean flux of sources and non-sources in the outer annu-
lus from the aperture region containing the Cepheid and

12 R.I. Anderson & A.G. Riess
cluster stars. This somewhat noisy estimate of the mean
Cepheid plus cluster flux level depends on the brightness
and number of stars that lie within the aperture or an-
nulus. An additional source of noise is the random phase
magnitude estimate of the Cepheid, for which we do not
correct here.
To isolate the extra flux contributed by cluster stars
(without the Cepheid), we subtract the curve of growth
measured within the series of apertures from the mean
Cepheid plus cluster flux. This provides us with the clus-
ter flux contributions as a function of angular separation
from the Cepheid in each of the photometric passbands
considered.
Figure 8 shows the resulting estimate of the cumula-
tive cluster flux contribution as a function of separation
from the Cepheid for each of the 9 cluster Cepheids. We
have defined the blending bias for each filter as
∆m = mCl+Cep −mCep , (4)
where m denotes the magnitude in the filter of interest
and ∆m is negative when a light contribution beyond
the background is present. Table 5 lists the inferred
biases for for all 9 Cepheids. Note that the estimate of
the cluster flux can be negative (positive ∆m) due to its
statistical nature, e.g., if the cluster flux is small and its
location statistically sparser than the nearby (annulus)
environment.
Figure 8 shows that ∆mF475W is negative at most clus-
ter radius apertures with a mean (median) of −0.79 ±0.15 (−0.72) mag at an aperture corresponding to rapt =
3.8 pc (cf. below). This agrees very well with the ex-
pectation that young clusters contain many hot stars.
In F814W the mean (median) ∆mF814W = −0.45 ±0.14 (−0.43) mag. For F160W, the mean (median)
∆mF160W = −0.39 ± 0.16 (−0.43) mag, which is simi-
lar to the average bias in F814W. Again, the postage
stamps (Fig. 7) illustrate the blue nature of the (very
centrally concentrated) cluster population dominated by
hot stars, whereas the field red giants (more widely dis-
tributed) become dominant sources in F160W.
Figure 9 shows the mean cluster light contribution as
a function of separation obtained averaging the 9 curves
of growth shown in Fig. 8. The averaging here and in
the following is done in magnitude space, i.e., we in-
terpret the cluster contribution to scale with the lumi-
nosity of the Cepheid, cf. §4.2.1. On average, noisy
field star contamination cancels out and we recover a
smoothly increasing cluster light contribution as a func-
tion of separation. From this average curve of growth,
we find that the cluster light contribution flattens off
at a separation of about rapt = 1.05” ≡ 3.8 pc. This
distance corresponds to approximately twice the aver-
Separation [”]
∆m
[mag
]
Separation [pc]
1.5
0.5
−0.5
−1.5
1 2 3 4 5
M31CC-01
1 2 3 4 5
M31CC-02
1 2 3 4 5
M31CC-03
1.5
0.5
−0.5
−1.5 M31CC-04 M31CC-05 M31CC-06
0 0.5 1.0
1.5
0.5
−0.5
−1.5 M31CC-07
0 0.5 1.0
M31CC-08
0 0.5 1.0
M31CC-09
Figure 8. Cumulative light contribution due to cluster starsfor each M31 cluster Cepheid considered, cf. §3.2. Colorsrepresent different filters: F475W (blue), F814W (yellow),F160W (magenta).
age cluster radius of M31 open clusters, cf. Fig. 6. We
thus adopt rapt = 3.8 pc as the typical area over which
a cluster contributes light to a Cepheid’s photometry.
Table 5 lists the mean bias estimates at rapt = 3.8 pc.
We compute reddening-free Wesenheit magnitudes
(Madore 1982), using combinations of optical as well
as optical and near-IR photometry. The F160W obser-
vations yield H-band magnitudes. We estimate V − Icolor by interpolation using observed F475W-F814W
colors and the color-color (F475W-F814W vs. F555W-
F814W) space defined by a PARSEC isochrone7 (Marigo
et al. 2017) computed for an age of 50 Myr and solar
metallicity, since the PHAT project did not include
observations in F555W (V−band).
7 http://stev.oapd.inaf.it/cmd
Cepheid Distance Scale Bias due to Blending 13
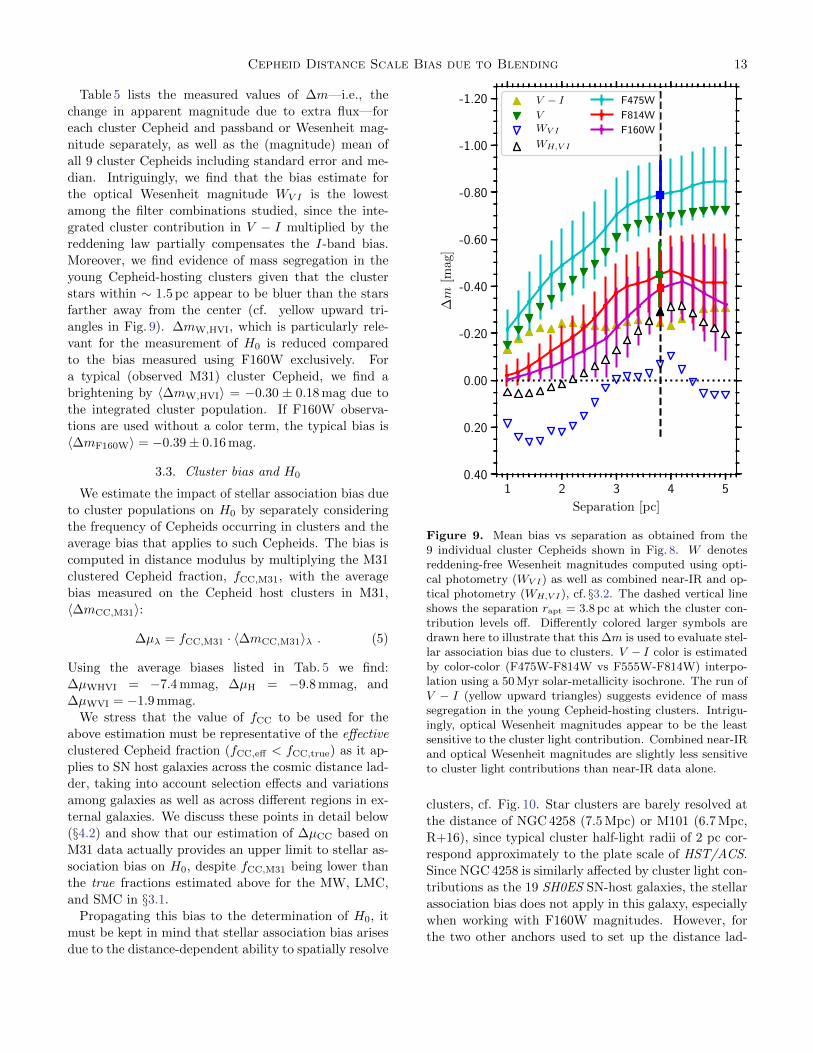
Table 5 lists the measured values of ∆m—i.e., the
change in apparent magnitude due to extra flux—for
each cluster Cepheid and passband or Wesenheit mag-
nitude separately, as well as the (magnitude) mean of
all 9 cluster Cepheids including standard error and me-
dian. Intriguingly, we find that the bias estimate for
the optical Wesenheit magnitude WV I is the lowest
among the filter combinations studied, since the inte-
grated cluster contribution in V − I multiplied by the
reddening law partially compensates the I-band bias.
Moreover, we find evidence of mass segregation in the
young Cepheid-hosting clusters given that the cluster
stars within ∼ 1.5 pc appear to be bluer than the stars
farther away from the center (cf. yellow upward tri-
angles in Fig. 9). ∆mW,HVI, which is particularly rele-
vant for the measurement of H0 is reduced compared
to the bias measured using F160W exclusively. For
a typical (observed M31) cluster Cepheid, we find a
brightening by 〈∆mW,HVI〉 = −0.30 ± 0.18 mag due to
the integrated cluster population. If F160W observa-
tions are used without a color term, the typical bias is
〈∆mF160W〉 = −0.39± 0.16 mag.
3.3. Cluster bias and H0
We estimate the impact of stellar association bias due
to cluster populations on H0 by separately considering
the frequency of Cepheids occurring in clusters and the
average bias that applies to such Cepheids. The bias is
computed in distance modulus by multiplying the M31
clustered Cepheid fraction, fCC,M31, with the average
bias measured on the Cepheid host clusters in M31,
〈∆mCC,M31〉:
∆µλ = fCC,M31 · 〈∆mCC,M31〉λ . (5)
Using the average biases listed in Tab. 5 we find:
∆µWHVI = −7.4 mmag, ∆µH = −9.8 mmag, and
∆µWVI = −1.9 mmag.
We stress that the value of fCC to be used for the
above estimation must be representative of the effective
clustered Cepheid fraction (fCC,eff < fCC,true) as it ap-
plies to SN host galaxies across the cosmic distance lad-
der, taking into account selection effects and variations
among galaxies as well as across different regions in ex-
ternal galaxies. We discuss these points in detail below
(§4.2) and show that our estimation of ∆µCC based on
M31 data actually provides an upper limit to stellar as-
sociation bias on H0, despite fCC,M31 being lower than
the true fractions estimated above for the MW, LMC,
and SMC in §3.1.
Propagating this bias to the determination of H0, it
must be kept in mind that stellar association bias arises
due to the distance-dependent ability to spatially resolve
1 2 3 4 5
Separation [pc]
-1.20
-1.00
-0.80
-0.60
-0.40
-0.20
0.00
0.20
0.40
∆m
[mag
]
V − IVWV I
WH,V I
F475W
F814W
F160W
Figure 9. Mean bias vs separation as obtained from the9 individual cluster Cepheids shown in Fig. 8. W denotesreddening-free Wesenheit magnitudes computed using opti-cal photometry (WV I) as well as combined near-IR and op-tical photometry (WH,V I), cf. §3.2. The dashed vertical lineshows the separation rapt = 3.8 pc at which the cluster con-tribution levels off. Differently colored larger symbols aredrawn here to illustrate that this ∆m is used to evaluate stel-lar association bias due to clusters. V − I color is estimatedby color-color (F475W-F814W vs F555W-F814W) interpo-lation using a 50 Myr solar-metallicity isochrone. The run ofV − I (yellow upward triangles) suggests evidence of masssegregation in the young Cepheid-hosting clusters. Intrigu-ingly, optical Wesenheit magnitudes appear to be the leastsensitive to the cluster light contribution. Combined near-IRand optical Wesenheit magnitudes are slightly less sensitiveto cluster light contributions than near-IR data alone.
clusters, cf. Fig. 10. Star clusters are barely resolved at
the distance of NGC 4258 (7.5 Mpc) or M101 (6.7 Mpc,
R+16), since typical cluster half-light radii of 2 pc cor-
respond approximately to the plate scale of HST/ACS.
Since NGC 4258 is similarly affected by cluster light con-
tributions as the 19 SH0ES SN-host galaxies, the stellar
association bias does not apply in this galaxy, especially
when working with F160W magnitudes. However, for
the two other anchors used to set up the distance lad-
14 R.I. Anderson & A.G. Riess
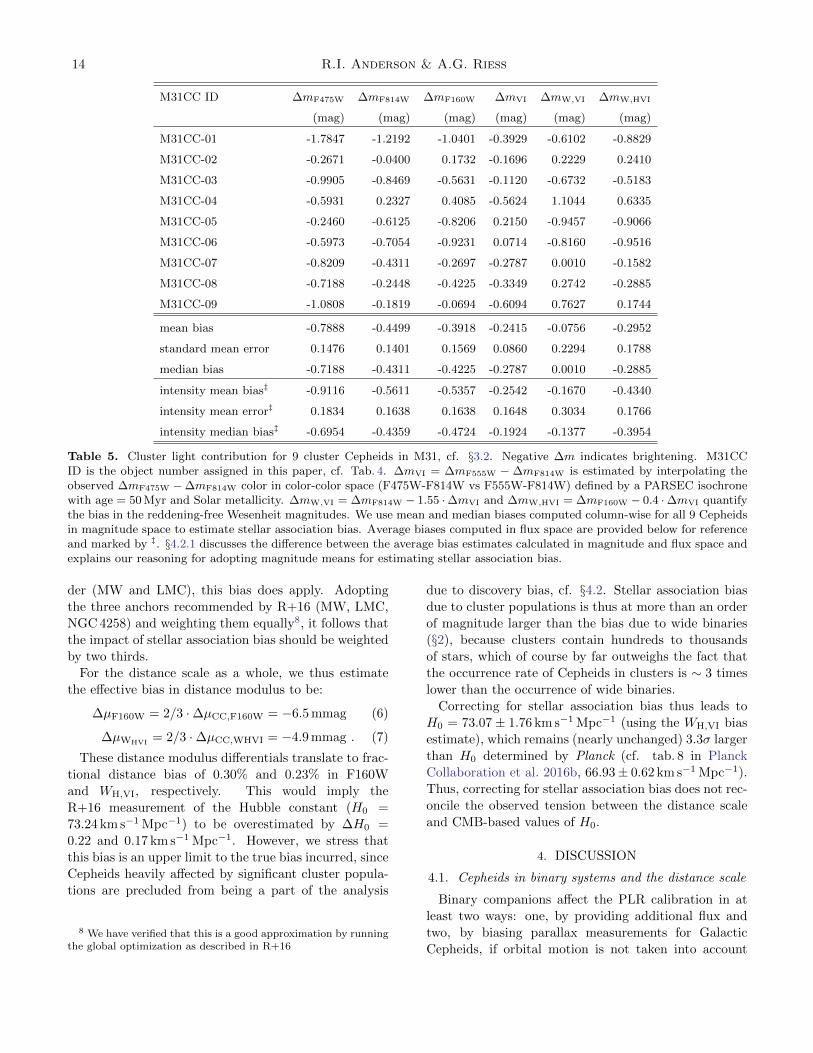
M31CC ID ∆mF475W ∆mF814W ∆mF160W ∆mVI ∆mW,VI ∆mW,HVI
(mag) (mag) (mag) (mag) (mag) (mag)
M31CC-01 -1.7847 -1.2192 -1.0401 -0.3929 -0.6102 -0.8829
M31CC-02 -0.2671 -0.0400 0.1732 -0.1696 0.2229 0.2410
M31CC-03 -0.9905 -0.8469 -0.5631 -0.1120 -0.6732 -0.5183
M31CC-04 -0.5931 0.2327 0.4085 -0.5624 1.1044 0.6335
M31CC-05 -0.2460 -0.6125 -0.8206 0.2150 -0.9457 -0.9066
M31CC-06 -0.5973 -0.7054 -0.9231 0.0714 -0.8160 -0.9516
M31CC-07 -0.8209 -0.4311 -0.2697 -0.2787 0.0010 -0.1582
M31CC-08 -0.7188 -0.2448 -0.4225 -0.3349 0.2742 -0.2885
M31CC-09 -1.0808 -0.1819 -0.0694 -0.6094 0.7627 0.1744
mean bias -0.7888 -0.4499 -0.3918 -0.2415 -0.0756 -0.2952
standard mean error 0.1476 0.1401 0.1569 0.0860 0.2294 0.1788
median bias -0.7188 -0.4311 -0.4225 -0.2787 0.0010 -0.2885
intensity mean bias‡ -0.9116 -0.5611 -0.5357 -0.2542 -0.1670 -0.4340
intensity mean error‡ 0.1834 0.1638 0.1638 0.1648 0.3034 0.1766
intensity median bias‡ -0.6954 -0.4359 -0.4724 -0.1924 -0.1377 -0.3954
Table 5. Cluster light contribution for 9 cluster Cepheids in M31, cf. §3.2. Negative ∆m indicates brightening. M31CCID is the object number assigned in this paper, cf. Tab. 4. ∆mVI = ∆mF555W − ∆mF814W is estimated by interpolating theobserved ∆mF475W −∆mF814W color in color-color space (F475W-F814W vs F555W-F814W) defined by a PARSEC isochronewith age = 50 Myr and Solar metallicity. ∆mW,VI = ∆mF814W − 1.55 ·∆mVI and ∆mW,HVI = ∆mF160W − 0.4 ·∆mVI quantifythe bias in the reddening-free Wesenheit magnitudes. We use mean and median biases computed column-wise for all 9 Cepheidsin magnitude space to estimate stellar association bias. Average biases computed in flux space are provided below for referenceand marked by ‡. §4.2.1 discusses the difference between the average bias estimates calculated in magnitude and flux space andexplains our reasoning for adopting magnitude means for estimating stellar association bias.
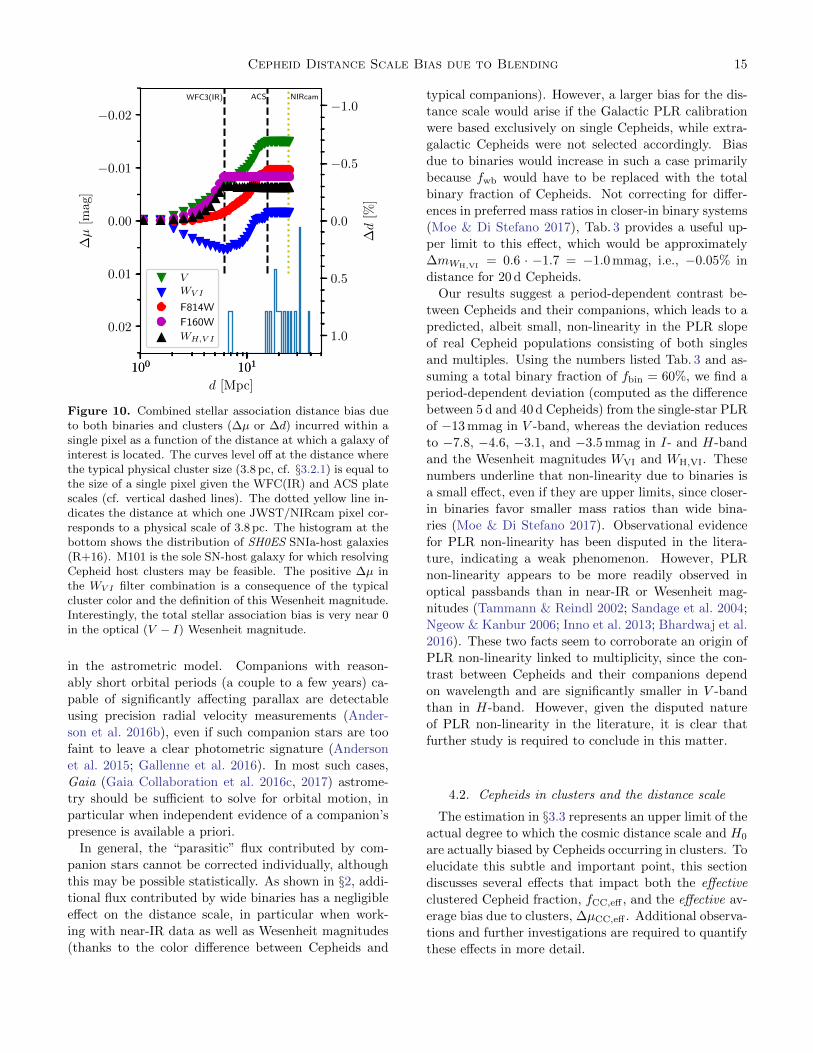
der (MW and LMC), this bias does apply. Adopting
the three anchors recommended by R+16 (MW, LMC,
NGC 4258) and weighting them equally8, it follows that
the impact of stellar association bias should be weighted
by two thirds.
For the distance scale as a whole, we thus estimate
the effective bias in distance modulus to be:
∆µF160W = 2/3 ·∆µCC,F160W = −6.5 mmag (6)
∆µWHVI= 2/3 ·∆µCC,WHVI = −4.9 mmag . (7)
These distance modulus differentials translate to frac-
tional distance bias of 0.30% and 0.23% in F160W
and WH,VI, respectively. This would imply the
R+16 measurement of the Hubble constant (H0 =
73.24 km s−1 Mpc−1) to be overestimated by ∆H0 =
0.22 and 0.17 km s−1 Mpc−1. However, we stress that
this bias is an upper limit to the true bias incurred, since
Cepheids heavily affected by significant cluster popula-
tions are precluded from being a part of the analysis
8 We have verified that this is a good approximation by runningthe global optimization as described in R+16
due to discovery bias, cf. §4.2. Stellar association bias
due to cluster populations is thus at more than an order
of magnitude larger than the bias due to wide binaries
(§2), because clusters contain hundreds to thousands
of stars, which of course by far outweighs the fact that
the occurrence rate of Cepheids in clusters is ∼ 3 times
lower than the occurrence of wide binaries.
Correcting for stellar association bias thus leads to
H0 = 73.07 ± 1.76 km s−1 Mpc−1 (using the WH,VI bias
estimate), which remains (nearly unchanged) 3.3σ larger
than H0 determined by Planck (cf. tab. 8 in Planck
Collaboration et al. 2016b, 66.93± 0.62 km s−1 Mpc−1).
Thus, correcting for stellar association bias does not rec-
oncile the observed tension between the distance scale
and CMB-based values of H0.
4. DISCUSSION
4.1. Cepheids in binary systems and the distance scale
Binary companions affect the PLR calibration in at
least two ways: one, by providing additional flux and
two, by biasing parallax measurements for Galactic
Cepheids, if orbital motion is not taken into account
Cepheid Distance Scale Bias due to Blending 15
100 101
d [Mpc]
−0.02
−0.01
0.00
0.01
0.02
∆µ
[mag
]WFC3(IR) ACS NIRcam
VWV I
F814W
F160W
WH,V I
100 101
−1.0
−0.5
0.0
0.5
1.0
∆d
[%]
Figure 10. Combined stellar association distance bias dueto both binaries and clusters (∆µ or ∆d) incurred within asingle pixel as a function of the distance at which a galaxy ofinterest is located. The curves level off at the distance wherethe typical physical cluster size (3.8 pc, cf. §3.2.1) is equal tothe size of a single pixel given the WFC(IR) and ACS platescales (cf. vertical dashed lines). The dotted yellow line in-dicates the distance at which one JWST/NIRcam pixel cor-responds to a physical scale of 3.8 pc. The histogram at thebottom shows the distribution of SH0ES SNIa-host galaxies(R+16). M101 is the sole SN-host galaxy for which resolvingCepheid host clusters may be feasible. The positive ∆µ inthe WV I filter combination is a consequence of the typicalcluster color and the definition of this Wesenheit magnitude.Interestingly, the total stellar association bias is very near 0in the optical (V − I) Wesenheit magnitude.
in the astrometric model. Companions with reason-
ably short orbital periods (a couple to a few years) ca-
pable of significantly affecting parallax are detectable
using precision radial velocity measurements (Ander-
son et al. 2016b), even if such companion stars are too
faint to leave a clear photometric signature (Anderson
et al. 2015; Gallenne et al. 2016). In most such cases,
Gaia (Gaia Collaboration et al. 2016c, 2017) astrome-
try should be sufficient to solve for orbital motion, in
particular when independent evidence of a companion’s
presence is available a priori.
In general, the “parasitic” flux contributed by com-
panion stars cannot be corrected individually, although
this may be possible statistically. As shown in §2, addi-
tional flux contributed by wide binaries has a negligible
effect on the distance scale, in particular when work-
ing with near-IR data as well as Wesenheit magnitudes
(thanks to the color difference between Cepheids and
typical companions). However, a larger bias for the dis-
tance scale would arise if the Galactic PLR calibration
were based exclusively on single Cepheids, while extra-
galactic Cepheids were not selected accordingly. Bias
due to binaries would increase in such a case primarily
because fwb would have to be replaced with the total
binary fraction of Cepheids. Not correcting for differ-
ences in preferred mass ratios in closer-in binary systems
(Moe & Di Stefano 2017), Tab. 3 provides a useful up-
per limit to this effect, which would be approximately
∆mWH,VI = 0.6 · −1.7 = −1.0 mmag, i.e., −0.05% in
distance for 20 d Cepheids.
Our results suggest a period-dependent contrast be-
tween Cepheids and their companions, which leads to a
predicted, albeit small, non-linearity in the PLR slope
of real Cepheid populations consisting of both singles
and multiples. Using the numbers listed Tab. 3 and as-
suming a total binary fraction of fbin = 60%, we find a
period-dependent deviation (computed as the difference
between 5 d and 40 d Cepheids) from the single-star PLR
of −13 mmag in V -band, whereas the deviation reduces
to −7.8, −4.6, −3.1, and −3.5 mmag in I- and H-band
and the Wesenheit magnitudes WVI and WH,VI. These
numbers underline that non-linearity due to binaries is
a small effect, even if they are upper limits, since closer-
in binaries favor smaller mass ratios than wide bina-
ries (Moe & Di Stefano 2017). Observational evidence
for PLR non-linearity has been disputed in the litera-
ture, indicating a weak phenomenon. However, PLR
non-linearity appears to be more readily observed in
optical passbands than in near-IR or Wesenheit mag-
nitudes (Tammann & Reindl 2002; Sandage et al. 2004;
Ngeow & Kanbur 2006; Inno et al. 2013; Bhardwaj et al.
2016). These two facts seem to corroborate an origin of
PLR non-linearity linked to multiplicity, since the con-
trast between Cepheids and their companions depend
on wavelength and are significantly smaller in V -band
than in H-band. However, given the disputed nature
of PLR non-linearity in the literature, it is clear that
further study is required to conclude in this matter.
4.2. Cepheids in clusters and the distance scale
The estimation in §3.3 represents an upper limit of the
actual degree to which the cosmic distance scale and H0
are actually biased by Cepheids occurring in clusters. To
elucidate this subtle and important point, this section
discusses several effects that impact both the effective
clustered Cepheid fraction, fCC,eff , and the effective av-
erage bias due to clusters, ∆µCC,eff . Additional observa-
tions and further investigations are required to quantify
these effects in more detail.
16 R.I. Anderson & A.G. Riess
Firstly, discovery bias reduces fCC,eff relative to the
true fCC in distant galaxies, since strict selection cri-
teria applied to extragalactic Cepheid candidates (cf.
Riess et al. 2011; Kodric et al. 2013; Wagner-Kaiser
et al. 2015) preclude heavily blended Cepheids from be-
ing used in the distance scale calibration. Hoffmann
et al. (2016, their Sec. 4.2) describe the selection cri-
teria applied to Cepheids in the SH0ES project in de-
tail. The criteria include light curve shape (fit agree-
ment with template light curves and visual inspection),
amplitudes, mean colors, and proximity to the Leavitt
Law in a given galaxy. A period dependence of discovery
bias is expected, because of lower intrinsic amplitudes
among Cepheids with Pp ∼ 10 d and > 40 d. Quantify-
ing this discovery bias including its dependence on Pp,
(unbiased) amplitude, reddening, and galaxy-specific as-
pects such as metallicity or background levels, etc., is
not straightforward, however, and outside the scope of
this work.
In a previous investigation of blending-related issues
on the distance scale, Ferrarese et al. (2000) noted that
contamination levels above 60% (−0.5 mag) would usu-
ally be discernible during light curve inspection, whereas
contamination levels below (30%) would usually not be
noticed. We measure an average bias of −0.79 mag in
F475W, cf. Tab. 5, (−0.70 mag in F555W), which im-
plies clearly noticeable effects on Cepheid light curves
in short-wavelength optical bands. This notably in-
cludes F350LP, which is used for Cepheid discovery (ef-
fective wavelengths: 0.53µm and 0.61µm for F555W
and F350LP). Hence, the cluster Cepheids studied here
would most likely not form part of the observed Cepheid
Leavitt Law in more distant galaxies.
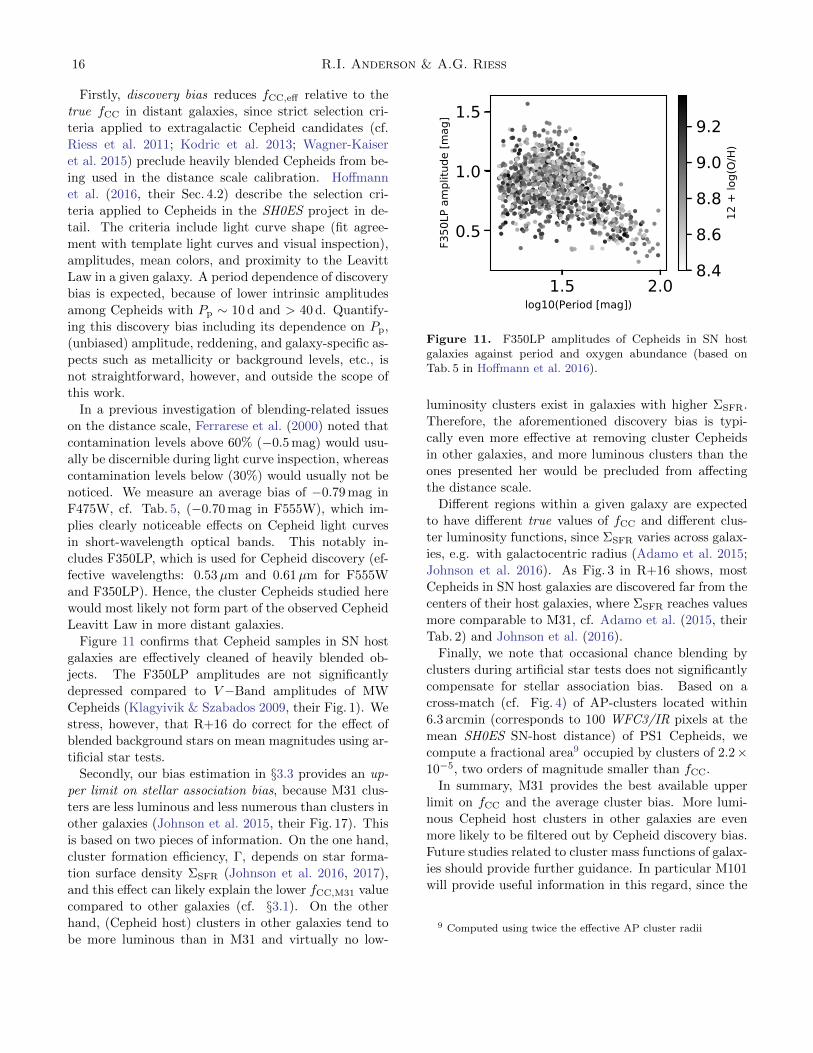
Figure 11 confirms that Cepheid samples in SN host
galaxies are effectively cleaned of heavily blended ob-
jects. The F350LP amplitudes are not significantly
depressed compared to V−Band amplitudes of MW
Cepheids (Klagyivik & Szabados 2009, their Fig. 1). We
stress, however, that R+16 do correct for the effect of
blended background stars on mean magnitudes using ar-
tificial star tests.
Secondly, our bias estimation in §3.3 provides an up-
per limit on stellar association bias, because M31 clus-
ters are less luminous and less numerous than clusters in
other galaxies (Johnson et al. 2015, their Fig. 17). This
is based on two pieces of information. On the one hand,
cluster formation efficiency, Γ, depends on star forma-
tion surface density ΣSFR (Johnson et al. 2016, 2017),
and this effect can likely explain the lower fCC,M31 value
compared to other galaxies (cf. §3.1). On the other
hand, (Cepheid host) clusters in other galaxies tend to
be more luminous than in M31 and virtually no low-
1.5 2.0log10(Period [mag])
0.5
1.0
1.5
F350
LP a
mpl
itude
[mag
]
8.4
8.6
8.8
9.0
9.2
12 +
log(
O/H)
Figure 11. F350LP amplitudes of Cepheids in SN hostgalaxies against period and oxygen abundance (based onTab. 5 in Hoffmann et al. 2016).
luminosity clusters exist in galaxies with higher ΣSFR.
Therefore, the aforementioned discovery bias is typi-
cally even more effective at removing cluster Cepheids
in other galaxies, and more luminous clusters than the
ones presented her would be precluded from affecting
the distance scale.
Different regions within a given galaxy are expected
to have different true values of fCC and different clus-
ter luminosity functions, since ΣSFR varies across galax-
ies, e.g. with galactocentric radius (Adamo et al. 2015;
Johnson et al. 2016). As Fig. 3 in R+16 shows, most
Cepheids in SN host galaxies are discovered far from the
centers of their host galaxies, where ΣSFR reaches values
more comparable to M31, cf. Adamo et al. (2015, their
Tab. 2) and Johnson et al. (2016).
Finally, we note that occasional chance blending by
clusters during artificial star tests does not significantly
compensate for stellar association bias. Based on a
cross-match (cf. Fig. 4) of AP-clusters located within
6.3 arcmin (corresponds to 100 WFC3/IR pixels at the
mean SH0ES SN-host distance) of PS1 Cepheids, we
compute a fractional area9 occupied by clusters of 2.2×10⁻⁵, two orders of magnitude smaller than fCC.
In summary, M31 provides the best available upper
limit on fCC and the average cluster bias. More lumi-
nous Cepheid host clusters in other galaxies are even
more likely to be filtered out by Cepheid discovery bias.
Future studies related to cluster mass functions of galax-
ies should provide further guidance. In particular M101
will provide useful information in this regard, since the
9 Computed using twice the effective AP cluster radii

Cepheid Distance Scale Bias due to Blending 17
prospects for spatially resolving clusters using JWST are
the best in this SH0ES SN host galaxy.
4.2.1. Averaging cluster bias in magnitude and flux space
Following a comment from the referee, we have calcu-
lated the typical cluster bias in intensity space as well as
in magnitude space. Averaging the contributions from
the 9 clusters yields a noticeably different typical bias es-
timate, cf. Tab. 5. However, working with flux-averages
implies a different interpretation of this bias due to dif-
ferent underlying assumptions. Specifically, averaging in
magnitude space implies that the bias is multiplicative
in flux space. Averaging in flux space implies that the
bias is additive in flux space. As a result, the estima-
tion of the total bias as it applies to H0 must take into
account the average luminosity of Cepheids in SN host
galaxies when working with intensity averages.
Cepheids in SN host galaxies are on average more lu-
minous than M31 cluster Cepheids. To wit, 〈logPp,CC,M31〉 ≈1.08 among M31 cluster Cepheids and 〈logPp,SN〉 ≈ 1.45
among Cepheids in SN-host galaxies (tab. 4 in R+16,
not counting Cepheids in the anchor galaxies M31 and
NGC 4258, since M31 is excluded from the R+16 recom-
mended solutions and clusters are not spatially resolved
in NGC 4258). Hence, the intensity-averaged distance
modulus bias is rescaled as:
∆µCC,log Pp= −2.5 log
(1 +
10−0.4∆µCC,M31 − 1
10−0.4b·δ logPp
),
(8)
where b = −3.27 (−3.06) is the slope of the PLR in
WH,VI (F160W) magnitudes (R+16, their Tab. 8) and
δ logPp = 1.45 − 1.08 = 0.37. Hence, the flux-averaged
∆µλ is corrected downward by a factor of 3.0 (2.8), yield-
ing ∆µCC,log Pp= −3.8 mmag (−4.7 mmag) and an H0
bias of 0.15 % (0.12 %) using WH,VI (F160W), which is
about half the impact estimated in §3.3.
We presently do not have sufficient information to un-
derstand whether cluster bias is more constant in mag-
nitude or in flux space. However, we have a small pref-
erence for considering the bias constant in magnitude,
since there are physical reasons to expect host popula-
tions of longer-Pp cluster Cepheid to be brighter than
those of their shorter-period counterparts. Specifically,
Cepheid masses correlate with Pp, and total cluster
mass depends the most massive member’s mass (Wei-
dner et al. 2010), and more massive clusters are more
luminous (for MW clusters, cf. Piskunov et al. 2011).
However, turning cluster mass into light is inefficient
and the contrast between an evolved Cepheid and the
hottest MS cluster members increases with Pp, in par-
ticular when working with Wesenheit or infrared mag-
nitudes. Thus, the selection bias towards more long-
F475W
Norm
alize
dfre
quen
cy
F814W
12 14 16 18 20 22 24Apparent magnitude [mag]
F160W
Figure 12. Luminosities of all PHAT clusters (Johnsonet al. 2015, filled in step historgrams) compared to the lu-minosities of 9 Cepheid-hosting clusters in M31 (black stephistograms). All histograms are normalized to unit area.
period Cepheids in extragalactic samples decreases av-
erage cluster bias, even when working with magnitude
averages.
4.3. Considerations regarding fCC,true
The effective clustered Cepheid fraction as it applies
to Cepheids in SN host galaxies linearly affects the result
of the total bias (cf. §3.3 and 4.2), and is thus one of the
key uncertainties for this work. However, the true fCC
provides interesting information on several astrophysical
processes and deserves further attention. Here, we dis-
cuss the completeness of the estimation of true value of
fCC,M31 (§4.3.1) and a possible dependence of fCC,true
on age (§4.3.2)—and thus Pp.
4.3.1. Completeness of fCC,M31
Figure 12 shows normalized distributions of AP cluster
integrated magnitudes and highlights known Cepheid
host clusters for optical and near-IR passbands. No se-
lection based on age was made when preparing these his-
tograms. The figure illustrates the result of §3.2.1 that
Cepheid host clusters have fairly hot member stars, i.e.,
have blue integrated colors, cf. Fig. 7. The blue intrin-
sic color of Cepheid host clusters may thus be exploited
to identify extragalactic Cepheids that are blended with
host clusters. UV and short wavelength optical (U or B-
band) observations of Cepheids in SH0ES galaxies would
be useful for identifying such cluster contamination.
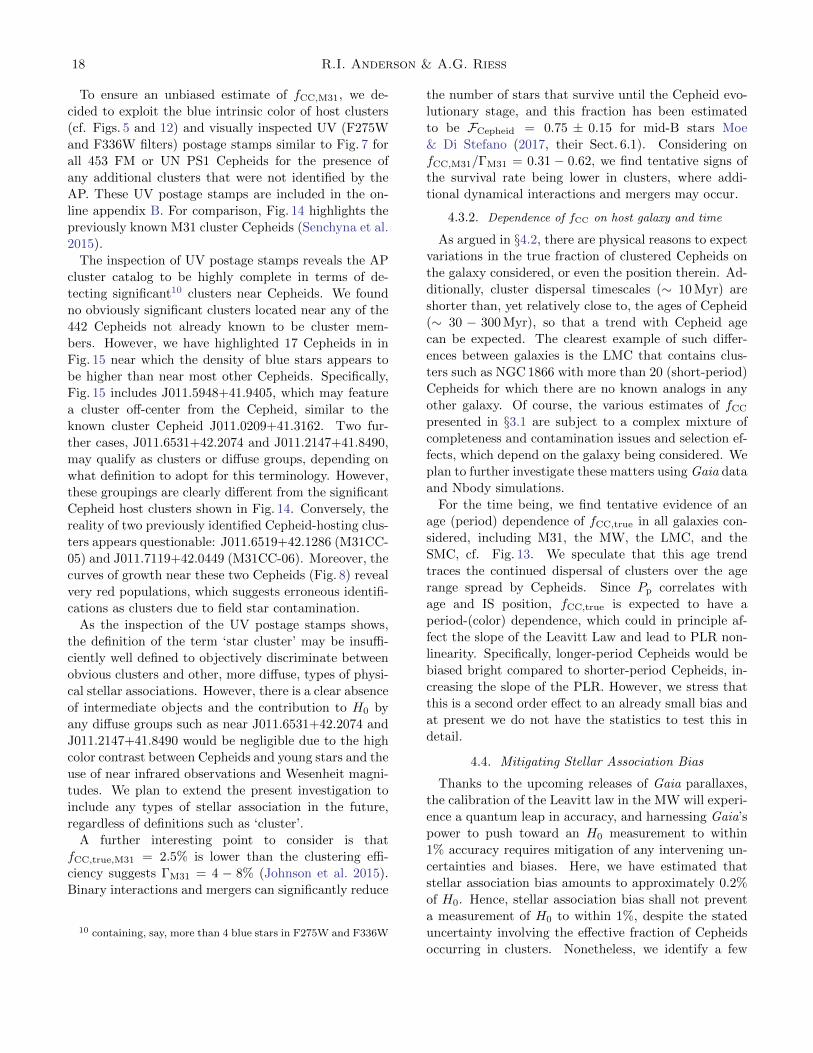
18 R.I. Anderson & A.G. Riess
To ensure an unbiased estimate of fCC,M31, we de-
cided to exploit the blue intrinsic color of host clusters
(cf. Figs. 5 and 12) and visually inspected UV (F275W
and F336W filters) postage stamps similar to Fig. 7 for
all 453 FM or UN PS1 Cepheids for the presence of
any additional clusters that were not identified by the
AP. These UV postage stamps are included in the on-
line appendix B. For comparison, Fig. 14 highlights the
previously known M31 cluster Cepheids (Senchyna et al.
2015).
The inspection of UV postage stamps reveals the AP
cluster catalog to be highly complete in terms of de-
tecting significant10 clusters near Cepheids. We found
no obviously significant clusters located near any of the
442 Cepheids not already known to be cluster mem-
bers. However, we have highlighted 17 Cepheids in in
Fig. 15 near which the density of blue stars appears to
be higher than near most other Cepheids. Specifically,
Fig. 15 includes J011.5948+41.9405, which may feature
a cluster off-center from the Cepheid, similar to the
known cluster Cepheid J011.0209+41.3162. Two fur-
ther cases, J011.6531+42.2074 and J011.2147+41.8490,
may qualify as clusters or diffuse groups, depending on
what definition to adopt for this terminology. However,
these groupings are clearly different from the significant
Cepheid host clusters shown in Fig. 14. Conversely, the
reality of two previously identified Cepheid-hosting clus-
ters appears questionable: J011.6519+42.1286 (M31CC-
05) and J011.7119+42.0449 (M31CC-06). Moreover, the
curves of growth near these two Cepheids (Fig. 8) reveal
very red populations, which suggests erroneous identifi-
cations as clusters due to field star contamination.
As the inspection of the UV postage stamps shows,
the definition of the term ‘star cluster’ may be insuffi-
ciently well defined to objectively discriminate between
obvious clusters and other, more diffuse, types of physi-
cal stellar associations. However, there is a clear absence
of intermediate objects and the contribution to H0 by
any diffuse groups such as near J011.6531+42.2074 and
J011.2147+41.8490 would be negligible due to the high
color contrast between Cepheids and young stars and the
use of near infrared observations and Wesenheit magni-
tudes. We plan to extend the present investigation to
include any types of stellar association in the future,
regardless of definitions such as ‘cluster’.
A further interesting point to consider is that
fCC,true,M31 = 2.5% is lower than the clustering effi-
ciency suggests ΓM31 = 4 − 8% (Johnson et al. 2015).
Binary interactions and mergers can significantly reduce
10 containing, say, more than 4 blue stars in F275W and F336W
the number of stars that survive until the Cepheid evo-
lutionary stage, and this fraction has been estimated
to be FCepheid = 0.75 ± 0.15 for mid-B stars Moe
& Di Stefano (2017, their Sect. 6.1). Considering on
fCC,M31/ΓM31 = 0.31 − 0.62, we find tentative signs of
the survival rate being lower in clusters, where addi-
tional dynamical interactions and mergers may occur.
4.3.2. Dependence of fCC on host galaxy and time
As argued in §4.2, there are physical reasons to expect
variations in the true fraction of clustered Cepheids on
the galaxy considered, or even the position therein. Ad-
ditionally, cluster dispersal timescales (∼ 10 Myr) are
shorter than, yet relatively close to, the ages of Cepheid
(∼ 30 − 300 Myr), so that a trend with Cepheid age
can be expected. The clearest example of such differ-
ences between galaxies is the LMC that contains clus-
ters such as NGC 1866 with more than 20 (short-period)
Cepheids for which there are no known analogs in any
other galaxy. Of course, the various estimates of fCC
presented in §3.1 are subject to a complex mixture of
completeness and contamination issues and selection ef-
fects, which depend on the galaxy being considered. We
plan to further investigate these matters using Gaia data
and Nbody simulations.
For the time being, we find tentative evidence of an
age (period) dependence of fCC,true in all galaxies con-
sidered, including M31, the MW, the LMC, and the
SMC, cf. Fig. 13. We speculate that this age trend
traces the continued dispersal of clusters over the age
range spread by Cepheids. Since Pp correlates with
age and IS position, fCC,true is expected to have a
period-(color) dependence, which could in principle af-
fect the slope of the Leavitt Law and lead to PLR non-
linearity. Specifically, longer-period Cepheids would be
biased bright compared to shorter-period Cepheids, in-
creasing the slope of the PLR. However, we stress that
this is a second order effect to an already small bias and
at present we do not have the statistics to test this in
detail.
4.4. Mitigating Stellar Association Bias
Thanks to the upcoming releases of Gaia parallaxes,
the calibration of the Leavitt law in the MW will experi-
ence a quantum leap in accuracy, and harnessing Gaia’s
power to push toward an H0 measurement to within
1% accuracy requires mitigation of any intervening un-
certainties and biases. Here, we have estimated that
stellar association bias amounts to approximately 0.2%
of H0. Hence, stellar association bias shall not prevent
a measurement of H0 to within 1%, despite the stated
uncertainty involving the effective fraction of Cepheids
occurring in clusters. Nonetheless, we identify a few
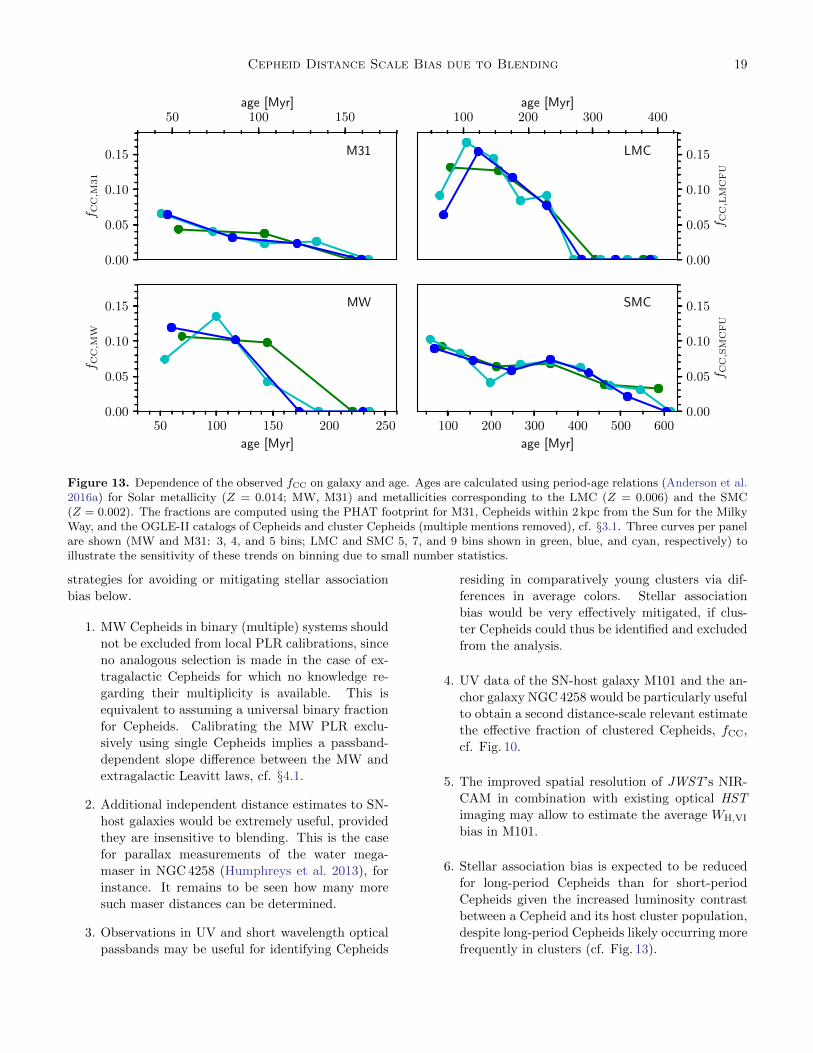
Cepheid Distance Scale Bias due to Blending 19
50 100 150age [Myr]
0.00
0.05
0.10
0.15
f CC,M
31
M31
100 200 300 400age [Myr]
0.00
0.05
0.10
0.15
f CC,L
MC
FU
LMC
50 100 150 200 250
age [Myr]
0.00
0.05
0.10
0.15
f CC,M
W
MW
100 200 300 400 500 600
age [Myr]
0.00
0.05
0.10
0.15
f CC,S
MC
FU
SMC
Figure 13. Dependence of the observed fCC on galaxy and age. Ages are calculated using period-age relations (Anderson et al.2016a) for Solar metallicity (Z = 0.014; MW, M31) and metallicities corresponding to the LMC (Z = 0.006) and the SMC(Z = 0.002). The fractions are computed using the PHAT footprint for M31, Cepheids within 2 kpc from the Sun for the MilkyWay, and the OGLE-II catalogs of Cepheids and cluster Cepheids (multiple mentions removed), cf. §3.1. Three curves per panelare shown (MW and M31: 3, 4, and 5 bins; LMC and SMC 5, 7, and 9 bins shown in green, blue, and cyan, respectively) toillustrate the sensitivity of these trends on binning due to small number statistics.
strategies for avoiding or mitigating stellar association
bias below.
1. MW Cepheids in binary (multiple) systems should
not be excluded from local PLR calibrations, since
no analogous selection is made in the case of ex-
tragalactic Cepheids for which no knowledge re-
garding their multiplicity is available. This is
equivalent to assuming a universal binary fraction
for Cepheids. Calibrating the MW PLR exclu-
sively using single Cepheids implies a passband-
dependent slope difference between the MW and
extragalactic Leavitt laws, cf. §4.1.
2. Additional independent distance estimates to SN-
host galaxies would be extremely useful, provided
they are insensitive to blending. This is the case
for parallax measurements of the water mega-
maser in NGC 4258 (Humphreys et al. 2013), for
instance. It remains to be seen how many more
such maser distances can be determined.
3. Observations in UV and short wavelength optical
passbands may be useful for identifying Cepheids
residing in comparatively young clusters via dif-
ferences in average colors. Stellar association
bias would be very effectively mitigated, if clus-
ter Cepheids could thus be identified and excluded
from the analysis.
4. UV data of the SN-host galaxy M101 and the an-
chor galaxy NGC 4258 would be particularly useful
to obtain a second distance-scale relevant estimate
the effective fraction of clustered Cepheids, fCC,
cf. Fig. 10.
5. The improved spatial resolution of JWST’s NIR-
CAM in combination with existing optical HST
imaging may allow to estimate the average WH,VI
bias in M101.
6. Stellar association bias is expected to be reduced
for long-period Cepheids than for short-period
Cepheids given the increased luminosity contrast
between a Cepheid and its host cluster population,
despite long-period Cepheids likely occurring more
frequently in clusters (cf. Fig. 13).
20 R.I. Anderson & A.G. Riess
5. SUMMARY
We have investigated the effect of stellar association
bias on Cepheid distance measurements and the Hubble
constant. Understanding this and other possible biases
affecting the distance scale is crucial for measuring H0
with an accuracy of 1% to elucidate dark energy and
understand the origin of the observed tension between
distance scale and CMB-based determinations of H0.
We have estimated stellar association bias in two
parts. First, we have used state-of-the-art stellar evolu-
tion models (Ekstrom et al. 2012) and detailed statistics
on the multiplicity fraction of intermediate-mass stars
to investigate the effect of wide binaries. We show that
wide binaries have a negligible effect of approximately
0.004% on H0.
Second, we have used deep HST imaging of M31 pro-
vided by the PHAT survey (Dalcanton et al. 2012)
to measure the photometric contribution by typical
Cepheid hosting clusters in photometric passbands com-
monly used to construct the distance scale. We have
further considered the clustered fraction of Cepheids,
fCC in different galaxies (MW, LMC, SMC, M31). We
find that the true value of fCC likely varies considerably
among galaxies and within a given galaxy, as well as with
time (age). However, discovery bias reduces the effec-
tive fraction applicable to the distance scale calibration,
fCC,eff , considerably, thus implying a small overall ef-
fect of stellar association bias on the distance scale. We
find the M31 based estimate of fCC,M31 = 2.5% to be
the most adequate number for the estimation of stellar
association bias due to clusters.
Using M31’s cluster Cepheid population, we esti-
mate the H0 bias due to star clusters at approximately
−0.30% and −0.23%, respectively using H−band
(F160W) observations and Wesenheit magnitudesWH,VI
based on F160W, F555W, and F814W observations.
We notice that this represents an upper limit to the
likely bias level, since the present sample of M31 cluster
Cepheids would have likely been precluded from further
analysis due to discovery bias and sample selection.
We have thus shown that stellar association bias does
not prevent achieving 1% accuracy on H0, and that stel-
lar association bias does not explain recently discussed
tension between H0 values based on the extragalactic
distance scale and the CMB. Further research into this
area is warranted, in particular to better understand
fCC,eff . Short optical wavelength observations of nearby
Cepheid hosting galaxies would be particularly benefi-
cial to this end.
We thank the anonymous referee for their detailed re-
port and Stefano Casertano for useful discussions. We
further acknowledge a useful comment by L. Clifton
Johnson related to M31’s star formation surface density.
Based on observations made with the NASA/ESA
Hubble Space Telescope, obtained from the data archive
at the Space Telescope Science Institute. STScI is oper-
ated by the Association of Universities for Research in
Astronomy, Inc. under NASA contract NAS 5-26555.
This research made use of NASA’s Astrophysics
Data System Bibliographic Services and Astropy, a
community-developed core Python package for Astron-
omy (Astropy Collaboration et al. 2013).
Facilities: HST(ACS and WFC3)
Software: astropy (Astropy Collaboration et al.
2013)
REFERENCES
Abbott, B. P., Abbott, R., Abbott, T. D., & et al. 2017,
Nature, 551, 85
Adamo, A., Kruijssen, J. M. D., Bastian, N., Silva-Villa, E.,
& Ryon, J. 2015, MNRAS, 452, 246
Addison, G. E., Watts, D. J., Bennett, C. L., et al. 2018,
ApJ, 853, 119
Anderson, R. I. 2013, PhD thesis, Universite de Geneve
Anderson, R. I., Ekstrom, S., Georgy, C., et al. 2014, A&A,
564, A100
Anderson, R. I., Ekstrom, S., Georgy, C., Meynet, G., &
Saio, H. 2017, in European Physical Journal Web of
Conferences, Vol. 152, Wide-Field Variability Surveys: A
21st Century Perspective – 22nd Los Alamos Stellar
Pulsation – Conference Series Meeting, 06002
Anderson, R. I., Eyer, L., & Mowlavi, N. 2013, MNRAS,
434, 2238
Anderson, R. I., Sahlmann, J., Holl, B., et al. 2015, ApJ,
804, 144
Anderson, R. I., Saio, H., Ekstrom, S., Georgy, C., &
Meynet, G. 2016a, A&A, 591, A8
Anderson, R. I., Casertano, S., Riess, A. G., et al. 2016b,
ApJS, 226, 18

Cepheid Distance Scale Bias due to Blending 21
Astropy Collaboration, Robitaille, T. P., Tollerud, E. J.,
et al. 2013, A&A, 558, A33
Baranowski, R., Smolec, R., Dimitrov, W., et al. 2009,
MNRAS, 396, 2194
Beaton, R. L., Freedman, W. L., Madore, B. F., et al. 2016,
ApJ, 832, 210
Benedict, G. F., McArthur, B. E., Feast, M. W., et al.
2007, AJ, 133, 1810
Besla, G., Kallivayalil, N., Hernquist, L., et al. 2012,
MNRAS, 421, 2109
Bhardwaj, A., Kanbur, S. M., Macri, L. M., et al. 2016,
MNRAS, 457, 1644
Bonvin, V., Courbin, F., Suyu, S. H., et al. 2017, MNRAS,
465, 4914
Bresolin, F., Pietrzynski, G., Gieren, W., & Kudritzki,
R.-P. 2005, ApJ, 634, 1020
Cardelli, J. A., Clayton, G. C., & Mathis, J. S. 1989, ApJ,
345, 245
Cardona, W., Kunz, M., & Pettorino, V. 2017, JCAP, 3,
056
Casertano, S., Riess, A. G., Anderson, J., et al. 2016, ApJ,
825, 11
Dalcanton, J. J., Williams, B. F., Lang, D., et al. 2012,
ApJS, 200, 18
Del Pozzo, W. 2012, PhRvD, 86, 043011
Dhawan, S., Jha, S. W., & Leibundgut, B. 2018, A&A, 609,
A72
Dias, W. S., Alessi, B. S., Moitinho, A., & Lepine, J. R. D.
2002, A&A, 389, 871
Ekstrom, S., Georgy, C., Eggenberger, P., et al. 2012,
A&A, 537, A146
Evans, N. R., Bond, H. E., Schaefer, G. H., et al. 2016a,
AJ, 151, 129
Evans, N. R., Pillitteri, I., Wolk, S., et al. 2016b, AJ, 151,
108
Feeney, S. M., Mortlock, D. J., & Dalmasso, N. 2018,
MNRAS, 476, 3861
Fernie, J. D., Evans, N. R., Beattie, B., & Seager, S. 1995,
Information Bulletin on Variable Stars, 4148
Ferrarese, L., Silbermann, N. A., Mould, J. R., et al. 2000,
PASP, 112, 177
Follin, B., & Knox, L. 2018, MNRAS, arXiv:1707.01175
Freedman, W. L., & Madore, B. F. 2010, ARA&A, 48, 673
Freedman, W. L., Madore, B. F., Gibson, B. K., et al. 2001,
ApJ, 553, 47
Gaia Collaboration, Brown, A. G. A., Vallenari, A., & et al.
2016a, A&A, 595, A2
Gaia Collaboration, Clementini, G., Eyer, L., & et al. 2017,
A&A, 605, A79
Gaia Collaboration, Prusti, T., de Bruijne, J. H. J., & et al.
2016b, A&A, 595, A1
—. 2016c, A&A, 595, A1
Gallenne, A., Merand, A., Kervella, P., et al. 2015, A&A,
579, A68
—. 2016, MNRAS, 461, 1451
Garcıa-Varela, A., Sabogal, B. E., & Ramırez-Tannus,
M. C. 2013, MNRAS, 431, 2278
Garmany, C. D., Conti, P. S., & Massey, P. 1980, ApJ, 242,
1063
Georgy, C., Ekstrom, S., Granada, A., et al. 2013, A&A,
553, A24
Gibson, B. K., Maloney, P. R., & Sakai, S. 2000, ApJL,
530, L5
Gieren, W., Pilecki, B., Pietrzynski, G., et al. 2014, ApJ,
786, 80
Goodwin, S. P., & Bastian, N. 2006, MNRAS, 373, 752
Hoffmann, S. L., Macri, L. M., Riess, A. G., et al. 2016,
ApJ, 830, 10
Humphreys, E. M. L., Reid, M. J., Moran, J. M., Greenhill,
L. J., & Argon, A. L. 2013, ApJ, 775, 13
Inno, L., Matsunaga, N., Bono, G., et al. 2013, ApJ, 764, 84
Johnson, L. C., Seth, A. C., Dalcanton, J. J., et al. 2015,
ApJ, 802, 127
—. 2016, ApJ, 827, 33
—. 2017, ApJ, 839, 78
Kennicutt, Jr., R. C., Stetson, P. B., Saha, A., et al. 1998,
ApJ, 498, 181
Kim, S., Staveley-Smith, L., Dopita, M. A., et al. 1998,
ApJ, 503, 674
Kiss, L. L., & Bedding, T. R. 2005, MNRAS, 358, 883
Klagyivik, P., & Szabados, L. 2009, A&A, 504, 959
Kodric, M., Riffeser, A., Hopp, U., et al. 2013, AJ, 145, 106
Kodric, M., Riffeser, A., Seitz, S., et al. 2015, ApJ, 799, 144
Lada, C. J., & Lada, E. A. 2003, ARA&A, 41, 57
Leavitt, H. S., & Pickering, E. C. 1912, Harvard College
Observatory Circular, 173, 1
Livio, M., & Riess, A. G. 2013, Physics Today, 66, 41
Madore, B. F. 1982, ApJ, 253, 575
Manzotti, A., Dodelson, S., & Park, Y. 2016, PhRvD, 93,
063009
Marigo, P., Girardi, L., Bressan, A., et al. 2017, ApJ, 835,
77
McMillan, P. J. 2011, MNRAS, 414, 2446
Mochejska, B. J., Macri, L. M., Sasselov, D. D., & Stanek,
K. Z. 2000, AJ, 120, 810
—. 2001, ArXiv Astrophysics e-prints, astro-ph/0103440
Moe, M., & Di Stefano, R. 2017, ApJS, 230, 15
Moeckel, N., Holland, C., Clarke, C. J., & Bonnell, I. A.
2012, MNRAS, 425, 450
22 R.I. Anderson & A.G. Riess
Musella, I., Marconi, M., Stetson, P. B., et al. 2016,
MNRAS, 457, 3084
Neilson, H. R., Schneider, F. R. N., Izzard, R. G., Evans,
N. R., & Langer, N. 2015, A&A, 574, A2
Ngeow, C., & Kanbur, S. M. 2006, ApJ, 650, 180
Pecaut, M. J., & Mamajek, E. E. 2013, ApJS, 208, 9
Perlmutter, S., Aldering, G., Goldhaber, G., et al. 1999,
ApJ, 517, 565
Pietrzynski, G., & Udalski, A. 1999, AcA, 49, 543
Pietrzynski, G., Thompson, I. B., Gieren, W., et al. 2010,
Nature, 468, 542
Piskunov, A. E., Kharchenko, N. V., Schilbach, E., et al.
2011, A&A, 525, A122
Planck Collaboration, Ade, P. A. R., Aghanim, N., & et al.
2016a, A&A, 594, A13
Planck Collaboration, Aghanim, N., Ashdown, M., et al.
2016b, A&A, 596, A107
Pojmanski, G. 2002, AcA, 52, 397
—. 2003, AcA, 53, 341
Pojmanski, G., & Maciejewski, G. 2004, AcA, 54, 153
—. 2005, AcA, 55, 97
Riess, A. G., Casertano, S., Anderson, J., MacKenty, J., &
Filippenko, A. V. 2014, ApJ, 785, 161
Riess, A. G., Fliri, J., & Valls-Gabaud, D. 2012, ApJ, 745,
156
Riess, A. G., Filippenko, A. V., Challis, P., et al. 1998, AJ,
116, 1009
Riess, A. G., Macri, L., Casertano, S., et al. 2009, ApJ, 699,
539
—. 2011, ApJ, 730, 119
Riess, A. G., Macri, L. M., Hoffmann, S. L., et al. 2016,
ApJ, 826, 56
Sakai, S., Ferrarese, L., Kennicutt, Jr., R. C., & Saha, A.
2004, ApJ, 608, 42
Sandage, A. 1958, ApJ, 128, 150
Sandage, A., Tammann, G. A., & Reindl, B. 2004, A&A,
424, 43
Senchyna, P., Johnson, L. C., Dalcanton, J. J., et al. 2015,
ApJ, 813, 31
Soszynski, I., Poleski, R., Udalski, A., et al. 2008, AcA, 58,
163
Soszynski, I., Udalski, A., Szymanski, M. K., et al. 2017,
AcA, 67, 103
Stanek, K. Z., & Udalski, A. 1999, ArXiv Astrophysics
e-prints, astro-ph/9909346
Storm, J., Carney, B. W., Gieren, W. P., et al. 2004, A&A,
415, 531
Suyu, S. H., Treu, T., Blandford, R. D., et al. 2012, ArXiv
Astrophysics e-prints, 1202.4459
Szabados, L. 2003, in Astronomical Society of the Pacific
Conference Series, Vol. 298, GAIA Spectroscopy: Science
and Technology, ed. U. Munari, 237
Tamm, A., Tempel, E., Tenjes, P., Tihhonova, O., &
Tuvikene, T. 2012, A&A, 546, A4
Tammann, G. A., & Reindl, B. 2002, Ap&SS, 280, 165
Testa, V., Marconi, M., Musella, I., et al. 2007, A&A, 462,
599
Udalski, A., Kubiak, M., & Szymanski, M. 1997, AcA, 47,
319
Udalski, A., Soszynski, I., Szymanski, M., et al. 1999a,
AcA, 49, 223
—. 1999b, AcA, 49, 437
Vilardell, F., Jordi, C., & Ribas, I. 2007, A&A, 473, 847
Wagner-Kaiser, R., Sarajedini, A., Dalcanton, J. J.,
Williams, B. F., & Dolphin, A. 2015, MNRAS, 451, 724
Weidner, C., Kroupa, P., & Bonnell, I. A. D. 2010,
MNRAS, 401, 275
Weinberg, D. H., Mortonson, M. J., Eisenstein, D. J., et al.
2013, PhR, 530, 87
Welch, D. L., & Stetson, P. B. 1993, AJ, 105, 1813
Wielgorski, P., Pietrzynski, G., Gieren, W., et al. 2017,
ApJ, 842, 116
Williams, B. F., Lang, D., Dalcanton, J. J., et al. 2014,
ApJS, 215, 9
Wolff, S. C. 1978, ApJ, 222, 556
Cepheid Distance Scale Bias due to Blending 23
APPENDIX
A. LIST OF MILKY WAY CEPHEIDS WITHIN D < 2 KPC FROM THE SUN
The following Cepheids, ordered by distance, were used to estimate fCC,MW in §3.1: η Aql, X Sgr, β Dor, ζ Gem,
RT Aur, W Sgr, Y Sgr, T Vul, ` Car, AX Cir, Y Oph, U Aql, V636 Cas, U Sgr, U Vul, R TrA, S Sge, V Cen, S Cru,
AW Per, RV Sco, BF Oph, T Cru, V636 Sco, R Cru, SU Cyg, S TrA, AP Sgr, BB Sgr, R Mus, S Mus, V737 Cen,
RX Cam, X Vul, S Nor, V350 Sgr, W Gem, V482 Sco, AP Pup, SS Sct, TT Aql, V Vel, FM Aql, V Car, BG Vel, T Vel,
V386 Cyg, ST Tau, X Cyg, V381 Cen, ER Car, YZ Sgr, XX Sgr, RY Sco, V912 Aql, V1162 Aql, ASAS J124435-6331.8,
AG Cru, RY CMa, TX Cyg, FN Aql, RT Mus, T Mon, U Nor, RS Cas, MS Mus, V773 Sgr, V500 Sco, AS Per, UX Car,
MW Cyg, VW Cru, SU Cru, RZ Vel, AU Peg, RS Ori, GSC 03996-00312, U Car, V Lac, AT Pup, X Cru, CR Ser,
V495 Cyg, V470 Sco, GU Nor, RX Aur, MY Cen, V600 Aql, V412 Ser, XX Cen, X Sct, BE Mon, ASAS J175957-
0348.7, BR Vul, V514 Cyg, CV Mon, AY Cen, BG Lac, DL Cas, Y Sct, AY Sgr, SX Car, V496 Cen, RR Lac, RZ CMa,
VZ Cyg, Y Aur, UW Car, IQ Nor, V520 Cyg, Z Lac, RW Cam, VY Car, VY Cyg, V340 Nor, ASAS J184443-0401.5,
SV Vul, RU Sct, XY Cas, SY Cas, KX Cyg, ASAS J184741-0654.4, SY Nor, V339 Cen, WZ Sgr, RS Pup, HO Vul,
SW Cas, and SX Vel. No further information is included at this time, since this list will soon be revised by Gaia.
B. POSTAGE STAMP IMAGES OF M31 CEPHEIDS IN HST’S UV PASSBANDS F275W AND F336W
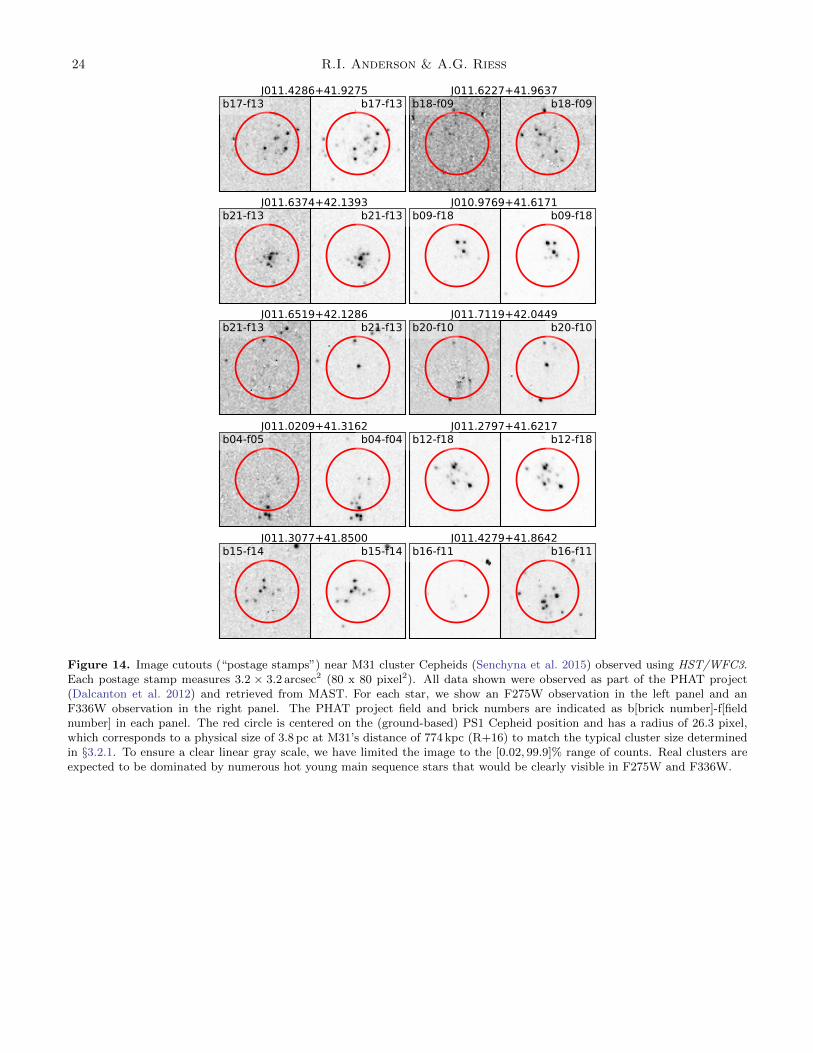
24 R.I. Anderson & A.G. Riess
J011.4286+41.9275b17-f13 b17-f13
J011.6227+41.9637b18-f09 b18-f09
J011.6374+42.1393b21-f13 b21-f13
J010.9769+41.6171b09-f18 b09-f18
J011.6519+42.1286b21-f13 b21-f13
J011.7119+42.0449b20-f10 b20-f10
J011.0209+41.3162b04-f05 b04-f04
J011.2797+41.6217b12-f18 b12-f18
J011.3077+41.8500b15-f14 b15-f14
J011.4279+41.8642b16-f11 b16-f11
Figure 14. Image cutouts (“postage stamps”) near M31 cluster Cepheids (Senchyna et al. 2015) observed using HST/WFC3.Each postage stamp measures 3.2 × 3.2 arcsec2 (80 x 80 pixel2). All data shown were observed as part of the PHAT project(Dalcanton et al. 2012) and retrieved from MAST. For each star, we show an F275W observation in the left panel and anF336W observation in the right panel. The PHAT project field and brick numbers are indicated as b[brick number]-f[fieldnumber] in each panel. The red circle is centered on the (ground-based) PS1 Cepheid position and has a radius of 26.3 pixel,which corresponds to a physical size of 3.8 pc at M31’s distance of 774 kpc (R+16) to match the typical cluster size determinedin §3.2.1. To ensure a clear linear gray scale, we have limited the image to the [0.02, 99.9]% range of counts. Real clusters areexpected to be dominated by numerous hot young main sequence stars that would be clearly visible in F275W and F336W.
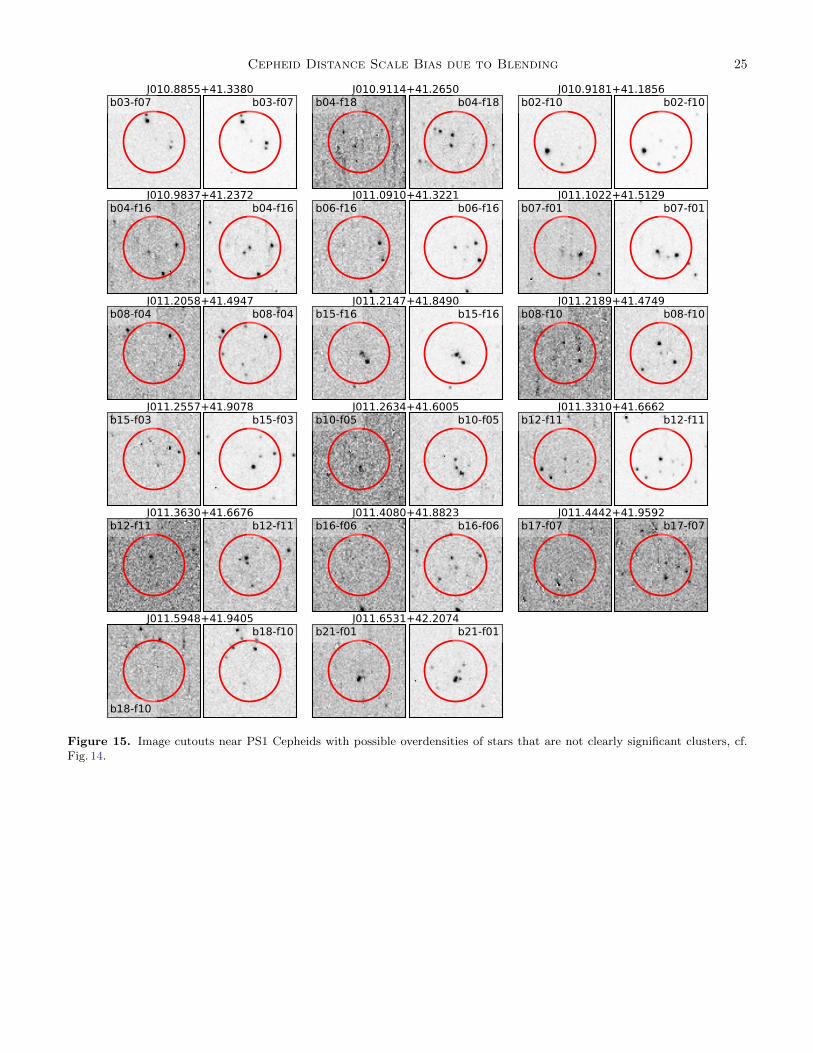
Cepheid Distance Scale Bias due to Blending 25
J010.8855+41.3380b03-f07 b03-f07
J010.9114+41.2650b04-f18 b04-f18
J010.9181+41.1856b02-f10 b02-f10
J010.9837+41.2372b04-f16 b04-f16
J011.0910+41.3221b06-f16 b06-f16
J011.1022+41.5129b07-f01 b07-f01
J011.2058+41.4947b08-f04 b08-f04
J011.2147+41.8490b15-f16 b15-f16
J011.2189+41.4749b08-f10 b08-f10
J011.2557+41.9078b15-f03 b15-f03
J011.2634+41.6005b10-f05 b10-f05
J011.3310+41.6662b12-f11 b12-f11
J011.3630+41.6676b12-f11 b12-f11
J011.4080+41.8823b16-f06 b16-f06
J011.4442+41.9592b17-f07 b17-f07
J011.5948+41.9405
b18-f10
b18-f10J011.6531+42.2074
b21-f01 b21-f01
Figure 15. Image cutouts near PS1 Cepheids with possible overdensities of stars that are not clearly significant clusters, cf.Fig. 14.

26 R.I. Anderson & A.G. Riess
J010.6431+41.3330b01-f06 b01-f06
J010.6948+41.4187b03-f06 b03-f06
J010.7057+41.3467b03-f17 b03-f17
J010.7242+41.3806b03-f11 b03-f11
J010.7425+41.1888b01-f15 b01-f15
J010.7620+41.2275b01-f09 b01-f09
J010.7702+41.4630b05-f12 b05-f12
J010.7723+41.2508b01-f09 b01-f09
J010.7772+41.2419b01-f09 b01-f09
J010.7848+41.4873b05-f12 b05-f12
J010.7962+41.1752b01-f13 b01-f13
J010.8107+41.5040b05-f06 b05-f06
J010.8319+41.3868b03-f03 b03-f03
J010.8369+41.1736b02-f18 b02-f18
J010.8458+41.5196b05-f06 b05-f06
J010.8467+41.1738b02-f18 b02-f18
J010.8483+41.3249b03-f08 b03-f08
J010.8592+41.2005b02-f12 b02-f12
J010.8668+41.2321b01-f07 b01-f07
J010.8692+41.2482b02-f06 b02-f06
J010.8698+41.3683b03-f02 b03-f02
J010.8706+41.1704b02-f17 b02-f17
J010.8732+41.2957b03-f13 b03-f13
J010.8734+41.2368b02-f06 b02-f06

Cepheid Distance Scale Bias due to Blending 27
J010.8759+41.1766b02-f17 b02-f17
J010.8802+41.2854b03-f13 b03-f13
J010.8844+41.3424b03-f08 b03-f08
J010.9048+41.2420b02-f05 b02-f05
J010.9058+41.2380b02-f05 b02-f05
J010.9067+41.1869b02-f11 b02-f11
J010.9121+41.6100b07-f06 b07-f06
J010.9193+41.2125b02-f05 b02-f05
J010.9247+41.2765b04-f18 b04-f18
J010.9254+41.2490b02-f05 b02-f05
J010.9288+41.1715b02-f10 b02-f10
J010.9292+41.2475b04-f18 b04-f18
J010.9309+41.2817b04-f18 b04-f18
J010.9319+41.1969b02-f10 b02-f10
J010.9327+41.2784b04-f18 b04-f18
J010.9334+41.1361b02-f16 b02-f16
J010.9348+41.1725b02-f10 b02-f10
J010.9364+41.2504b04-f18 b04-f18
J010.9390+41.1787b02-f10 b02-f10
J010.9390+41.3814b05-f14 b05-f14
J010.9396+41.2711b04-f17 b04-f17
J010.9414+41.1716b02-f10 b02-f10
J010.9419+41.3027b04-f12 b04-f12
J010.9420+41.4272b05-f08 b05-f08
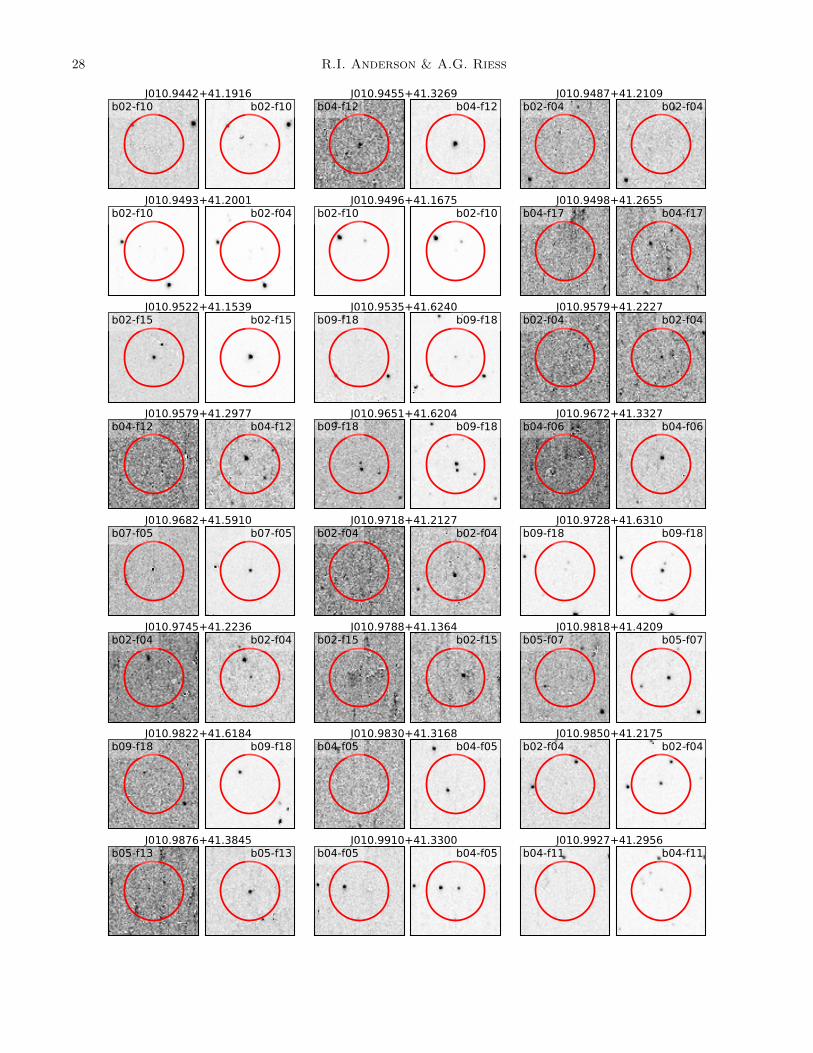
28 R.I. Anderson & A.G. Riess
J010.9442+41.1916b02-f10 b02-f10
J010.9455+41.3269b04-f12 b04-f12
J010.9487+41.2109b02-f04 b02-f04
J010.9493+41.2001b02-f10 b02-f04
J010.9496+41.1675b02-f10 b02-f10
J010.9498+41.2655b04-f17 b04-f17
J010.9522+41.1539b02-f15 b02-f15
J010.9535+41.6240b09-f18 b09-f18
J010.9579+41.2227b02-f04 b02-f04
J010.9579+41.2977b04-f12 b04-f12
J010.9651+41.6204b09-f18 b09-f18
J010.9672+41.3327b04-f06 b04-f06
J010.9682+41.5910b07-f05 b07-f05
J010.9718+41.2127b02-f04 b02-f04
J010.9728+41.6310b09-f18 b09-f18
J010.9745+41.2236b02-f04 b02-f04
J010.9788+41.1364b02-f15 b02-f15
J010.9818+41.4209b05-f07 b05-f07
J010.9822+41.6184b09-f18 b09-f18
J010.9830+41.3168b04-f05 b04-f05
J010.9850+41.2175b02-f04 b02-f04
J010.9876+41.3845b05-f13 b05-f13
J010.9910+41.3300b04-f05 b04-f05
J010.9927+41.2956b04-f11 b04-f11

Cepheid Distance Scale Bias due to Blending 29
J010.9939+41.2609b04-f16 b04-f17
J010.9953+41.2509b04-f16 b04-f16
J010.9962+41.1353b02-f14 b02-f14
J010.9962+41.2386b04-f16 b04-f16
J010.9978+41.6395b09-f11 b09-f11
J010.9984+41.3149b04-f05 b04-f05
J011.0000+41.4530b05-f02 b05-f02
J011.0003+41.2834b04-f10 b04-f11
J011.0014+41.2194b02-f03 b02-f03
J011.0039+41.6290b09-f11 b09-f11
J011.0079+41.5020b07-f15 b07-f15
J011.0081+41.4408b05-f01 b05-f01
J011.0086+41.2209b04-f15 b04-f15
J011.0107+41.2787b04-f10 b04-f10
J011.0162+41.6278b09-f11 b09-f11
J011.0168+41.2314b04-f15 b04-f15
J011.0210+41.2681b04-f10 b04-f10
J011.0229+41.4242b05-f07 b05-f07
J011.0236+41.6368b09-f11 b09-f11
J011.0241+41.3485b06-f18 b06-f18
J011.0255+41.2913b04-f10 b04-f10
J011.0259+41.3032b04-f04 b04-f04
J011.0320+41.6104b09-f16 b09-f16
J011.0322+41.2943b04-f04 b04-f04
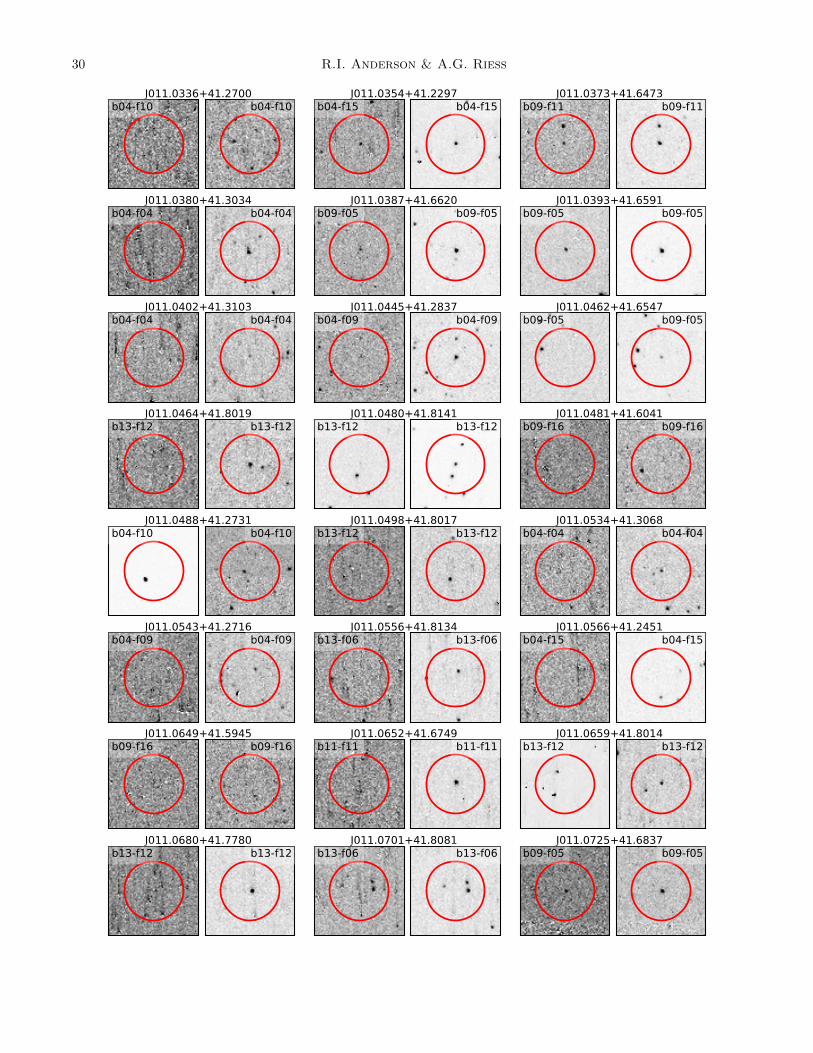
30 R.I. Anderson & A.G. Riess
J011.0336+41.2700b04-f10 b04-f10
J011.0354+41.2297b04-f15 b04-f15
J011.0373+41.6473b09-f11 b09-f11
J011.0380+41.3034b04-f04 b04-f04
J011.0387+41.6620b09-f05 b09-f05
J011.0393+41.6591b09-f05 b09-f05
J011.0402+41.3103b04-f04 b04-f04
J011.0445+41.2837b04-f09 b04-f09
J011.0462+41.6547b09-f05 b09-f05
J011.0464+41.8019b13-f12 b13-f12
J011.0480+41.8141b13-f12 b13-f12
J011.0481+41.6041b09-f16 b09-f16
J011.0488+41.2731b04-f10 b04-f10
J011.0498+41.8017b13-f12 b13-f12
J011.0534+41.3068b04-f04 b04-f04
J011.0543+41.2716b04-f09 b04-f09
J011.0556+41.8134b13-f06 b13-f06
J011.0566+41.2451b04-f15 b04-f15
J011.0649+41.5945b09-f16 b09-f16
J011.0652+41.6749b11-f11 b11-f11
J011.0659+41.8014b13-f12 b13-f12
J011.0680+41.7780b13-f12 b13-f12
J011.0701+41.8081b13-f06 b13-f06
J011.0725+41.6837b09-f05 b09-f05

Cepheid Distance Scale Bias due to Blending 31
J011.0726+41.8171b13-f06 b13-f06
J011.0733+41.2806b04-f09 b04-f09
J011.0735+41.8085b13-f12 b13-f12
J011.0736+41.7200b11-f05 b11-f05
J011.0785+41.3468b06-f16 b06-f16
J011.0830+41.3442b06-f16 b06-f16
J011.0859+41.2694b04-f09 b04-f09
J011.0864+41.3373b06-f16 b06-f16
J011.0879+41.6870b11-f11 b11-f11
J011.0902+41.2784b04-f03 b04-f03
J011.0910+41.4970b07-f07 b07-f07
J011.0911+41.3723b06-f11 b06-f11
J011.0917+41.3549b06-f10 b06-f10
J011.0918+41.6641b11-f11 b11-f11
J011.0962+41.5882b09-f15 b09-f15
J011.0968+41.2969b04-f03 b04-f03
J011.0981+41.6445b11-f16 b11-f16
J011.0984+41.8634b15-f18 b15-f18
J011.0998+41.3533b06-f10 b06-f10
J011.1003+41.6243b11-f16 b11-f16
J011.1024+41.3145b06-f16 b06-f16
J011.1029+41.5792b09-f14 b09-f15
J011.1048+41.5640b09-f14 b09-f14
J011.1053+41.1663b02-f01 b02-f01

32 R.I. Anderson & A.G. Riess
J011.1078+41.5456b07-f01 b07-f01
J011.1082+41.4021b06-f04 b06-f05
J011.1101+41.9289b15-f06 b15-f06
J011.1115+41.8567b15-f18 b15-f18
J011.1118+41.3211b06-f16 b06-f16
J011.1126+41.8450b15-f18 b15-f18
J011.1130+41.4346b08-f18 b08-f18
J011.1144+41.3523b06-f16 b06-f16
J011.1146+41.3341b06-f15 b06-f15
J011.1170+41.3429b06-f16 b06-f16
J011.1226+41.4122b06-f04 b06-f04
J011.1230+41.5086b08-f06 b08-f06
J011.1257+41.9140b15-f06 b15-f06
J011.1272+41.4486b08-f17 b08-f17
J011.1291+41.6133b09-f08 b09-f08
J011.1306+41.3702b06-f10 b06-f10
J011.1312+41.6320b11-f16 b11-f16
J011.1319+41.4135b06-f04 b06-f04
J011.1342+41.3424b06-f09 b06-f09
J011.1349+41.3930b06-f04 b06-f04
J011.1359+41.4061b06-f04 b06-f04
J011.1364+41.4096b06-f04 b06-f04
J011.1433+41.9117b15-f05 b15-f05
J011.1497+41.6211b09-f02 b09-f02
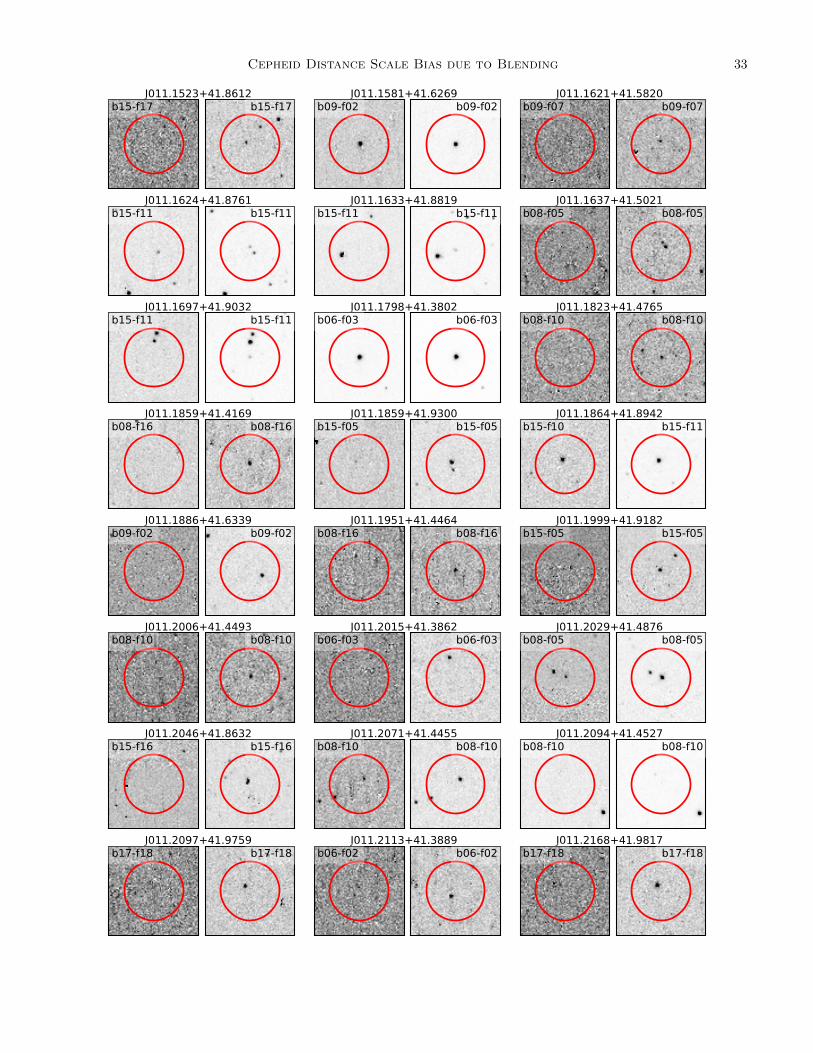
Cepheid Distance Scale Bias due to Blending 33
J011.1523+41.8612b15-f17 b15-f17
J011.1581+41.6269b09-f02 b09-f02
J011.1621+41.5820b09-f07 b09-f07
J011.1624+41.8761b15-f11 b15-f11
J011.1633+41.8819b15-f11 b15-f11
J011.1637+41.5021b08-f05 b08-f05
J011.1697+41.9032b15-f11 b15-f11
J011.1798+41.3802b06-f03 b06-f03
J011.1823+41.4765b08-f10 b08-f10
J011.1859+41.4169b08-f16 b08-f16
J011.1859+41.9300b15-f05 b15-f05
J011.1864+41.8942b15-f10 b15-f11
J011.1886+41.6339b09-f02 b09-f02
J011.1951+41.4464b08-f16 b08-f16
J011.1999+41.9182b15-f05 b15-f05
J011.2006+41.4493b08-f10 b08-f10
J011.2015+41.3862b06-f03 b06-f03
J011.2029+41.4876b08-f05 b08-f05
J011.2046+41.8632b15-f16 b15-f16
J011.2071+41.4455b08-f10 b08-f10
J011.2094+41.4527b08-f10 b08-f10
J011.2097+41.9759b17-f18 b17-f18
J011.2113+41.3889b06-f02 b06-f02
J011.2168+41.9817b17-f18 b17-f18
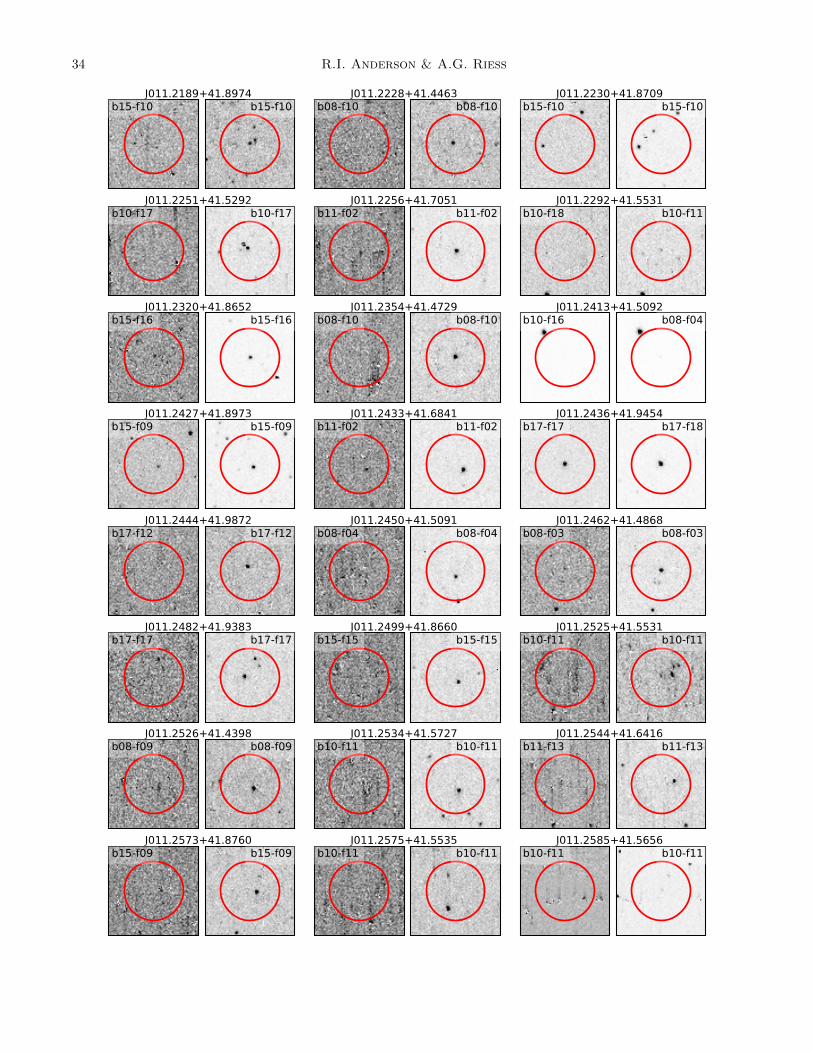
34 R.I. Anderson & A.G. Riess
J011.2189+41.8974b15-f10 b15-f10
J011.2228+41.4463b08-f10 b08-f10
J011.2230+41.8709b15-f10 b15-f10
J011.2251+41.5292b10-f17 b10-f17
J011.2256+41.7051b11-f02 b11-f02
J011.2292+41.5531b10-f18 b10-f11
J011.2320+41.8652b15-f16 b15-f16
J011.2354+41.4729b08-f10 b08-f10
J011.2413+41.5092b10-f16 b08-f04
J011.2427+41.8973b15-f09 b15-f09
J011.2433+41.6841b11-f02 b11-f02
J011.2436+41.9454b17-f17 b17-f18
J011.2444+41.9872b17-f12 b17-f12
J011.2450+41.5091b08-f04 b08-f04
J011.2462+41.4868b08-f03 b08-f03
J011.2482+41.9383b17-f17 b17-f17
J011.2499+41.8660b15-f15 b15-f15
J011.2525+41.5531b10-f11 b10-f11
J011.2526+41.4398b08-f09 b08-f09
J011.2534+41.5727b10-f11 b10-f11
J011.2544+41.6416b11-f13 b11-f13
J011.2573+41.8760b15-f09 b15-f09
J011.2575+41.5535b10-f11 b10-f11
J011.2585+41.5656b10-f11 b10-f11
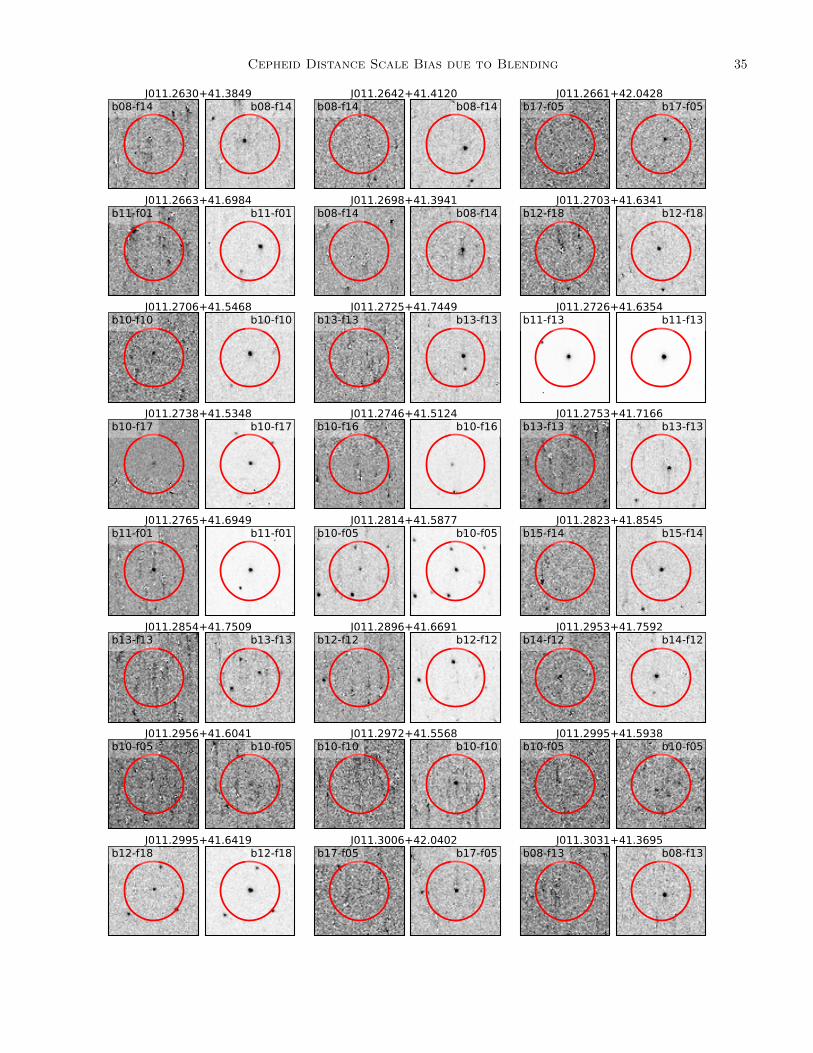
Cepheid Distance Scale Bias due to Blending 35
J011.2630+41.3849b08-f14 b08-f14
J011.2642+41.4120b08-f14 b08-f14
J011.2661+42.0428b17-f05 b17-f05
J011.2663+41.6984b11-f01 b11-f01
J011.2698+41.3941b08-f14 b08-f14
J011.2703+41.6341b12-f18 b12-f18
J011.2706+41.5468b10-f10 b10-f10
J011.2725+41.7449b13-f13 b13-f13
J011.2726+41.6354b11-f13 b11-f13
J011.2738+41.5348b10-f17 b10-f17
J011.2746+41.5124b10-f16 b10-f16
J011.2753+41.7166b13-f13 b13-f13
J011.2765+41.6949b11-f01 b11-f01
J011.2814+41.5877b10-f05 b10-f05
J011.2823+41.8545b15-f14 b15-f14
J011.2854+41.7509b13-f13 b13-f13
J011.2896+41.6691b12-f12 b12-f12
J011.2953+41.7592b14-f12 b14-f12
J011.2956+41.6041b10-f05 b10-f05
J011.2972+41.5568b10-f10 b10-f10
J011.2995+41.5938b10-f05 b10-f05
J011.2995+41.6419b12-f18 b12-f18
J011.3006+42.0402b17-f05 b17-f05
J011.3031+41.3695b08-f13 b08-f13
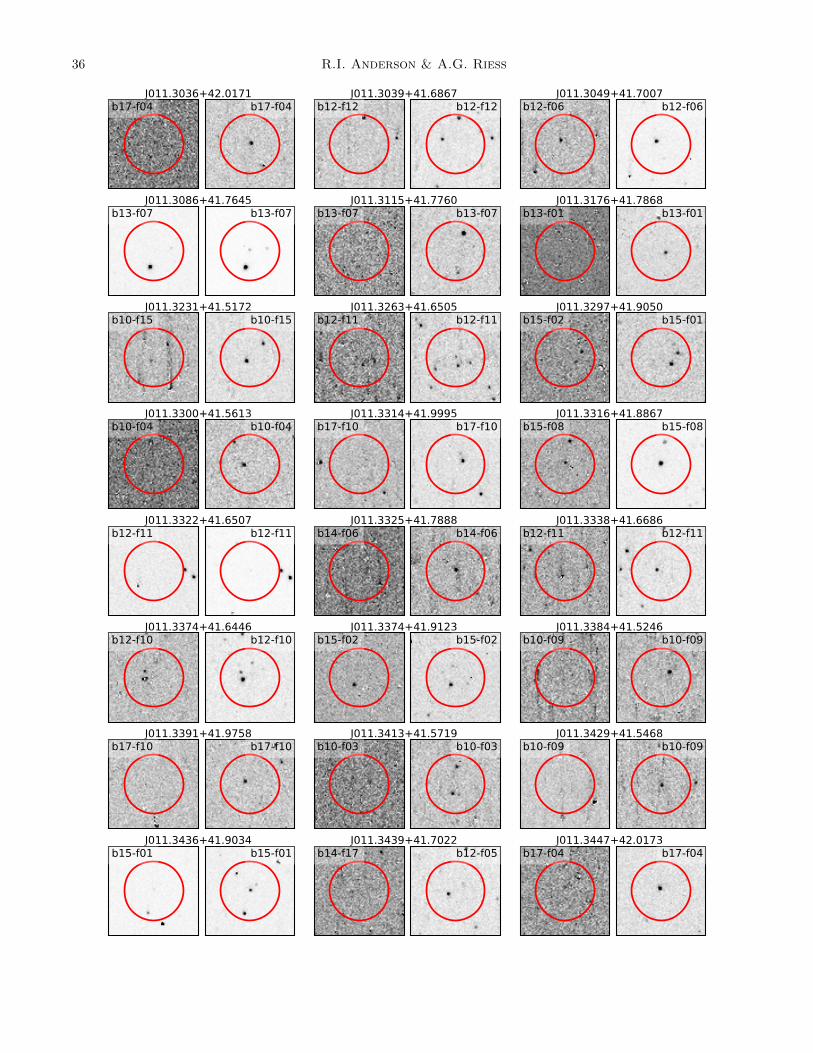
36 R.I. Anderson & A.G. Riess
J011.3036+42.0171b17-f04 b17-f04
J011.3039+41.6867b12-f12 b12-f12
J011.3049+41.7007b12-f06 b12-f06
J011.3086+41.7645b13-f07 b13-f07
J011.3115+41.7760b13-f07 b13-f07
J011.3176+41.7868b13-f01 b13-f01
J011.3231+41.5172b10-f15 b10-f15
J011.3263+41.6505b12-f11 b12-f11
J011.3297+41.9050b15-f02 b15-f01
J011.3300+41.5613b10-f04 b10-f04
J011.3314+41.9995b17-f10 b17-f10
J011.3316+41.8867b15-f08 b15-f08
J011.3322+41.6507b12-f11 b12-f11
J011.3325+41.7888b14-f06 b14-f06
J011.3338+41.6686b12-f11 b12-f11
J011.3374+41.6446b12-f10 b12-f10
J011.3374+41.9123b15-f02 b15-f02
J011.3384+41.5246b10-f09 b10-f09
J011.3391+41.9758b17-f10 b17-f10
J011.3413+41.5719b10-f03 b10-f03
J011.3429+41.5468b10-f09 b10-f09
J011.3436+41.9034b15-f01 b15-f01
J011.3439+41.7022b14-f17 b12-f05
J011.3447+42.0173b17-f04 b17-f04

Cepheid Distance Scale Bias due to Blending 37
J011.3457+41.6438b12-f11 b12-f11
J011.3459+41.8459b15-f13 b15-f13
J011.3462+42.0722b19-f18 b19-f18
J011.3471+41.5967b10-f04 b10-f04
J011.3473+41.9541b17-f15 b17-f15
J011.3480+41.6678b12-f11 b12-f11
J011.3481+42.0301b17-f03 b17-f03
J011.3484+41.6933b12-f05 b12-f05
J011.3492+41.7962b14-f06 b14-f06
J011.3493+41.9103b15-f01 b15-f01
J011.3501+41.7654b14-f12 b14-f11
J011.3510+41.7351b14-f17 b14-f11
J011.3520+41.9973b17-f09 b17-f09
J011.3546+41.7088b14-f17 b14-f17
J011.3575+42.0484b19-f18 b19-f18
J011.3579+41.6354b12-f16 b12-f16
J011.3583+42.0404b19-f18 b19-f18
J011.3585+42.0572b19-f18 b19-f18
J011.3586+41.7276b14-f17 b14-f17
J011.3595+41.9975b17-f09 b17-f09
J011.3622+41.6437b12-f10 b12-f10
J011.3623+41.9200b15-f01 b15-f01
J011.3625+41.9416b17-f15 b17-f15
J011.3628+42.0633b19-f18 b19-f18

38 R.I. Anderson & A.G. Riess
J011.3632+41.8470b15-f13 b15-f13
J011.3634+41.6998b14-f17 b14-f17
J011.3642+42.1504b19-f06 b19-f06
J011.3653+41.9183b16-f06 b16-f06
J011.3660+41.6243b12-f16 b12-f16
J011.3677+41.6652b12-f10 b12-f10
J011.3684+41.6595b12-f10 b12-f10
J011.3698+41.7606b14-f11 b14-f11
J011.3714+42.1451b19-f06 b19-f06
J011.3773+41.6577b12-f10 b12-f10
J011.3908+41.8482b16-f18 b16-f18
J011.3917+41.6582b12-f10 b12-f10
J011.3923+41.9463b17-f14 b17-f14
J011.3928+42.0225b17-f03 b17-f03
J011.3934+41.9373b17-f14 b17-f14
J011.3956+41.7058b14-f16 b14-f16
J011.3980+42.0495b19-f17 b19-f17
J011.3980+42.1391b19-f05 b19-f05
J011.4084+41.6934b12-f04 b12-f04
J011.4095+41.8738b16-f12 b16-f12
J011.4103+41.9036b16-f06 b16-f06
J011.4117+41.7128b14-f16 b14-f16
J011.4152+41.5315b10-f08 b10-f08
J011.4153+41.6952b14-f16 b14-f16

Cepheid Distance Scale Bias due to Blending 39
J011.4154+41.9104b16-f05 b16-f06
J011.4210+41.7472b14-f10 b14-f10
J011.4235+41.7059b14-f16 b14-f16
J011.4316+41.7669b14-f04 b14-f04
J011.4323+41.7896b14-f04 b14-f04
J011.4337+41.7366b14-f09 b14-f09
J011.4340+41.8437b16-f11 b16-f11
J011.4350+41.8715b16-f11 b16-f11
J011.4362+41.7112b14-f15 b14-f15
J011.4376+41.8650b16-f11 b16-f11
J011.4388+41.9062b16-f05 b16-f05
J011.4400+41.7523b14-f09 b14-f09
J011.4406+41.7749b14-f04 b14-f04
J011.4411+41.9285b17-f13 b17-f13
J011.4427+41.9586b17-f07 b17-f07
J011.4433+41.9690b17-f07 b17-f07
J011.4436+41.7529b14-f09 b14-f09
J011.4455+41.9120b16-f05 b16-f05
J011.4461+41.7915b14-f03 b14-f03
J011.4489+41.8916b16-f04 b16-f04
J011.4494+41.8997b16-f05 b16-f05
J011.4521+41.8462b16-f10 b16-f10
J011.4529+41.9614b17-f07 b17-f07
J011.4534+41.8582b16-f10 b16-f10
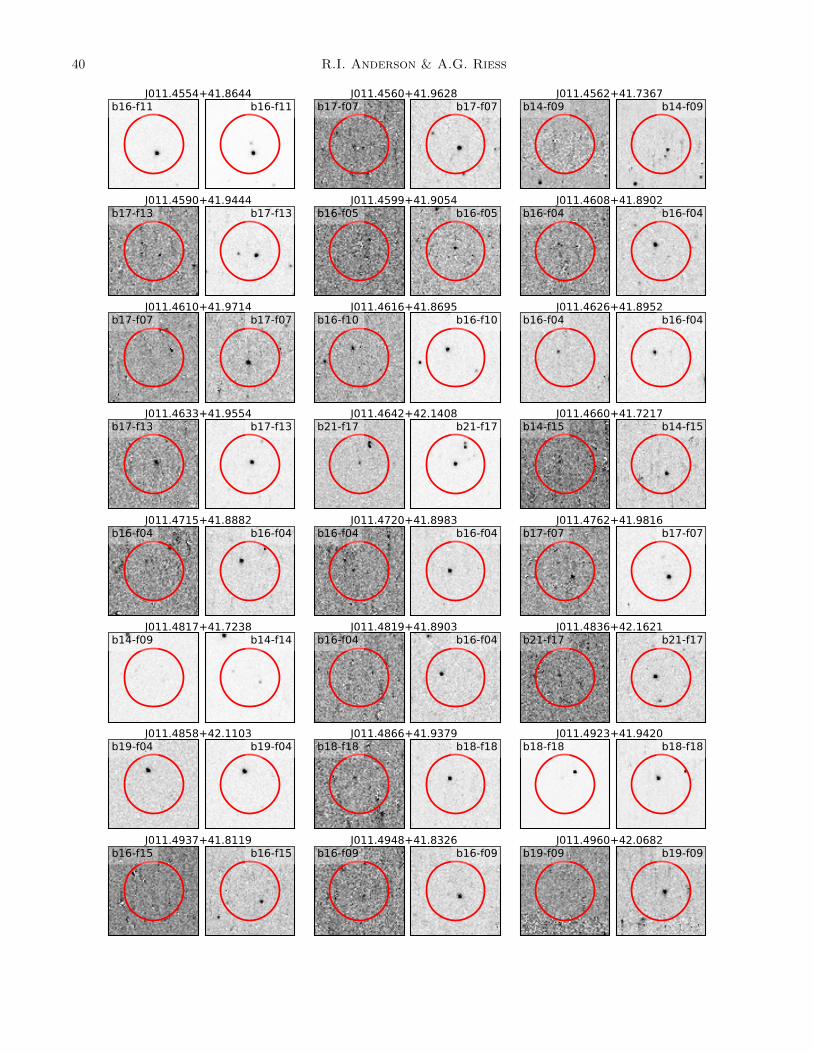
40 R.I. Anderson & A.G. Riess
J011.4554+41.8644b16-f11 b16-f11
J011.4560+41.9628b17-f07 b17-f07
J011.4562+41.7367b14-f09 b14-f09
J011.4590+41.9444b17-f13 b17-f13
J011.4599+41.9054b16-f05 b16-f05
J011.4608+41.8902b16-f04 b16-f04
J011.4610+41.9714b17-f07 b17-f07
J011.4616+41.8695b16-f10 b16-f10
J011.4626+41.8952b16-f04 b16-f04
J011.4633+41.9554b17-f13 b17-f13
J011.4642+42.1408b21-f17 b21-f17
J011.4660+41.7217b14-f15 b14-f15
J011.4715+41.8882b16-f04 b16-f04
J011.4720+41.8983b16-f04 b16-f04
J011.4762+41.9816b17-f07 b17-f07
J011.4817+41.7238b14-f09 b14-f14
J011.4819+41.8903b16-f04 b16-f04
J011.4836+42.1621b21-f17 b21-f17
J011.4858+42.1103b19-f04 b19-f04
J011.4866+41.9379b18-f18 b18-f18
J011.4923+41.9420b18-f18 b18-f18
J011.4937+41.8119b16-f15 b16-f15
J011.4948+41.8326b16-f09 b16-f09
J011.4960+42.0682b19-f09 b19-f09
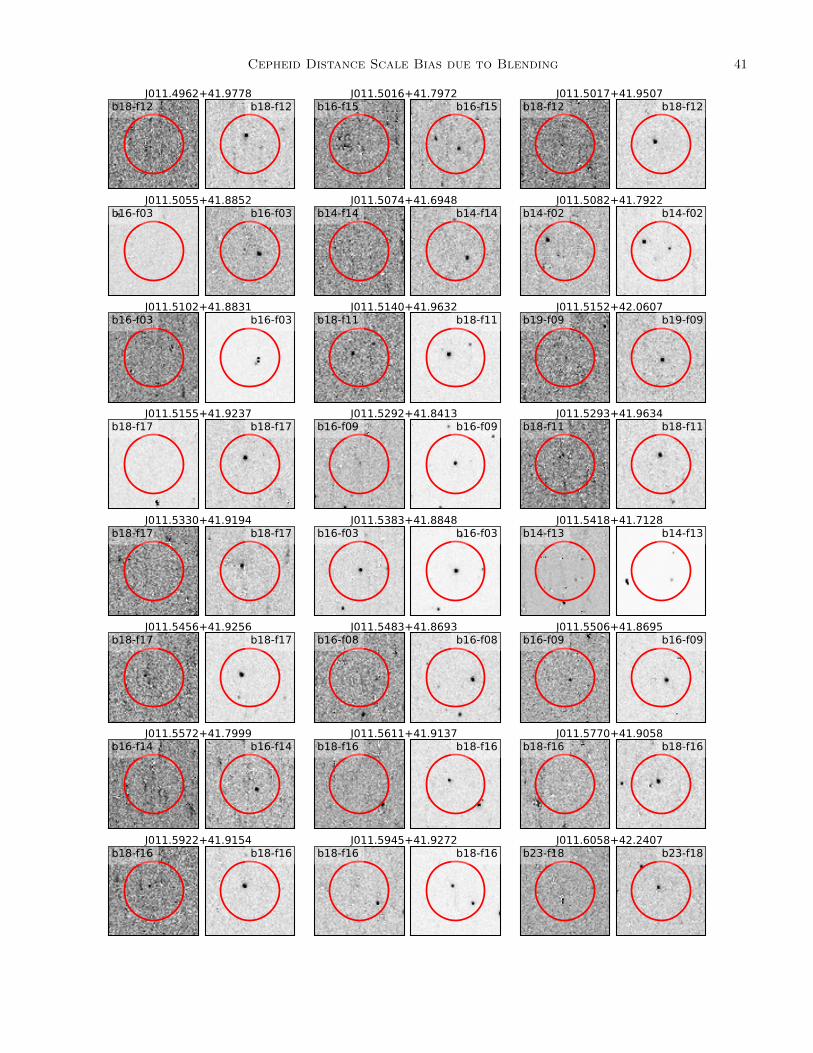
Cepheid Distance Scale Bias due to Blending 41
J011.4962+41.9778b18-f12 b18-f12
J011.5016+41.7972b16-f15 b16-f15
J011.5017+41.9507b18-f12 b18-f12
J011.5055+41.8852b16-f03 b16-f03
J011.5074+41.6948b14-f14 b14-f14
J011.5082+41.7922b14-f02 b14-f02
J011.5102+41.8831b16-f03 b16-f03
J011.5140+41.9632b18-f11 b18-f11
J011.5152+42.0607b19-f09 b19-f09
J011.5155+41.9237b18-f17 b18-f17
J011.5292+41.8413b16-f09 b16-f09
J011.5293+41.9634b18-f11 b18-f11
J011.5330+41.9194b18-f17 b18-f17
J011.5383+41.8848b16-f03 b16-f03
J011.5418+41.7128b14-f13 b14-f13
J011.5456+41.9256b18-f17 b18-f17
J011.5483+41.8693b16-f08 b16-f08
J011.5506+41.8695b16-f09 b16-f09
J011.5572+41.7999b16-f14 b16-f14
J011.5611+41.9137b18-f16 b18-f16
J011.5770+41.9058b18-f16 b18-f16
J011.5922+41.9154b18-f16 b18-f16
J011.5945+41.9272b18-f16 b18-f16
J011.6058+42.2407b23-f18 b23-f18

42 R.I. Anderson & A.G. Riess
J011.6122+42.1569b21-f08 b21-f08
J011.6138+42.2213b21-f02 b21-f02
J011.6149+42.1456b21-f14 b21-f14
J011.6150+42.0747b20-f12 b20-f12
J011.6176+42.2071b21-f02 b21-f02
J011.6178+42.2279b21-f02 b21-f02
J011.6181+41.9388b18-f09 b18-f09
J011.6199+42.1669b21-f08 b21-f08
J011.6241+41.9468b18-f09 b18-f09
J011.6331+42.2447b23-f17 b23-f17
J011.6349+42.0696b20-f12 b20-f12
J011.6510+42.0185b20-f17 b20-f17
J011.6525+42.0227b20-f17 b20-f17
J011.6565+42.1037b20-f06 b20-f06
J011.6571+42.1349b22-f18 b22-f18
J011.6584+42.0119b20-f17 b20-f17
J011.6624+42.1160b20-f06 b20-f06
J011.6633+42.0861b20-f05 b20-f05
J011.6646+42.1609b22-f12 b22-f12
J011.6675+41.9811b18-f03 b18-f03
J011.6731+42.1474b22-f18 b22-f18
J011.6733+42.0685b20-f11 b20-f11
J011.6737+42.0254b20-f17 b20-f17
J011.6774+42.0268b20-f17 b20-f17

Cepheid Distance Scale Bias due to Blending 43
J011.6833+42.0892b20-f05 b20-f05
J011.6864+41.9687b18-f02 b18-f02
J011.6908+41.9603b18-f02 b18-f02
J011.6910+42.0216b20-f16 b20-f16
J011.6937+42.0626b20-f11 b20-f11
J011.6939+42.1418b22-f18 b22-f18
J011.6961+42.0152b20-f16 b20-f16
J011.6967+42.0806b20-f04 b20-f04
J011.6991+42.0795b20-f04 b20-f04
J011.7003+42.0527b20-f10 b20-f10
J011.7028+41.9625b18-f02 b18-f02
J011.7075+41.9774b18-f02 b18-f02
J011.7083+42.0042b20-f16 b20-f16
J011.7099+42.0069b20-f16 b20-f16
J011.7151+42.0828b20-f04 b20-f04
J011.7169+41.9998b18-f02 b18-f02
J011.7176+42.0225b20-f16 b20-f16
J011.7187+41.9992b20-f16 b20-f16
J011.7233+42.0802b20-f04 b20-f04
J011.7245+42.0666b20-f04 b20-f04
J011.7322+42.0766b20-f04 b20-f04
J011.7334+42.1465b22-f17 b22-f17
J011.7400+41.9792b18-f01 b18-f01
J011.7406+41.9805b18-f01 b18-f01

44 R.I. Anderson & A.G. Riess
J011.7413+42.1382b22-f17 b22-f17
J011.7449+42.1667b22-f11 b22-f11
J011.7518+42.0586b20-f09 b20-f09
J011.7542+42.0165b20-f15 b20-f15
J011.7610+42.1041b20-f03 b20-f03
J011.7638+42.0324b20-f09 b20-f09
J011.7908+42.1104b22-f15 b22-f15
J011.7972+42.1150b22-f16 b22-f16
J011.7978+42.1623b22-f10 b22-f10
J011.8432+42.0684b20-f01 b20-f01
J011.8516+42.0886b20-f01 b20-f01
Figure 16. UV postage stamps of all remaining fundamental mode (FU) or unclassified (UN) PS1 Cepheids located within thePHAT footprint (Kodric et al. 2013), see Fig. 14 for details.