on clustering human gait patternsrossarun/pubs/decannrossclusteringgait_icpr2014.pdfthe second...
TRANSCRIPT

On Clustering Human Gait Patterns
Brian DeCannWest Virginia Univeristy
Email: [email protected]
Arun RossMichigan State University
Email: [email protected]
Mark CulpWest Virginia University
Email: [email protected]
Abstract—Research in automated human gait recognition haslargely focused on developing robust feature representation andmatching algorithms. In this paper, we investigate the possibilityof clustering gait patterns based on the features extracted byautomated gait matchers. In this regard, a k-means basedclustering approach is used to categorize the feature sets extractedby three different gait matchers. Experiments are conducted inorder to determine if (a) the clusters of identities correspondingto the three matchers are similar, and (b) if there is a correlationbetween gait patterns within each cluster and physical attributessuch as gender, body area, height, stride, and cadence. Resultsdemonstrate that human gait patterns can be clustered, whereeach cluster is defined by identities sharing similar physicalattributes. In particular, body area and gender are found to be theprimary attributes captured by gait matchers to assess similaritybetween gait patterns. However, the strength of the correlationbetween clusters and physical attributes is different across thethree matchers, suggesting that gait matchers “weight” attributesdifferently. The results of this study should be of interest to gaitrecognition and identification-at-a-distance researchers.
I. I NTRODUCTION
Human gait refers to a person’s manner of locomotion.Human gait recognition, or simply “gait recognition”, refers tothe ability to recognize an individual based on their gait. Thenotion that human gait is (reasonably) unique to the individualis not new. Psychological studies by Cutting and Kozlowskidemonstrated that humans are able to perceive gender andrecognize known individuals based on gait [1], [2].
In the recent past, automated human gait recognition hasreceived considerable interest from the biometrics and com-puter vision communities. Automated human gait recognitioncan be useful in surveillance operations since gait can beextracted covertly, at a distance, and in low-resolution data[3]. Many different approaches for automated human gaitrecognition have been developed. Generally, these approachescan be classified into one of two types: model-based [3], [4]and model free [3], [5], [6], [7], [8], [9], [10], [11], [12].
In this work, we attempt to cluster gait patterns computedusing vison-based algorithms into multiple clusters. Further,we investigate if gait patterns within a cluster are correlatedwith some physical attributes such as body size, walking speed(i.e., cadence), and gender.1 We perform this analysis using thefeature set extracted by multiple gait matchers.
Previous research has suggested that gender can be de-duced from human gait. Early psychological studies by Ko-zlowski and Cutting demonstrated that humans are able to
1Though gender is a predominately genetic property, it impacts the physicalattributes of an individual.
perceive gender from gait [2]. In addition, studies using forceplates have also concluded that men and women have differinggait patterns [13]. In the context of automated gait recognition,Lee and Grimson published the first study attempting to clas-sify gender from video gait data [14]. Their study attemptedto model the side-view of the human body by fitting ellipses.A classification rate of 84% was achieved on a dataset of 24identities. Later, Huang and Wang performed a similar studyby fitting ellipses on front-view and side-view gait data inthe CASIA B dataset [15]. Using a fusion approach, a 89.5%classification accuracy was achieved with a bootstrapped testset of 50 identities (25 male, 25 female). In another study byLi et. al. [16], the Gait Energy Image [10] was divided intosix components denoting different regions of the human body(side-view). Using a SVM classifier, a gender classificationrate of 98% was reported on a test set of 122 identities (USFHuman ID dataset [17]). Li et. al. [16] further remark that thetorso and movement of the leading leg contribute the mostdiscriminative signature for gender recognition.
In this paper, we adopt an unsupervised approach to catego-rize gait patterns into multiple groups. In order to accomplishthis, we subject the feature set extracted by a gait matcherto a clustering scheme. Assuming it is possible to clustergait patterns into different groups we then determine (a) ifindividual clusters are correlated with any of the physicalattributes associated with the person; and (b) whether suchcorrelations are common across multiple gait matchers.
There are several benefits to studying the clustering ten-dency of gait feature sets. Firstly, in the context of a gait-basedsurveillance system, the search for an identity can be confinedto specific clusters based on the input gait data, therebyreducing search time. Secondly, in the context of an open-set identification-at-a-distance system, clustering gait patternsmay be useful in the generation of a physical “profile” of anobserved identity that does not have a match in the database.Thirdly, if a pair of gait matchers are found to cluster identitiesdifferently, then it is likely that these matchers interpret thegait pattern differently. As a result, score-level fusion of suchmatchers is likely to improve overall recognition accuracy.
To the best of our knowledge, the only known study withthe intent of clustering gait patterns was conducted by Watelainet al. [18]. In their study, force-plate and 3-D muscle powerdata (and not video data) was used to determine if age group(young or elderly) could be discerned from gait data. Usinghierarchical clustering and analysis of variance (ANOVA)hypothesis testing, the muscle power data was found to besignificantly different among age groups. Our study focuseson two things: (a) determining the possibility of clustering gait
Appeared in Proc. of 22nd International Conference on Pattern Recognition (ICPR), (Stockholm, Sweden), August 2014
patterns based on video data typically used by automated gaitmatchers; and (b) the correlation between gait patterns within acluster and physical attributes of an individual such as gender,body area, height, stride, and cadence. The gait matchers usedin our study are reviewed in Section II. K-means clusteringis utilized to perform clustering and the experimental resultsare presented in Section III. An analysis of the results andconclusions are presented in Section III-E and Section IV,respectively.
II. BASELINE GAIT MATCHERS
In this study, three different gait matching algorithms areused. These include the Gait Energy Image (GEI) by Han andBhanu [10], the Gait Curves matching scheme by DeCannand Ross [7], and the Frieze Pattern matching scheme firstdeveloped by Liu et. al. [8]. These algorithms are chosen aseach matcher is sufficiently distinct from one another (i.e., notmerely a variant) and relatively simple to implement, whileyielding acceptable matching performance.
A. Gait Energy Image
The Gait Energy Image (GEI) is a model-free matchingalgorithm proposed by Han and Bhanu [10] and has inspiredmany variants [11], [12]. GEI is a popular benchmark al-gorithm, owing to its ease of computation. The algorithmattempts to reduce the motion dynamics of an individual intoa single image. The algorithm computesG(x, y), which isdefined as the average ofT space-normalized human silhouetteimages,St(x, y), t = 1, 2, . . . , T . Mathematically, this isdescribed in Equation (1).
G(x, y) =1
T
T∑
t=1
St(x, y) (1)
The features of the GEI image,G(x, y), correspond tothe pixel intensities observed as a human silhouette movesin time. Values between the range (0,1) correspond to areasof motion. In order to accurately compute a GEI image, eachSt(x, y) must be normalized to the same number of pixelsand appropriately aligned. This is particularly necessary whenan individual is observed walking towards or away from thecamera. GEI images can have a very large dimensionality,which can cause difficulty in matching. In the original workby Han and Bhanu [10] and in many subsequent uses inthe literature, this is rectified by a combination of subspaceoptimization methods, such as Principal Component Analysis(PCA) and Linear Discriminant Analysis (LDA).
B. Gait Curve Matching
The second matching algorithm chosen for cluster analysisis the “gait curves” matcher by DeCann and Ross [7]. Inspiredby previous work by Wang et al. [6], the gait curves matcher isalso a conceptually simple gait algorithm of the model-free va-riety. The gait curves matcher adopts a shape-based approachto performing the recognition task. A brief description of thematching algorithm is provided below.
The “gait curve” of a subject is loosely defined as theevolution of the outer contour of a set ofT silhouette images,St(x, y), t = 1, 2, . . . , T , where the outer contour is definedas the maximum and minimum horizontal pixel coordinates,for which St(x, y) = 1, for each unit of y. Subtractionof the mean horizontal position (x-component) from thesepoint sets results in a space normalized contour, denoted asthe gait curve,Gt, for the tth frame in a video sequence.Thus, the evolution of the gait curve across several framescan be regarded as a spatiotemporal feature for matching.The procrustes meanshape [19] is then used to transformthe T gait curves into a single shape representation. Theprocrustes meanshape is a mathematically elegant measure ofrepresenting and evaluating shape sets. An advantage of thismeasure is that differences in translation, rotation, or scaledo not negatively impact matching between a pair of shapestransformed by procrustes analysis. In applications of gaitrecognition, this is particularly advantageous as it is likelysubjects are observed at varying distances from the camera.
To obtain the procrustes meanshape, letzt denote a vectorrepresentation of the x- and y- coordinates of each pixelin T gait curves. This is accomplished by converting thespatial coordinates to real-imaginary coordinates. Each vectoris then normalized tod elements. Next, denotez as theaverage of these vectors. Then, subtraction ofz from eachzt results in zero-mean vectors. These vectors are denotedby ut. Finally, the scatter matrix of the zero-mean vectorsis computed (Equation (2)).
Su =
T∑
k=1
ukuTk
uTkuk
(2)
The first eigenvector of the scatter matrix,Su, is usedto denote the procrustes meanshape representation,G, of Tgait curves extracted from a video sequence. In order toevaluate the similarity between a pair of procrustes shaperepresentations, the procrustes distance is used [6], [7], [19].
C. Frieze Pattern Matching
The third matching algorithm chosen for cluster analysisis referred to as “frieze pattern matching”. Mathematically,a frieze pattern is defined as a two-dimensional pattern thatrepeats itself infinitely. Liu et. al. [8] were the first to exploitthe periodic nature of human gait as a frieze pattern. A friezepattern denoting human gait is defined as the concatenation ofthe x- and y- projections of a silhouette moving in time. Aswith the GEI and gait curve matchers, this method for denotinghuman gait is also classified as a model-free recognitionalgorithm. A mathematical description of such a pattern isdescribed below.
Consider a set ofT silhouette images, denoted asSt(x, y),t = 1, 2, . . . , T . Define a 2-d frieze image,Fh(y, t) as thehorizontal projection (row sum) of each ofT silhouette images.Mathematically, this is described in Equation (3).
Fh(y, t) =∑
x
St(x, y) (3)
Appeared in Proc. of 22nd International Conference on Pattern Recognition (ICPR), (Stockholm, Sweden), August 2014

Fh(y, t), denotes the width of thetth silhouette at a“height” of y. Similarly,Fv(x, t) can be defined as the verticalprojection (column sum) of the silhouette, capturing the heightof the tth image at a given “width”x. In a set ofT silhouetteimages encompassing at least one gait cycle, the silhouettewidth varies periodically due to factors such as stride and armsway. By observingFh(y, t) as an image, the row projectionscombine to form a spatiotemporal pattern. In the original workby Liu et al., matching of frieze patterns was accomplishedby comparing the central moments of a probe and gallerysequence [8]. Alternatively, 2-D Dynamic Time Warping canbe used to perform matching, as described by Kale et al. [9].
III. C LUSTER ANALYSIS
A. Dataset
In this study, cluster analysis is performed on the CASIAB Database [20]. The CASIA B dataset is a multi-cameradataset containingN = 124 individuals (N : total numberof identities in the dataset), with each individual walking inNG = 10 video sequences from 11 different viewpoints (NG:samples per identity). The sequences include walking normally(6 sequences), with a coat (2 sequences), and with a backpack(2 sequences). The CASIA B dataset is chosen for clusteranalysis as it (a) has a large number of identities, and (b)yields high quality silhouettes. The latter point is particularlyimportant as the cluster analysis could be confounded by noisysilhouettes. Here, we consider only those sequences where asubject is walking at a normal pace perpendicular to the opticalaxis of the camera (i.e.,NG = 6).
In addition to extracting the gait pattern from each videosequence, ancillary features regarding each identity are alsoextracted. The ancillary features consist of: Gender, Stride,Cadence (viz., walking speed), Height, and Body Area.2
Gender is determined by visual observation. Stride (in pixels)is computed from stride vectorst (t = 1, 2, . . . , T ), wherest = maxxSt(x, y)−minxSt(x, y). The estimated stridecorresponds to the average ofsτ , where τ corresponds tothe values oft that denote a local maxima inst (i.e., feetapart). Local maxima are identified by counting thenega-tive zero-crossings in the difference vector,st. Cadence ismeasured by|τ |, the total number ofnegative slopezero-crossings in the stride difference vector,st. Height (in pixels)is computed from height vectorht (t = 1, 2, . . . , T ), whereht = maxySt(x, y) − minySt(x, y). The estimatedheight corresponds to the average ofhπ, whereπ correspondsto the values oft that denote a local maxima inht (i.e., feettogether). Local maxima are identified by counting thepositiveslopezero-crossings inst. Area (in pixels) is measured by areavector at, whereat =
∑x
∑y St(x, y). The estimated area
corresponds to the average ofaτ .
B. Protocol For Generating Clusters
Feature vectors for the GEI, gait curve, and frieze patternalgorithms were constructed using all video frames where anindividual was viewed fully in the image plane. GEI imageswere extracted using a 90-pixel horizontal window, with the
2Ground truth for this information is not provided by CASIA.
silhouette height normalized to 100 pixels. The resulting GEIimage was then downsampled by a factor of two. Subspaceoptimization was performed using PCA, wherein a principalcomponent was retained if the associated eigenvalue wasgreater than 0.001. The Euclidean distance metric was usedto compare GEI features. For the gait curves algorithm, eachgait curve was normalized to containd = 300 elements and theprocrustes distance metric was used to compare gait curves. Aswith GEI, frieze patterns were also extracted from a 90-pixelhorizontal window and normalized to a height of 100 pixels.Frieze patterns were compared using Dynamic Time Warping,as described by Kale et. al. [9]. Since the GEI algorithmutilizes PCA, 15% (19 of 124) of identities are used fortraining. Clustering is performed on the remainingNC = 105identities for all algorithms (NC : number of identities avail-able for clustering). The baseline EER’s (Equal Error Rate)obtained from the samples utilized for clustering are 6.23%,6.22%, and 16% for the GEI, Gait Curve, and Frieze Patternalgorithms,respectively. The corresponding rank-1 accuraciesare 0.951, 0.975, and 0.924, respectively.
Clusters are generated using thek-meansclustering algo-rithm. The k-means algorithm is selected for computationalease, as this is an exploratory study. Cluster centroids areestimated on a training set based on randomly sampling oneof NG samples from each of theNC identities. This set isdenoted asCtrain. The remaining samples are assigned tothe test setCtest. Each sample inCtest is assigned to thecluster whose centroid is closest to the sample. In this study,clustering is performed usingc = 5 and c = 10 clusters,which are arbitrarily selected. Though arbitrarily selected, thenumber of clusters must be in a range that will not diminish thephysical attributes that we seek to find in individual clusters.The distance metrics are Euclidean (GEI), Procrustes (GaitCurves) and Dynamic Time Warping (Frieze Patterns). Theconvergence criteria for k-means clustering is met when thechange in summed distance between each cluster centroid andits members is less than1−6 between iterations. Clustering isrepeated 2,000 times (with different initial centroids) and thecentroids with the smallest summed cluster-member distanceare kept for further evaluation. This is necessary to increasethe likelihood of converging to the globally optimal solution.Image data of identities nearest to each cluster centroid fol-lowing the output of our k-means implementation (withc = 5)is visualized in Figure 1. Note the physical variations betweenidentities.
Prior to performing the cluster analysis, a basic analysisis performed regarding the composition of generated clusters.Here, we report (a) the average proportion of samples inCtest
that are assigned to the same cluster as their correspondingidentity in Ctrain and (b) the average number of clustersacross which the samples of an identity is assigned. Ideallyboth of these values would be 1.0. The average proportion ofcorrectly assigned test samples is 0.798, 0.745, and 0.598 forthe GEI, Gait Curve, and Frieze pattern matching algorithms,respectively. The average number of clusters an identity isrepresented by is 1.40, 1.52, and 1.83, respectively for theaforementioned matchers. A histogram of the number ofsamples per cluster is also presented in Figure 2.
Appeared in Proc. of 22nd International Conference on Pattern Recognition (ICPR), (Stockholm, Sweden), August 2014

24 44 46 48 80
03 12 22 45 93
08 41 46 79 94
GEI
Gait Curves
Frieze Patterns
Fig. 1. Images of the identities nearest to a cluster centroid for c = 5
clusters. Each row denotes a different gait matcher and each column is acluster. Numbers denote identity labels from the test data. Note that withexception to #46, the nearest-centroid identities are different across matchers.
1 2 3 4 50
0.2
0.4
Cluster Number
Pro
port
ion
Proportion of Samples per Cluster: 5 clusters
GEIGait CurvesFrieze Patterns
1 2 3 4 5 6 7 8 9 100
0.1
0.2
0.3
Cluster Number
Pro
port
ion
Proportion of Samples per Cluster: 10 clusters
GEIGait CurvesFrieze Patterns
Fig. 2. Distribution of samples per cluster for the gait matchers used.
C. Evaluating Identity Pairs in Clusters
In this experiment, an analysis is performed identifyingwhether pairs of identities are clustered similarly amongdifferent gait representation schemes. This is accomplishedby tabulating which of theCtrain samples (corresponding toone identity per sample) appear in the same cluster followingcluster generation. Here, the test samples (Ctest) are notconsidered. DefineΩ as a binary matrix (e.g., table) of identitypairs, of sizeNCxNC . Let α(i, j) (i, j = 1, 2, . . . , NC ) be therow and column entries ofΩ. Eachα(i, j) is assigned a valueof “true” if the ith and jth identity are assigned to the samecluster. Otherwiseα(i, j) is “false”. The proportion of identitycorrespondences between two matricies,Ω1 andΩ2 (e.g., GEIand gait curves), is described in Equation (4).
ω =| Ω1 AND Ω2 |
| Ω1 OR Ω2 |(4)
Here,| Ω | counts the number of “true” entries inΩ. Highvalues ofω denote denote increased cluster similarity betweenmatchers. Using Equation (4),ω is computed for the followingcombinations: Gait Curves + GEI + Frieze Patterns; GaitCurves + GEI; Gait Curves + Frieze Patterns; GEI + FriezePatterns. These values are computed for 1,000 different trialsof cluster generation. The mean of these values are tabulated
TABLE I. PROPORTION OF SIMILARLY PAIRED IDENTITIES WHEN
CLUSTERINGGEI, GAIT CURVE, AND FRIEZE PATTERN DATA WITH c = 5
AND c = 10 CLUSTERS.
Combination ω (c = 5) ω (c = 10)Gait Curves, GEI, Frieze Pattern 0.068 0.045Gait Curves, GEI 0.333 0.183Gait Curves, Frieze Pattern 0.155 0.172GEI, Frieze Pattern 0.161 0.106
in Table I for c = 5 and c = 10 clusters, respectively. Notethat in general, the values ofω produced between matchers arelow, suggesting each matcher assesses similarity differently.
D. Interpreting Attributes of Clusters
In this experiment, an analysis is performed in order todetermine if any of the physical attributes (e.g., Gender, Stride,Cadence, Height, Area) is distinct across clusters. The intentof this experiment is to discover whether identities in the samecluster share certain physical attributes. This experiment alsodoubles as an indirect evaluation of the clustering tendency ofthe gait data.
Significance of a physical variable is measured using twostatistical tests. First, achi-square test of independenceisperformed using the cluster labels and each physical variable.The chi-square test of independence evaluates whether aphysical variable is independently distributed among clusterlabels. If the physical variable is independently distributed (i.e.,the null hypothesis is accepted), it does not have any impacton the clustered data. Second (assuming the null hypothesisis rejected), theSpearman Rank Correlation Coefficient(rs)is computed for each physical variable and cluster label. Thestrength of correlation is measured by how closers is to 1.0.In computingrs, the labels for each cluster are assigned inincreasing order of the cluster-mean corresponding to eachphysical variable. This ensures thatrs is in [0,1] and is notadversely impacted by arbitrary cluster label assignment.
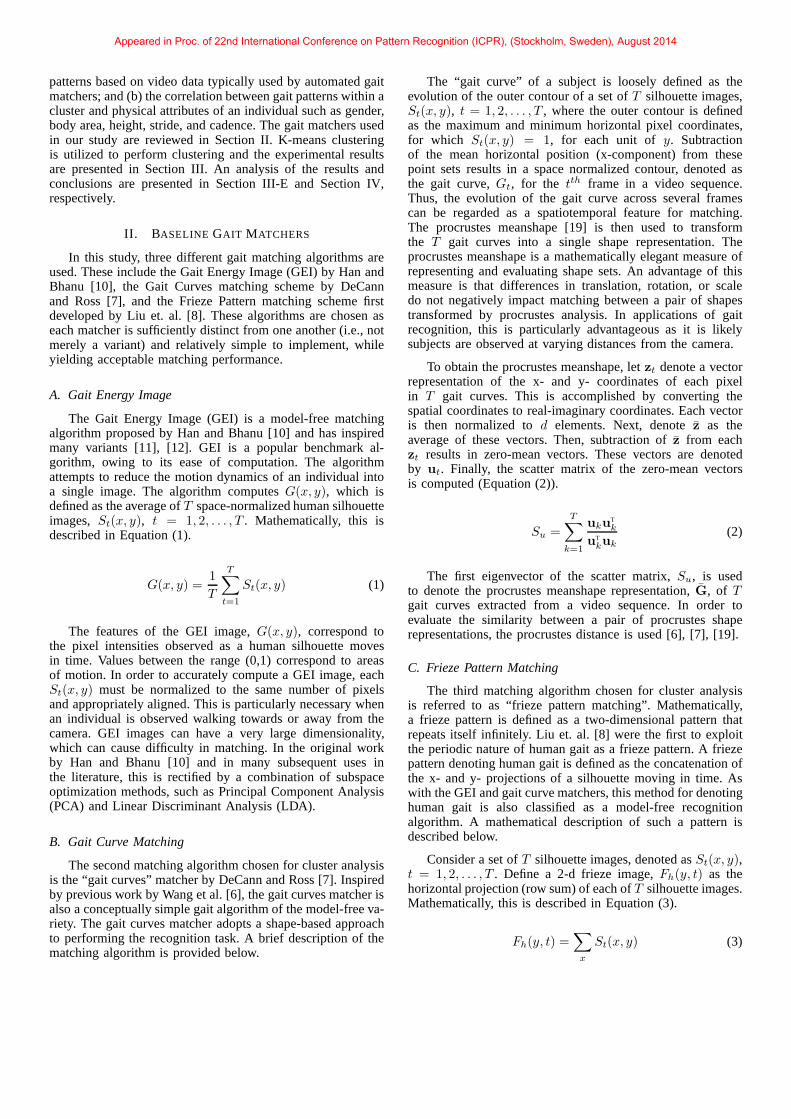
These experiments are performed 1,000 times, withc = 5,andc = 10 clusters, for the GEI, gait curves, and frieze patternmatchers. This experiment also utilizes theCtest samples.Table II tabulates the assertion of dependence between eachvariable and a matcher. Dependence is asserted if exactlyzerohypothesis tests result in acceptance of the null hypothesis.Figure 3 depicts the average Spearmanrs obtained betweeneach physical variable and a matcher. Note, thep-valuesproduced from both the chi-square test of independence andspearman rank correlation coefficient were sufficiently lowthereby asserting that the test outcomes were not due torandom chance.
E. Discussion
Looking first at the output of the clustering process, Figure2 illustrates the distribution of samples per cluster. Note thatin general, the k-means clustering algorithm did not equallydistribute identities across clusters. However, no single clustercontained an absolute majority of the sample data. The largestclusters contained≈40% of the sample data. In addition, theidentities nearest to the cluster centroid (Figure 1) appear to
Appeared in Proc. of 22nd International Conference on Pattern Recognition (ICPR), (Stockholm, Sweden), August 2014
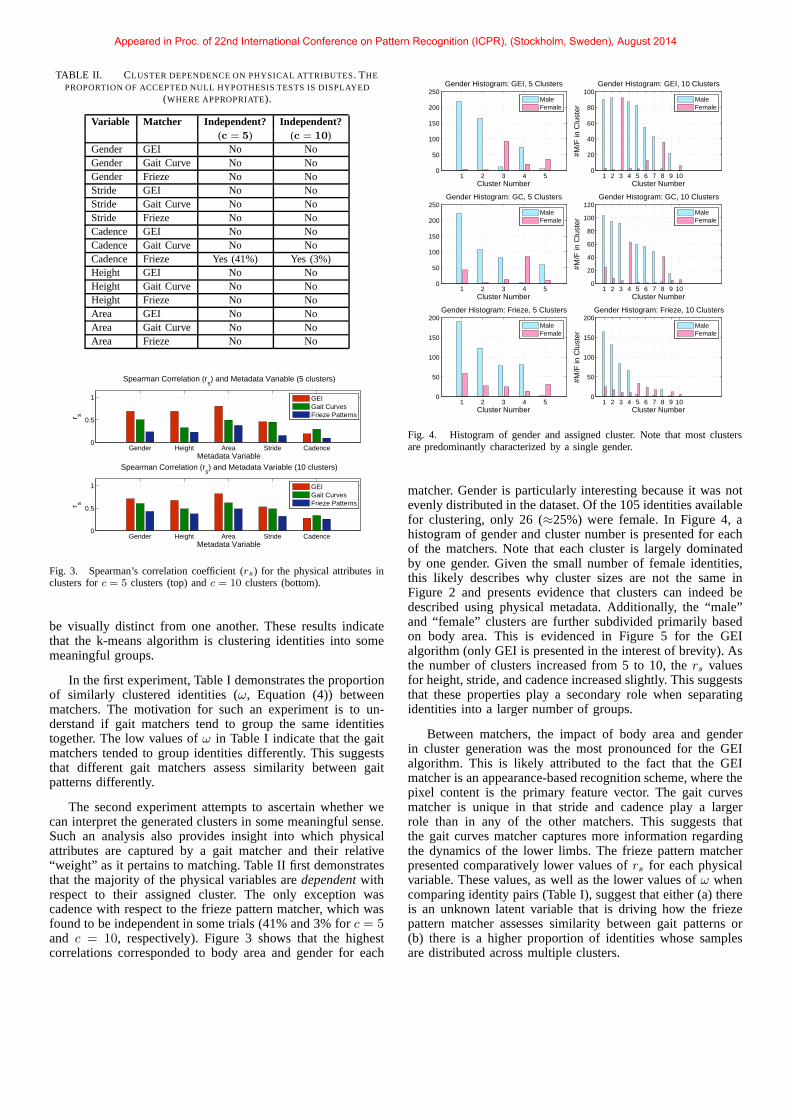
TABLE II. C LUSTER DEPENDENCE ON PHYSICAL ATTRIBUTES. THE
PROPORTION OF ACCEPTED NULL HYPOTHESIS TESTS IS DISPLAYED
(WHERE APPROPRIATE).
Variable Matcher Independent? Independent?(c = 5) (c = 10)
Gender GEI No NoGender Gait Curve No NoGender Frieze No NoStride GEI No NoStride Gait Curve No NoStride Frieze No NoCadence GEI No NoCadence Gait Curve No NoCadence Frieze Yes (41%) Yes (3%)Height GEI No NoHeight Gait Curve No NoHeight Frieze No NoArea GEI No NoArea Gait Curve No NoArea Frieze No No
Gender Height Area Stride Cadence0
0.5
1
Metadata Variable
r s
Spearman Correlation (rs) and Metadata Variable (5 clusters)
GEIGait CurvesFrieze Patterns
Gender Height Area Stride Cadence0
0.5
1
Metadata Variable
r s
Spearman Correlation (rs) and Metadata Variable (10 clusters)
GEIGait CurvesFrieze Patterns
Fig. 3. Spearman’s correlation coefficient (rs) for the physical attributes inclusters forc = 5 clusters (top) andc = 10 clusters (bottom).
be visually distinct from one another. These results indicatethat the k-means algorithm is clustering identities into somemeaningful groups.
In the first experiment, Table I demonstrates the proportionof similarly clustered identities (ω, Equation (4)) betweenmatchers. The motivation for such an experiment is to un-derstand if gait matchers tend to group the same identitiestogether. The low values ofω in Table I indicate that the gaitmatchers tended to group identities differently. This suggeststhat different gait matchers assess similarity between gaitpatterns differently.
The second experiment attempts to ascertain whether wecan interpret the generated clusters in some meaningful sense.Such an analysis also provides insight into which physicalattributes are captured by a gait matcher and their relative“weight” as it pertains to matching. Table II first demonstratesthat the majority of the physical variables aredependentwithrespect to their assigned cluster. The only exception wascadence with respect to the frieze pattern matcher, which wasfound to be independent in some trials (41% and 3% forc = 5and c = 10, respectively). Figure 3 shows that the highestcorrelations corresponded to body area and gender for each
1 2 3 4 50
50
100
150
200
250Gender Histogram: GEI, 5 Clusters
Cluster Number
MaleFemale
1 2 3 4 50
50
100
150
200
250Gender Histogram: GC, 5 Clusters
Cluster Number
MaleFemale
1 2 3 4 50
50
100
150
200Gender Histogram: Frieze, 5 Clusters
Cluster Number
MaleFemale
1 2 3 4 5 6 7 8 9 100
20
40
60
80
100Gender Histogram: GEI, 10 Clusters
Cluster Number
#M/F
in C
lust
er
MaleFemale
1 2 3 4 5 6 7 8 9 100
20
40
60
80
100
120Gender Histogram: GC, 10 Clusters
Cluster Number
#M/F
in C
lust
er
MaleFemale
1 2 3 4 5 6 7 8 9 100
50
100
150
200Gender Histogram: Frieze, 10 Clusters
Cluster Number
#M/F
in C
lust
er
MaleFemale
Fig. 4. Histogram of gender and assigned cluster. Note that most clustersare predominantly characterized by a single gender.
matcher. Gender is particularly interesting because it was notevenly distributed in the dataset. Of the 105 identities availablefor clustering, only 26 (≈25%) were female. In Figure 4, ahistogram of gender and cluster number is presented for eachof the matchers. Note that each cluster is largely dominatedby one gender. Given the small number of female identities,this likely describes why cluster sizes are not the same inFigure 2 and presents evidence that clusters can indeed bedescribed using physical metadata. Additionally, the “male”and “female” clusters are further subdivided primarily basedon body area. This is evidenced in Figure 5 for the GEIalgorithm (only GEI is presented in the interest of brevity). Asthe number of clusters increased from 5 to 10, thers valuesfor height, stride, and cadence increased slightly. This suggeststhat these properties play a secondary role when separatingidentities into a larger number of groups.
Between matchers, the impact of body area and genderin cluster generation was the most pronounced for the GEIalgorithm. This is likely attributed to the fact that the GEImatcher is an appearance-based recognition scheme, where thepixel content is the primary feature vector. The gait curvesmatcher is unique in that stride and cadence play a largerrole than in any of the other matchers. This suggests thatthe gait curves matcher captures more information regardingthe dynamics of the lower limbs. The frieze pattern matcherpresented comparatively lower values ofrs for each physicalvariable. These values, as well as the lower values ofω whencomparing identity pairs (Table I), suggest that either (a) thereis an unknown latent variable that is driving how the friezepattern matcher assesses similarity between gait patterns or(b) there is a higher proportion of identities whose samplesare distributed across multiple clusters.
Appeared in Proc. of 22nd International Conference on Pattern Recognition (ICPR), (Stockholm, Sweden), August 2014

1 2 3 4 52000
2500
3000
3500
4000
4500
GEI: Area, 5 clustersV
alue
Cluster Number
1 2 3 4 5 6 7 8 9 102000
2500
3000
3500
4000
4500
GEI: Area, 10 clusters
Val
ue
Cluster Number
Fig. 5. Box plot of body area and assigned cluster for the GEI matchingalgorithm. Note that the distinct male and female clusters present in Figure 4are separated by differences in body area.
One limitation of this study is that the analysis is reportedon a single dataset using a single clustering algorithm (k-means). In addition, the number of clusters used (5 and 10)may not be optimal. Each of these are areas of future work.With respect to clustering algorithms, empirical analysis usinghierarchical clustering resulted in a majority of the sampledata (≥85%) being assigned to a single cluster, regardless oflinkage strategy. Advanced clustering schemes such as affinitypropagation [21], which automatically selects the number ofclusters also tended to assign the sample data to a singlecluster. Future studies will consider datasets such as the OU-ISIR gait database [22], which is another high-quality gaitdataset that emphasizes cadence.
IV. CONCLUSIONS
In this study a clustering analysis is performed on three gaitrecognition matchers from the literature (Gait Energy Image,Gait Curve matching, Frieze Pattern matching) to address thequestion: “Can human gait be clustered?”. Using k-meansclustering, the analysis conveys that (a) human gaitcan beclustered into a small number of groups (5 to 10 clusters);within clusters, identities sharing similarbody areaandgendertend to be clustered together; and (b) the three gait matchersstudied in this work assess similarity between gait patternsdifferently. In an operational context, these findings suggestthat (a) clustering gait patterns can be used to generate a“profile” of an observed individual when matching biometricdata does not exist and (b) fusion of gait matchers that clusteridentities differently is likely to increase matching performance(demonstrated in preliminary experiments) [23].
REFERENCES
[1] J. Cutting and L. Kozlowski, “Recognizing Friends by Their Walk,”Bulletin of the Psychonomic Society, vol. 9(5), pp. 353–356, 1977.
[2] L. Kozlowski and J. Cutting, “Recognizing the Sex of a Walker froma Dynamic Point Light Display,”Perception and Psycophysics, vol. 21,pp. 575–580, 1977.
[3] M. Nixon, T. Tan, and R. Chellappa,Human Identification Based onGait. Springer, 2006.
[4] D. Wagg and M. Nixon, “On Automated Model-Based Extraction andAnalysis of Gait,” Proceedings of the IEEE International Conferenceon Face and Gesture Recognition, pp. 11–16, 2004.
[5] S. Niyogi and E. Adelson, “Analyzing and Recognizing WalkingFigures in XYT,” Proceedings of IEEE Computer Vision and PatternRecognition, pp. 469–474, 1994.
[6] L. Wang, H. Ning, W. Hu, and T. Tan, “Gait Recognition Based onProcrustes Shape Analysis,”IEEE International Conference on ImageProcessing (ICIP), pp. 433–436, 2002.
[7] B. DeCann and A. Ross, “Gait Curves for Human Identification, Back-pack Detection, and Silhouette Correction in a Nighttime Enviornment,”SPIE Conference on Biometric Technology for Human IdentificationVII, April 2010.
[8] Y. Liu, R. Collins, and Y. Tsin, “Gait Sequence Analysis Using FriezePatterns,”European Conference on Computer Vision, vol. 2351, pp.733–736, 2002.
[9] A. Kale, N. Cuntoor, B. Yegnanarayana, A. Rajagopalan, and R. Chel-lappa, “Gait Analysis for Human Identification,” inAudio- and Video-Based Biometric Person Authentication. Springer Berlin Heidelberg,2003, pp. 706–714.
[10] J. Han and B. Bhanu, “Human Activity Recognition in Thermal InfraredImagery,” Proceedings of the IEEE Workshop on Object Tracking andClassification Beyond the Visible Spectrum, 2005.
[11] D. Tao, X. Li, X. Wu, and J. Maybank, “General Tensor DiscriminantAnalysis and Gabor Features for Gait Recognition,”IEEE Transactionson Pattern Analysis and Machine Intelligence, vol. 29, no. 10, p. 1700,2007.
[12] Y. Guan, C. Li, and Y. Hu, “Random Subspace Method for GaitRecognition,” IEEE Internaional Conference on Multimedia and ExpoWorkshops, pp. 284–289, July 2012.
[13] S. Cho, J. Park, and O. Kwon, “Gender Differences in Three Dimen-sional Gait Analysis Data from 98 Healthy Korean Adults,”ClinicalBiomechanics, vol. 19, no. 2, pp. 145–152, 2004.
[14] L. Lee and E. Grimson, “Gait Analysis for Recognition and Classifica-tion,” IEEE International Conference on Automatic Face and GestureRecognition, pp. 148–155, 2002.
[15] G. Huang and T. Wang, “Gender Classification Based on Fusion ofMulti-View Gait Sequences,”8th Asian Conference on Computer Vision(ACCV), pp. 468–471, 2007.
[16] X. Li, S. Maybank, S. Yan, D. Tao, and D. Xu, “Gait Componentsand Their Application to Gender Recognition,”IEEE Transactions onSystems, Man and Cybernetics, vol. 38, no. 2, pp. 145–155, March2008.
[17] S. Sarkar, P. Phillips, Z. Liu, and I. Vega, “The HumanID GaitChallenge Problem: Datasets, Performance, and Analysis,”IEEE Trans-actions on Pattern Analysis and Machine Intelligence, vol. 2, pp. 162–177, 2005.
[18] E. Watelain, F. Barbier, P. Allard, A. Thevenon, and J. Angu, “GaitPattern Classification of Healthy Elderly Men Based on BiomechanicalData,” Archives of Physical Medicine and Rehabilitation, vol. 81, no. 5,pp. 579–586, May 2000.
[19] J. Kent, New Directions in Shape Analysis, K. Mardia, Ed. Wiley,1992.
[20] S. Yu, D. Tan, and T. Tan, “A Framework for Evaluating the Effect ofView Angle, Clothing and Carrying Condition on Gait Recognition,”Proc. 18th International Conference on Pattern Recognition (ICPR),pp. 441–444, August 2006.
[21] B. Frey and D. Dueck, “Clustering by Passing Messages Between DataPoints,” Science, vol. 315, no. 5814, pp. 972–976, 2007.
[22] Y. Makihara, A. Tisuji, M. Hossain, K. Sugiura, A. Mori, and Y. Yagi,“The OU-ISIR Gait Database Comprising the Treadmill Dataset,”IPSJTransactions on Computer Vision and Applications, vol. 4, pp. 53–62,2012.
[23] B. DeCann, “Modeling Errors in Biometric Surveillance and De-duplication Systems,” PhD. Thesis, West Virginia Univeristy, 2014.
Appeared in Proc. of 22nd International Conference on Pattern Recognition (ICPR), (Stockholm, Sweden), August 2014