on creating animated presentations · of these make any real use of the powerful graphics hardware...
TRANSCRIPT
Eurographics/SIGGRAPH Symposium on Computer Animation (2003)D. Breen, M. Lin (Editors)
On Creating Animated Presentations
Douglas E. Zongker1 David H. Salesin1,2
1 University of Washington, Seattle, Washington, USA2 Microsoft Research, Redmond, Washington, USA
Abstract
Computers are used to display visuals for millions of live presentations each day, and yet only the tiniest fractionof these make any real use of the powerful graphics hardware available on virtually all of today’s machines. In thispaper, we describe our efforts toward harnessing this power to create better types of presentations: presentationsthat include meaningful animation as well as at least a limited degree of interactivity. Our approach has beeniterative, alternating between creating animated talks using available tools, then improving the tools to bettersupport the kinds of talk we wanted to make. Through this cyclic design process, we have identified a set of commonauthoring paradigms that we believe a system for building animated presentations should support. We describethese paradigms and present the latest version of our script-based system for creating animated presentations,called SLITHY. We show several examples of actual animated talks that were created and given with versions ofSLITHY, including one talk presented at SIGGRAPH 2000 and four talks presented at SIGGRAPH 2002. Finally,we describe a set of design principles that we have found useful for making good use of animation in presentation.
Categories and Subject Descriptors (according to ACM CCS): I.3.4 [Computer Graphics]: Graphics Utilities – ap-plication packages I.3.6 [Computer Graphics]: Methodology and Techniques – languages
1. Introduction
By Microsoft estimates, at least thirty million PowerPointpresentations are made every day.16 Even if this estimate isoff by an order of magnitude, the implication is clear: pre-sentation software is a technology that is having an impacton people’s lives.
Modern-day presentation software – of which Power-Point, in representing 95% of the presentation-software mar-ket, is the most prominent example by far – is still rootedfirmly in the past. Although the software has evolved inmany ways, PowerPoint presentations are still essentiallystatic in nature, just as they were when the software, orig-inally designed to create overhead transparencies, was firstreleased in 1987. Even in the latest, animation-enhancedPowerPoint XP, what limited animation capabilities there areexist almost entirely to provide “canned” embellishments tothe static layout of the slide—a snazzy entry or exit for agiven text or graphical element, or a way of momentarilyhighlighting a particular element.
As researchers and educators, we give a lot of talks, andwe sit through even more. Our own lives would be improvedif we could give – and receive – better talks. This paper ex-plores how computers might be used to help us communicatemore effectively. In particular, we examine how computerscould be used to create meaningful animation, as well assome degree of interactivity, to improve live presentations.
Our approach to this problem has been iterative: we be-gan by trying to make talks that incorporated animation andinteractivity using existing software tools. This led to a wishlist of effects we wanted to achieve and ways we wishedthe authoring worked. We began implementing and usingour own system, alternately creating talks and improvingthe system itself. We have coalesced our observations aboutstrategies for authoring animated presentations into a set ofthree authoring principles, which we discuss in Section 2.
Our current system is called SLITHY. It is an animationtool designed specifically for creating and giving presenta-tions. In designing SLITHY, we ideally wanted to accommo-date as wide a range of users as possible. However, try as we
c© The Eurographics Association 2003.
Zongker and Salesin / On Creating Animated Presentations
might, we were unable to imagine any single graphical userinterface – the type of interface, perhaps, that the highestnumber of users would find intuitive – that could encompassthe staggering variety of animations that we could envisionauthors wanting to create. Ultimately, we chose to emphasizepower over ease of use. SLITHY is therefore a script-basedprogramming system, analogous to TEX for text processing,and as such is better suited for use by more technically-inclined users. Despite these limitations, SLITHY has beenused to give a number of presentations (including four atSIGGRAPH 2002 by users other than the authors of the sys-tem). Although we recognize that this style of authoring isnot for everyone, we feel that the problem of creating bet-ter presentations is important enough and hard enough thateven a solution that serves only the needs of a more limited,but still significant community (including, but not limitedto, the technical contributors to SIGGRAPH and other com-puter graphics conferences) is a worthwhile step. The designand implementation of SLITHY are covered in Section 3.
It is an open question among cognitive psychologistsas to whether or not animation improves learning. Anumber of studies3, 15, 20 have found a positive effect, butother researchers criticize these results on methodologicalgrounds.13, 21 The central issue seems to be determining howto make two presentations, one animated and one not, thatare exactly equivalent, “except for the animation.” Despitethe lack of conclusive psychological research, people are us-ing animation, even if it is only the simple effects availablein PowerPoint. In our experience, audiences seem to appreci-ate a richer style of animation even more. As we made moreand more of these animated talks, we were also interested inlearning how best to apply animation in presenting material.If animation is going to be used, we can at least try to makeit as useful as possible. We have tried to understand whysome uses of animation seemed to make information clearer,while others appeared to be simply gratuitous and distract-ing. For example (and to our own surprise), we found thatmany of the principles of classical animation10 do not neces-sarily work so well for presentations. In Section 4 we detailour observations on principles for good presentation anima-tion.
Finally, Section 5 shows examples of some presentationscreated with our system, Section 6 compares SLITHY, thesystem we built, to other existing systems, and Section 7presents some conclusions and directions for future work.
2. Authoring principles
Our first set of principles is concerned with techniquesfor authoring animation. Since presentation animation com-monly has a different purpose and visual style than charac-ter animation, we expect that authors will demand a differentset of tools for creating the animation. Here we discuss threegeneral authoring techniques that we have found to be use-ful.
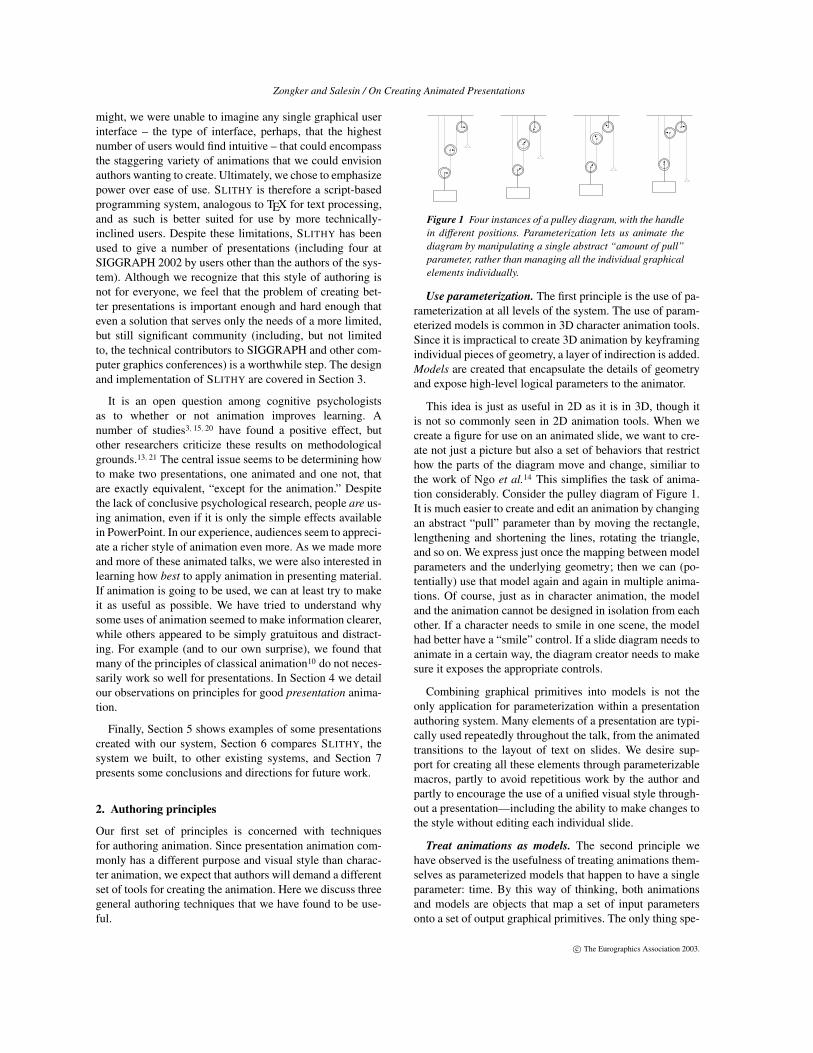
Figure 1 Four instances of a pulley diagram, with the handlein different positions. Parameterization lets us animate thediagram by manipulating a single abstract “amount of pull”parameter, rather than managing all the individual graphicalelements individually.
Use parameterization. The first principle is the use of pa-rameterization at all levels of the system. The use of param-eterized models is common in 3D character animation tools.Since it is impractical to create 3D animation by keyframingindividual pieces of geometry, a layer of indirection is added.Models are created that encapsulate the details of geometryand expose high-level logical parameters to the animator.
This idea is just as useful in 2D as it is in 3D, though itis not so commonly seen in 2D animation tools. When wecreate a figure for use on an animated slide, we want to cre-ate not just a picture but also a set of behaviors that restricthow the parts of the diagram move and change, similiar tothe work of Ngo et al.14 This simplifies the task of anima-tion considerably. Consider the pulley diagram of Figure 1.It is much easier to create and edit an animation by changingan abstract “pull” parameter than by moving the rectangle,lengthening and shortening the lines, rotating the triangle,and so on. We express just once the mapping between modelparameters and the underlying geometry; then we can (po-tentially) use that model again and again in multiple anima-tions. Of course, just as in character animation, the modeland the animation cannot be designed in isolation from eachother. If a character needs to smile in one scene, the modelhad better have a “smile” control. If a slide diagram needs toanimate in a certain way, the diagram creator needs to makesure it exposes the appropriate controls.
Combining graphical primitives into models is not theonly application for parameterization within a presentationauthoring system. Many elements of a presentation are typi-cally used repeatedly throughout the talk, from the animatedtransitions to the layout of text on slides. We desire sup-port for creating all these elements through parameterizablemacros, partly to avoid repetitious work by the author andpartly to encourage the use of a unified visual style through-out a presentation—including the ability to make changes tothe style without editing each individual slide.
Treat animations as models. The second principle wehave observed is the usefulness of treating animations them-selves as parameterized models that happen to have a singleparameter: time. By this way of thinking, both animationsand models are objects that map a set of input parametersonto a set of output graphical primitives. The only thing spe-
c© The Eurographics Association 2003.
Zongker and Salesin / On Creating Animated Presentations
cial about “animations” is that their input parameter set hap-pens to consist of a single scalar value. The advantage of thisapproach is that an animation object does not have to containeverything visible on the screen at once. Instead, we can con-struct animations in smaller logical units and combine themto make slides, just as we would combine static graphics andtext in standard presentation tools.
Build slides hierarchically. The result of combining ani-mations together is, of course, a new composite animation.This suggests our final authoring principle, that of support-ing deep hierarchical assembly. We want the ability to nestthese characters and models within each other to any de-gree of depth. This ability is not typically necessary in atraditional character animation setting. There, the modeledcharacters are placed into a scene, their controls manipu-lated via keyframing, and frames rendered out. In presenta-tions, though, the models and animations can be much moreabstract, and it often makes sense for them to be includedin one another. For example, imagine a slide (an anima-tion) that features a block diagram of a system. The diagramwould be created as a parameterized model. Each block ofthe diagram might contain a thumbnail animation to suggestto the audience the task performed inside that block. Thesmall animations would each contain their own models aswell. While very deep nesting is not necessary – a few levelsis all that is probably useful in practice – it is clearly usefulto support more than just one level of models-in-animations.
3. Slithy
Our presentation system, SLITHY, is implemented as a set oflibraries and a runtime system for the popular programminglanguage Python. SLITHY users therefore have access to acomplete, general-purpose programming language for use increating their animations. A presentation in SLITHY can bethought of as a collection of drawing objects. There are threemajor types of drawing object available in SLITHY:
• Parameterized diagrams can require an arbitrary set of pa-rameters as input, and they produce their graphical outputimperatively by executing a procedure that makes calls tothe SLITHY drawing library. The user creates a parame-terized diagram by writing a Python function; this Pythonfunction is executed every time the diagram needs to beredrawn. These functions can contain arbitrary Pythoncode; they are not limited to the primitives available inour graphics library. They can also invoke other parame-terized diagrams or animation objects.
• Animation objects require exactly one scalar parameter,which we will typically think of as representing time.The object provides a mapping from the time parameterto a set of other drawing objects to invoke, along withvalues for their parameters. This kind of object is con-structed by writing an animation script in Python. The
script is executed just once to produce the animation ob-ject. Each command in the script edits the mapping thatthe object represents; the finished object is returned at thecompletion of the script. The SLITHY runtime system canthen “play” an animation object by repeatedly invoking it,passing in the current time as the value of its parameter.
A single animation object can control the parameters ofmultiple other drawing objects. In addition to user-createdparameterized diagrams, the system also has a number ofbuilt-in objects to display things like background fills, textboxes, still images, and bulleted lists. These objects areessentially very simple prefabricated parameterized dia-grams created to implement commonly used slide ele-ments.
• Interactive objects are similar to animation objects in thatthey represent a mapping from a single scalar time pa-rameter to a set of other drawing objects and their param-eters. The difference is that while animation objects arecreated by a single script, executed just once when thepresentation is loaded, interactive objects can be editedwhile they are being played. The author writes an inter-active controller that contains handlers for input eventssuch as keystrokes and mouse movements. The handlerscan then modify the animation being shown. With inter-active controllers, the presenter can effectively generate anew animation object during the presentation.
Every drawing object takes a set of input parameter valuesand produces graphics on its own notionally infinite can-vas. A camera rectangle specifies what region of that canvasmust be visible in the object’s viewport. An object’s view-port may be placed on the canvas of another object. In thisway, drawing objects can contain each other in a hierarchy.Each object is responsible for providing parameters to theobjects it contains. The top object of the hierarchy is alwaysan animation object, whose viewport is the entire SLITHY
window, and whose single time parameter is driven by thecomputer’s real-time clock.
The remainder of this section will discuss the three classesof drawing objects and their implementations in more detail.
3.1. Parameterized diagrams
Parameterized diagrams are the most straightforward kind ofdrawing object. A parameterized diagram is simply a Pythonfunction that does some drawing when called. For doing thisdrawing, SLITHY provides a graphics library that has a vari-ety of primitives beyond the lines and triangles provided byOpenGL.
We will illustrate some of the features of our param-eterized diagram system by building a simple example—constructing an analog clock face. We begin with this six-line function:
c© The Eurographics Association 2003.
Zongker and Salesin / On Creating Animated Presentations
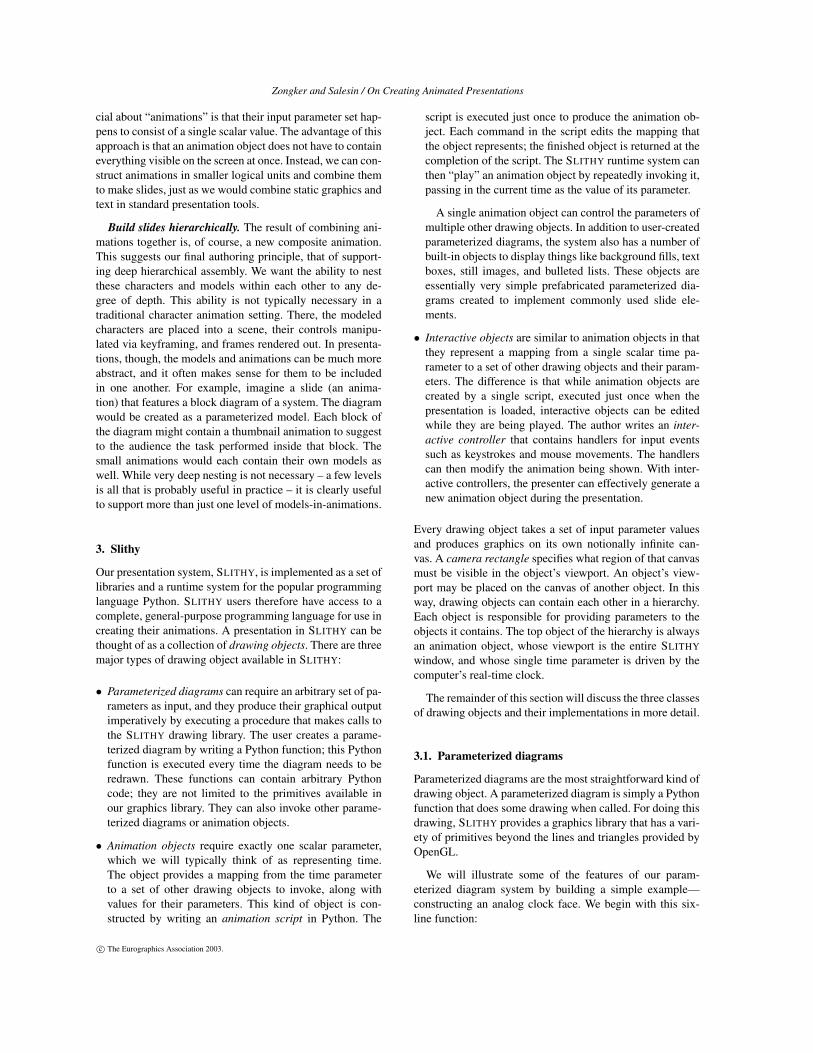
def clock_face():set_camera( Rect(-12, -15, 12, 12) )clear( white )thickness( 0.25 )circle( 10, 0, 0 )circle( 10.5, 0, 0 )
The Python keyword def is used to introduce a new func-tion, named clock_face in this example. The other fivelines are calls to functions in the drawing library. First wespecify what rectangular portion of the infinite canvas mustbe visible in the diagram’s viewport—in this case, the areafrom (−12,−15) to (12,12). Then we clear the diagram’scanvas to white, set the line thickness, and draw a pair ofconcentric circles around the origin. Note that diagrams arewritten in a straightforward imperative style of program-ming. This function is called every time the diagram is tobe drawn (typically, once per frame of animation). There isno object state to track from one invocation to the next; theappearance is completely specified by the sequence of draw-ing library routines used in the current call to the function.
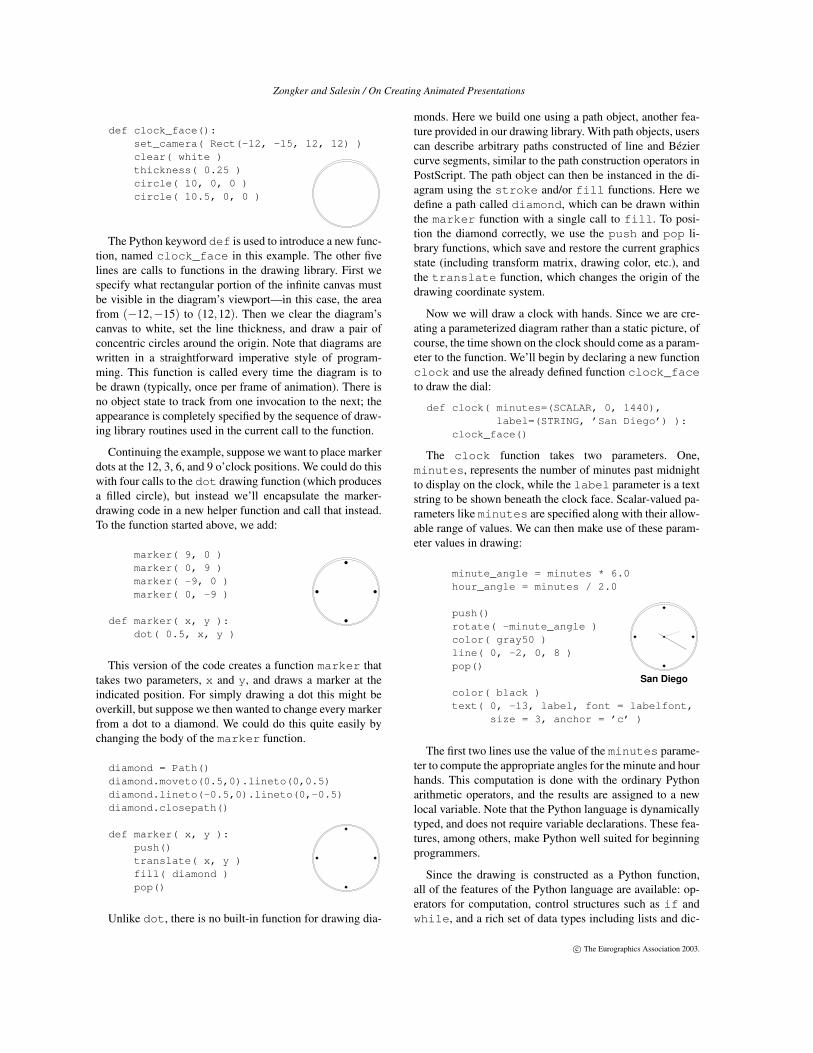
Continuing the example, suppose we want to place markerdots at the 12, 3, 6, and 9 o’clock positions. We could do thiswith four calls to the dot drawing function (which producesa filled circle), but instead we’ll encapsulate the marker-drawing code in a new helper function and call that instead.To the function started above, we add:
marker( 9, 0 )marker( 0, 9 )marker( -9, 0 )marker( 0, -9 )
def marker( x, y ):dot( 0.5, x, y )
This version of the code creates a function marker thattakes two parameters, x and y, and draws a marker at theindicated position. For simply drawing a dot this might beoverkill, but suppose we then wanted to change every markerfrom a dot to a diamond. We could do this quite easily bychanging the body of the marker function.
diamond = Path()diamond.moveto(0.5,0).lineto(0,0.5)diamond.lineto(-0.5,0).lineto(0,-0.5)diamond.closepath()
def marker( x, y ):push()translate( x, y )fill( diamond )pop()
Unlike dot, there is no built-in function for drawing dia-
monds. Here we build one using a path object, another fea-ture provided in our drawing library. With path objects, userscan describe arbitrary paths constructed of line and Béziercurve segments, similar to the path construction operators inPostScript. The path object can then be instanced in the di-agram using the stroke and/or fill functions. Here wedefine a path called diamond, which can be drawn withinthe marker function with a single call to fill. To posi-tion the diamond correctly, we use the push and pop li-brary functions, which save and restore the current graphicsstate (including transform matrix, drawing color, etc.), andthe translate function, which changes the origin of thedrawing coordinate system.
Now we will draw a clock with hands. Since we are cre-ating a parameterized diagram rather than a static picture, ofcourse, the time shown on the clock should come as a param-eter to the function. We’ll begin by declaring a new functionclock and use the already defined function clock_faceto draw the dial:
def clock( minutes=(SCALAR, 0, 1440),label=(STRING, ’San Diego’) ):
clock_face()
The clock function takes two parameters. One,minutes, represents the number of minutes past midnightto display on the clock, while the label parameter is a textstring to be shown beneath the clock face. Scalar-valued pa-rameters like minutes are specified along with their allow-able range of values. We can then make use of these param-eter values in drawing:
San Diego
minute_angle = minutes * 6.0hour_angle = minutes / 2.0
push()rotate( -minute_angle )color( gray50 )line( 0, -2, 0, 8 )pop()
color( black )text( 0, -13, label, font = labelfont,
size = 3, anchor = ’c’ )
The first two lines use the value of the minutes parame-ter to compute the appropriate angles for the minute and hourhands. This computation is done with the ordinary Pythonarithmetic operators, and the results are assigned to a newlocal variable. Note that the Python language is dynamicallytyped, and does not require variable declarations. These fea-tures, among others, make Python well suited for beginningprogrammers.
Since the drawing is constructed as a Python function,all of the features of the Python language are available: op-erators for computation, control structures such as if andwhile, and a rich set of data types including lists and dic-
c© The Eurographics Association 2003.
Zongker and Salesin / On Creating Animated Presentations
tionaries. It is not necessary to use all of these abilities forsimple diagrams like this example, but they can be helpfulfor making more complex figures.
The next group of lines actually draw the minute hand byrotating the coordinate system through the appropriate angleand drawing a gray line. A similar block of code (not shownhere) is used to add the hour hand as well. Finally, the string-valued label parameter is drawn beneath the clock face.
Parameterized diagrams can be tested by loading theminto SLITHY’s test harness, which lets the user interactivelymanipulate the diagram’s parameters via on-screen widgetsand see the results. Users can also click in the diagram andsee those points back-projected into the diagram’s coordi-nate system; this aids in placing objects on the canvas. Fig-ure 3(a) shows the clock diagram in the test window—theminutes and label parameters are mapped to by a sliderand a text box, respectively.
3.2. Animation scripts
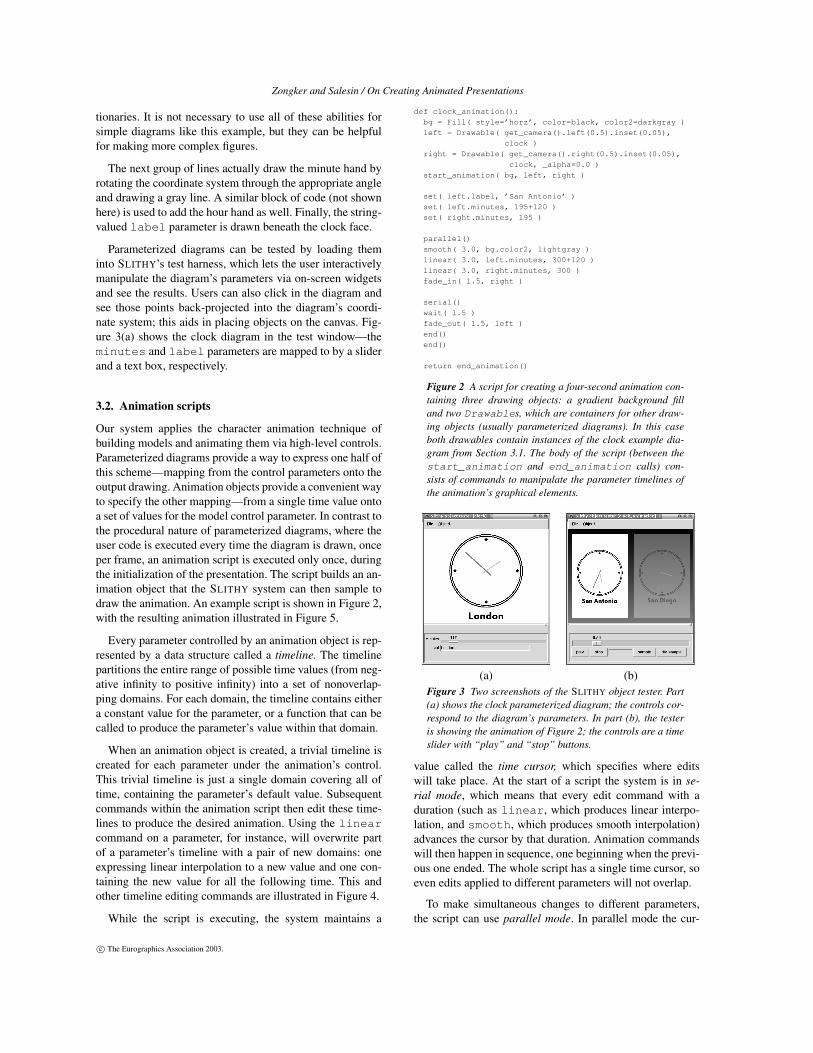
Our system applies the character animation technique ofbuilding models and animating them via high-level controls.Parameterized diagrams provide a way to express one half ofthis scheme—mapping from the control parameters onto theoutput drawing. Animation objects provide a convenient wayto specify the other mapping—from a single time value ontoa set of values for the model control parameter. In contrast tothe procedural nature of parameterized diagrams, where theuser code is executed every time the diagram is drawn, onceper frame, an animation script is executed only once, duringthe initialization of the presentation. The script builds an an-imation object that the SLITHY system can then sample todraw the animation. An example script is shown in Figure 2,with the resulting animation illustrated in Figure 5.
Every parameter controlled by an animation object is rep-resented by a data structure called a timeline. The timelinepartitions the entire range of possible time values (from neg-ative infinity to positive infinity) into a set of nonoverlap-ping domains. For each domain, the timeline contains eithera constant value for the parameter, or a function that can becalled to produce the parameter’s value within that domain.
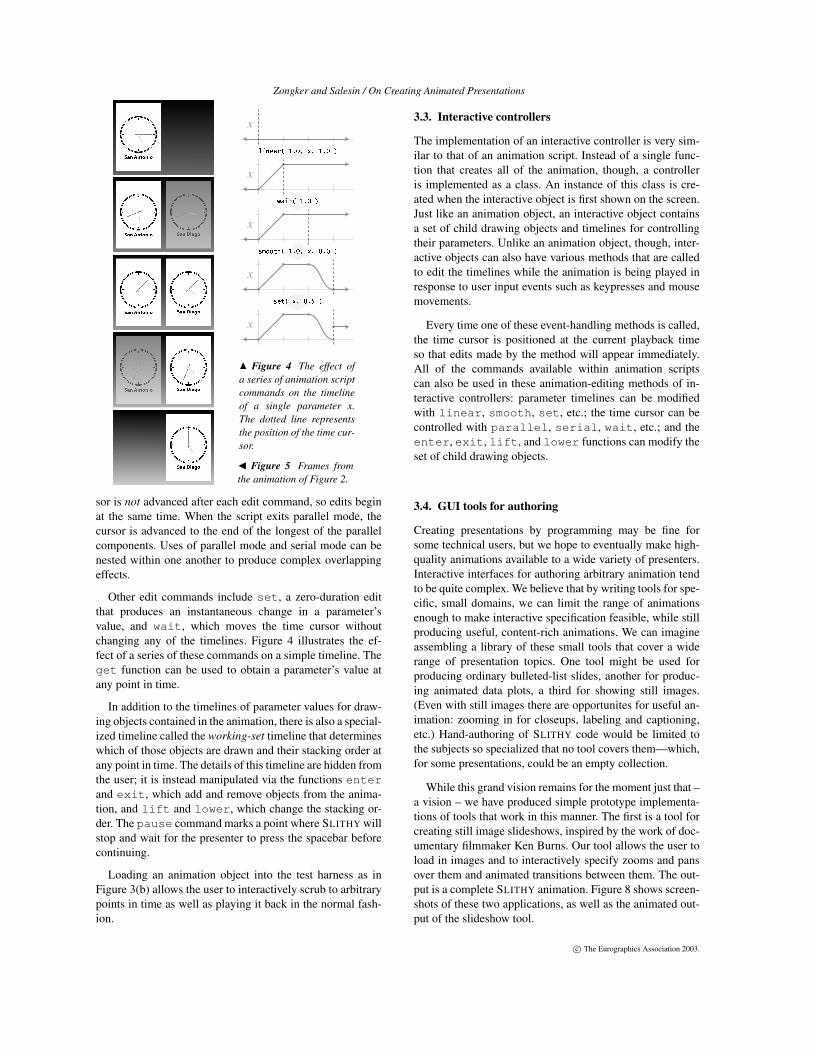
When an animation object is created, a trivial timeline iscreated for each parameter under the animation’s control.This trivial timeline is just a single domain covering all oftime, containing the parameter’s default value. Subsequentcommands within the animation script then edit these time-lines to produce the desired animation. Using the linearcommand on a parameter, for instance, will overwrite partof a parameter’s timeline with a pair of new domains: oneexpressing linear interpolation to a new value and one con-taining the new value for all the following time. This andother timeline editing commands are illustrated in Figure 4.
While the script is executing, the system maintains a
def clock_animation():
bg = Fill( style=’horz’, color=black, color2=darkgray )
left = Drawable( get_camera().left(0.5).inset(0.05),
clock )
right = Drawable( get_camera().right(0.5).inset(0.05),
clock, _alpha=0.0 )
start_animation( bg, left, right )
set( left.label, ’San Antonio’ )
set( left.minutes, 195+120 )
set( right.minutes, 195 )
parallel()
smooth( 3.0, bg.color2, lightgray )
linear( 3.0, left.minutes, 300+120 )
linear( 3.0, right.minutes, 300 )
fade_in( 1.5, right )
serial()
wait( 1.5 )
fade_out( 1.5, left )
end()
end()
return end_animation()
Figure 2 A script for creating a four-second animation con-taining three drawing objects: a gradient background filland two Drawables, which are containers for other draw-ing objects (usually parameterized diagrams). In this caseboth drawables contain instances of the clock example dia-gram from Section 3.1. The body of the script (between thestart_animation and end_animation calls) con-sists of commands to manipulate the parameter timelines ofthe animation’s graphical elements.
(a) (b)Figure 3 Two screenshots of the SLITHY object tester. Part(a) shows the clock parameterized diagram; the controls cor-respond to the diagram’s parameters. In part (b), the testeris showing the animation of Figure 2; the controls are a timeslider with “play” and “stop” buttons.
value called the time cursor, which specifies where editswill take place. At the start of a script the system is in se-rial mode, which means that every edit command with aduration (such as linear, which produces linear interpo-lation, and smooth, which produces smooth interpolation)advances the cursor by that duration. Animation commandswill then happen in sequence, one beginning when the previ-ous one ended. The whole script has a single time cursor, soeven edits applied to different parameters will not overlap.
To make simultaneous changes to different parameters,the script can use parallel mode. In parallel mode the cur-
c© The Eurographics Association 2003.
Zongker and Salesin / On Creating Animated Presentations
����������� ��� ����������� ���
� ������� ��� ���
������� ��� � ��� ����������� ���
� �������!�"�!�$# �
x
x
x
x
x
N Figure 4 The effect ofa series of animation scriptcommands on the timelineof a single parameter x.The dotted line representsthe position of the time cur-sor.
J Figure 5 Frames fromthe animation of Figure 2.
sor is not advanced after each edit command, so edits beginat the same time. When the script exits parallel mode, thecursor is advanced to the end of the longest of the parallelcomponents. Uses of parallel mode and serial mode can benested within one another to produce complex overlappingeffects.
Other edit commands include set, a zero-duration editthat produces an instantaneous change in a parameter’svalue, and wait, which moves the time cursor withoutchanging any of the timelines. Figure 4 illustrates the ef-fect of a series of these commands on a simple timeline. Theget function can be used to obtain a parameter’s value atany point in time.
In addition to the timelines of parameter values for draw-ing objects contained in the animation, there is also a special-ized timeline called the working-set timeline that determineswhich of those objects are drawn and their stacking order atany point in time. The details of this timeline are hidden fromthe user; it is instead manipulated via the functions enterand exit, which add and remove objects from the anima-tion, and lift and lower, which change the stacking or-der. The pause command marks a point where SLITHY willstop and wait for the presenter to press the spacebar beforecontinuing.
Loading an animation object into the test harness as inFigure 3(b) allows the user to interactively scrub to arbitrarypoints in time as well as playing it back in the normal fash-ion.
3.3. Interactive controllers
The implementation of an interactive controller is very sim-ilar to that of an animation script. Instead of a single func-tion that creates all of the animation, though, a controlleris implemented as a class. An instance of this class is cre-ated when the interactive object is first shown on the screen.Just like an animation object, an interactive object containsa set of child drawing objects and timelines for controllingtheir parameters. Unlike an animation object, though, inter-active objects can also have various methods that are calledto edit the timelines while the animation is being played inresponse to user input events such as keypresses and mousemovements.
Every time one of these event-handling methods is called,the time cursor is positioned at the current playback timeso that edits made by the method will appear immediately.All of the commands available within animation scriptscan also be used in these animation-editing methods of in-teractive controllers: parameter timelines can be modifiedwith linear, smooth, set, etc.; the time cursor can becontrolled with parallel, serial, wait, etc.; and theenter, exit, lift, and lower functions can modify theset of child drawing objects.
3.4. GUI tools for authoring
Creating presentations by programming may be fine forsome technical users, but we hope to eventually make high-quality animations available to a wide variety of presenters.Interactive interfaces for authoring arbitrary animation tendto be quite complex. We believe that by writing tools for spe-cific, small domains, we can limit the range of animationsenough to make interactive specification feasible, while stillproducing useful, content-rich animations. We can imagineassembling a library of these small tools that cover a widerange of presentation topics. One tool might be used forproducing ordinary bulleted-list slides, another for produc-ing animated data plots, a third for showing still images.(Even with still images there are opportunites for useful an-imation: zooming in for closeups, labeling and captioning,etc.) Hand-authoring of SLITHY code would be limited tothe subjects so specialized that no tool covers them—which,for some presentations, could be an empty collection.
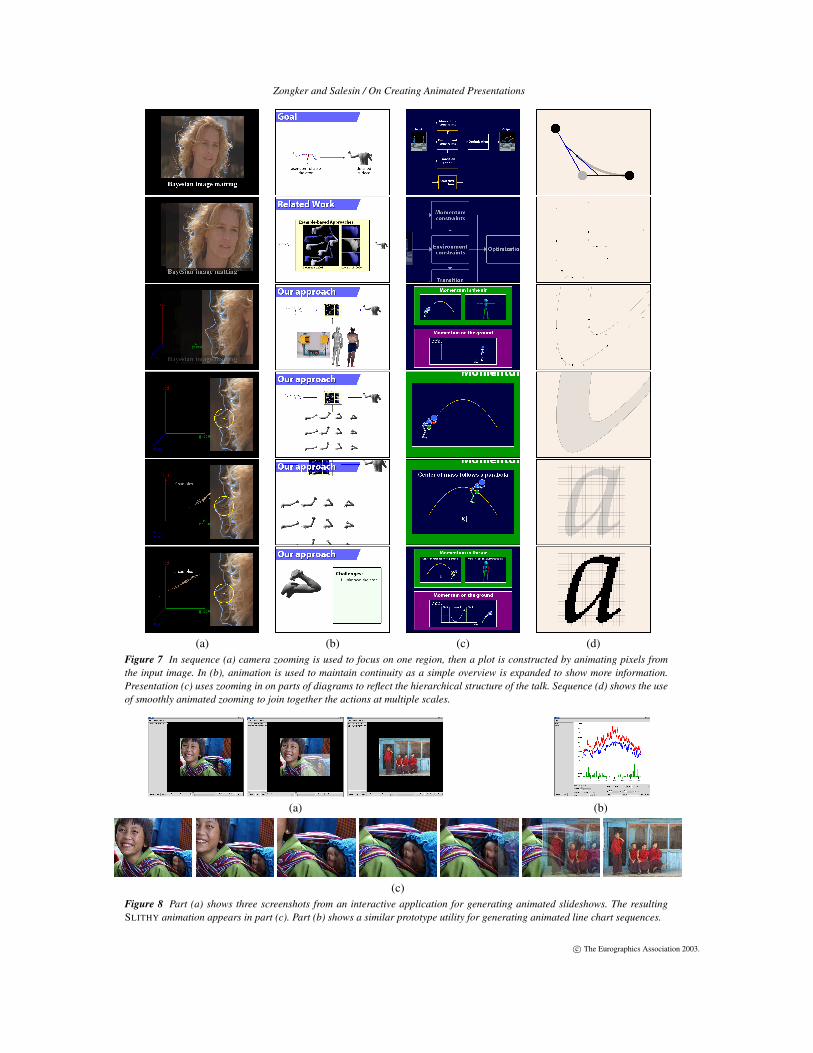
While this grand vision remains for the moment just that –a vision – we have produced simple prototype implementa-tions of tools that work in this manner. The first is a tool forcreating still image slideshows, inspired by the work of doc-umentary filmmaker Ken Burns. Our tool allows the user toload in images and to interactively specify zooms and pansover them and animated transitions between them. The out-put is a complete SLITHY animation. Figure 8 shows screen-shots of these two applications, as well as the animated out-put of the slideshow tool.
c© The Eurographics Association 2003.
Zongker and Salesin / On Creating Animated Presentations
4. Animation principles
When desktop publishing and laser printers started to be-come more common, displacing the typewriter, the imme-diate result was not better-looking documents. Confrontedby dozens of typesetting options, people simply chose themall, even within a single document. The message was not“look at my content,” but “look at what my software cando.” Today, too many presentations use animation with sim-ilar results. Animation can enhance the content, or it can bevisually distracting. By summarizing the results of our expe-rience in making animated presentations as a set of generalprinciples, we hope to encourage the former, leading to moreengaging and informative presentations. It is important to re-member that these are not meant as rules, but more as a set ofdefaults. Like most rules, the principles here should at timesbe judiciously broken.
Make all movement meaningful. When we first startedadding animation to presentations, we naturally tried toapply traditional animation principles such as squash andstretch and exaggeration, with generally poor results. Theseprinciples are intended to turn a drawing (or a renderedmodel) into a character in the mind of the viewer. Whilethis liveliness is desirable in animation made to entertain, itis distracting when the goal is to inform. The audience isdrawn away from the speaker and becomes focused on theanimation itself, wondering what interesting thing is goingto happen on the screen next. We had better results whenmotion was as economical as possible.
Other classical animation principles such as anticipationand staging are employed to draw the audience’s attentionto the right part of the screen at the right time. In presen-tations, though, it is usually better to do this in a way thatmaintains a distinction between the attention-getting anima-tion and the action the audience needs to see. If somethinginteresting is about to happen in a particular section of a fig-ure, that section should be highlighted by a color change, asuperimposed arrow, or even the speaker manually pointingat it with the cursor—anything that can’t be confused withthe interesting action itself.
Avoid instantaneous changes. We suggest makingsmooth transitions – even something as simple as a cross-fade – the standard way of getting information on and offthe screen. Sudden cuts between states of a diagram createuncertainty and tension, causing the audience to focus on thescreen so that nothing important is missed. Even very brieftransitions are better than sudden cuts at creating a feeling ofcontinuity, which lets the focus move easily from the screento the speaker and back as needed.
Reinforce structure with transitions. An advantage of us-ing subtle transitions is that it increases the impact of themore showy effects when they are used. A presentation inwhich every single bullet point tap-dances its way onto thescreen is a presentation where the audience quickly learns
to ignore the tap-dancing. Used carefully, transitions can re-inforce the structure of the presentation. A section can bevisually tied together with simple transitions. Using a moredramatic effect to move to a new section will then create avisual break, subtly punctuating the visual half of the talk asthe speaker punctuates the verbal half.
Good and Bederson8 call this effect the “sense of seman-tic distance.” In their system static PowerPoint slides are ar-ranged on a large canvas at various scales; the transitionsfrom one slide to the next are then pans and zooms of thecamera across this canvas. The natural way of laying outslides in clusters by topic then leads to small transitions be-tween related slides and longer, sweeping motions betweenmore distant sections. Our recommendation can be thoughtof as a generalization of this effect, where the concept ofa “bigger” movement is extended to more than simple Eu-clidean distance.
Create a large virtual canvas. Often when creating a pre-sentation it seems like there is not enough room on the slideto include everything the author thinks is important. Ani-mated panning and zooming can be used to naturally in-crease the effective real estate of the screen. A figure thatslides off one side of the screen remains more “visible” inthe mind’s eye of the audience than one that simply blinksout of existence. This effect is supported by psychologicalresearch: Dillon et al.6 summarize a number of studies sup-porting a positive correlation between memory for locationand memory for content in both text and electronic docu-ments.
Smoothly expand and compress detail. A closely relatedprinciple is that of using animation to expand and compressdetail. In the previous principle we suggested using camerapans and zooms to give the impression of the screen as awindow onto a very large space. It is also effective to use thescreen as a kind of magnifying glass for examining figuresat a variety of scales. In this way the presentation can eas-ily fill the screen with the active portion of a diagram, shut-ting out the parts not relevant to what the speaker is saying.With static slides the screen jumps between scales, whichtypically requires explanation by the presenter and effort bythe audience to make the mental links between the differentviews.
With animation, this kind of navigation becomes mucheasier to follow. Linking the different views with smooth,continuous camera motion takes advantage of the viewers’natural spatial abilities, with less need for artificial highlight-ing and explanation from the presenter. Zooming in to em-phasize detail can be done much more often because there isless overhead involved in maintaining context.
Manage complexity through overlays. Panning andzooming allow attention to be focused on one spatial regionof a figure, keeping unnecessary detail off the screen whileproviding context. Instead of breaking a diagram into piecesspatially, one can imagine instead slicing along an axis of
c© The Eurographics Association 2003.
Zongker and Salesin / On Creating Animated Presentations
“complexity,” separating detail into layers that become visi-ble only as required. A simple animated transition such as aquick fade-in or a small sliding motion can provide a subtleand effective cue for differentiating the layers of informa-tion.
Do one thing at a time. Animations where many thingsare changing at once give an overall impression of thechange, but make it difficult to concentrate on any singlepart. We have had the best results when complex diagramsare animated relatively slowly and with frequent pauses, sothat the animations track the speaker’s words. The techno-logical advances in slide creation and projection have madeit increasingly common for the presenter’s words to take aback seat to the elaborate visuals. The extensive use of an-imation threatens to make this effect worse. We believe itis important to treat any visuals – animated or otherwise –as an accompaniment to the talk, rather than the other wayaround. The presenter can only talk about one thing at a time;the animation on the screen should match.
Reinforce animation with narration. The idea of usinganimation simultaneously with narration is a useful one. Inour own presentations we have noticed a frequent impulseto try and make two points at once—to have the animationshowing one thing on the screen while we talk about some-thing else. Even though the two topics are usually closelyrelated, it is very difficult to follow both threads, and usu-ally the result is that neither point gets made very effectively.When used simultaneously, animation and narration shouldreinforce each other. The speaker should describe what ishappening on the screen as it happens. To make a point thatisn’t illustrated, a pause in the on-screen motion will nat-urally shift attention back to the presenter. The effective-ness of narration in concert with animation has been demon-strated in a series of studies by Mayer and Anderson.11, 12
Distinguish dynamics from transitions. Our final anima-tion principle also deals with reducing the potential for con-fusion by the audience. We divide presentation animationsinto two major classes: dynamics and transitions. Dynamicsrefers to perhaps the most natural use of animation: depict-ing change over time in a real-world process. This changecould be physical, such as a moving illustration of a me-chanical system, or abstract, such as data flowing througha computer algorithm. The essential notion is that the ani-mation is used to show some kind of change in the materialbeing presented. Transitions is the term we use to capture allthe other uses of animation—using it to highlight, to drawattention, to move the talk from one topic to the next. Here,the animation serves to help guide the audience through thepresentation itself.
We have found it important to make sure the distinctionbetween dynamics and transitions is clear. It is very easyto create animation that can be misinterpreted. As an exam-ple, one of our users was using a prototype of our system toprepare a talk on a technique for simulating the motion of
nonrigid bodies. He wanted to contrast between two differ-ent states of his system and had created a clever animatedtransition between the two illustrations. Viewers were of-ten confused by the transition, thinking that the motion theywere seeing represented the output of the simulation. Fortu-nately, this problem was identified before the final presenta-tion: replacing the confusing motion transition with a simplecrossfade resolved the ambiguity, making it clear that the se-quence was showing two static states rather than an actualmotion.
5. Experience and examples
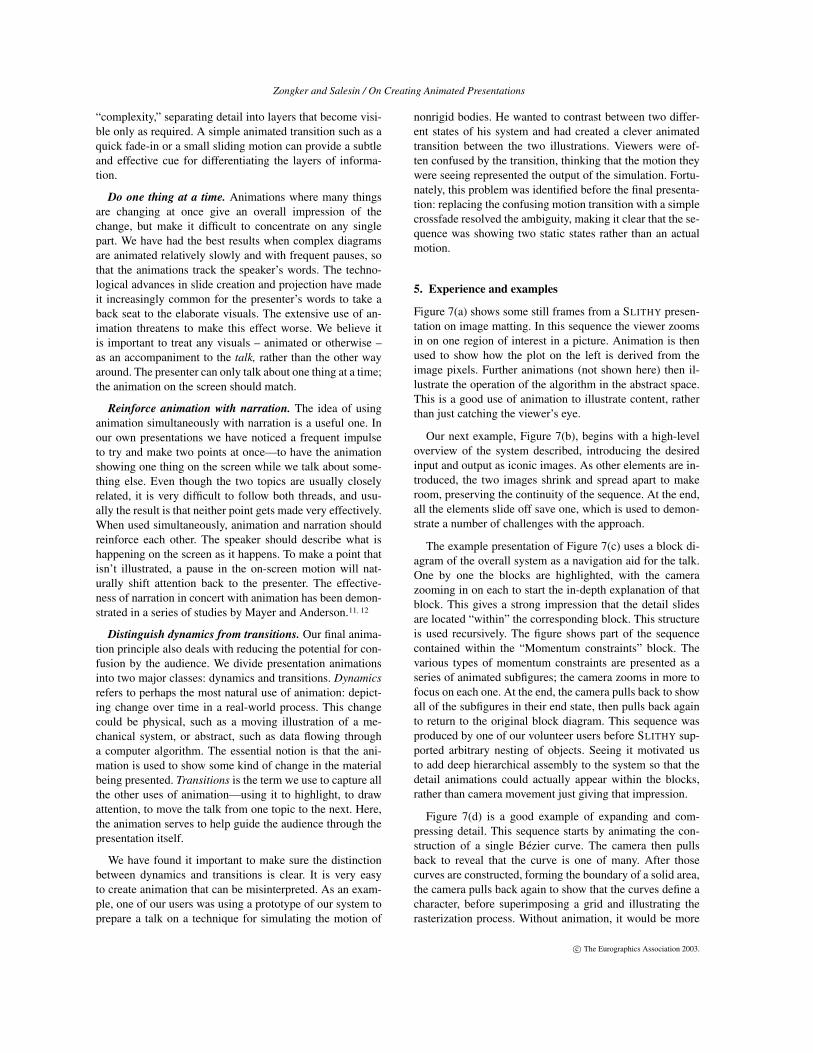
Figure 7(a) shows some still frames from a SLITHY presen-tation on image matting. In this sequence the viewer zoomsin on one region of interest in a picture. Animation is thenused to show how the plot on the left is derived from theimage pixels. Further animations (not shown here) then il-lustrate the operation of the algorithm in the abstract space.This is a good use of animation to illustrate content, ratherthan just catching the viewer’s eye.
Our next example, Figure 7(b), begins with a high-leveloverview of the system described, introducing the desiredinput and output as iconic images. As other elements are in-troduced, the two images shrink and spread apart to makeroom, preserving the continuity of the sequence. At the end,all the elements slide off save one, which is used to demon-strate a number of challenges with the approach.
The example presentation of Figure 7(c) uses a block di-agram of the overall system as a navigation aid for the talk.One by one the blocks are highlighted, with the camerazooming in on each to start the in-depth explanation of thatblock. This gives a strong impression that the detail slidesare located “within” the corresponding block. This structureis used recursively. The figure shows part of the sequencecontained within the “Momentum constraints” block. Thevarious types of momentum constraints are presented as aseries of animated subfigures; the camera zooms in more tofocus on each one. At the end, the camera pulls back to showall of the subfigures in their end state, then pulls back againto return to the original block diagram. This sequence wasproduced by one of our volunteer users before SLITHY sup-ported arbitrary nesting of objects. Seeing it motivated usto add deep hierarchical assembly to the system so that thedetail animations could actually appear within the blocks,rather than camera movement just giving that impression.
Figure 7(d) is a good example of expanding and com-pressing detail. This sequence starts by animating the con-struction of a single Bézier curve. The camera then pullsback to reveal that the curve is one of many. After thosecurves are constructed, forming the boundary of a solid area,the camera pulls back again to show that the curves define acharacter, before superimposing a grid and illustrating therasterization process. Without animation, it would be more
c© The Eurographics Association 2003.
Zongker and Salesin / On Creating Animated Presentations
(a)
(b)
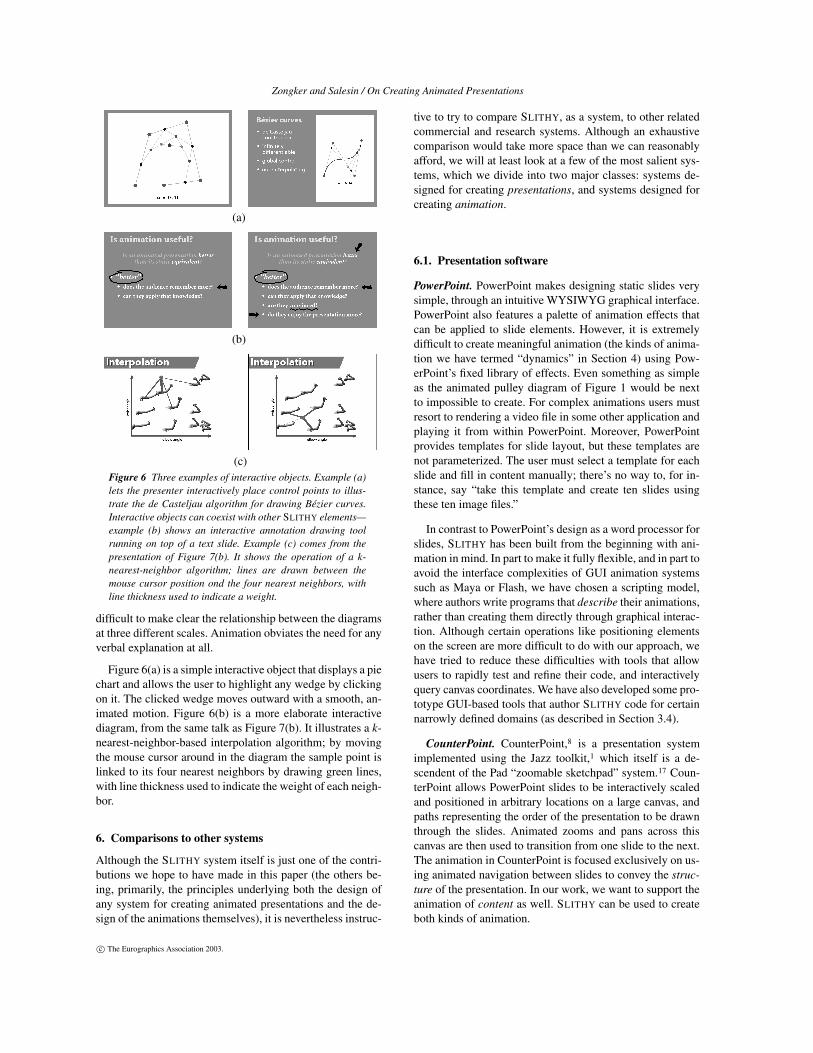
(c)Figure 6 Three examples of interactive objects. Example (a)lets the presenter interactively place control points to illus-trate the de Casteljau algorithm for drawing Bézier curves.Interactive objects can coexist with other SLITHY elements—example (b) shows an interactive annotation drawing toolrunning on top of a text slide. Example (c) comes from thepresentation of Figure 7(b). It shows the operation of a k-nearest-neighbor algorithm; lines are drawn between themouse cursor position ond the four nearest neighbors, withline thickness used to indicate a weight.
difficult to make clear the relationship between the diagramsat three different scales. Animation obviates the need for anyverbal explanation at all.
Figure 6(a) is a simple interactive object that displays a piechart and allows the user to highlight any wedge by clickingon it. The clicked wedge moves outward with a smooth, an-imated motion. Figure 6(b) is a more elaborate interactivediagram, from the same talk as Figure 7(b). It illustrates a k-nearest-neighbor-based interpolation algorithm; by movingthe mouse cursor around in the diagram the sample point islinked to its four nearest neighbors by drawing green lines,with line thickness used to indicate the weight of each neigh-bor.
6. Comparisons to other systems
Although the SLITHY system itself is just one of the contri-butions we hope to have made in this paper (the others be-ing, primarily, the principles underlying both the design ofany system for creating animated presentations and the de-sign of the animations themselves), it is nevertheless instruc-
tive to try to compare SLITHY, as a system, to other relatedcommercial and research systems. Although an exhaustivecomparison would take more space than we can reasonablyafford, we will at least look at a few of the most salient sys-tems, which we divide into two major classes: systems de-signed for creating presentations, and systems designed forcreating animation.
6.1. Presentation software
PowerPoint. PowerPoint makes designing static slides verysimple, through an intuitive WYSIWYG graphical interface.PowerPoint also features a palette of animation effects thatcan be applied to slide elements. However, it is extremelydifficult to create meaningful animation (the kinds of anima-tion we have termed “dynamics” in Section 4) using Pow-erPoint’s fixed library of effects. Even something as simpleas the animated pulley diagram of Figure 1 would be nextto impossible to create. For complex animations users mustresort to rendering a video file in some other application andplaying it from within PowerPoint. Moreover, PowerPointprovides templates for slide layout, but these templates arenot parameterized. The user must select a template for eachslide and fill in content manually; there’s no way to, for in-stance, say “take this template and create ten slides usingthese ten image files.”
In contrast to PowerPoint’s design as a word processor forslides, SLITHY has been built from the beginning with ani-mation in mind. In part to make it fully flexible, and in part toavoid the interface complexities of GUI animation systemssuch as Maya or Flash, we have chosen a scripting model,where authors write programs that describe their animations,rather than creating them directly through graphical interac-tion. Although certain operations like positioning elementson the screen are more difficult to do with our approach, wehave tried to reduce these difficulties with tools that allowusers to rapidly test and refine their code, and interactivelyquery canvas coordinates. We have also developed some pro-totype GUI-based tools that author SLITHY code for certainnarrowly defined domains (as described in Section 3.4).
CounterPoint. CounterPoint,8 is a presentation systemimplemented using the Jazz toolkit,1 which itself is a de-scendent of the Pad “zoomable sketchpad” system.17 Coun-terPoint allows PowerPoint slides to be interactively scaledand positioned in arbitrary locations on a large canvas, andpaths representing the order of the presentation to be drawnthrough the slides. Animated zooms and pans across thiscanvas are then used to transition from one slide to the next.The animation in CounterPoint is focused exclusively on us-ing animated navigation between slides to convey the struc-ture of the presentation. In our work, we want to support theanimation of content as well. SLITHY can be used to createboth kinds of animation.
c© The Eurographics Association 2003.
Zongker and Salesin / On Creating Animated Presentations
6.2. Creating animation
As we iteratively refined our own system, we were influ-enced by previous script-based animation systems goingback to ANIMA II9 and DIAL.7 We use a general-purposeprogramming language as in ASAS.19 Modeling and anima-tion are integrated in one language as in CHARLI.4 We willaddress a few of the most closely related systems in moredetail.
Menv. The Menv system18 is arguably one of the mostsuccessful efforts at using a script-based system for produc-ing animation. A descendant of the system is still in use to-day by Pixar for producing animated feature films. Modelsare created in Menv using a specialized language, with prim-itives for creating 3D geometry and performing commongraphics operations. Menv’s authors point out three majoradvantages that language-based modeling systems have overinteractive ones: replication, parameterization, and preci-sion. While both types of systems allow replicating a modelthrough instancing, a language-based system has the addi-tional power to allow calculation of how many times to repli-cate and how to transform the various instances. A procedu-ral specification of models also allows for complex param-eterization, so that multiple instances can vary in nontrivialways. The third advantage, precision, derives from the factthat the model’s subparts can be positioned through calcu-lation, eliminating the problems in alignment that can comefrom graphical placement, especially as the model is ani-mated. All of these issues are as relevant for the creation ofabstract 2D figures in SLITHY as they are for the creationof realistic 3D characters, yet this style of authoring is notcommonly seen in 2D tools.
Algorithm animation. One area in which animation sys-tems have been designed for presentation use is in animatingalgorithms. The Zeus system2 is typical in that it works bytaking an implementation of an algorithm and instrumentingit so that the events that happen in the course of executionare reflected in the graphical display. It is not clear how thisstyle of generating animation would be extended to thingsthat are not algorithms, though.
Alice. Like SLITHY, the Alice project of Conway et al.5
created a graphics programming environment based on thePython programming language. Alice, however, was specif-ically targeted at users with no graphics or programmingexperience. It had no modeling component; the animationswere created by applying various transforms to premade 3Dobjects. The emphasis was on creating interactive worldsrather than scripting stories. Alice animation scripts were at-tached to events such as mouse or keyboard inputs, or colli-sions between 3D models. Executing an Alice script imme-diately fed a set of commands for updating the world to acentral renderer. This allowed scripts to be activated in par-allel, allowing users to create a world full of objects withinteresting behaviors. This model makes it difficult to ac-cess an animation at arbitrary points in time: there was no
representation of the animation apart from the script itself,which had to be run from the beginning. In SLITHY, execut-ing an animation script results in an intermediate animationobject, which can be sampled and manipulated arbitrarily.This kind of flexibility is especially important during the au-thoring process.
Flash. One of the most widely used 2D animation systemstoday is Flash, from Macromedia. Flash was designed foruse on the web. It is a 2D, vector-based keyframe animationsystem.
The major limitation of Flash (and of a similar, competingproduct from Adobe called LiveMotion) is that there is noobvious way to create models with complex controls withoutdrawing the graphical elements using hand-written code, justas in SLITHY. The interactively-created drawing primitivesand graphical timeline allow only simple transformations tobe specified. Primitives can be grouped together, but onlysimple transformations such as applying affine transformsand modifying opacity can be applied to the group. Withoutthe ability to express nontrivial mappings from the abstractparameters of a group to the parameters of its members, itis impossible to encapsulate interesting behavior and exposethat to the animator as a high-level control. (While an ani-mation can be composed of many clips layered together, theonly controls offered by each clip are position on the screen,opacity, and which frame is being shown. A clip could beused as a model, but only if that model required just a sin-gle scalar parameter, which would be mapped onto the framenumber.)
Moreover, we believe there is an advantage in using ascript-based interface for expressing the kind of simple, fre-quently repeated animations used in presentations. UsingFlash’s scripting language to create intricate complex ani-mations is possible, but awkward. Flash’s built-in graphicaltimeline can only be edited interactively using the mouse.The scripting language can not be used to describe ani-mations using the timeline. To specify animation procedu-rally, one can write a callback function that is called onceper frame and updates parameters of the graphical elementsmanually based on the frame number. However, manuallypositioning primitive objects as a function of time is tire-some and error-prone. In contrast, SLITHY is built aroundthe concept of making parameterized models, just as in 3Dcharacter animation systems. This parameterization is ex-tended to every part of the system. Even animation scriptscan themselves be parameterized, letting users create not justanimations but animation-generators, making it easier to au-tomate complex or frequently repeated tasks.
7. Future work and conclusion
There is still a great deal to be done. Most importantly, wedon’t yet know how to make an animated presentation toolthat is both very general and easy to use. We believe the
c© The Eurographics Association 2003.
Zongker and Salesin / On Creating Animated Presentations
prototype tools described in Section 3.4 have promise, but itwill take a great deal of work and testing to determine if thisis really the way to make animation available to the masses.
Every day computers are being used to tell stories andpresent ideas in boardrooms and classrooms around theglobe. There is a great opportunity here for computer graph-ics to significantly improve this widely-used medium. Whenwe started working on this problem – trying to design aneasy-to-use system to support all kinds of arbitrary anima-tion – it was not at all obvious to us even what kinds of an-imation would work well for presentations, let alone how todesign a system to create them. We feel that the system andprinciples presented here, while by no means the final word,do at least provide some provocative and useful first steps to-ward allowing us to create and experience more informativeand exciting presentations.
References
1. Benjamin B. Bederson, Jon Meyer, and Lance Good.Jazz: An extensible zoomable user interface graph-ics toolkit in java. In Proceedings of User Interfaceand Software Technology (UIST 2000), pages 171–180,2000.
2. Marc H. Brown. Zeus: A system for algorithm ani-mation and multi-view editing. In IEEE Workshop onVisual Languages, pages 4–9, October 1991.
3. Lih-Juan ChanLin. Animation to teach students of dif-ferent knowledge levels. Journal of Instructional Psy-chology, 25:166–175, 1998.
4. Michael Chmilar and Brian Wyvill. A software ar-chitecture for integrated modeling and animation. InR. A. Earnshaw and B. Wyvill, editors, New Advancesin Computer Graphics: Proceedings of CG Interna-tional ’89, pages 257–276. Springer-Verlag, 1989.
5. Matthew Conway, Steve Audia, Tommy Burnette, Den-nis Cosgrove, and Kevin Christiansen. Alice: Lessonslearned from building a 3D system for novices. In Pro-ceedings of the CHI 2000 conference on Human factorsin computing systems, pages 486–493, 2000.
6. Andrew Dillon, Cliff McKnight, and John Richardson.Space — the final chapter, or, why physical represen-tations are not semantic intentions. In C. McKnight,A. Dillon, and J. Richardson, editors, Hypertext: A Psy-chological Perspective, chapter 8. Ellis Horwood, 1993.
7. S. Feiner, D. Salesin, and T. Banchoff. Dial: A diagra-matic animation language. IEEE Computer Graphics& Applications, 2:43–54, September 1982.
8. Lance Good and Benjamin B. Bederson. Zoomableuser interfaces as a medium for slide show presenta-tions. Information Visualization, 1(1):35–49, March2002.
9. Ronald J. Hackathorn. Anima II: a 3-D color animationsystem. In Computer Graphics (Proceedings of SIG-GRAPH 77), volume 11, pages 54–64, San Jose, Cali-fornia, July 1977.
10. John Lasseter. Principles of traditional animation ap-plied to 3D computer animation. In Computer Graph-ics (Proceedings of SIGGRAPH 87), volume 21, pages35–44, July 1987.
11. Richard E. Mayer and Richard B. Anderson. Anima-tions need narration: An experimental test of a dual-coding hypothesis. Journal of Educational Psychology,83(4):484–490, 1991.
12. Richard E. Mayer and Richard B. Anderson. Theinstructive animation: Helping students build connec-tions between words and pictures in multimedia learn-ing. Journal of Educational Psychology, 84(4):444–452, 1992.
13. Julie Bauer Morrison, Barbara Tversky, and MireilleBetrancourt. Animation: Does it facilitate learning? InSmart Graphics: Papers from the 2000 AAAI Sympo-sium, pages 53–60, 2000.
14. Tom Ngo, Doug Cutrell, Jenny Dana, Bruce Donald,Lorie Loeb, and Shunhui Zhu. Accessible animationand customizable graphics via simplicial configurationmodeling. In Proceedings of SIGGRAPH 2000, pages403–410, 2000.
15. O. Park and S. S. Gittelman. Selective use of animationand feedback in computer-based instruction. Educa-tional Technology Research & Development, 40(4):27–38, 1992.
16. Ian Parker. Absolute PowerPoint: Can a software pack-age edit our thoughts? The New Yorker, 2001.
17. Ken Perlin and David Fox. Pad: An alternative ap-proach to the computer interface. In Proceedings ofSIGGRAPH 93, 1993.
18. William T. Reeves, Eben F. Ostby, and Samuel J. Lef-fler. The Menv modelling and animation environ-ment. Journal of Visualization and Computer Anima-tion, 1(1):33–40, August 1990.
19. Craig W. Reynolds. Computer animation with scriptsand actors. In Proc. SIGGRAPH 82, pages 289–296,July 1982.
20. S. V. Thompson and R. J. Riding. The effect of ani-mated diagrams on the understanding of a mathemati-cal demonstration in 11- to 14-year-old pupils. BritishJournal of Educational Psychology, 60:93–98, 1990.
21. Barbara Tversky, Julie Bauer Morrison, and MireilleBetrancount. Animation: Can it facilitate? Interna-tional Journal of Human Computer Studies, 57(4):247–262, October 2002.
c© The Eurographics Association 2003.
Zongker and Salesin / On Creating Animated Presentations
(a) (b) (c) (d)Figure 7 In sequence (a) camera zooming is used to focus on one region, then a plot is constructed by animating pixels fromthe input image. In (b), animation is used to maintain continuity as a simple overview is expanded to show more information.Presentation (c) uses zooming in on parts of diagrams to reflect the hierarchical structure of the talk. Sequence (d) shows the useof smoothly animated zooming to join together the actions at multiple scales.
(a) (b)
(c)Figure 8 Part (a) shows three screenshots from an interactive application for generating animated slideshows. The resultingSLITHY animation appears in part (c). Part (b) shows a similar prototype utility for generating animated line chart sequences.
c© The Eurographics Association 2003.