on-farm composting of horse manure and its...
TRANSCRIPT

1
ON-FARM COMPOSTING OF HORSE MANURE AND ITS USE AS A FERTILIZER FOR COMMON FORAGES IN NORTH FLORIDA
By
SARAH COURTNEY DILLING
A DISSERTATION PRESENTED TO THE GRADUATE SCHOOL OF THE UNIVERSITY OF FLORIDA IN PARTIAL FULFILLMENT
OF THE REQUIREMENTS FOR THE DEGREE OF DOCTOR OF PHILOSOPHY
UNIVERSITY OF FLORIDA
2008

2
© 2008 Sarah Courtney Dilling

3
To my children, James and Alyson Dilling, and my husband, Brad, for their unconditional love and support. I could not have survived graduate school without them.

4
ACKNOWLEDGMENTS
I would like to begin by thanking Dr. Lori K. Warren, my supervisory committee chair and
an authentic advisor. Her guidance throughout the graduate program, beginning with the
experimental planning and continuing with data analysis and review of the dissertation, has been
greatly appreciated. Thanks also go to my other committee members, (S.H. TenBroeck, M.W.
Clark, G.E. Fitzpatrick, C.L. Mackowiak, and R.A. Nordstedt) for their willingness to serve on
my committee, their input during my program, and for reviewing my dissertation.
Financial support from the Florida Department of Agricultural and Consumer Services is
greatly appreciated and made the PhD program possible. Thanks are also expressed to Dr. G.E.
Dahl, department chair, Dr. J. Brendemuhl, assistant chair, and Joann Fischer, graduate
coordinator, for the opportunity to study in the Department of Animal Science.
Special thanks go to those who helped during the field and lab activities. That includes
fellow graduate students Kelly Vineyard, Jerome Vickers, Drew Cotton, Meg Brew, and
undergraduate students Analese Peters, Sarah White, and Sarah Simpson. Thanks go to the horse
teaching unit staff, Charles (Ruff) Stephens, Justin Callaham, and Joel McQuagge, for their
support and cooperation with the composting experiments. Also, thanks to the North Florida
Research and Education Center – Live Oak staff, Randi Randell, Lani Lei Davis, and Jerry
Butler, for their cooperation with the forage experiments. In the nutrition lab, thanks goes to Jan
Kivipelto and Nancy Wilkinson for their vast knowledge, support and assistance in analysis of
forage and compost.
I am especially thankful to my family for their great support, education, and friendship
they provided to me in building my strength and character. Last but not least, I am deeply
grateful for the love and support of my husband, Brad, who gave me unconditional love and the
strength and confidence to complete a doctorate program. Also, I would like to thank my two

5
children, James and Alyson, for shedding light and ultimate happiness during my graduate
program.

6
TABLE OF CONTENTS page
ACKNOWLEDGMENTS ...............................................................................................................4
LIST OF TABLES.........................................................................................................................10
LIST OF FIGURES .......................................................................................................................12
ABSTRACT...................................................................................................................................14
CHAPTER
1 INTRODUCTION ..................................................................................................................16
2 LITERATURE REVIEW .......................................................................................................19
Nutrient Management .............................................................................................................19 Regulation........................................................................................................................19 Surface and Groundwater Contamination .......................................................................20 Soil Accumulation of Nutrients.......................................................................................23 Air Pollution ....................................................................................................................24
Nutrient Management in the Pasture Ecosystem....................................................................24 Stocking Rate and Stocking Method ...............................................................................24 Florida Pasture Forages ...................................................................................................27 Fertilization of the Pasture Ecosystem ............................................................................29
Nitrogen....................................................................................................................30 Phosphorus ...............................................................................................................32 Potassium .................................................................................................................34
Horse Stall Materials as a Fertilizer Source ....................................................................35 Production of horse stall materials ...........................................................................35 Nutrient availability in manure ................................................................................36 Limitations of unprocessed manure as fertilizer ......................................................39
Compost..................................................................................................................................42 History of Composting ....................................................................................................43 Types of Composting ......................................................................................................45 The Aerobic Composting Process ...................................................................................49 Factors Affecting Aerobic Composting...........................................................................51
Aeration....................................................................................................................51 Moisture ...................................................................................................................52 Nutrients ...................................................................................................................52 Pile size and porosity of the material .......................................................................53
Maturity and Stability of Aerobic Compost ....................................................................53 Aerobic Composting as a Tool for Horse Manure Management ....................................54 Compost as a Fertilizer Source for Florida Forages........................................................56
Summary.................................................................................................................................58

7
3 ON-FARM COMPOSTING OF HORSE STALL MATERIALS: EFFECT OF CARBON TO NITROGEN RATIO AND BEDDING TYPE...............................................60
Introduction.............................................................................................................................60 Materials and Methods ...........................................................................................................62
Experimental Design .......................................................................................................62 Data Collection and Analysis ..........................................................................................63 Statistical Analyses..........................................................................................................65
Results.....................................................................................................................................66 Weather Conditions .........................................................................................................66 Composting Temperatures and Effect of Season ............................................................66 Material Mass and Organic Matter..................................................................................67 Nutrient Concentrations in Compost ...............................................................................67 Conductivity and Total Dissolved Solids ........................................................................68 Water Holding Capacity and Bulk Density .....................................................................68 Mass Balance Estimates for Nutrients.............................................................................68
Discussion...............................................................................................................................69 Conclusions.............................................................................................................................73
4 ON-FARM COMPOSTING OF HORSE STALL MATERIALS: EFFECT OF SLOW-RELEASE NITROGEN AMENDMENTS ............................................................................83
Introduction.............................................................................................................................83 Materials and Methods ...........................................................................................................85
Experimental Design .......................................................................................................85 Data Collection and Analyses .........................................................................................87 Statistical Analyses..........................................................................................................89
Results.....................................................................................................................................89 Weather Conditions .........................................................................................................89 Composting Temperatures and Effect of Season ............................................................89 Physical Properties and Chemical Composition of Compost..........................................90 Mass Balance Estimates for Nutrients.............................................................................91 Microbial Populations .....................................................................................................91
Discussion...............................................................................................................................92 Conclusion ..............................................................................................................................96
5 CHARACTERISTICS OF SOIL AND NEWLY ESTABLISHED BAHIAGRASS FORAGE IN RESPONSE TO SOIL INCORPORATION OF UNPROCESSED AND COMPOSTED HORSE STALL MATERIALS...................................................................102
Introduction...........................................................................................................................102 Materials and Methods .........................................................................................................105
Site Description .............................................................................................................105 Experimental Design .....................................................................................................105 Data Collection and Analysis ........................................................................................106 Statistical Analysis ........................................................................................................108
Results...................................................................................................................................109
8
Bioassay.........................................................................................................................109 Forage ............................................................................................................................109 Soil.................................................................................................................................110
Discussion.............................................................................................................................111 Conclusions...........................................................................................................................113
6 EVALUATION OF UNPROCESSED AND COMPOSTED HORSE MANURE ON SOIL CHEMICAL PROPERTIES AND YIELD OF ESTABLISHED NORTH FLORIDA PASTURE ..........................................................................................................118
Introduction...........................................................................................................................118 Materials and Methods .........................................................................................................119
Site Description .............................................................................................................119 Experimental Design .....................................................................................................119 Data Collection and Analysis ........................................................................................120 Statistical Analysis ........................................................................................................122
Results...................................................................................................................................123 Bioassay.........................................................................................................................123 Forage ............................................................................................................................123 Soil.................................................................................................................................125
Discussion.............................................................................................................................126 Conclusions...........................................................................................................................128
7 EFFECTS OF UNPROCESSED AND COMPOSTED HORSE STALL MATERIALS ON SOIL CHEMICAL PROPERTIES AND YIELD OF NORTH FLORIDA FORAGES ............................................................................................................................135
Introduction...........................................................................................................................135 Materials and Methods .........................................................................................................137
Site Descriptions............................................................................................................137 Experimental Design .....................................................................................................137
Experiment 1: Pensacola Bahiagrass......................................................................138 Experiment 2: Coastal Bermudagrass ....................................................................138 Experiment 3: Florigraze Rhizoma Perennial Peanut ............................................139
Data Collection and Analysis ........................................................................................139 Statistical Analysis ........................................................................................................141
Results...................................................................................................................................142 Weather Conditions .......................................................................................................142 Bioassay.........................................................................................................................142 Experiment 1: Pensacola Bahiagrass.............................................................................143 Experiment 2: Coastal Bermudagrass ...........................................................................146 Experiment 3: Florigraze Perennial Peanut ...................................................................149
Discussion.............................................................................................................................152 Conclusion ............................................................................................................................155
8 IMPLICATIONS ..................................................................................................................172

9
APPENDIX
A SUPPLEMENTAL DATA FOR COMPOSTING STUDY (CH 3).....................................174
B SUPPLEMENTAL DATA FOR COMPOSTING STUDY (CH 4).....................................181
C SUPPLEMENTAL DATA FOR LAND APPLICATION STUDY (CH 5) ........................189
D SUPPLEMENTAL DATA FOR LAND APPLICATION STUDIES (CH 7) .....................191
LIST OF REFERENCES.............................................................................................................194
BIOGRAPHICAL SKETCH .......................................................................................................213

10
LIST OF TABLES
Table page 3-1 Nitrogen, carbon, total phosphorus, soluble phosphorus, and potassium in horse stall
materials before (day 0) and after 84 days of composting.................................................80
3-2 Pore space, water holding capacity, bulk density, pH, conductivity, and total dissolved solids in horse stall materials before (day 0) and after 84 days of composting.........................................................................................................................81
3-3 Mass balance estimates of nutrients after 84 days of composting stall materials..............82
4-1 Total nitrogen, nitrate, ammonia, phosphorus and potassium in horse stall materials before (day 0) and after 120 days of composting.. ............................................................99
4-2 Mass balance estimates of nutrients after 120 days of composting stall materials..........100
5-1 Dry matter yield, total nitrogen and total phosphorus concentration in Argentine bahiagrass in response to fertilization with stall material and compost...........................116
5-2 Argentine bahiagrass plots soil chemical properties in response to fertilization with stall material and compost. ..............................................................................................117
6-1 Dry matter yield, mean nitrogen and phosphorus concentration, and nitrogen and phosphorus removed by mixed bahiagrass forage in response to fertilization with stall material and compost. ..............................................................................................133
6-2 Established pasture plots soil chemical properties in response to fertilization with stall material and compost. ..............................................................................................134
7-1 Pensacola bahiagrass forage dry matter yield and tissue nitrogen and phosphorus concentrations in response to fertilization with stall material and compost. ...................160
7-2 Pensacola bahiagrass plots soil chemical properties in response to fertilization with stall material and compost. ..............................................................................................161
7-3 Pensacola bahiagrass effect of sampling interval on soil chemical properties in response to fertilization with stall material and compost.................................................162
7-4 Pensacola bahiagrass effect of sampling depth on soil chemical properties in response to fertilization with stall material and compost.................................................163
7-5 Coastal bermudagrass forage dry matter yield and tissue nitrogen and phosphorus concentrations in response to fertilization with stall material and compost. ...................164
7-6 Coastal bermudagrass plots soil chemical properties in response to fertilization with stall material and compost. ..............................................................................................165
11
7-7 Coastal bermudagrass plots sampling interval on soil chemical properties in response to fertilization with stall material and compost................................................................166
7-8 Coastal bermudagrass plots effect of sampling depth on soil chemical properties in response to fertilization with stall material and compost.................................................167
7-9 Florigraze perennial peanut forage dry matter yield and tissue nitrogen and phosphorus concentrations in response to fertilization with stall material and compost. ...........................................................................................................................168
7-10 Florigraze perennial peanut soil chemical properties in response to fertilization with stall material and compost. ..............................................................................................169
7-11 Florigraze perennial peanut effect of sampling interval on soil chemical properties in response to fertilization with stall material and compost.................................................170
7-12 Florigraze perennial peanut effect of sampling depth on soil chemical properties in response to fertilization with stall material and compost.................................................171
A-1 Treatment schedule for composting of stall materials containing bermudagrass bedding or wood shavings bedding..................................................................................180
B-1 Treatment schedule for compost treated with urea nitrogen amendment or unamended. ......................................................................................................................187
B-2 Neutral detergent fiber, acid detergent fiber, lignin, total carbon, and organic matter in horse stall materials before (day 0) and after 120 day of composting.. .......................188
C-1 Argentine bahiagrass dry matter yield, tissue nitrogen and phosphorus, nitrogen and phosphorus removed in response to fertilization with stall material and compost. .........189
C-2 Argentine bahiagrass soil chemical properties in response to fertilization with stall material and compost. ......................................................................................................190
D-1 Pensacola bahiagrass soil chemical properties by day in response to fertilization with stall material and compost. ..............................................................................................191
D-2 Coastal bermudagrass soil chemical properites by day in response to fertilization with stall material and compost. ......................................................................................192
D-3 Florigraze perennial peanut soil chemical properties by day in response to fertilization with stall material and compost....................................................................193

12
LIST OF FIGURES
Figure page 2-1 Nitrogen cycle in soil.. .......................................................................................................31
2-2 Phosphorus cycle in soil.....................................................................................................33
2-3 Susceptibility of organic compounds found in compost feedstock to mineralization. ......38
2-4 Flow diagram of the anaerobic composting process..........................................................47
2-5 Flow diagram of the aerobic composting process..............................................................48
2-6 Phases of composting as related to temperature and time. ................................................50
3-1 Maximum temperature reached during the composting of horse stall materials containing bermudagrass hay bedding or wood shavings bedding....................................75
3-2 Number of cumulative thermal unit days while composting horse stall materials containing wood shavings bedding during 84 days. ..........................................................76
3-3 Effect of season on ambient temperature and mean compost temperature of pooled treatments containing wood shavings bedding during 84 days of composting.. ...............77
3-4 Reduction in dry matter mass after 84 days of composting in treatments containing bermudagrass hay bedding or wood shavings bedding......................................................78
3-5 Change in pH after 84 days of composting in treatments containing bermudagrass hay bedding or wood shavings bedding.............................................................................79
4-1 Number of cumulative thermal unit days while composting horse stall materials during 120 days..................................................................................................................97
4-2 Changes in microbial populations present in horse stall material during 120 d of composting.. .......................................................................................................................98
6-1 Dry matter yield (Mg ha-1) of mixed bahiagrass in response to fertilization with inorganic fertilizer (INORG), horse stall materials (STALL), N-amended stall materials (ACOMP), unamended composted stall materials (UCOMP), ACOMP + INORG (MIX) or no fertilization (UNFERT). a,b,cWithin each day, treatment means with different letters differ (P<0.05)................................................................................130
6-2 Established pasture nitrogen concentration in response to fertilization with horse stall material and compost. ......................................................................................................131
6-3 Established pasture phosphorus concentration in response to fertilization with horse stall material and compost ...............................................................................................132
13
7-1 Pensacola bahiagrass tissue nitrogen and phosphorus removed after fertilization with horse stall material and compost......................................................................................157
7-2 Coastal bermudagrass tissue nitrogen and phosphorus removed after fertilization with horse stall material and compost..............................................................................158
7-3 Florigraze perennial peanut tissue nitrogen and phosphorus removed after fertilization with horse stall material and compost. .........................................................159
A-1 WOOD-30 changes in mean temperature profile over time within each replication during 84 days of composting..........................................................................................174
A-2 WOOD-60 changes in mean temperature profile over time within each replication during 84 days of composting..........................................................................................175
A-4 WOOD-CON changes in mean temperature profile over time within each replication during 84 days of composting..........................................................................................176
A-5 HAY-CON changes in mean temperature profile over time within each replication during 84 days of composting..........................................................................................177
A-6 Changes in mean temperature profile over time within each pile of HAY-15 during 84 d composting trial. ......................................................................................................178
A-7 Wood treatments pH before (day 0) and after 84 days of composting. ...........................179
B-1 Control treatment changes in temperature profile over time within each replication during 120 days of composting........................................................................................181
B-2 Urea changes in temperature profile over time within each replication during 120 days of composting. .........................................................................................................182
B-3 Urea formaldehyde changes in temperature profile over time within each replication during 120 days of composting........................................................................................183
B-4 Polymer sulfur coated urea changes in temperature profile over time within each replication during 120 days of composting......................................................................184
B-1 Microbial profile of aerobic and anaerobic bacterial and pseudomonas for treatments during composting of horse stall material for 120 days...................................................185
B-2 Microbial profile of nitrogen-fixing, actinomycetes and fungi for treatments during composting of horse stall material for 120 days. .............................................................186
14
Abstract of Dissertation Presented to the Graduate School of the University of Florida in Partial Fulfillment of the Requirements for the Degree of Doctor of Philosophy
ON-FARM COMPOSTING OF HORSE MANURE AND ITS USE AS A FERTILIZER FOR COMMON FORAGES IN NORTH FLORIDA
By
Sarah Courtney Dilling
May 2008
Chair: Lori K. Warren Major: Animal Science
With decreasing land availability and increasing regulations for animal agriculture in the
United States, disposal and utilization of horse manure is becoming a major concern.
Composting may serve as a viable treatment option for horse manure prior to land application,
yet research on the composting of horse stall materials (HSM) and its value as a fertilizer is
limited. The objectives of this dissertation were: 1) to evaluate various rates and sources of
nitrogen (N) amendment and their effects on the ease of composting horse manure mixed with
hay or wood shavings bedding; and 2) to examine the performance of unprocessed and
composted HSM on forage production in north Florida. To study these effects, two composting
studies and five land application trials were conducted from 2005 to 2007.
Farm-scale composting was conducted using a multiple-bin system under roof cover. HSM
containing either wood shavings or hay bedding were amended with urea or slow-release
nitrogen sources to achieve specific carbon:nitrogen (C:N) ratios ranging from 15 to 60:1 and
composted for either 84 or 120 d. Composting reduced the total mass of HSM by 15-60%.
Composting HSM containing wood shavings bedding, but not hay, resulted in temperatures high
enough to destroy parasite eggs, pathogens, insect larvae and weed seeds. Manure mixed with

15
wood shavings showed a greater degree of decomposition and nutrient stability after composting
than HSM containing hay bedding. Slow-release N sources reduced the loss of N during
composting, but did not enhance the rate or extent of decomposition compared to urea. Slow-
release N sources did not sustain microbial populations for an extended time beyond that
observed for urea-treated or unamended HSM. HSM amended with N had higher concentrations
of soluble N in the form of NO3 and NH4. Soluble N can increase the value of compost as a
fertilizer by providing plant available forms of N; however, if applied in excess, the potential for
surface and groundwater pollution exists. More research is needed to determine an economically
feasible and timely method of promoting decomposition of bedding in HSM to form a higher
quality end product.
Investigations of land application of HSM were conducted during the growing season in
Gainesville, FL (2006) and Live Oak, FL (2007). Unprocessed (STALL) and composted
(COMP) HSM were either surface applied onto or incorporated into soil of Coastal
bermudagrass (Cynodon dactylon), Argentine bahiagrass (Paspalum notatum), Pensacola
bahiagrass or Florigraze perennial peanut (Arachis glabrata) forages. Application rates ranged
from 11,200 to 37,000 kg ha-1 STALL and 8,400 to 18,500 kg ha-1 COMP. Fertilization with
STALL or COMP improved yields for bahiagrass and bermudagrass compared to unfertilized
control. Yields of bahiagrass and perennial peanut were greater with STALL than COMP, but
yields were comparable between the fertilizer sources for bermudagrass. Across all forages, soil
ammonium-N (NH4) and nitrate-N (NO3) did not vary due to fertilization or fertilizer source and
did not increase soil residual NH4 or NO3 levels. Application of STALL or COMP had no
measurable effect on soil phosphorus. STALL provided a greater fertilizer response than COMP
during a single season, but effects of repeated application require further study.

16
CHAPTER 1 INTRODUCTION
With decreasing land availability for animal agriculture in the United States, disposal
and utilization of horse manure is becoming a major concern. In 2005 it was estimated that
500,000 horses reside in Florida generating a total economic impact of $5 billion (AHCF, 2005).
If it is estimated that half of the horses in Florida are stalled, producing 11 Megagrams (Mg) of
stall material (including feces and urine, bedding and uneaten feed), a total of 2.7 million Mg of
material can be generated every year. Common disposal methods for stall materials have
included stockpiling on unused land, dumping into ravines and sinkholes, hauling to landfills,
burning, and use as soil amendments for cropland (Ott et al., 2000). With increasing emphasis on
the control of environmental pollution, many of the above options are no longer available.
Further, as available space for disposal of municipal solid waste decreases, the ability to dispose
of manure in landfills may become restricted or strictly limited (Swinker et al., 1998).
Horse manure management is regulated by the federal government, similar to that of the
dairy and swine industries (USEPA, 2002). Soil concentrations of nitrogen (N) and phosphorus
(P) where horses are kept may be evaluated, and when in excess, the owner may be penalized
according to confined animal feeding operations (CAFO) and animal feeding operations (AFO)
regulations (USEPA, 2002). Since the practice of hauling agricultural manure to landfills may be
limited in the future, horse owners may have to manage horse’s manure on-site, and composting
could be a viable treatment option. Composting is the biological decomposition of organic matter
to a humus-like product under controlled, aerobic conditions (Epstein, 1997). The composting
process is a waste management method used primarily to stabilize organic wastes. The stabilized
end product can be used as an amendment for soil or potting mixes and is less likely to leach
nutrients to groundwater or be carried off with surface runoff (Fitzpatrick, 1998). Compost can
17
improve the physical, chemical and biological properties of a soil (Rynk et al., 1992). Physical
properties of soil improve mainly due to the high organic matter content of composts. Compost
enhances soil structure, thereby increasing porosity, water holding capacity, and water
infiltration. The chemical properties of soil are improved by providing cation exchange capacity
and acting as a source of micronutrients. Further, composts improve the biological properties of
soils by creating a diverse microbiological environment that can suppress plant diseases and
nematodes (Rynk et al., 1992).
Research on the composting of animal manures is extensive (Chiumenti et al., 2006;
Shiraishi et al., 2006; Tang et al., 2005; Tiquia and Tam, 2001), particularly in regard to cattle,
poultry and swine manures. All of these manures are nitrogen-rich and high in moisture content,
which provides optimal conditions for composting (Rynk et al., 1992). Investigations into the
composting of horse manure and stall materials are lacking. Although horse manure possesses
the optimal carbon:nitrogen ratio (C:N) of 30:1, it is often accompanied by large amounts of
carbon-rich bedding, thereby increasing the overall C:N to as high as 130:1 (Rynk et al., 1992).
Currently, land application of unprocessed horse manure is a common method of disposal
(Cotton, D. personal communication, 2008). At typical recommended stocking rates, 1 hectare of
pasture per mature horse weighing 500 kg (Chambliss et al., 2006b) is required for manure
nutrients to remain at levels similar to crop demand in FL (NRC, 1993). When this much land is
not available, nutrients are applied in excess, resulting in soil accumulation and increased risk of
leaching or runoff into surface and groundwater.
If properly managed or composted, use of manure for forage production can be an effective
way to address problems with manure disposal and its impacts on groundwater quality. Research
related to yield, animal performance, and nutritive value of Florida forages is abundant in the
18
literature (Beck, et al., 2007; Sollenberger et al., 1988; Stanley and Rhoads, 2000; Wright et al.,
2003); however, there is little information regarding the application of composted horse stall
materials on Florida pasture forages.
Composting and land application of horse stall material may be useful practices, yet little is
known about the most efficient means to produce compost and the performance of compost as a
fertilizer source. Objective 1: to evaluate various rates of nitrogen amendment to accelerate
composting of carbon-rich horse stall material (Chapter 3); Objective 2: to examine the effect of
bedding type on the composting of horse stall materials (Chapter 3); Objective 3: to evaluate
slow release nitrogen sources as amendments to enhance composting of horse stall materials
(Chapter 4); Objective 4: to evaluate composted horse stall materials as a fertilizer source for a
newly established bahiagrass pasture (Chapter 5); Objective 5: to evaluate composted horse stall
materials as a slow-release fertilizer source for established bahiagrass pastures (Chapters 6 and
7); Objective 6: to evaluate composted horse stall material as a supplemental fertilizer for
Florida forages under hay production (Chapter 7); Objective 7: to determine the effects of
composted horse stall material on soil physical and chemical characteristics (Chapters 5, 6 and
7). In order to accomplish these objectives, two 1-year on-farm composting experiments were
conducted from 2005 through 2007. Forage and soil data from five compost land application
studies were collected during 2006 and 2007 in north Florida.

19
CHAPTER 2 LITERATURE REVIEW
Nutrient Management
Regulation
In 2006, the United States Census Bureau reported that Florida’s human population
reached 18 million with a 6.5% increase from the previous year (USCB, 2006). It has been
projected that Florida’s population will reach 29 million by 2030 (USCB, 2006). This substantial
growth in population will ultimately impact water allocation, affordability in housing, law
enforcement/jails, and-the factor most pertinent to the agriculture industry - land availability.
Currently, agriculture encompasses half of Florida’s total 34.5 million acres. The majority (75%)
of Florida’s population lives within 15 miles of the coastline, but this prime real estate has
almost been exhausted and people are moving inland, causing rural encroachment conflicts. In
2005, the American Horse Council Foundation estimated that over 500,000 horses reside in
Florida (AHCF, 2005). While the numbers of horses have steadily increased, land availability for
animal agriculture has decreased, causing a range of environmental concerns from nutrient
management to nuisance complaints such as odors and flies.
Agriculture operations can potentially generate enormous amounts of manure which can be
recycled to crops or pasture. However, these operations are limited in acreage for extensive
manure distribution resulting in potential environmental threats to surface and groundwater
quality (Newton et al., 2003; Pant et al., 2004). The United States Environmental Protection
Agency (EPA) estimates that there are 370,000 Animal Feeding Operations (AFOs) in the U.S.,
and of this number, 12,700 have large numbers of animals and may be classified as Concentrated
Animal Feeding Operations (CAFOs) (USEPA, 2000). The EPA also reported that agricultural
operations, including AFOs, are a significant source of water pollution in the United States. The
20
latest National Water Quality Inventory (USEPA, 2000) reported that agriculture (including crop
production, pastures, rangeland, feedlots, animal holding areas, and other animal feeding
operations) is the leading contributor to water quality impairments in the nation’s rivers and
lakes, and the fifth leading contributor to water quality impairments in the nation’s estuaries.
These findings indicate that AFOs (as well as grazing and range animals) are a significant
environmental concern throughout the United States.
Environmental concerns related to agricultural waste can be divided into three categories,
concerns related to the soil (accumulation of nutrients), the water (eutrophication), and the air
(carbon dioxide and methane emissions and odors) (Jongbloed and Lenis, 1998). The federal
Clean Water Act (1977) mandates that states minimize non-point source pollution or pollution
associated with runoff and erosion, much of this originating from agricultural lands (USEPA,
1999). Recent strategies to reduce agricultural source pollution have been attempted though
implementation of Total Maximum Daily Load (TMDL) programs and Best Management
Practices. The state of Florida is developing nutrient budgeting strategies to minimize
environmental pollution and producing best management practice (BMP) manuals to educate and
inform the public of these strategies.
Surface and Groundwater Contamination
Water contamination problems associated with agriculture are becoming increasing
societal and political concerns. Nutrients such as nitrogen and phosphorus found in manure,
fertilizer and animal feeds pose a risk to surface and groundwater at relatively low levels
(Sharpley et al., 1994; Parry, 1998).
Until recently, nitrogen was the main nutrient source that was believed to cause surface
and groundwater contamination. Nitrogen is generally applied as a fertilizer in the largest
quantities since it is usually the limiting agent to growth and quality of plants. Nitrogen exists in
21
soil as nitrite (NO2), nitrate (NO3), or ammonium nitrogen (NH4), or in organic forms within the
soil organic matter fraction (e.g. protein, DNA). The most soluble ion of nitrogen is nitrate,
which is also the most common form of nitrogen in synthetic or commercial fertilizers
(Watschke et al., 2000). Nitrate ions are repelled by the clay particles in the soil and generally
are not adsorbed within the soil matrix. Hence, as water moves through the soil, nitrate nitrogen
generally moves freely with the water. Excess nitrogen in bodies of surface water from runoff
(agricultural and storm water), acid rain, or resurfacing leached nitrogen causes algae
populations to grow rapidly or to “bloom” (Lapointe and Bedford, 2007). The decomposition of
the algae consumes dissolved oxygen in the water. Dissolved oxygen in water is a major factor
affecting the survival and productivity of aquatic animal in surface water, and decreased
dissolved oxygen reduces the population of fish, clams, crabs, oysters, and other animal life. An
algae bloom and subsequent decrease in dissolved oxygen is known as eutrophication (Lapointe
and Bedford, 2007).
A major concern in the state of Florida with regard to nitrogen contamination is
groundwater pollution. In the early 1990s, the EPA found nitrate contamination in many Florida
drinking water wells. Some urban and rural wells exceeded the nitrate maximum contaminant
level (MCL), suggesting that agricultural and fertilizer application practices might be
contributing to increased nitrate levels in the groundwater (Parsons and Boman, 2006). Nitrate
contamination of groundwater can also occur from septic tanks or over-fertilization of lawns
(Hubbard and Sheridan, 1994). The Florida Department of Agriculture and Consumer Services
(FDACS) carried out a more detailed drinking water well analysis throughout the state. Out of
the 3,949 drinking water wells sampled, 2,483 (63%) had detectable nitrate levels and 584 (15%)
had nitrate levels above the MCL, which is 10 mg/L. (Parsons and Boman, 2006). When people,

22
particularly young people, drink water with high nitrogen contamination, a medical condition
known as methemoglobinemia, can result, where nitrite replaces oxygen in hemoglobin. With
increased levels of methemoglobin, oxygen levels in the blood decrease, resulting in cyanosis or
oxygen starvation (Hubbard et al., 2004). Most cases of methemoglobinemia occur after
consuming water with high concentrations of nitrate-nitrogen. Infants are particularly
susceptible, as are people who receive kidney dialysis treatment (Follett and Follett, 2001). Other
effects associated with elevated concentrations of nitrate-nitrogen in drinking water include
respiratory infection, alteration of thyroid metabolism, and cancers induced by conversion of
nitrate-nitrogen to nitrogen-nitroso compounds in the body (Follett and Follett, 2001).
Phosphorus can be transported from fields or pastures into lakes or streams either as a
component of erosion or within runoff water. Phosphorus that is dissolved in runoff water has a
greater effect on water quality (due to availability) than phosphorus that is attached to soil
particles and transported to water bodies by erosion (Sharpley et al., 1996). Phosphorus is
responsible for algal blooms in surface waters (Bush and Austin, 2001) and can cause
eutrophication at levels as low as 0.01 to 0.035 mg/L (Mallin and Wheeler, 2000). In addition,
the type of phosphorus used in fertilizer can influence the potential risk of water contamination.
Highly soluble fertilizers, such as superphosphate, present a greater short-term potential for
phosphorus loss since they are easily dissolved and transported. In the long term, however, less-
soluble phosphorus, such as dicalcium phosphate, may pose a greater risk. This is because less
soluble fertilizer remains on the soil surface and accumulates due to slow rates of mineralization.
While considerable work has been conducted on the movement of phosphorus from soil to
surface water by runoff and erosion, vertical movement of phosphorus has received little
attention. Until recently, pollution of groundwater by fertilizer phosphorus was considered
23
insignificant (Hesketh and Brookes, 2000); yet studies have shown in sandy soils, phosphorus
will leach through the soil profile (Johnson et al., 2004; Sims et al., 1998; Whalen and Chang,
2001). Leaching of phosphorus has also been reported in poorly drained soils high in organic
matter (Sharpley et al., 1994) and regions with a long-term history of organic manure
applications (Breeuwsma et al., 1995).
Soil Accumulation of Nutrients
Nitrogen saturation of soil may be defined as the availability of ammonium and nitrate in
excess of total combined plant and microbial nutritional demand. By this definition, nitrogen
saturation can be determined simply by increased leaching of nitrate or ammonium below the
rooting zone (Skeffington and Wilson, 1988).
Current fertilizer application guidelines for Florida forages are based on nitrogen
requirements (Mylavarapu et al., 2007). Most animal manure has a lower nitrogen to phosphorus
ratio than that needed by crops. Thus, manure applications based on crop nitrogen requirements
tend to provide phosphorus in excess of crop phosphorus requirements (Intensive Livestock
Operations Committee, 1995). With time, this over-application of phosphorus can result in
accumulation in soils. Only a small portion of the total phosphorus in animal manures is readily
available to plants. The majority of phosphorus is in the organic or non-labile form, which is
strongly held to mineral particles or is combined in mineral compounds of low solubility, mainly
iron and aluminum phosphates in acid or weathered soils and calcium phosphates in calcareous
soils (Mallarino and Schepers, 2005). Stable phosphorus is considered unavailable to plants in
the short term, although it becomes available over time due to mineralization. The long-term
effect of phosphorus surplus will be gradual saturation of the soil P-sorption capacity (Hooda et
al., 2001). Intensive poultry and swine operations in the U.S. have been identified as causing
24
excessive phosphorus accumulation in area soils, which consequently increased potential for
phosphorus loss in runoff (Sims, 1993).
Air Pollution
Nuisance odors can have detrimental effects on property aesthetics and values, and the
quality of life in communities subjected to them (Schiffman et al., 1995). In the last decade, a
number of countries have reported an increase in odor-related complaints due to agricultural and
food processing industries (Both, 2001; Mahin, 2001). As a result, these industries have been
forced to control odor emissions, as well as toxic air pollutants.
Globally, methane emissions from livestock manure represents 5 to 6% of total methane
emissions (Hogan et al., 1991), and nitrogen gas represents 7% of total nitrogen gas emissions
(Khalil and Rasmussen, 1992). Nitrogen can damage the environment in the form of ammonia
and nitrous oxide (N2O). Ammonia has direct toxic effects on vegetation and vertebrates, when
returned to soil and water by rainfall, disrupts ecosystems and leads to eutrophication (Lapointe
and Bedford, 2007). This presents a quandary: volatilization of nitrogen from nitrogen-rich
manure is attractive to help balance manure nutrient application with crop needs, but the process
also can result in acid rain. Dramatic increases in the air concentration of ammonia in areas of
intensive agriculture have been reported, and European studies indicate that animal agriculture
accounts for 15 to 75% of total ammonia volatilization (Hartung and Phillips, 1994).
Nutrient Management in the Pasture Ecosystem
Stocking Rate and Stocking Method
Pasture management involves a series of decisions by the farmer, and the ultimate goals
are to obtain the most profitable result, maintain pasture persistence, and adherence to
environmental regulations. Choice of pasture use grazing or hay, pasture forage, animal class,
stocking rate, stocking method, and fertilization are important factors to consider for
25
management of pastures (Sollenberger et al., 2002). The following section discusses a subset of
these management decisions and how they are related to nutrient cycling in a pasture ecosystem.
Stocking rate is the number of livestock that can be effectively grazed on a defined area of
land. The rate will vary greatly depending on the type of livestock, the fertility of the land, and
the climatic conditions. The stocking rate of horses in Florida has traditionally been reported as
two acres of productive pasture per horse (or 1 horse per hectare) (Chambliss et al., 2006b), yet
this estimate is unsupported scientifically. The acreage per horse will vary with pasture species
and productivity, horse class, amount of grain and other supplements fed, and grazing
management.
To determine the pasture’s carrying capacity based on forage production, pasture intake
must be estimated. It has been suggested that a horse will consume or damage 3% of body
weight on a dry matter basis per day while on pasture (Warren, 2006). For an average horse with
a body weight of 500 kg, this amount would be 15 kg DM/day (Warren, 2006). Common pasture
forages in Florida include Pensacola bahiagrass (Paspalum notatum) and Coastal bermudagrass
(Cynodon dactylon) which produce an average of 5,600 and 9,000 DM kg/hectare, respectively,
during an average north Florida growing season (Twidwell et al., 1998; Chambliss et al., 2006a).
Based on this level of forage production and 3% of body weight as consumption, a hectare of
bahiagrass will support two horses and a hectare of bermudagrass will support four horses during
the growing season. This calculation is in agreement with Chambliss et al. (2006b) who
suggested the stocking rate of one horse per hectare for Florida bahiagrass pastures with low
productivity and two horses per hectare for more productive bahiagrass pasture.
Although most stocking rate recommendations are currently based on forage productivity,
stocking rates may be based on soil nutrient levels and future budgets. This strategy is referred to
26
as nutrient budgeting, which focuses on recycling manure to land as fertilizer and only replacing
nutrients when a loss occurs. Factors that determine the environmental balance of nutrients
requires knowledge of all inputs and exports within the system, such as nutrients excreted, rate of
forage litter decomposition, potential nutrient removal from plants, and acceptable losses of
nutrients via volatilization, leaching, runoff, and/or erosion. Although, current fertilizer
application guidelines for Florida forages are based on nitrogen requirements (Mylavarapu et al.,
2007). The balance between nitrogen and phosphorus can become skewed when using manure as
a fertilizer source. Most manures are phosphorus-rich relative to nitrogen, largely because of
relatively large losses of volatilized ammonia, denitrification losses in soil under wet, anaerobic
conditions, and the ability of many crops to luxury-consume much more nitrogen than
phosphorus (Van Horn et al., 1996). Most soils bind phosphorus effectively, yet in some areas of
Florida, saturation levels are being reached, and phosphorus budgets are required. In such cases,
fertilizer recommendations are then based on phosphorus requirements instead of nitrogen. The
stocking rate changes significantly when based on phosphorus levels in soil. For example, on a
north Florida Pensacola bahiagrass pasture with soil tests indicating already high levels of non-
labile phosphorus present, the stocking rate becomes one horse per two hectares (Chambliss et
al., 2006b).
When stocking rate recommendations are impractical, the stocking method becomes an
important pasture management tool, along with soil testing, fertilization, and mowing. Stocking
method, also referred to as grazing method, is a defined technique of grazing management to
achieve specific production (FGTC, 1991). Stocking methods can be separated into two main
categories: rotational and continuous stocking. In continuous stocking, horses graze the same
pasture for the entire growing season or year. In rotational stocking, the pasture is divided into

27
paddocks that are rotationally grazed in sequential order. The purpose of rotational stocking is to
allow a period for forage regrowth without animal interference; giving the forage time to
reestablish the carbohydrate levels and leaf area needed for the plant to reach the steeper part of
the growth curve, thereby resulting in faster growth (Chambliss et al., 2006a). Reasons cited for
use of rotational stocking over continuous stocking include superior plant persistence (Holechek,
1988) and increased animal production (Blaser, 1986). In addition to affecting the forage-
livestock system, stocking method also impacts nutrient cycling. In particular, stocking method
may affect nutrient cycling in the pasture through its impact on uniformity of manure
distribution. Peterson and Gerrish (1996) suggested that short grazing periods and high stocking
rates promote a more uniform manure distribution on the pasture than do other grazing methods.
Yet when pastures are managed through mowing and harrowing, which are common practices on
horse operations, manure can be mechanically distributed.
Florida Pasture Forages
The state of Florida currently has over one million hectares of improved pastures, with
bahiagrass occupying over 75% of this land base (Adjei and Rechcigl, 2002). Bermudagrass and
rhizoma (perennial) peanut are also common forage species in Florida, mostly under hay
production.
Bahiagrass is a warm-season perennial which can be grown throughout Florida and in the
Coastal Plain and Gulf Coast regions of the southern United States. Bahiagrass is mostly used for
grazing with some hay, sod and seed harvested from pastures (Chambliss and Adjei, 2006).
Bahiagrass is well adapted to the sandy soils of Florida, tolerates low soil fertility, low pH, and
intermittent flooded conditions and survives well during drought conditions (Chambliss and
Adjei, 2006). In north Florida, more than 85% of the total bahiagrass annual production occurs
from April through September, and shows little growth at temperatures below 15°C (Mislevy
28
and Everett, 1981; Mislevy, 1985). The root system of bahiagrass, once fully established, can
recover up to 70% of applied nitrogen and absorb significant amounts of phosphorus and
potassium from the topsoil and subsoil, as well as recycled nutrients from manure under grazing
conditions (Rechcigl et al., 1992).
Bermudagrass is a sod-forming, warm-season perennial which can be grown in the uplands
of North Florida and much of the southern United States, and is well suited for either grazing or
hay production. Bermudagrass is best grown in fertile or fertilized sand and clay soils, and
tolerates moist conditions but not poorly drained soils and low soil pH (Staples, 2003). In north
Florida, the majority of the total annual bermudagrass production occurs from May through
October. There are many varieties of bermudagrass grown in Florida including: Coastal,
Suwannee, Coastcross-1, Callie, Alicia, Tifton 44, Tifton 78, Tifton 85, and Florakirk
(Chambliss et al., 2006). Bermudagrass responds well to nitrogen fertilization. Prine and Burton
(1956) reported that yield and protein increased proportional to nitrogen fertilization.
Rhizoma (perennial) peanut is a warm-season perennial legume that is grown extensively
throughout Florida and in the south Gulf Coast states of the United States, and is almost
exclusively used for hay production. Perennial peanut also has potential uses as pasture, creep
grazing, silage, ornamental plantings, conservation cover, and living mulch (French et al., 2006).
High yields of excellent quality forage can be produced from March through October in Florida
when perennial peanut is grown in sandy soils that are moderate to well-drained (Andrae and
Heusner, 2003). Perennial peanut is the only warm-season legume that effectively tolerates
Florida’s climate and soil conditions, with approximately 10,500 hectares planted in 2005
(French et al., 2006). Once established, perennial peanut develops a deep and extensive system
of rhizomes and roots, which enable the plant to extract moisture and nutrients from a large

29
volume of soil. Since perennial peanut is a legume, it does not require nitrogen fertilization, but
has been reported to respond to nitrogen through higher yield and protein (Valentim et al., 1988).
Perennial peanut does require phosphorus and potassium for growth. Potassium fertilization at 75
and 150 kg ha-yr-1 resulted in positive yield responses, but forage production was not increased
by phosphorus fertilization (Mooso et al., 1995).
Fertilization of the Pasture Ecosystem
Fertilization is an important management tool that strongly influences nutrient cycling in
pastures. Fertilization increases the amount of nutrients cycling within the soil-plant-animal
system, acting as a catalyst in the main recycling process, particularly in low soil fertility
environments. Fertilization increases the total plant biomass produced, and accelerates plant
residue decomposition, thereby increasing the availability of nutrients in those residues (Warman
and Termeer, 2005; Cadisch et al., 1994; Gijsman et al., 1997). Fisher et al. (1997) recommended
fertilizer be applied to pastures once every two years at half the rates used for establishment.
These applications would only replace the loss of nutrients that would occur through net nutrient
removal by grazing animals and replacement by excretion. A completely balanced system may
continue to have increases in soil nutrients from mineralization due to prior land application of
manure.
When fertilizing forages for hay production, the fertilizer requirements are significantly
higher because plant biomass is frequently being removed. Generally this type of ecosystem is
only receiving nutrients from fertilizer; therefore, current recommendations are based solely on
the nitrogen requirements of forage species (Mylavarapu et al., 2007). Yearly soil testing will aid
in the determination of efficient liming and fertilization cycles which, in turn, are necessary for
maintaining productive pastures for grazing. Fertilizer should be custom mixed based on pasture
soil analysis and should be reevaluated every application year.

30
Nitrogen
Nitrogen is the most important fertilizer component for plant yield and quality and, as
such, carries the greatest potential risk to the environment (Mengel et al., 2006). Nitrogen is an
integral component of many essential plant compounds. Plants use nitrogen to form amino acids,
and chlorophyll. A good supply of nitrogen stimulates root growth and development, as well as
the uptake of other nutrients (Brady and Weil, 2002). The quantity of nitrogen to be applied to
crops depends on several factors including: soil organic matter, grass species, desired yield,
geographical location, and form of nitrogen. Previous research with warm-season grasses has
shown nitrogen fertilization to increase forage dry matter yield and nitrogen (or protein)
concentration (Prine at Burton, 1956; Harvey et al., 1996; Caraballo et at., 1997; Johnson et al.,
2001). Although plants will take up either ammonium or nitrate forms of nitrogen, soil chemical
and biological processes generally make nitrate the most prevalent form of nitrogen in the soil;
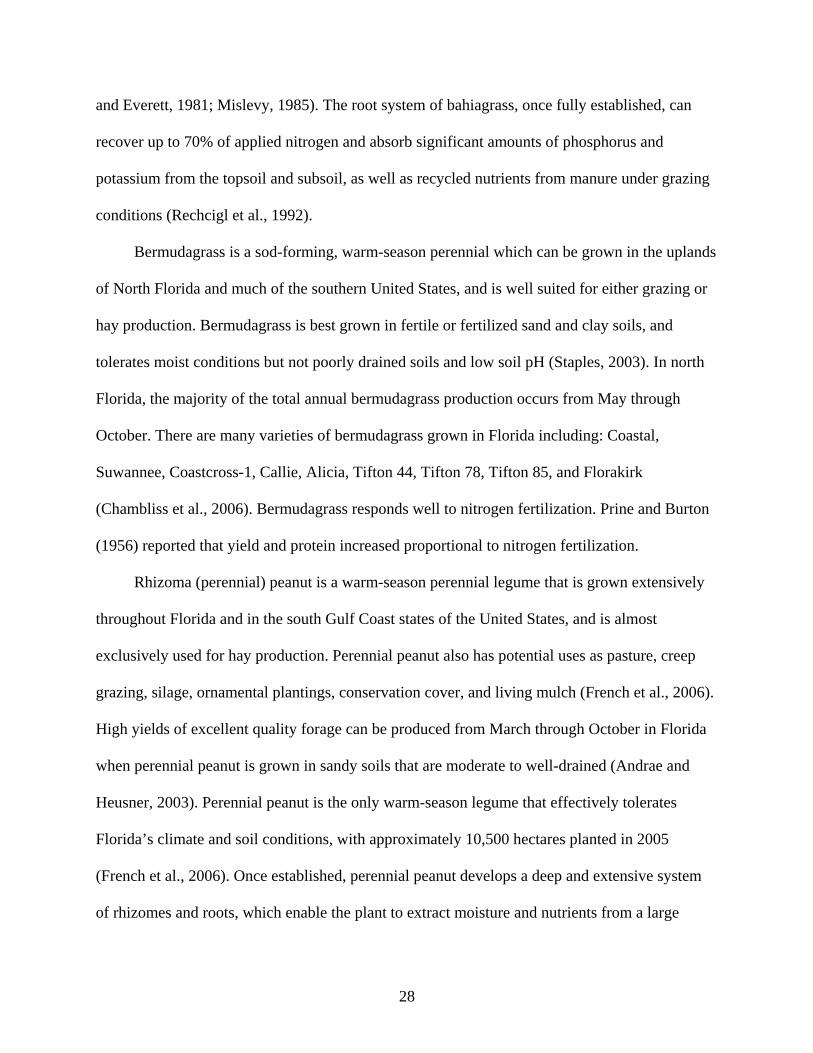
thus, the majority of nitrogen taken up is usually in the form of nitrate (Figure 2-1).
Recommendations for nitrogen fertilization are not based on soil tests, rather recommendations
are based solely on nitrogen requirements of the forage species (Mylavarapu et al., 2007).
31
Figure 2-1. Flow diagram of the nitrogen cycle in soil. This figure demonstrates the transformations of nitrogen as ammonia nitrogen (NH3), organic nitrogen (R-NH2), ammonium nitrogen (NH4), nitrate nitrogen (NO3) and nitrogen gas (N2O) within soil and atmosphere.
Manure FertilizerCrop Residue
NH4 NO3 R-NH2
Leaching
N2
Fixation (by legum
e forages)
Mineralization Nitrification
Immobilization
NH3
N2O
Den
itrifi
catio
n V
olat
iliza
tion
Runoff and Erosion
Plan
t Upt
ake
Plan
t Upt
ake
NH3

32
Phosphorus
Phosphorus is an essential element for many plant processes such as photosynthesis,
nitrogen fixation, flowering, seed production, and maturation. Root growth, particularly
development of lateral roots and fibrous rootlets, is also encouraged by phosphorus (Brady and
Weil, 2002). The use of fertilizers to apply phosphorus is a common practice. Plants will take up
water soluble phosphorus (e.g. monocalcium phosphate and dicalcium phosphate) through the
process of diffusion at the plant roots (Figure 2-2). Recommendations for phosphorus fertilizer
vary with crop species, yield goals, and soil type. If soil phosphorus is below the optimal level,
the amount of phosphate fertilizer recommended will permit a gradual buildup of the available
phosphorus supply. If soil phosphorus is high, the amount of phosphate recommended will be
less than the amount of phosphorus removed in the harvested portion of the crop, allowing some
decrease in the soil test (Mengel, 1997). It has been reported that bahiagrass does not respond to
additional phosphorus fertilization when growing on soil already high in phosphorus (McCaleb
et al., 1966). Some Florida soils are naturally high in phosphorus and soil tests may deem them
high or very high; therefore phosphorus fertilization may be unnecessary. Phosphate is mined in
the state of Florida, which began in the late 1800s. Currently there are two active mining areas in
Florida known as the northern and southern phosphate districts, where about 2000 hectares are
mined each year (Brown, 2005).

33
Figure 2-2. Flow diagram of the phosphorus cycle in soil
Manure FertilizerCrop Residue
Runoff
Absorbed P (inorganic)
Available P Plant and microbial P ( i )
Leaching Mineral P (unavailable)
Adsorption
Desorption Immobilization
Mineralization Pr
ecip
itatio
n
Weathering
Cro
p
Upt
ake
34
Potassium
Of all the essential elements, potassium is the third most likely, after nitrogen and
phosphorus, to limit plant productivity. Potassium promotes root growth, plant maturity, disease
resistance and cold hardiness (Sartain, 2007). Plants take up very large amounts of potassium, often
five to ten times as much as for phosphorus and about the same amount as for nitrogen (Brady and
Weil, 2002). In addition, plants will increase potassium uptake as fertilizer application increases
(Simonsson et al., 2007). For this reason, potassium is commonly applied to soils as fertilizer and
is a component of most mixed fertilizers.
The environmental fate of potassium has received less attention than that of nitrogen or
phosphorus, mainly because it is not currently classified as a pollutant. The biogeochemistry of
the potassium cycle in pastures is simpler and faster than the nitrogen and phosphorus cycles,
mainly because potassium is not part of any organic compound and the chemistry of potassium
in tropical soils is almost solely based on cation exchange reactions and mineral weathering,
rather than by microbiological processes. Soil is the main reservoir of potassium in tropical
pasture ecosystems and has been found to be very mobile and prone to leaching (Martin and
Sparks, 1985). The forms of potassium in soil, in order of their availability for leaching, are
solution, exchangeable, non-exchangeable and mineral (Martin and Sparks, 1985; Sparks and
Huang, 1985).
Unlike nitrogen and phosphorus, potassium causes no off-site environmental problems
when it leaves the soil system. It has not been found to be toxic and does not cause
eutrophication in aquatic systems. As a result, the EPA does not currently consider potassium as
a pollutant in surface and groundwater (USEPA, 1999). In Florida, potassium is considered
somewhat mobile, thus it does not build up in the soil. As a result, the amount of potassium

35
recommended as fertilizer is based on what the crop potassium requirements are for the growing
season (Sartain, 2007).
Horse Stall Materials as a Fertilizer Source
The potential value of manure as a fertilizer source depends on the method and rate of
application, cropping system, amount of manure available, manure composition, amount of land
available for application, quantity of available soil nutrients and the fraction of manure nutrients
that could become available to plants after mineralization (Newton et al., 2003; Eghball et al.,
1997). Management of livestock manure applied to soil is more complex than traditional
inorganic fertilizer because the nutrient concentration of manure is extremely variable and not all
nutrients are available immediately for plant uptake.
Production of horse stall materials
There are an estimated 9.2 million horses residing in the United States, and of that, over
500,000 horses reside in the state of Florida (AHCF, 2005). The average horse produces 14 kg of
feces and 7 to 11 liters of urine per day (ASAE, 2005). Confinement of horses to stalls is a
common husbandry practice. Bedding is often added on the stall floor to absorb urine and feces,
as well as provide comfort to the horse. Much of the soiled bedding is removed along with
manure when stalls are cleaned, resulting in approximately 20-25 kg manure (feces and urine)
and 9 to 11 kg of bedding per day, along with smaller amounts of uneaten feed. Bedding
materials make up a large portion of the volume of materials removed from horse stalls and may
include straw, wood shavings, sawdust, grass hay, peanut hulls, shredded paper and other locally
available products. The most popular bedding in Florida is pinewood shavings (Cotton et al.,
2006). Wood shavings are characterized by their high organic matter content, bulky nature, high
absorption ability, and low nitrogen content (Ott et al., 2000). In this dissertation, stall material is
defined as feces, urine, bedding material, and uneaten feed. The typical stalled horse can
36
produce 10,000 to 13,000 kg of stall material per year (Swinker et al., 1998). Dependant on diet,
the average ton of horse manure will contain 8.6 kg of total nitrogen (N), 6.4 kg of available
phosphoric acid (P2O5) and 16.3 kg of potash (K2O) (ASAE, 2005). Therefore, per year the
average horse will produce 77.5 kg of N, 57.1 kg P2O5 and 147 kg K2O from manure. In the
horse, magnesium and micronutrient metals (Fe, Cu, Mn and Zn) are excreted primarily in the
feces, while calcium, potassium and to a lesser extent sodium are excreted primarily in the urine.
Nitrogen, phosphorus and sulfur are excreted both in feces and urine (Mathews et al., 1996;
Hainze et al., 2004), with the relative proportion dependent on amounts in diet.
Nutrient availability in manure
Animals utilize only a portion of the nutrients ingested in their diet. The other source of
nutrients in manure comes from nutrient recycling within the animal (i.e., endogenous losses).
For a non-mature, non-growing, non-lactating, non-pregnant animal, endogenous losses resulting
from tissue turnover can be significant; thus, unutilized nutrients in manure are potentially
available to plants upon land application (Haynes and Williams, 1993). When nutrients, such as
nitrogen, phosphorus and potassium, are excreted in feces or urine, they are either in the organic
or inorganic form. Generally, the inorganic water-soluble forms are more readily available to
plants during the growing season compared to the less soluble organic fraction (Hainze et al.,
2004). Yet, inorganic nutrients generally have a greater potential to pollute surface and
groundwater, due to their enhanced mobility through the soil profile.
When nutrients are excreted in organic forms, microorganisms within the soil must
mineralize the nutrient into an inorganic form before it becomes available for plant uptake.
Mineralization rates of nutrients in soil depend on several soil factors including microorganisms
present, temperature, pH, oxygen concentration, soil type, C:N ratio, and the specific type of
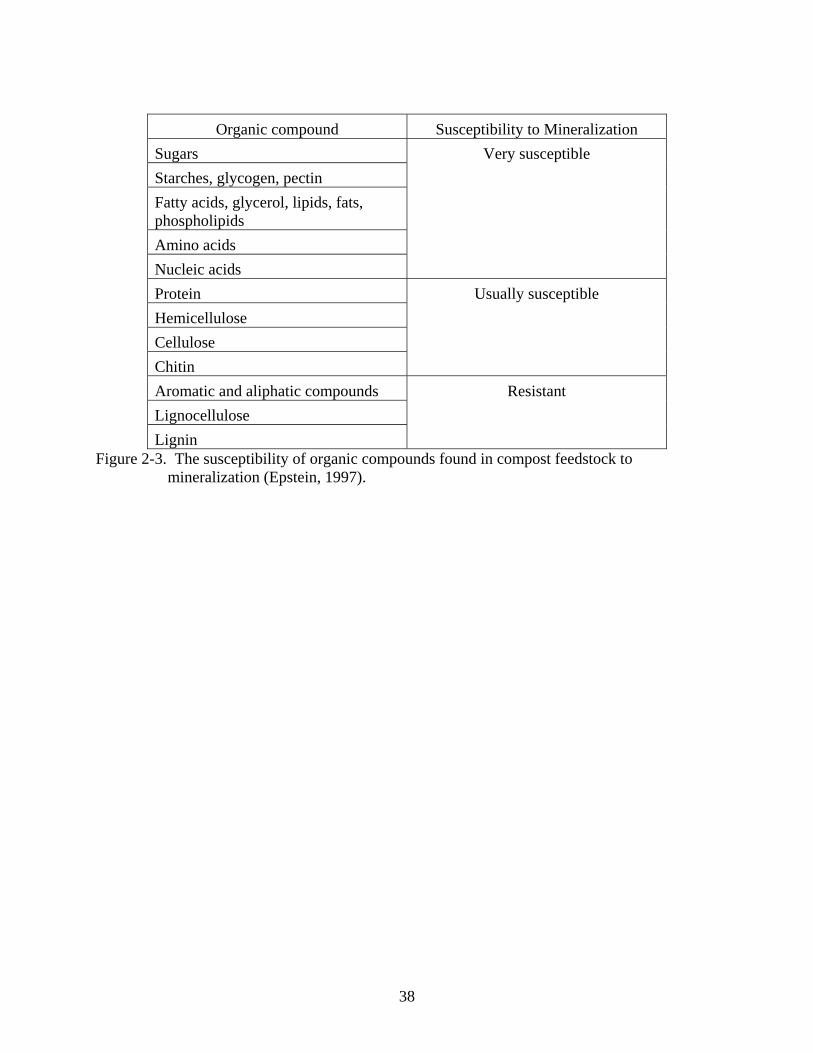
organic matter present (Eghball, 2000). Figure 2-3 demonstrates the susceptibility of organic

37
compounds to mineralization, with sugars mineralizing very rapidly and lignin being the most
resistant to mineralization. The availability of nitrogen in horse manure has been reported as
50% of the total manure nitrogen applied in the first year, which is similar to that for dairy
manure, but less than swine manure (90%) and poultry manure (75%) (Kidder, 2002; Eghball et
al., 2001). While feces contain nitrogen predominantly in the organic form, 60 to 70% of cow
urine nitrogen and 70 to 80% of sheep urine nitrogen is in the form of urea (Bellows, 2001). Urea
in urine is soluble and therefore immediately available for plant uptake. The availability of
phosphorus for plant uptake is slightly higher than nitrogen in most animal manure. Sharpley and
Moyer (2000) reported that dairy cattle manure contains up to 90% available phosphorus because
inorganic phosphorus constitutes 60 to 90% of total phosphorus in manure. By comparison,
Hainze et al., (2004) reported that manure from yearling horses contained only 30-39% available
phosphorus in manure, with the remaining phosphorus in organic forms that must be mineralized
before becoming available for plant uptake. Excreted potassium in urine is in the soluble form
and has been reported as 100% plant available for all animal species (Eghball et al., 2001). This
finding demonstrated that manure potassium can be used similar to inorganic fertilizer potassium
by plants.
Since most nutrients are mineralized slowly from manure, forage plants in the vicinity of
manure piles will grow slowly for about two months following manure deposition (Haynes and
Williams, 1993; Lory and Roberts, 2000). However, as mineralization of nutrients occurs,
greater pasture regrowth and forage production occurs in the vicinity of manure and urine
compared to other pasture areas without fertilization (Cid and Brizuela, 1998).
38
Organic compound Susceptibility to Mineralization
Sugars Starches, glycogen, pectin Fatty acids, glycerol, lipids, fats, phospholipids Amino acids Nucleic acids
Very susceptible
Protein Hemicellulose Cellulose Chitin
Usually susceptible
Aromatic and aliphatic compounds Lignocellulose Lignin
Resistant
Figure 2-3. The susceptibility of organic compounds found in compost feedstock to mineralization (Epstein, 1997).

39
Limitations of unprocessed manure as fertilizer
Recycling nutrients present in horse stall material by using as a fertilizer source may be a
useful and practical tool for manure management. Yet, there are certain limitations when using
unprocessed manure as a fertilizer source that should be considered, such as land and seasonal
constraints, potential for the spreading of weed seeds and intestinal parasites, fly and odor
production, suppression of forage growth and the potential for contamination of surface and
groundwater.
Nutrients, such as nitrogen and phosphorus, in horse manure can negatively affect water
quality when the number of grazing horses per land area exceeds the nitrogen fertility needs of
the forages (Hubbard et al., 2004). In Florida, where agricultural land is decreasing while the
horse population is steadily increasing, available land for application of manure (from grazing
animals or land application of stall bedding) at agronomic rates is a major constraint. It has been
stated that in Florida, horse stocking rates can range from 1-2 hectares required per horse to meet
forage needs without additional accumulation of nutrients. Commonly, stocking rates are not
taken under consideration when horses are stalled, because animals are not on pasture; yet,
disposal of stall material is still necessary and is commonly land applied to forage crops.
When stall materials are applied to land as a means of disposal and to provide fertilizer for
pastures, certain inherent limitations exist, mostly due to the bedding. The most common
bedding material used on Florida horse operations is pine wood shavings (Cotton et al., 2006),
which contain mostly carbon and very little nitrogen and phosphorus. Soil microorganisms
require an optimal C:N ratio of 25-30:1 to perform biological processes, such as mineralization
and nitrification (James, 2003). By itself, horse manure has an optimal C:N ratio of 30:1, yet
when manure is accompanied by bedding, that ratio may increase to as high as 130:1 (Cotton et
al., 2006). When the C:N ratio is above 30:1, soil microorganisms will not release inorganic

40
nitrogen for plant uptake during decomposition. Instead, microorganisms supplement their
nitrogen requirements from the soil’s inorganic nitrogen pool, thereby reducing the availability
of that pool to plants by the act of immobilization. It has been reported that when horse manure
and wood shavings are applied to pastures, it can induce nitrogen deficiency as a result of a C:N
imbalance and growth of forage crops will be stunted (James, 2003). This deficiency is the result
of soil microorganisms being more effective than plants at competing for nitrogen (Hodge et al.,
2000).
When pasture forage growth is stunted, the opportunity for weed seed germination and
growth increases. Weed seeds can be transported in hay, harvested grass seed, sod, and mowing
equipment, or dispersed by wind, water, manure and wildlife (Sellers et al., 2006). Major et al.
(2005) reported that poultry manure application on tropical pastures increased weed germination
and composition when compared to inorganic fertilizer and compost. Horses kept on pasture will
naturally distribute weed seeds in common feeding and high traffic areas, yet when stall material
is land applied, weed seeds are distributed evenly across the pasture, potentially resulting in
widespread germination.
In addition to the widespread distribution of weed seeds, the potential for spreading
intestinal parasites arises when horse stall material is land applied. There are more than 150 types
of internal parasites that are known to infect horses. From a practical standpoint, the most
important ones are strongyles, ascarids, tapeworms and bots. Each species of parasite has a
specific life cycle, yet they all have a stage capable of living in the environment or soil (Nielsen
et al., 2007). Since all of the parasites pass out in the feces, controlling the manure is a very
important step toward controlling the parasites in the horse and soil. Lyons et al. (1999) advised
not to land apply fresh horse manure on pastures utilized by horses in order to reduce the rate of
41
infestation of parasites. If land application of fresh manure is necessary, options for reducing the
parasite infestation exist. For example, rotation of pastures for a time period of several months
will disrupt parasite life cycles and reduce or kill parasites. Alternating ruminants and horses on
pastures can be beneficial because each animal eats larval parasites of the other host category,
resulting in death of the ingested larvae. Pasture management strategies such as mowing and
chain harrowing can also help expose larvae to dry air and sunlight (Lyons et al., 1999). Sunlight
may kill or reduce parasite populations during Florida’s summer months, but during winter
months, it has been reported that the free-living stages of various species of gastro-intestinal
parasites can survive on pasture (Drudge et al., 1958). Removal of manure from pastures has
been another method of parasite control (Lyons et al., 1999). Finally, burying of manure by dung
beetles can be beneficial in the destruction of environmental stages of parasites (Waller and
Faedo, 1996).
In Florida, where suburbanization of formerly rural areas is occurring, a rise in nuisance
insect complaints is significant (Hogsette, 1993). Depending on the condition of the manure and
the existing insect population, a pest outbreak resulting from land application of manure may be
an important liability. House flies are an important pest of the horse industry and are frequently
the cause of nuisance complaints. Once a nuisance pest outbreak enters the popular press, it
effectively creates a negative investment climate for agriculture and the community. Horse
manure may contain a large number of fly larvae and pupae and adult flies will emerge from the
manure when land applied (Watson et al., 1998). It has been reported that spreading a thin layer
of poultry manure on agricultural fields encourages drying and reduces fly population (Calibeo-
Hayes et al., 2005). However, because of the ball-like structure of horse manure, the manure is
difficult to spread thin enough for adequate drying before adult flies can lay eggs.
42
The primary environmental concern with regard to using horse manure as fertilizer for
pastures is the potential for surface and groundwater contamination. The presence of relatively
mobile forms of nitrogen and phosphorus, as well organic matter, microbes, and other materials
near the soil surface following horse manure application can potentially decrease the quality of
storm water runoff. This is particularly evident during the first post-application runoff event.
Studies such as those by Westerman et al. (1983), McLeod and Hegg (1984), and Edwards and
Daniel (1993) indicate that runoff from grassed areas treated with animal manures can contain
elevated concentrations of nutrients, solids, and organic matter relative to untreated areas. When
nutrients, such as nitrogen and phosphorus, exceed the loading rate for a body of water,
eutrophication can occur. The plant available forms of these nutrients appear to be of most
concern because of their potential for direct uptake by aquatic vegetation and algae (Bushee et
al., 1998). Management options such as the employment of vegetation buffer strips and
incorporation of manure into soil, as well as application timing have been advocated for reducing
pollution potential from pastures treated with manure (Young et al., 1980).
Several management strategies have been discussed to counteract some of the limitations
of using horse manure as fertilizer amendment for pastures. One management tool that has
gained a renewed interest in the horse industry is composting. Treating manure through
composting could provide a means of reducing the environmental impact of horse manure by
reducing the total volume of materials, destroying parasites and weed seeds, and reducing runoff
risk by stabilizing nutrients into organic forms. Furthermore, composting may enhance the value
of stall materials, making it more attractive to end-users compared to unprocessed horse manure.
Compost
The subject of composting can be subdivided into two major areas: the composting process
and the compost product. For the purposes of this dissertation, the process of composting has

43
been defined as is the biological decomposition of organic matter under controlled aerobic
conditions (Epstein, 1997). The U.S. Composting Council (2000) has defined compost as, “the
product resulting from the controlled biological decomposition of organic matter that has been
sanitized through the generation of heat and stabilized to the point that it is beneficial to plant
growth. Compost is an organic matter resource that has the unique ability to improve the
chemical, physical, and biological characteristics of soils or growing media, and it contains plant
nutrients but is typically not characterized as a fertilizer.”
History of Composting
The first recorded use of compost, in the practice of placing manure on crops for the
benefits of its high nitrogen content, was recorded in the Mesopotamian Valley on cuneiform
tablets from the Akkadian Empire (Martin and Gershuny, 1992). The Tribes of Israel, the Greeks
and the Romans all used composting practices (Fitzpatrick et al., 2005). Typically organic
materials were piled and allowed to decompose for long periods of time producing compost. In
America’s early history, Native Americans were known to use compost on their crops, as were
the early European settlers. Many New England farmers made compost as a recipe of ten parts
livestock manure to one part fish, periodically turning their compost heaps until the fish
disintegrated (Arner et al., 1995). American historical figures such as George Washington,
Thomas Jefferson and James Madison were all known to be proponents of composting, boasting
its importance for soil fertility (Arner et al., 1995). Work done in 1840 by a well-known German
scientist, Justus von Liebig, proved that plants obtained nourishment from certain chemicals in
solution. Liebig dismissed the significance of compost, because it was insoluble in water (van
der Ploeg et al., 1999). Following this discovery, agricultural practices became increasingly
focused on inorganic fertilizers. For farmers in many areas of the world, inorganic fertilizers
replaced compost (Fitzpatrick et al., 2005). Sir Albert Howard, a British government agronomist

44
in the Colonial service, went to India in 1905 and spent almost 30 years experimenting with
organic gardening and farming. He found that the best compost consisted of three times as much
plant matter as manure, with materials initially layered in a sandwich fashion, and then turned
during decomposition (known as the Indore method and later as the Bangalore) (Howard, 1935).
In 1943, Sir Albert Howard published the book, An Agriculture Testament, based on his work.
The book renewed interest in organic methods of agriculture and earned him recognition as the
modern day father of organic farming and gardening. J. I. Rodale popularized Sir Albert’s work
and introduced American gardeners to the value of composting for improving soil quality
(Martin and Gershuny, 1992). He established a farming research center in Pennsylvania and the
monthly Organic Gardening magazine. In the United States, very little research was conducted
on composting in the 1950’s and the only major experiments were conducted at the Richmond
Station of the University of California under the leadership of Harold Gottas and Clarence
Goulke (Epstein, 1997). In the 1960’s the United States Public Health Service began two major
research and demonstration projects on the composting of municipal solid waste with biosolids.
One location was in Gainesville, Florida, and the other in Johnson City, Tennessee (Breidenbach,
1971). Prior to the 1970s, there were very few commercial scale composting facilities, mainly
due to very low tipping fees at landfills which caused negative competition with composting
facilities (Breidenbach, 1971). In 1972, the Clean Water Act encouraged composting of sewage
sludge by establishing minimum treatment requirements for municipal wastewater and providing
significant economic incentives (USEPA, 1999). A major boost to composting in the United
States occurred following the formation of the Composting Council in 1990, which supported
numerous composting research projects. As a result of the United States Environmental
Protection Agency construction grants program emphasizing composting of biosolids, major
45
European firms entered the American market in the in 1980s. The growth of biosolid composting
facilities in the United States significantly increased and this trend continues today (Epstein,
1997). In the 1990s many states started banning yard wastes from landfills, brought on by the
lack of landfill space near urban areas. As a result, the number of yard waste composting
facilities has increased exponentially in the United States (Epstein, 1997).
Today’s trend for composting involves municipal, agriculture and private use. Composting
is a highly effective way of stabilizing and reducing pathogens in biosolids, while diverting these
resources from landfills, producing a high-quality soil amendment (Rynk et al., 1992). The EPA
estimated the potential demand for compost to be over one billion cubic yards per year. The
report describes nine markets for compost: agriculture, silviculture, sod production, residential
retail, nurseries, delivered topsoil, landscaping, landfill cover, and surface mine reclamation
(USEPA, 1998). In practice, compost is more commonly used by nurseries, landscapers, and soil
blenders rather than for agricultural purposes. Nevertheless, in its analysis, the EPA (1998)
concluded that the demand for compost in agriculture and silviculture alone could exceed current
and potential supplies.
Types of Composting
Composting may be carried out under anaerobic or aerobic conditions. In anaerobic
composting, decomposition occurs where oxygen is absent or in limited supply. Using this
method, anaerobic microorganisms dominate and develop gaseous compounds including
methane, organic acids, hydrogen sulfide and other substances (Figure 2-4). In the absence of
oxygen, these gases accumulate and are not metabolized further. Many of these gases have
strong odors and some present phytotoxicity. Anaerobic composting occurs at relatively low
temperatures and as a result, it leaves weed seeds and pathogens intact (Mata-Alvarez, et al.,
2000). Anaerobic composting has recently gained a renewed interest in the agriculture industry.

46
The gases produced by the anaerobic bacteria are commonly referred to as biogas and can be
collected and used either as a direct energy source or converted to electricity. At the same time,
nutrients contained in the organic matter are conserved and mineralized to more soluble forms
(such as ammonium), thereby increasing the fertilizer value of the material for crops. Manure
represents a substantial bioenergy resource if processed by anaerobic digestion. When
considering biogas production from manure, the volatile solids content of the material is as
important as the total solids content since it represents the fraction of the solid material that may
be transformed into biogas.
Aerobic composting takes place in the presence of oxygen. During this process, aerobic
microorganisms break down organic matter and produce carbon dioxide, ammonia, water, heat
and compost-a relatively stable organic end product (Haug, 1993) (Figure 2-5). The heat
generated during aerobic decomposition accelerates the breakdown of proteins, fats and complex
carbohydrates such as cellulose and hemi-cellulose. Moreover, this process destroys many
microorganisms regarded as human and plant pathogens, as well as weed seeds, provided it
undergoes sufficiently high temperatures (Shiralipour and McConnell, 1991). Although more
nutrients are lost from the materials by aerobic composting, it is considered more efficient and
useful than anaerobic composting for agricultural production. The remainder of this dissertation,
including all experimental chapters, will focus on aerobic composting, which is a more feasible
method of composting on horse operations.
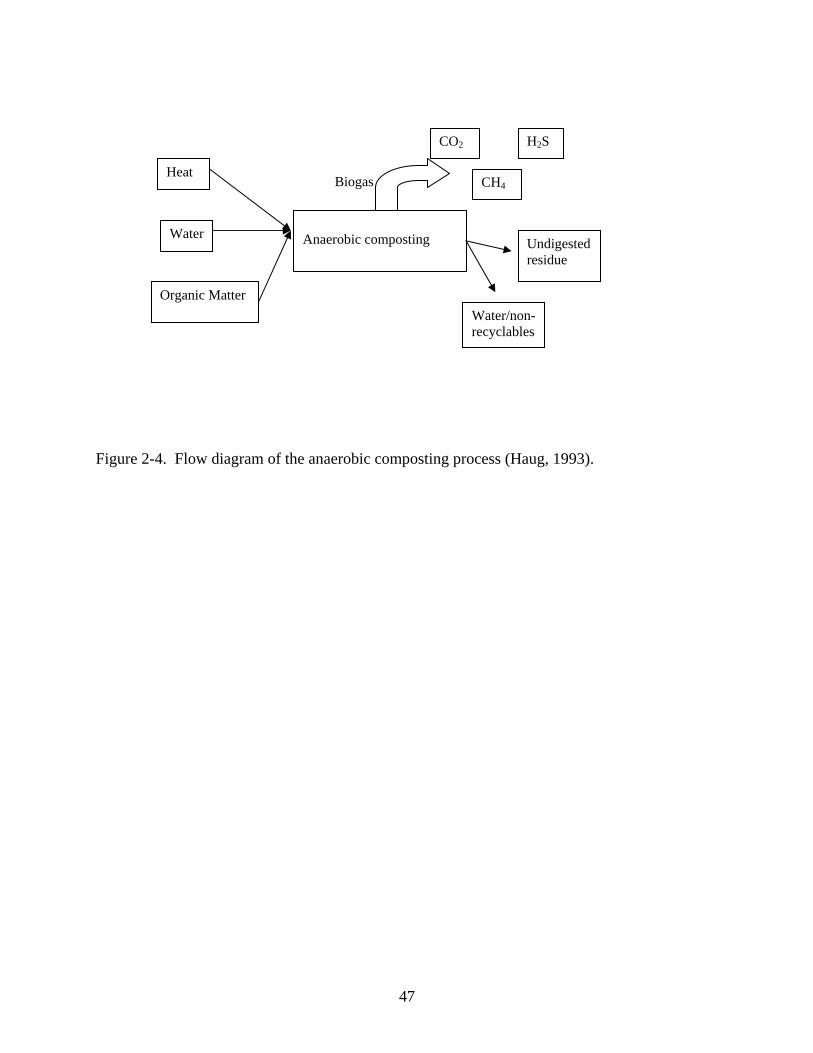
47
Figure 2-4. Flow diagram of the anaerobic composting process (Haug, 1993).
Anaerobic composting
Heat
Water
Organic Matter
CO2 H2S
CH4
Undigested residue
Water/non-recyclables
Biogas

48
Figure 2-5. Flow diagram of the aerobic composting process (Haug, 1993).
Microorganisms
Organic matter Carbohydrates Sugars Proteins Fats Hemicellulose Cellulose Lignin Mineral matter
Oxygen
Water
CO2
H2O
NH3 volitization
Compost
Heat

49
The Aerobic Composting Process
The aerobic composting process starts with the formation of a pile sufficient enough to
hold heat. Temperatures will rise rapidly to 70-80°C within the first couple of days (Poincelot,
1975). During this temperature phase, mesophilic organisms multiply rapidly and break down the
soluble and readily degradable compounds such as sugars and amino acids (Haug, 1993). These
microorganisms generate heat via their own metabolism and raise the temperature to a point
where their own activities are suppressed. Thermophilic fungi and several thermophilic bacteria
continue the process, raising the pile temperature to 65°C or higher (Haug, 1993). This high
temperature phase accelerates the breakdown of proteins, fats, and complex carbohydrates like
cellulose and hemicellulose from plant cells. Most of the plant/animal pathogens, weed seeds and
nematodes are destroyed during this high temperature phase (Shiralipour and McConnell, 1991).
After most of the degradation has occurred, the temperature decreases, mesophilic
microorganisms reemerge and the curing phase begins. The start of this phase is identified when
aeration no longer results in reheating of the pile. Eventually, the temperature declines to
ambient temperature and the pile becomes more uniform and less biologically active, although
mesophilic organisms recolonize the compost (Poincelot, 1975) (Figure 2-6). The material
becomes dark brown to black in color and particle size is reduced to resemble a soil-like texture.
In the process, the amount of humus increases, the ratio of carbon to nitrogen decreases, pH
neutralizes, and the cation exchange capacity of the material increases (Bernal et al., 1998).
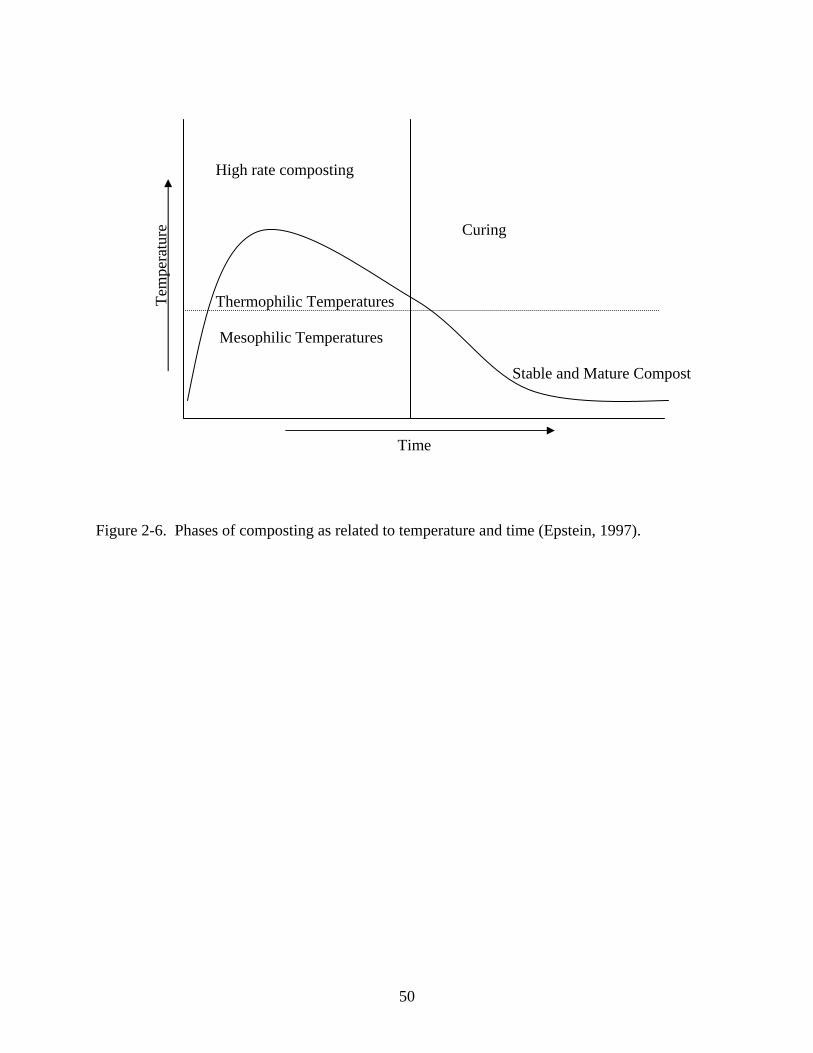
50
Figure 2-6. Phases of composting as related to temperature and time (Epstein, 1997).
High rate composting
Curing
Thermophilic Temperatures
Mesophilic Temperatures
Time
Tem
pera
ture
Stable and Mature Compost
51
Factors Affecting Aerobic Composting
The major factors affecting the decomposition of organic matter by microorganisms are
oxygen and moisture (Rynk et al., 1992). Temperature is an important factor; however, it is the
result of microbial activity. Other important factors that could limit the composting process are
nutrient availability and pH. Nutrients, especially carbon and nitrogen, play an important role in
the process as they are essential for microbial growth and activity (Epstein, 1997). Carbon is the
principal source of energy and nitrogen is needed for microbial proliferation. These factors will
be discussed in more detail below.
Aeration
Aerobic composting requires an oxygen concentration of at least 5% throughout the entire
pile. Aeration provides a key source of oxygen and is indispensable for aerobic decomposition.
Where the supply of oxygen is not sufficient, the growth of aerobic microorganisms is limited,
resulting in slower decomposition due to anaerobic bacteria proliferation (Epstein, 1997). Proper
pile aeration also removes excessive heat, water vapor and other gases trapped in the pile. Heat
removal is particularly important in warm climates as the risk of overheating and fire is higher.
There are four principal aeration methods used to provide oxygen during composting:
active aeration, passive aeration, mechanical aeration and natural aeration. Active aeration
generally involves turning of the material with a bucket loader or special turning equipment
(Larney et al., 2000). Turning schedules are typically based on pile temperature and oxygen
concentrations. Passive aeration involves natural air convection generally through the use of
pipes aligned vertically or horizontally within the pile, which pull in oxygen while ventilating
gases generated from within the pile (Sylla et al., 2003). Mechanical or forced aeration requires
the use of blowers to generate air supply through the pile (Solano et al., 2001). Natural aeration

52
occurs simply by diffusion and convection, which is governed by the exposed surfaces and their
respective properties (Barrington et al., 2003).
Moisture
Adequate moisture is essential for microbial activity. During composting a moisture
content of 40-65% should be maintained (Rynk et al., 1992). If the pile is too dry, composting
occurs more slowly. In contrast, if moisture content is above 65%, anaerobic conditions develop,
which will also hinder decomposition. In practice, it is advisable to start the pile with moisture
content of 50-60% and finish at about 30% moisture (Rynk et al., 1992).
Nutrients
Microorganisms require carbon, nitrogen, phosphorus and potassium as the primary
nutrients. During composting, carbon and nitrogen are the most important nutrients affecting the
process and the product. The optimal carbon:nitrogen ratio (C:N) of raw materials is between
25:1 to 30:1. At C:N ratios exceeding 50:1, the composting process slows due to depletion of
available nitrogen, resulting in reduced cellular growth (Bishop and Godfrey, 1983). A C:N ratio
of less than 20:1 leads to underutilization of nitrogen and the excess may be lost to the
atmosphere as ammonia or nitrous oxide, thereby generating problematic odors. When
evaluating the carbon content of the material to be composted, it is important to consider the
availability of carbon to the microorganisms, and not just the total carbon content (Epstein, 1997;
Figure 2-3). If a carbon source is unavailable to microorganisms, decomposition of materials will
decrease. For example, if material has high a lignin content, which is highly resistant to
microbial degradation, and starting C:N ratio is not adjusted, decomposition will be hindered
(Richard, 1996). Cappaert et al. (1975) found that the addition of mineral nitrogen fertilizer to
hardwood bark, which is high in lignin, increased the rate of decomposition.
53
pH
Although the natural buffering effect of the composting process lends itself to accepting
material with a wide range of pH, the pH level should not exceed 8.0 (Jeris and Regan, 1973). At
higher pH, more ammonia gas is generated and may be lost to the atmosphere via volatilization.
Pile size and porosity of the material
The size of the pile is of great significance to composting. If the pile is too large,
anaerobic zones occur near its center, which slows the process in these zones. On the other hand,
piles that are too small lose heat quickly and may not achieve a temperature high enough to
evaporate moisture and kill pathogens and weed seeds (Rynk et al., 1992). The optimal size of
the pile depends on parameters such as the physical properties of the materials (e.g., porosity)
and the method used to form the pile. While more porous materials allow bigger piles, heavy
weights should not be put on top and materials should be kept as loose as possible. Climate must
also be factored in when considering effective pile size for composting. With a view to
minimizing heat loss, larger piles are suitable for cold weather. However, in a warmer climate,
the same piles may overheat and, in some extreme cases, catch fire (Riggle, 1996).
Maturity and Stability of Aerobic Compost
For compost to be safely used as a growing media, the principal requirement is its degree
of stability or maturity, which implies stable organic matter content and the absence of
phytotoxic compounds and plant or animal pathogens (Bernal et al., 1998). Maturity and stability
are two terms that are sometimes used interchangeably when referring to composts, yet they have
slightly different meanings. Maturity is associated with plant growth potential or phytotoxicity
(Iannotti et al., 1993), whereas stability is often related to the compost’s microbial activity
(Eggen and Vethe, 2001). Immature composts may have high C:N ratios, high soluble salt
concentrations, high concentrations of organic acids and other phytotoxic compounds, high
54
microbial activity, and high respiration rates (Jimenez and Garcia, 1989). Land application of
immature compost can cause detrimental affects to plants and forage crops. The negative effects
of immature compost have been researched thoroughly and reported to cause biological blockage
of soil-available nitrogen by microbial populations (Scarsbrook et al., 1969; Duggan, 1973). This
may give rise to serious nitrogen deficiencies in the plant, and consequently nitrogen starvation
and growth-depression of crops (Bengtson and Cornette, 1973). The abundance of chemical and
biological changes that occur during composting, and the range of methods suggested in the
literature, has made it difficult to agree on methods for the practical assessment of maturity
(Itavaara et al., 2002; Wang et al., 2004). Various parameters that have been used include C:N
ratio of the finished product, water soluble carbon, cation exchange capacity, humus content, and
respirometry (Garcia et al., 1992; Scaglia et al., 2000; Huang et al., 2001; Wu and Ma, 2002).
Germination index, which is a measure of phytotoxicity, has been considered as a reliable, but
indirect, quantification of compost maturity (Cunha Queda et al., 1996). Rigid control of
compost maturity and product uniformity may lead to wider use of compost in the nursery
industry. Commercial compost companies currently must monitor and manage their compost to
consistently produce a uniform product that can be successfully used for plants and crops (Klock
and Fitzpatrick, 1999).
Aerobic Composting as a Tool for Horse Manure Management
There are a reported 9.2 million horses residing in the United States (AHCF, 2005). While
the numbers of horses have steadily increased, land availability for animal agriculture has
decreased, causing disposal or utilization of horse manure and soiled stall bedding to become a
major concern. Horse owners have typically disposed of stall materials (manure plus bedding) by
piling them on unused land, hauling them to landfills, burning them, or using them as soil
amendments for pasture or cropland (NAHMS, 1998). With increasing emphasis on the control
55
of environmental pollution, many of the above options are limited or no longer available.
Another widespread management strategy is stockpiling, where horse manure is piled to await
disposal, hauling or spreading onto pastures (Sweeten, 1996). In an equine manure management
survey conducted by the University of Florida, (Cotton, D. personal communication, 2008).
reported that approximately 80% of producers included stockpiling in their manure management
practices. A poorly managed manure pile can harbor intestinal parasites, provide a breeding
ground for flies and produce offensive odors (Warren and Sweet, 2003). Runoff from improperly
stored manure can quickly become a potential environment contaminate as it carries soluble
nutrients, pathogens and organic particles into the water cycle via surface runoff or by leaching
into groundwater (Warren and Sweet, 2003). Land application of fresh manure can also generate
large amounts of ammonia, carbon dioxide, methane, and nitrous oxide, which potentially could
be damaging to the environment (Yamulki, 2006).
Treating stall materials through composting could provide a means of reducing the
environmental impact of horse manure by reducing the total volume of materials that need to be
disposed of (Larney et al., 2000), destroying parasites and weed seeds (Romano et al., 2006;
Larney et al., 2003; Larney and Blackshaw, 2003) decreasing odor production, compared to
stockpiled manure (Li et al., 2007), producing a storable end product for on and off farm use, and
lowering nonpoint source pollution from horse farms (Michel et al., 2004). The stabilized end
product can be used as a rich amendment for soil applications, such as agricultural cropland,
landscape industry, or in nursery potting mixes (Lynch, 2004). The costs of the composting
process can be offset by the value-added nature of compost (Michel et al., 2004). For example,
compost enhances soil fertility, increases crop yields (Dick and McCoy, 1993) and reduces

56
diseases caused by soilborne plant pathogens (Hoitink and Fahy, 1986; Hoitink and Boehm,
1999).
There are some limitations to composting horse stall materials when compared to beef or
poultry litter. One of the biggest obstacles in successfully composting horse stall materials is the
high carbon content of bedding. By itself, horse manure is already near the ideal C:N of 25-30:1
needed to support microbial decomposition of organic materials. In contrast, the C:N of common
beddings used in stalls ranges from 30:1 for straw or hay to 950:1 for wood shavings (Warren
and Sweet, 2003). When bedding is combined with manure, the C:N can often exceed 130:1
(Cotton et al., 2006). A high C:N in manure and bedding removed from horse stalls has been
shown to slow the composting process (Swinker et al., 1998). This is thought to be due to the
depletion of available nitrogen, with a subsequent reduction in microbial growth and
decomposition of organic materials (Swinker et al., 1998). Amending horse stall materials with
nitrogen may facilitate faster and more complete decomposition by supporting the
microorganisms involved in composting. Another negative effect, caused by bedding is an
increase in free air space, which may decrease pile temperatures, decomposition rate, and oxygen
concentrations (Fraser and Lau, 2000; McCartney et al., 2002). The type of bedding has also
been found to influence compostability of horse stall material. Swinker et al. (1997) reported that
sawdust bedding composted more readily than phone book paper or straw bedding. Straw was
the least desirable composting material, while sawdust was the most consistent. However,
Swinker et al. (1997) also stated that C:N ratios of all three materials were quite high, which
decreased the rate of decomposition for each material.
Compost as a Fertilizer Source for Florida Forages
Compost not only supplies nutrients needed to support forage production, it is also a
valuable source of organic matter. Increasing soil organic matter improves soil structure,
57
increases the water holding capacity or coarse-textured sandy soils, improves drainage in fine-
textured clay soils, provides a source of slow release nutrients, reduces wind and water erosion,
and promotes growth of earthworms and other beneficial soil organisms (Rynk et al., 1992).
Furthermore, application of compost as a soil amendment reduces nitrogen leaching from the soil
(Epstein, 1997). Therefore, utilization of compost could reduce the amount of commercial
nitrogen fertilizer applied and decrease the potential for nitrate contamination of surface and
groundwater (Diepeningen et al., 2006).
The nitrogen content of a composted product depends on the feedstock and processing
technology used to produce the compost. Similar to unprocessed manure, the nitrogen-
phosphorus-potassium ratio of most animal manure derived compost is such that application to
soils at a rate selected to satisfy the nitrogen requirements of forage might result in excess
additions of phosphorus and potassium. Therefore, meeting the forage’s phosphorus requirement
first with compost and then supplementing with inorganic fertilizer to meet nitrogen
requirements may be the optimal management strategy.
The amount of compost to be applied to a particular soil depends on the composition of the
compost, the forage crop grown, and environmental conditions (Eghball, 2000). An analysis of
the compost to be applied is essential to meet the requirements of forages prior to land
application. The availability of nutrients in compost will depend mostly on mineralization rates.
Mineralization rates of nutrients in soil depend on several soil factors including microorganisms
present, temperature, pH, oxygen concentration, soil type, C:N ratio, and organic matter
(Eghball, 2000). Generally, 20-30% of the phosphorus (Hainze et al., 2004) and 80-90% of the
potassium (Eghball et al., 2001) will be available from the compost during the first year after
application. Calculating nitrogen availability is more complex than determining phosphorus and

58
potassium availability. Most of the nitrogen in compost is organic, which is unavailable for
uptake until soil microorganisms degrade the organic compounds through mineralization. The
rate of nitrogen mineralization for beef cattle compost has been reported at 22% available
nitrogen during the first year of application (Eghball and Power, 1999; Eghball, 2000). Horse
manure has been reported as having a nitrogen mineralization rate varying from 20 to 50%
(Maryland Cooperative Extension, 1993; Kidder, 2002), yet little data is available on nitrogen
mineralization rates of compost made from horse manure.
Many studies have demonstrated the positive effects of land application of compost
generated from various manures on forage production, usually resulting in yields that were
comparable to those produced by inorganic fertilizer (Catroux et al., 1981; Hornick et al., 1984;
Davis et al., 1985; Warman and Termeer, 1996; Reider et al., 2000; Tiffany et al., 2000). In the
few instances where a negative response to compost application has been observed, either a high
C:N ratio, excess metals, high soluble salts or extremely high application rates were responsible
for the reduced yields or negative effects on soils or crops (Warman and Termeer, 2005).
Summary
The amount of research that has been conducted using horse stall material as the parent
material for compost is limited. The research that has been conducted is primarily based on
compostability of bedding that accompanies horse manure (Swinker et al., 1997; Ball et al.,
2000; Airaksinen et al., 2001; Fontanive et al., 2004) or the pathogen reduction efficiency of
composting horse stall materials (Romano et al., 2006). In addition, very little research has been
published concerning the performance of unprocessed or composted horse stall material as a
fertilizer source. A negative connotation exists in the horse industry when it comes to land
application of stall material, mainly due to potential spreading of weeds and pathogens onto
pasture. Treating manure through composting could provide a means of reducing the negative

59
environmental impact of horse manure by reducing the total volume of materials, destroying
parasites and weed seeds, and reducing runoff risk by stabilizing nutrients into organic forms.
60
CHAPTER 3 ON-FARM COMPOSTING OF HORSE STALL MATERIALS: EFFECT OF CARBON TO
NITROGEN RATIO AND BEDDING TYPE
Introduction
An estimated 9.2 million horses reside in the United States (AHCF, 2005). While the
number of horses has steadily increased, land availability for animal agriculture has decreased.
As a result, disposal and utilization of horse manure and soiled stall bedding have become major
concerns. Horse owners have typically disposed of stall materials (manure plus soiled bedding)
by storing them on unused land, hauling them to landfills, burning them, or using them as soil
amendments for pasture or cropland (NAHMS, 1998). With increasing emphasis on the control
of environmental pollution, many of the above options are limited or no longer available.
Another widespread management strategy is stockpiling, where horse manure is accumulated to
await later disposal, hauling or spreading onto pastures (Sweeten, 1996). A survey of equine
breeding farms and training facilities in Florida found that 80% of producers included
stockpiling in their manure management practices (Cotton, D. personal communication, 2008). A
poorly managed manure pile can harbor intestinal parasites, provide a breeding ground for flies
and produce offensive odors (Lyons et al., 1999; Major et al., 2005; Watson et al., 1998). Runoff
from improperly stored manure can quickly become a potential environment contaminate as it
carries soluble nutrients, pathogens and organic particles into the water cycle via surface runoff
or by leaching into groundwater (Yamulki, 2006). Land application of fresh manure can also
generate large amounts of ammonia, carbon dioxide and nitrous oxide, which could further
impact the environment (Yamulki, 2006). Treating manure through composting could provide a
means of reducing the environmental impact of horse manure by reducing the total volume of
materials, destroying parasites and weed seeds, and reducing runoff risk by stabilizing nutrients
into organic forms.
61
Compost is the product resulting from biological decomposition of organic matter under
controlled conditions, which has been sanitized through the generation of heat and stabilized to
the point that is beneficial to plant growth (Thompson, 2001). Stabilization includes the process
of transforming inorganic soluble nutrients into organic insoluble forms, which are less likely to
contaminate ground and surface water. The stabilized compost can be used as amendment for
soil applications, such as agricultural cropland, landscaping, and nursery potting mixes (Lynch,
2004). Other benefits include a reduction in the volume of material (Larney et al., 2000),
elimination of viable weed seeds (Larney and Blackshaw, 2003) and intestinal parasites (Larney
et al., 2003), and decreased odor production, compared to stockpiled manure (Li et al., 2007).
Horse manure is often mixed with bedding when removed from facilities where horses are
stabled in barns. The high carbon content of bedding presents a unique challenge when
composting horse manure that is usually not a limitation faced when composting other livestock
manures. The optimal ratio of carbon to nitrogen (C:N) to support microbial decomposition of
organic materials is 25-30:1 (Rynk et al., 1992). By itself, horse manure is already near the ideal
C:N (ASAE, 2005). In contrast, the C:N of common beddings used in stalls ranges from 30:1 for
straw or hay to 950:1 for wood shavings. When bedding is combined with manure, the C:N can
often exceed 130:1 (Cotton et al., 2006). A high C:N in manure and bedding removed from horse
stalls has been shown to slow the composting process (Swinker et al., 1998). This is thought to
be due to the depletion of available nitrogen, with a subsequent reduction in microbial growth
and decomposition of organic materials (Swinker et al., 1998). Amending horse stall materials
with nitrogen may facilitate faster and more complete decomposition by supporting the
microorganisms involved in composting. However, due to the varying amount of lignification in
common horse beddings, it is unknown if all stall materials will respond to nitrogen amendment.

62
The objective of this study was to evaluate various rates of nitrogen amendment and their
effects on the ease of composting horse stall materials containing either pine wood shavings or
bermudagrass hay bedding. The hypothesis was that the addition of nitrogen to horse stall
materials would result in an increased rate of decomposition and improving the compost as a
potential source of nutrients for fertilizer application.
Materials and Methods
Experimental Design
Five treatments were used to evaluate the effects of bedding type and C:N on the
composting of horse stall materials: 1) stall materials containing horse manure and wood
shavings bedding that was not amended with nitrogen (WOOD-CON; C:N 85:1), 2) amended to
a C:N of 60:1 (WOOD-60), or 3) amended to a C:N of 30:1 (WOOD-30) and 4) stall materials
containing bermudagrass hay bedding that was not amended with nitrogen (HAY-CON; C:N
30:1) or 5) amended to a C:N of 15:1 (HAY-15). Urea served as the nitrogen amendment. All
composting was performed in a concrete-based, 8-bin system (each bin measured 3 m x 3 m)
housed under roof cover. Horse manure and bedding was removed daily from stalls, weighed,
amassed in bin 1 over 14 d (amassing phase), amended with nitrogen (if appropriate), and moved
by a front-end loader to bin 2 where it was started on trial (d 0). A new batch of stall materials
would then be amassed in bin 1. In this manner, each batch of material was rotated from bin to
bin every 14 d providing active aeration. When materials completed the cycle in bin 8, they had
been composted for 84 d. Three replicates of each treatment were performed with treatments
randomly distributed throughout the trial period of December 2005-November 2006.
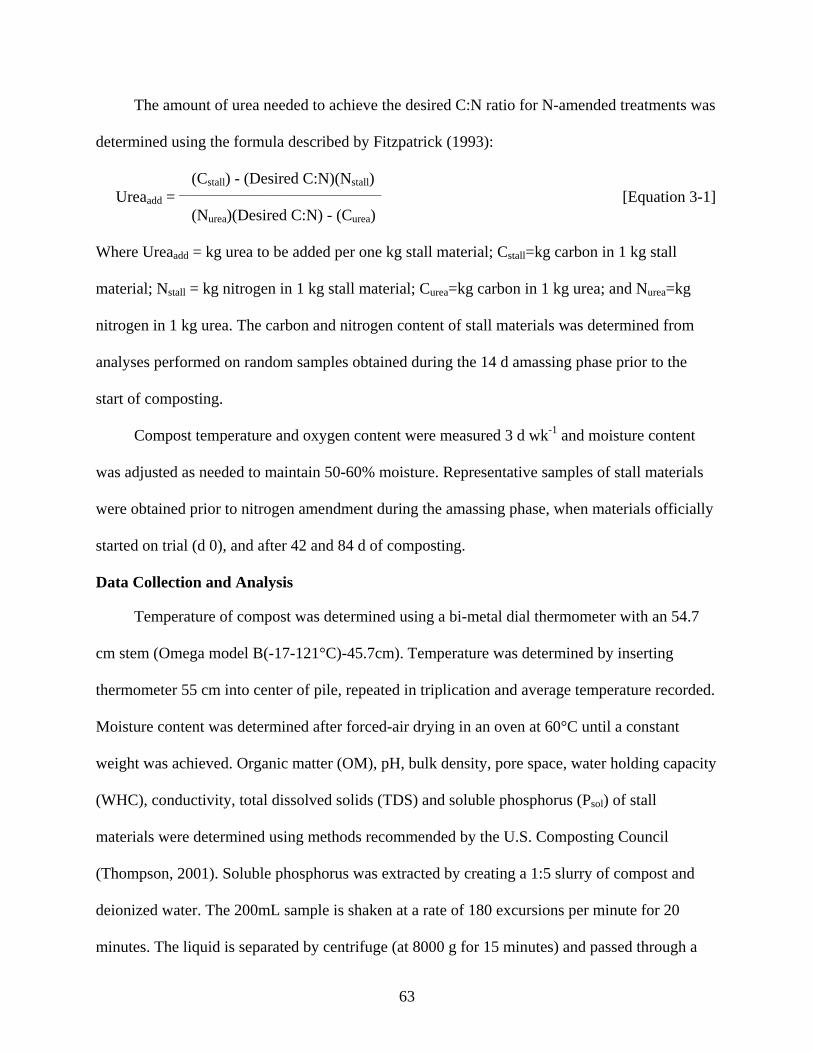
63
The amount of urea needed to achieve the desired C:N ratio for N-amended treatments was
determined using the formula described by Fitzpatrick (1993):
(Cstall) - (Desired C:N)(Nstall) Ureaadd = ______________________________________ [Equation 3-1] (Nurea)(Desired C:N) - (Curea)
Where Ureaadd = kg urea to be added per one kg stall material; Cstall=kg carbon in 1 kg stall
material; Nstall = kg nitrogen in 1 kg stall material; Curea=kg carbon in 1 kg urea; and Nurea=kg
nitrogen in 1 kg urea. The carbon and nitrogen content of stall materials was determined from
analyses performed on random samples obtained during the 14 d amassing phase prior to the
start of composting.
Compost temperature and oxygen content were measured 3 d wk-1 and moisture content
was adjusted as needed to maintain 50-60% moisture. Representative samples of stall materials
were obtained prior to nitrogen amendment during the amassing phase, when materials officially
started on trial (d 0), and after 42 and 84 d of composting.
Data Collection and Analysis
Temperature of compost was determined using a bi-metal dial thermometer with an 54.7
cm stem (Omega model B(-17-121°C)-45.7cm). Temperature was determined by inserting
thermometer 55 cm into center of pile, repeated in triplication and average temperature recorded.
Moisture content was determined after forced-air drying in an oven at 60°C until a constant
weight was achieved. Organic matter (OM), pH, bulk density, pore space, water holding capacity
(WHC), conductivity, total dissolved solids (TDS) and soluble phosphorus (Psol) of stall
materials were determined using methods recommended by the U.S. Composting Council
(Thompson, 2001). Soluble phosphorus was extracted by creating a 1:5 slurry of compost and
deionized water. The 200mL sample is shaken at a rate of 180 excursions per minute for 20
minutes. The liquid is separated by centrifuge (at 8000 g for 15 minutes) and passed through a

64
0.45 µm membrane filter. The water soluble phosphorus content of the filtrate is quantified
colorimetrically (PowerWave XS spectrophotometer, Winooski, VT). Moisture content was
determined after forced-air drying in an oven at 60°C until a constant weight was achieved. Total
nitrogen (N) and total carbon (C) analyses were performed with the Dumas combustion method
(VarioMax N analyzer, Elementar Americas) (TMECC methods 04.02-D and 04.01-A
(Thompson, 2002)). Total phosphorus (Ptot) was determined on samples that had been ashed
prior to sulfuric acid digestion and then quantified colorimetrically (PowerWave XS
spectrophotometer, Winooski, VT). Potassium (K) concentration in samples was determined
using atomic absorption spectrometry (Perkin-Elmer Corp, Norwalk, CT). Organic matter (OM)
was determined after heating samples for 12 h in a muffle furnace at 550°C (TMECC method
03.02-A (Thompson, 2002)). The pH was determined on a slurry prepared with stall materials
and dionized water according to AOAC method 973.04 using a Thermo Orion Posi-pHIo
SympHony Electrode and Thermo Orion 410-A meter (Thermo Fisher Scientific, Waltham,
MA). Neutral detergent fiber (NDF), acid detergent fiber (ADF) and lignin concentrations were
determined using the ANKOM A200 filter bag technique (AOAC 973.18(B-D)). Ambient
temperature and rainfall was recorded weekly from the Alachua Florida Automated Weather
Network.
Nutrient data obtained from composted materials were transformed using mass balance
estimates to determine net loss/gain of nutrients. Total mass balance estimates for each nutrient
(i.e., C, N, Ptot, Psol, K, NDF, ADF, and lignin) were determined using the formula described by
Larney et al. (2006):
Mass balance (%) = 1 – ((Nutrientfconc x DMfmass)/(Nutrienticonc x DMimass))*100 [Equation 3-2]
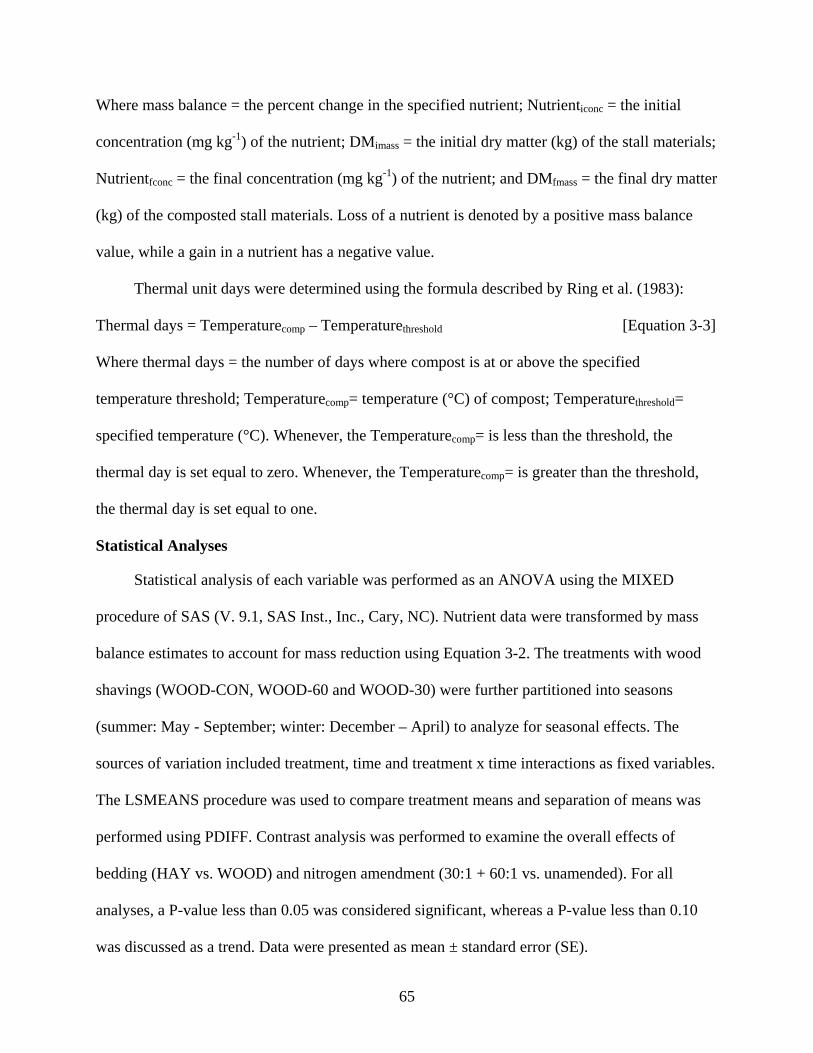
65
Where mass balance = the percent change in the specified nutrient; Nutrienticonc = the initial
concentration (mg kg-1) of the nutrient; DMimass = the initial dry matter (kg) of the stall materials;
Nutrientfconc = the final concentration (mg kg-1) of the nutrient; and DMfmass = the final dry matter
(kg) of the composted stall materials. Loss of a nutrient is denoted by a positive mass balance
value, while a gain in a nutrient has a negative value.
Thermal unit days were determined using the formula described by Ring et al. (1983):
Thermal days = Temperaturecomp – Temperaturethreshold [Equation 3-3]
Where thermal days = the number of days where compost is at or above the specified
temperature threshold; Temperaturecomp= temperature (°C) of compost; Temperaturethreshold=
specified temperature (°C). Whenever, the Temperaturecomp= is less than the threshold, the
thermal day is set equal to zero. Whenever, the Temperaturecomp= is greater than the threshold,
the thermal day is set equal to one.
Statistical Analyses
Statistical analysis of each variable was performed as an ANOVA using the MIXED
procedure of SAS (V. 9.1, SAS Inst., Inc., Cary, NC). Nutrient data were transformed by mass
balance estimates to account for mass reduction using Equation 3-2. The treatments with wood
shavings (WOOD-CON, WOOD-60 and WOOD-30) were further partitioned into seasons
(summer: May - September; winter: December – April) to analyze for seasonal effects. The
sources of variation included treatment, time and treatment x time interactions as fixed variables.
The LSMEANS procedure was used to compare treatment means and separation of means was
performed using PDIFF. Contrast analysis was performed to examine the overall effects of
bedding (HAY vs. WOOD) and nitrogen amendment (30:1 + 60:1 vs. unamended). For all
analyses, a P-value less than 0.05 was considered significant, whereas a P-value less than 0.10
was discussed as a trend. Data were presented as mean ± standard error (SE).
66
Results
Weather Conditions
During the 44 wk trial period (December 2005 – November 2006) in Gainesville, Florida,
the mean daily air temperature ranged from 1.7 to 28.2°C with an average temperature of 19.2°C.
For summer months (May – September), mean daily air temperatures ranged from 17.2 to 27.5°C
and averaged 24.5°C. For winter months (December – April), mean daily air temperatures ranged
from 1.7 to 23.1°C and averaged 13.7°C.
Composting Temperatures and Effect of Season
Mean composting temperatures of all WOOD treatments were greater (P<0.0001) than all
HAY treatments. Mean composting temperatures in WOOD treatments did not vary in response
to N amendment, but HAY-15 had higher mean temperatures (P<0.001) than HAY-CON.
Maximum composting temperatures required to destroy pathogens and parasites (55°C) and
weed seeds (63°C) (USDA, 2002) were reached within the first 2 wks of composting in all
WOOD treatments, but not in HAY treatments (Figure 3-1). All WOOD treatments had
significant thermal unit days above stated temperatures required to destroy parasites and weed
seeds (Figure 3-2). Thermal unit days were not affected by N amendment. After 84 d of
composting, all materials remained above ambient temperature, regardless of bedding or N
amendment. However, composting in the summer generated higher mean temperatures
(P<0.0001) compared to the winter months in treatments containing WOOD (Figure 3-3). The
starting dates of treatments were randomly assigned in an effort to minimize effects of seasonal
variation. However, mean composting temperatures did differ (P<0.05) between each of the three
replications within each treatment due to seasonal variation.

67
Material Mass and Organic Matter
Composting reduced the DM mass of stall materials by 14 to 57%, with larger mass
reductions observed in treatments with hay bedding compared to wood shaving bedding
(P<0.05). HAY-CON demonstrated the greatest mass reduction, followed by HAY-15 and
WOOD-30. WOOD-60 and WOOD-CON had the lowest reduction in mass after composting
(P<0.01) (Figure 3-4). Composting reduced (P<0.01) the OM of stall materials 17 to 60% in all
treatments, regardless of bedding type or N amendment. Within the hay bedding treatments,
HAY-CON had a greater OM reduction than HAY-15 (P<0.0001) (Table 3-3). In contrast, the
reduction in OM of stall materials containing wood shavings bedding was not affected by
nitrogen amendment.
Nutrient Concentrations in Compost
The concentrations of N, C, Ptot, Psol, and K at d 0 (after N amendment), d 84, and the
overall all treatment mean are presented in Table 3-1. Overall, hay bedding treatments contained
higher concentrations of N than those with wood shaving bedding (P<0.0001); this difference in
N was maintained after 84 d of composting. The concentration of C averaged 435±8.2 g kg-1 and
was not affected by bedding type, N amendment or composting. The concentration of Ptot, Psol,
and K were not altered by composting. Treatments with hay bedding had higher concentrations
of Ptot (P<0.001), Psol (P<0.05), and K (P<0.001) compared to those with wood shavings
(P<0.001), but were not affected by N amendment. The average concentration of NDF (678±24 g
kg-1), ADF (351±12 g kg-1) and lignin (80.0±4.6 g kg-1) in HAY treatments were not affected by
composting or N amendment. Mean concentrations of NDF (837±13 g kg-1), ADF (683±13 g kg-
1) and lignin (248±5.8 g kg-1) in WOOD treatments were not affected by composting or N
amendment.

68
pH, Conductivity, and Total Dissolved Solids
The pH, conductivity, and TDS of stall materials at d 0, d 84 and the overall treatment
means are presented in Table 3-2. Prior to composting, the average pH of stall material was
8.4±0.2 (Figure 3-5). After 84 d of composting, the pH in WOOD treatments declined (P<0.001)
to 6.65±0.2 (Figure 3-5). In contrast, the pH of HAY treatments did not decrease after
composting. Amendment with N had no effect on pH in either the WOOD or HAY treatments.
WOOD-30 had increased (P<0.01) conductivity and TDS than WOOD-CON, WOOD-60 and
HAY treatments. Mean conductivity was 0.7±0.05 and 0.6±0.04 ms cm-1; TDS was 0.34±0.03
and 0.28±0.02 ppt in WOOD and HAY treatments, respectively.
Water Holding Capacity and Bulk Density
Water holding capacity (WHC) was not affected by composting or N amendment, but was
influenced by bedding type. The WHC of WOOD treatments (21.7±0.02%) was higher (P<0.05)
than that observed in HAY treatments (8.71±1.5%). Pore space was greater (P<0.05) in HAY
treatments (76±3.3%) than in WOOD treatments (56±2.4%) (Table 3-2). The mean bulk density
of WOOD bedding treatments (0.2±0.02 gm ml-1), was higher (P<0.05) than HAY bedding
treatments (0.08±0.001 gm ml-1). The bulk density of stall materials increased (P<0.05) in
response to composting in all treatments.
Mass Balance Estimates for Nutrients
Mass balance of C, N, Ptot, Psol, K, NDF, ADF and lignin are presented in Table 3-3. The C
content of stall materials was reduced 15-60% in response to composting (P<0.05), with a greater
loss in of C in HAY treatments compared to WOOD treatments (P<0.01). The largest reduction
in C was observed for HAY-CON, followed by HAY-15 and WOOD-30. The lowest loss of C
was exhibited by WOOD-60 and WOOD-CON (P<0.05). More N was lost from HAY treatments
than WOOD treatments (P<0.05). A loss of N was observed HAY-CON, HAY-15 and WOOD-
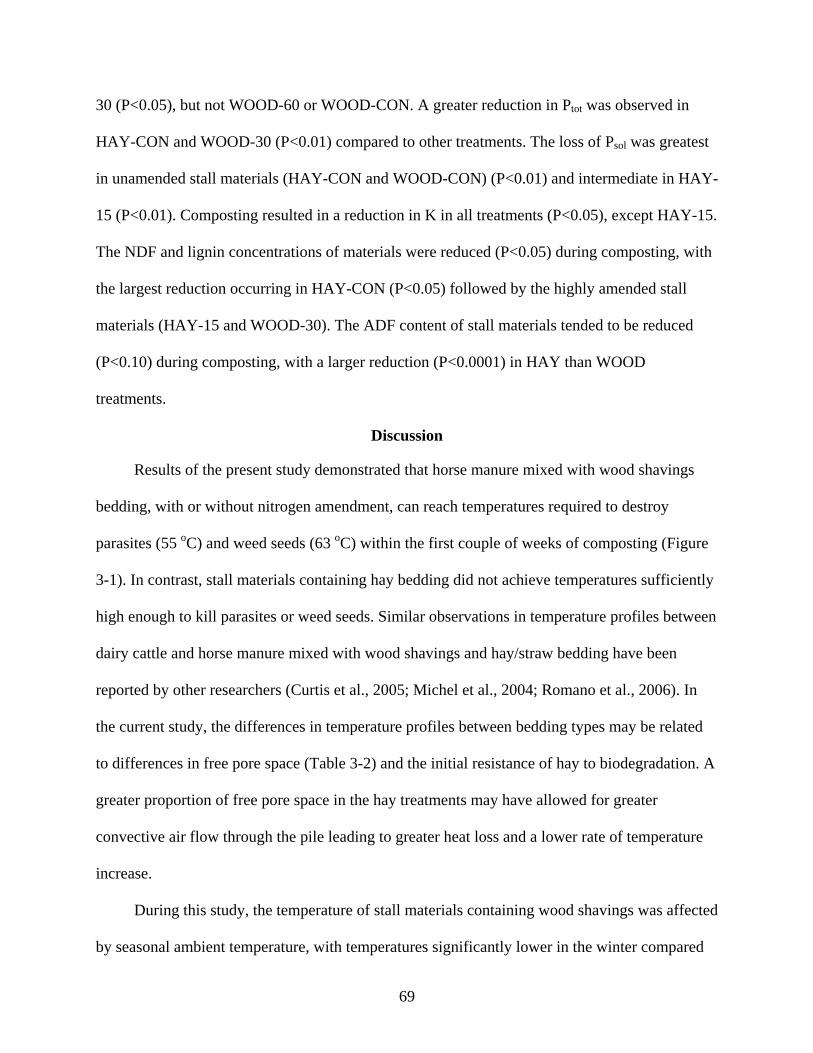
69
30 (P<0.05), but not WOOD-60 or WOOD-CON. A greater reduction in Ptot was observed in
HAY-CON and WOOD-30 (P<0.01) compared to other treatments. The loss of Psol was greatest
in unamended stall materials (HAY-CON and WOOD-CON) (P<0.01) and intermediate in HAY-
15 (P<0.01). Composting resulted in a reduction in K in all treatments (P<0.05), except HAY-15.
The NDF and lignin concentrations of materials were reduced (P<0.05) during composting, with
the largest reduction occurring in HAY-CON (P<0.05) followed by the highly amended stall
materials (HAY-15 and WOOD-30). The ADF content of stall materials tended to be reduced
(P<0.10) during composting, with a larger reduction (P<0.0001) in HAY than WOOD
treatments.
Discussion
Results of the present study demonstrated that horse manure mixed with wood shavings
bedding, with or without nitrogen amendment, can reach temperatures required to destroy
parasites (55 oC) and weed seeds (63 oC) within the first couple of weeks of composting (Figure
3-1). In contrast, stall materials containing hay bedding did not achieve temperatures sufficiently
high enough to kill parasites or weed seeds. Similar observations in temperature profiles between
dairy cattle and horse manure mixed with wood shavings and hay/straw bedding have been
reported by other researchers (Curtis et al., 2005; Michel et al., 2004; Romano et al., 2006). In
the current study, the differences in temperature profiles between bedding types may be related
to differences in free pore space (Table 3-2) and the initial resistance of hay to biodegradation. A
greater proportion of free pore space in the hay treatments may have allowed for greater
convective air flow through the pile leading to greater heat loss and a lower rate of temperature
increase.
During this study, the temperature of stall materials containing wood shavings was affected
by seasonal ambient temperature, with temperatures significantly lower in the winter compared
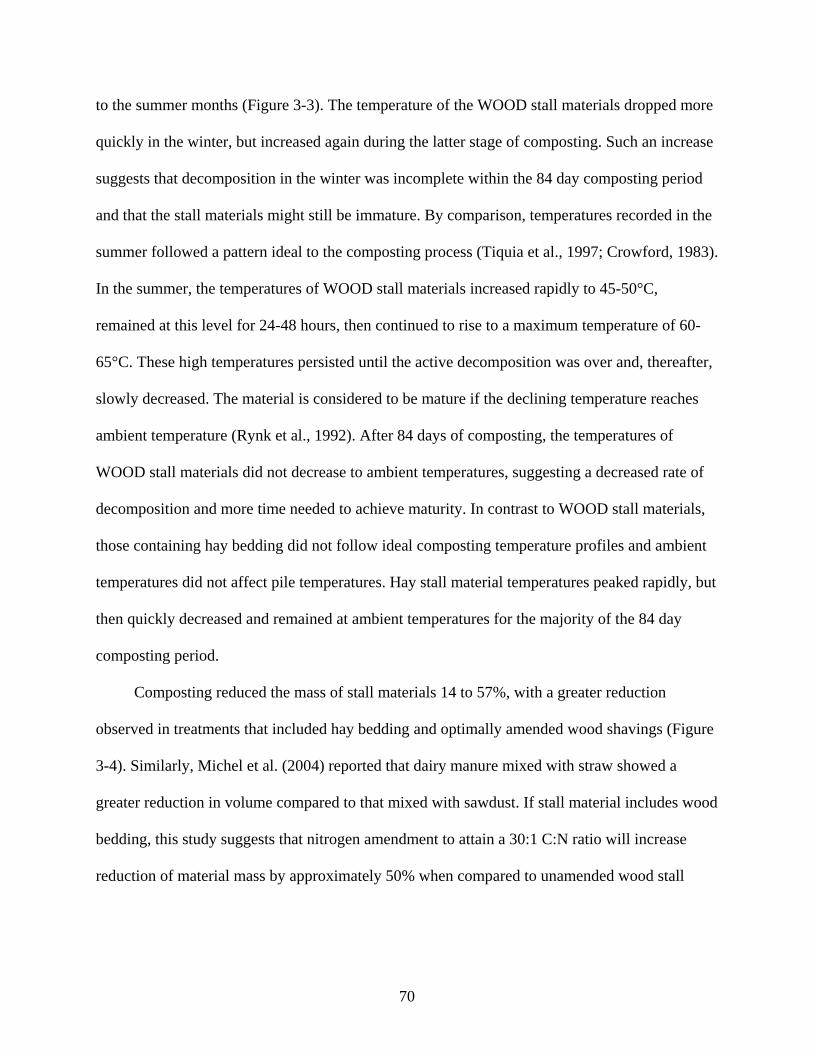
70
to the summer months (Figure 3-3). The temperature of the WOOD stall materials dropped more
quickly in the winter, but increased again during the latter stage of composting. Such an increase
suggests that decomposition in the winter was incomplete within the 84 day composting period
and that the stall materials might still be immature. By comparison, temperatures recorded in the
summer followed a pattern ideal to the composting process (Tiquia et al., 1997; Crowford, 1983).
In the summer, the temperatures of WOOD stall materials increased rapidly to 45-50°C,
remained at this level for 24-48 hours, then continued to rise to a maximum temperature of 60-
65°C. These high temperatures persisted until the active decomposition was over and, thereafter,
slowly decreased. The material is considered to be mature if the declining temperature reaches
ambient temperature (Rynk et al., 1992). After 84 days of composting, the temperatures of
WOOD stall materials did not decrease to ambient temperatures, suggesting a decreased rate of
decomposition and more time needed to achieve maturity. In contrast to WOOD stall materials,
those containing hay bedding did not follow ideal composting temperature profiles and ambient
temperatures did not affect pile temperatures. Hay stall material temperatures peaked rapidly, but
then quickly decreased and remained at ambient temperatures for the majority of the 84 day
composting period.
Composting reduced the mass of stall materials 14 to 57%, with a greater reduction
observed in treatments that included hay bedding and optimally amended wood shavings (Figure
3-4). Similarly, Michel et al. (2004) reported that dairy manure mixed with straw showed a
greater reduction in volume compared to that mixed with sawdust. If stall material includes wood
bedding, this study suggests that nitrogen amendment to attain a 30:1 C:N ratio will increase
reduction of material mass by approximately 50% when compared to unamended wood stall

71
materials. Such a reduction in mass may be beneficial by reducing the amount of material horse
owners must dispose of or manage.
Composts used as growing media should have a high degree of maturity and adequate
physical and chemical properties, such as particle size, porosity, water holding capacity, air
capacity, electrical conductivity and pH. These factors may be more important than the nutrient
composition of compost because nutrients can be supplemented by fertilizers (Garcia-Gomez et
al., 2002). Prior to composting, the pH of stall materials was 8.4, which can be unmarketable to
gardeners and nurseries; however, after 84 days of composting, the pH of stall materials
containing wood bedding declined to 6.65, which is more desirable for most end users (Swinker
et al., 1998) (Figure 3-5). Generally, composting will yield an end product with a stable pH
usually near neutral, independent of starting material (BCAF, 1996). However, in contrast to
treatments containing wood bedding, the pH of hay bedding treatments did not decrease after
composting in the current study. Curtis et al. (2005) also observed no decline in pH after
composting horse and dairy cattle manure-straw mixtures. Another common concern when using
compost derived from manure is soluble salt level. An ideal range of soluble salts for salt
sensitive crops and forage is 400 – 1,000 ppm (Fitzpatrick et al., 1998). If the soluble salt
concentration is in excess of approximately 2,000 ppm, chlorosis, necrosis, and loss of
productivity in salt sensitive crops and plants may occur (Fitzpatrick et al., 1998). During this
study, all treatments were within an acceptable range (Table 3-2). Most of the soluble salts came
from the horse manure and the bedding diluted some of these salts making the concentrations
more suitable for plants.
Carbon losses are associated with all forms of manure management, as microbial
decomposition breaks down available carbon in manure and bedding material (Larney et al.,

72
2006). In this study, composting resulted in carbon losses of 15-60% (Table 3-1). The majority
of carbon loss likely results from microbial breakdown of polysaccharides as they constitute the
majority of plant carbon and are comparatively more easily degradable than lignin. Evidence of
this was observed in the current study, where the loss of NDF and ADF from stall materials was
greater than loss of lignin, and paralleled the loss of carbon during composting (Table 3-3). A
larger loss of fiber materials was observed in stall materials with hay bedding compared to wood
shavings. The higher nitrogen content of these materials would positively support microbial
growth, resulting in greater degradation of bedding fiber (Table 3-1). Nonetheless, much of the
bedding remained in all treatments after 84 days of composting. The materials had stabilized in
temperature, darkened in color and there appeared to be complete breakdown of fecal material,
but the decomposition of bedding was minimal, regardless of bedding type.
The greatest loss of nitrogen (27-40%) occurred in the treatments with the highest nitrogen
concentration (attained naturally or via a high level of nitrogen amendment) (Table 3-3). This
loss of likely resulted from volatilization of nitrogen as ammonia. Urea can be rapidly converted
to ammonia and volatilize into the atmosphere (Curtis et al., 2005). The rate of conversion is
influenced by factors such as moisture content, temperature, pH and urease activity. All of these
factors are optimized during composting, which can facilitate a greater loss of nitrogen as
ammonia when materials are highly amended with urea (Parkinson et al., 2004). Michel et al.
(2004) reported 8 to 26% loss in nitrogen for sawdust amended and 15 to 43% for straw
amended dairy manure. Interestingly, an increase of nitrogen was observed in the wood stall
materials amended to a C:N of 60:1 as well as unamended wood materials. This increase, along
with increases in total phosphorus and total potassium in other treatments, are difficult to

73
explain, although other authors reported similar outcomes and unknown reasons for the increases
when composting cattle manure and poultry litter (Larney et al., 2006; Sommer and Dahl, 1999).
Phosphorus and potassium losses are often thought to be low to negligible during
composting (Sommer and Dahl, 1999). In the current study most phosphorus mass balance
values were positive, suggesting loss of phosphorus during composting. Other research has
demonstrated when composting cattle and poultry manner, a loss of phosphorus occurs. Larney
et al. (2006), reported a total phosphorus loss of 47-60% while composting beef cattle feedlot
manure. Sommer and Dahl (1999) reported a phosphorus loss of 10% after composting dairy
manure. Michel et al., (2004) reported a 12 to 21% loss of phosphorus for sawdust amended and
1 to 38% loss for straw amended dairy manure. Phosphorus losses are generally attributed to
runoff or leaching (Larney et al., 2006), yet this study was conducted under roof, so phosphorus
losses due to runoff and leaching would have been minimal. The water soluble fraction of
phosphorus is especially of concern due to its potential to pollute surface and groundwater
(Mallin and Wheeler, 2000) decreased in all treatments except those highly amended wood
treatments. During composting, microorganisms utilize available (soluble) nutrients as an energy
source and to sustain a variety of biological processes. The decrease in soluble phosphorus
indicates proliferation of microbiological activation and therefore decomposition of organic
matter.
Conclusions
In the current study, the type of bedding appeared to have a greater influence than nitrogen
amendment on the decomposition of horse stall material through composting. Horse manure and
wood shavings mixtures, with or without added nitrogen, showed a faster rate of decomposition
and nutrient stability during 84 days of composting than stall materials containing hay bedding.
Composting horse stall materials reduced the DM mass by up to 57%, thereby reducing the
74
amount of materials that horse owners must store or dispose of. In addition, composting for 84
days allowed conversion of water-soluble nutrients into organic forms that are less likely to be
carried away through surface runoff or leached into groundwater. Finally, horse manure mixed
with wood shavings was capable of reaching temperatures that were high enough to destroy
parasite eggs, larvae and weed seeds. However, more research is needed to determine an
economically feasible method to further decompose bedding in a timely manner to produce a
higher quality end product.
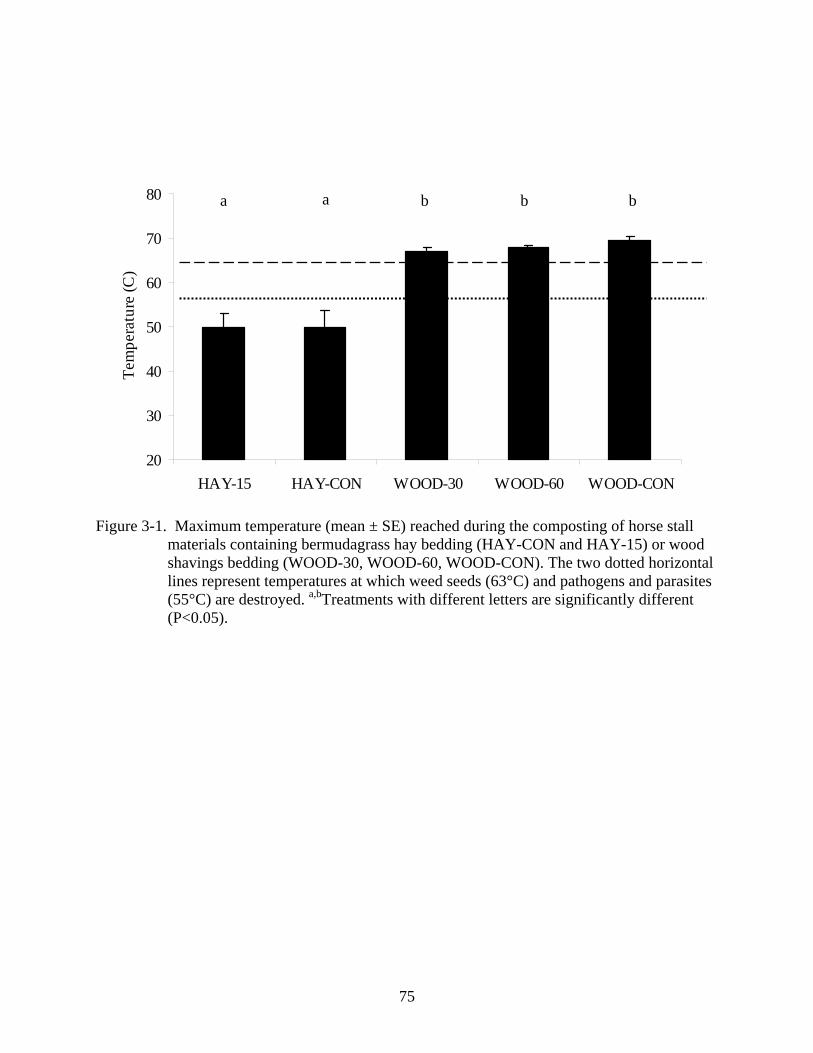
75
20
30
40
50
60
70
80
HAY-15 HAY-CON WOOD-30 WOOD-60 WOOD-CON
Tem
pera
ture
(C)
a bbba
Figure 3-1. Maximum temperature (mean ± SE) reached during the composting of horse stall
materials containing bermudagrass hay bedding (HAY-CON and HAY-15) or wood shavings bedding (WOOD-30, WOOD-60, WOOD-CON). The two dotted horizontal lines represent temperatures at which weed seeds (63°C) and pathogens and parasites (55°C) are destroyed. a,bTreatments with different letters are significantly different (P<0.05).
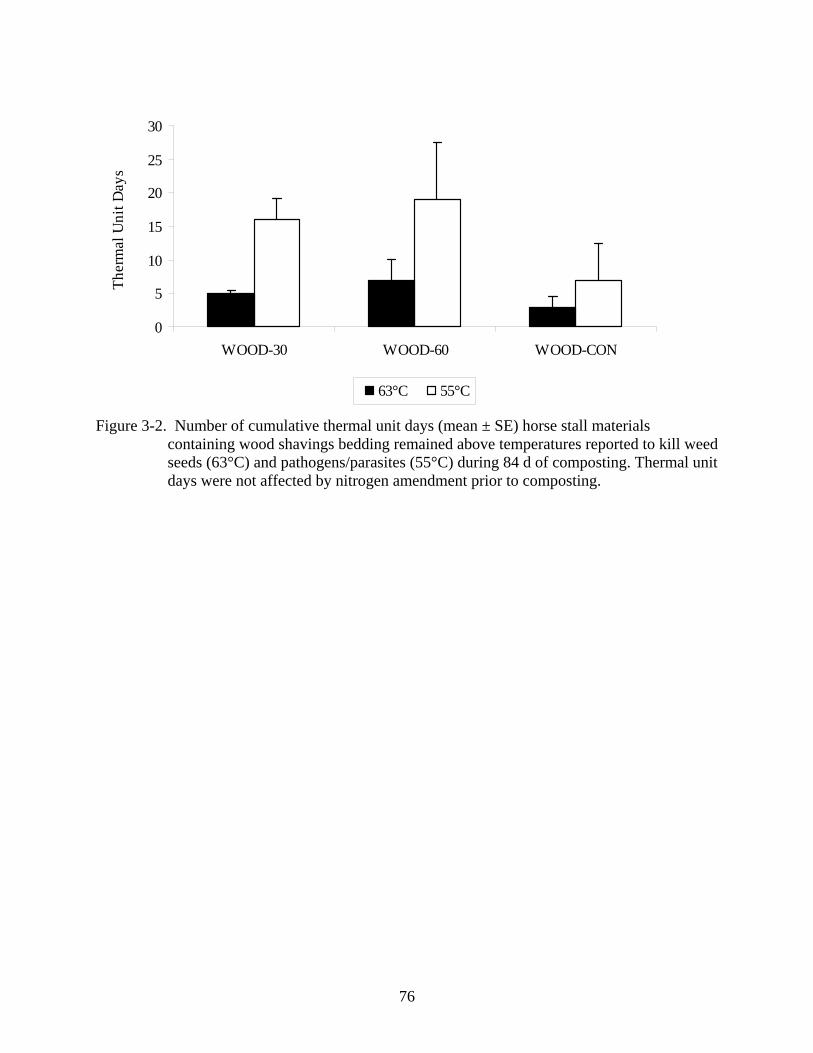
76
0
5
10
15
20
25
30
WOOD-30 WOOD-60 WOOD-CON
Ther
mal
Uni
t Day
s
63°C 55°C
Figure 3-2. Number of cumulative thermal unit days (mean ± SE) horse stall materials containing wood shavings bedding remained above temperatures reported to kill weed seeds (63°C) and pathogens/parasites (55°C) during 84 d of composting. Thermal unit days were not affected by nitrogen amendment prior to composting.

77
010203040506070
1 7 13 19 25 31 37 43 49 55 61 67 73
Tem
pera
ture
(C)
Winter compost Summer compostWinter ambient Summer ambient
Figure 3-3. Effect of season on ambient temperature and mean compost temperature of pooled
treatments containing wood shavings bedding during 84 d of composting. Season affected both ambient (P<0.0001) and mean compost (P<0.0001) temperatures.
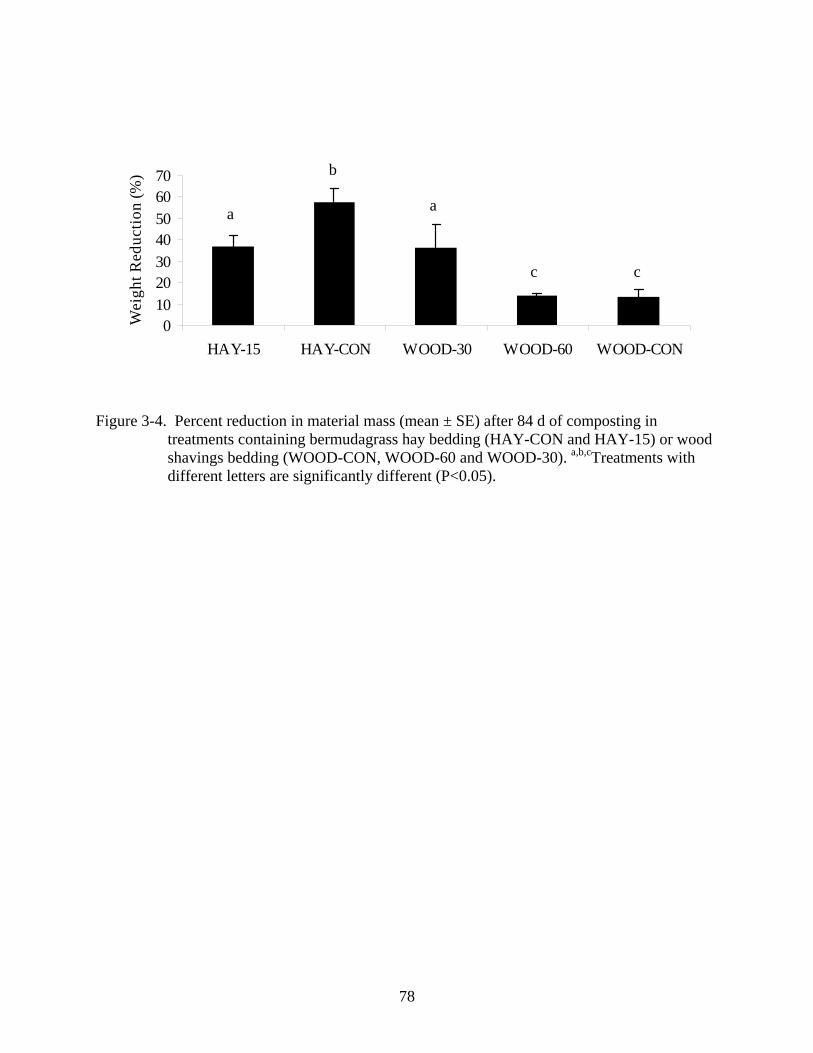
78
010203040506070
HAY-15 HAY-CON WOOD-30 WOOD-60 WOOD-CON
Wei
ght R
educ
tion
(%)
a
cc
a
b
Figure 3-4. Percent reduction in material mass (mean ± SE) after 84 d of composting in
treatments containing bermudagrass hay bedding (HAY-CON and HAY-15) or wood shavings bedding (WOOD-CON, WOOD-60 and WOOD-30). a,b,cTreatments with different letters are significantly different (P<0.05).

79
0123456789
10
HAY-15 HAY-CON WOOD-30 WOOD-60 WOOD-CON
d 0 d 42 d 84
baa a a,b
b aab
Figure 3-5. Change in pH (mean ± SE) after 84 d of composting in treatments containing
bermudagrass hay bedding (HAY-CON and HAY-15) or wood shavings bedding (WOOD-CON, WOOD-60 and WOOD-30). a,bMeans within treatments with different letters are significantly different (P<0.05).

80
Table 3-1. Nitrogen (N), carbon (C), total phosphorus (Ptot), soluble phosphorus (Psol), and potassium (K) concentrations in stall materials containing bermudagrass bedding (HAY-15 and HAY-CON) or wood shavings bedding (WOOD-30, WOOD-60 and WOOD-CON) before (d 0) and after 84 d of composting.
g kg-1 Treatment P-value Day HAY-
15 HAY-CON
WOOD-30 WOOD-60
WOOD-CON
SEM† Trt Day
N d 0 22.4a 17.2a,b 13.2a,b 6.32b 5.27b 2.1 0.0134 d 84 22.7a 21.7a 10.6b 7.23b 7.40b 2.0 0.0005 mean 22.6a 19.4a 11.9b 6.78b,c 6.33c 1.4 0.0001 NS C d 0 464.3 438.6 440.5 432.8 459.2 10.2 NS d 84 430.5 411.7 435.2 394.6 451.7 12.5 NS mean 447.4 425.2 437.8 413.7 455.4 8.2 NS NS Ptot d 0 2.18 4.03 2.01 1.43 2.11 0.37 NS d 84 3.91a 6.29a,b 2.11b 1.47b 2.20b 0.56 0.0132 mean 3.04b 5.16a 2.06b 1.45b 2.16b 0.34 0.0015 NS Psol d 0 0.21a,b 0.33a 0.17a,b 0.10b 0.14b 0.02 0.0114 d 84 0.29a,b 0.36a 0.22b,c 0.11c 0.11c 0.03 0.0004 mean 0.26b 0.35a 0.19b 0.11c 0.12c 0.02 0.0001 NS K d 0 9.59b 15.5a 3.87c 5.16b,c 4.00c 1.26 0.0001 d 84 16.5a 18.0a 3.44b 4.94b 3.43b 1.85 0.0001 mean 13.0b 16.8a 3.66c 5.05c 3.72c 1.11 0.0001 NS †Standard error mean. a,b,c Means within a row with different superscripts are significantly different (P<0.05).
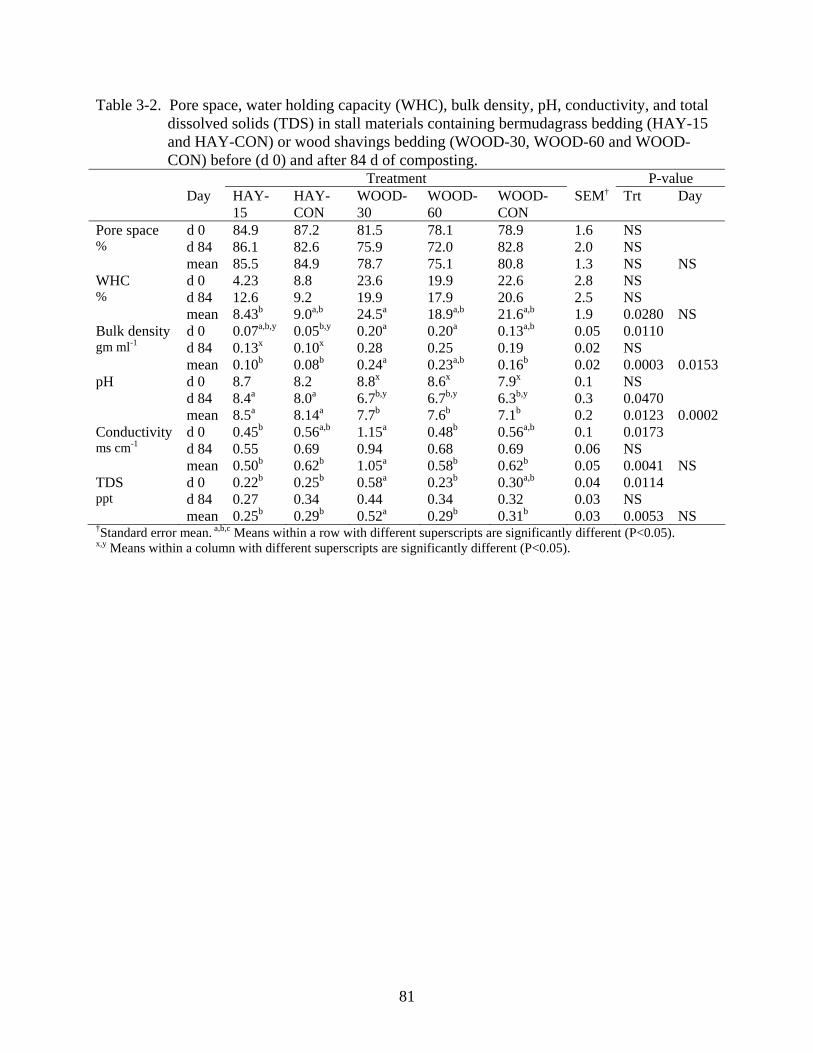
81
Table 3-2. Pore space, water holding capacity (WHC), bulk density, pH, conductivity, and total dissolved solids (TDS) in stall materials containing bermudagrass bedding (HAY-15 and HAY-CON) or wood shavings bedding (WOOD-30, WOOD-60 and WOOD-CON) before (d 0) and after 84 d of composting.
Treatment P-value Day HAY-
15 HAY-CON
WOOD-30
WOOD-60
WOOD-CON
SEM† Trt Day
Pore space d 0 84.9 87.2 81.5 78.1 78.9 1.6 NS % d 84 86.1 82.6 75.9 72.0 82.8 2.0 NS mean 85.5 84.9 78.7 75.1 80.8 1.3 NS NS WHC d 0 4.23 8.8 23.6 19.9 22.6 2.8 NS % d 84 12.6 9.2 19.9 17.9 20.6 2.5 NS mean 8.43b 9.0a,b 24.5a 18.9a,b 21.6a,b 1.9 0.0280 NS Bulk density d 0 0.07a,b,y 0.05b,y 0.20a 0.20a 0.13a,b 0.05 0.0110 gm ml-1 d 84 0.13x 0.10x 0.28 0.25 0.19 0.02 NS mean 0.10b 0.08b 0.24a 0.23a,b 0.16b 0.02 0.0003 0.0153pH d 0 8.7 8.2 8.8x 8.6x 7.9x 0.1 NS d 84 8.4a 8.0a 6.7b,y 6.7b,y 6.3b,y 0.3 0.0470 mean 8.5a 8.14a 7.7b 7.6b 7.1b 0.2 0.0123 0.0002Conductivity d 0 0.45b 0.56a,b 1.15a 0.48b 0.56a,b 0.1 0.0173 ms cm-1 d 84 0.55 0.69 0.94 0.68 0.69 0.06 NS mean 0.50b 0.62b 1.05a 0.58b 0.62b 0.05 0.0041 NS TDS d 0 0.22b 0.25b 0.58a 0.23b 0.30a,b 0.04 0.0114 ppt d 84 0.27 0.34 0.44 0.34 0.32 0.03 NS mean 0.25b 0.29b 0.52a 0.29b 0.31b 0.03 0.0053 NS †Standard error mean. a,b,c Means within a row with different superscripts are significantly different (P<0.05). x,y Means within a column with different superscripts are significantly different (P<0.05).
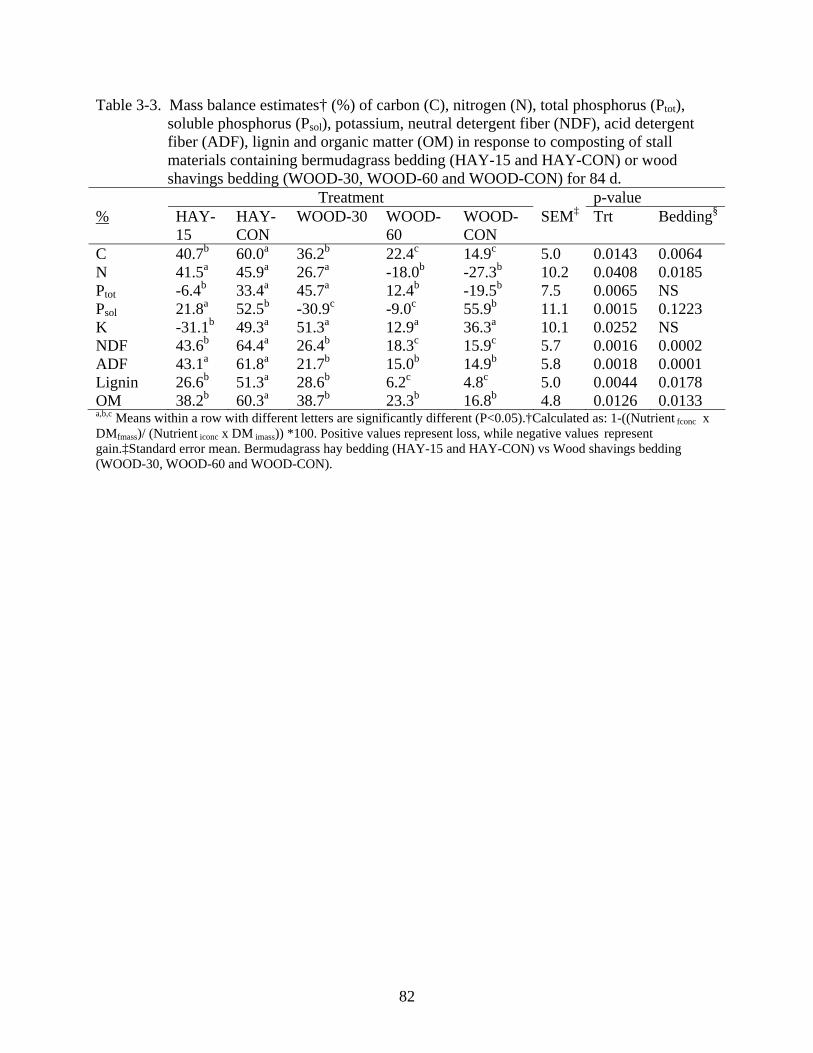
82
Table 3-3. Mass balance estimates† (%) of carbon (C), nitrogen (N), total phosphorus (Ptot), soluble phosphorus (Psol), potassium, neutral detergent fiber (NDF), acid detergent fiber (ADF), lignin and organic matter (OM) in response to composting of stall materials containing bermudagrass bedding (HAY-15 and HAY-CON) or wood shavings bedding (WOOD-30, WOOD-60 and WOOD-CON) for 84 d.
Treatment p-value % HAY-
15 HAY-CON
WOOD-30 WOOD-60
WOOD-CON
SEM‡ Trt Bedding§
C 40.7b 60.0a 36.2b 22.4c 14.9c 5.0 0.0143 0.0064 N 41.5a 45.9a 26.7a -18.0b -27.3b 10.2 0.0408 0.0185 Ptot -6.4b 33.4a 45.7a 12.4b -19.5b 7.5 0.0065 NS Psol 21.8a 52.5b -30.9c -9.0c 55.9b 11.1 0.0015 0.1223 K -31.1b 49.3a 51.3a 12.9a 36.3a 10.1 0.0252 NS NDF 43.6b 64.4a 26.4b 18.3c 15.9c 5.7 0.0016 0.0002 ADF 43.1a 61.8a 21.7b 15.0b 14.9b 5.8 0.0018 0.0001 Lignin 26.6b 51.3a 28.6b 6.2c 4.8c 5.0 0.0044 0.0178 OM 38.2b 60.3a 38.7b 23.3b 16.8b 4.8 0.0126 0.0133 a,b,c Means within a row with different letters are significantly different (P<0.05).†Calculated as: 1-((Nutrient
fconc x DMfmass)/ (Nutrient
iconc x DM imass)) *100. Positive values represent loss, while negative values represent
gain.‡Standard error mean. Bermudagrass hay bedding (HAY-15 and HAY-CON) vs Wood shavings bedding (WOOD-30, WOOD-60 and WOOD-CON).

83
CHAPTER 4 ON-FARM COMPOSTING OF HORSE STALL MATERIALS: EFFECT OF SLOW-
RELEASE NITROGEN AMENDMENTS
Introduction
The decrease in agricultural land availability and the increase in environmental regulations
to protect waster quality has led to greater concern for the management of horse manure
generated on farms and at boarding, racetrack and horseshow facilities. Current manure
management practices on horse operations include stockpiling for disposal or land application of
unprocessed materials ((Cotton, D. personal communication, 2008); NAHMS, 1998). A poorly
managed manure pile can harbor intestinal parasites, provide a breeding ground for flies and
produce offensive odors (Yamulki, 2006). Runoff from improperly stored manure can quickly
become a potential environmental contaminate as it carries soluble nutrients, pathogens and
organic particles into the water cycle via surface runoff or by leaching into groundwater
(Yamulki, 2006). Land application of fresh manure can also generate large amounts of ammonia,
carbon dioxide, methane, and nitrous oxide, which potentially could be damaging to the
environment (Yamulki, 2006). Management of horse stall material (feces and urine, mixed with
soiled bedding) could be a beneficial tool for the horse industry. Treatment through composting
could provide a means of reducing the environmental impact of horse manure by reducing the
total volume of materials that need to be disposed of, destroying parasites and weed seeds, and
reducing runoff risk by stabilizing nutrients into organic forms.
One of the biggest obstacles in successfully composting horse stall materials, which is not
generally encountered with other livestock manures, is the high carbon content of bedding. The
optimal ratio of carbon to nitrogen (C:N) to support microbial decomposition of organic
materials is 25-30:1 (Rynk et al., 1992). By itself, horse manure is already near the ideal C:N
(ASAE, 2005). In contrast, the C:N of common beddings used in stalls ranges from 30:1 for

84
straw or hay to 950:1 for wood shavings. When bedding is combined with manure, the C:N can
often exceed 130:1 (Cotton et al., 2006). A high C:N in manure and bedding removed from horse
stalls has been shown to slow the composting process (Swinker et al., 1998). This is thought to
be due to the depletion of available nitrogen, with a subsequent reduction in microbial growth
and decomposition of organic materials (Swinker et al., 1998). Amending horse stall materials
with nitrogen may facilitate faster and more complete decomposition by supporting the
microorganisms involved in composting. Dilling and Warren (2007) reported the use of urea as a
nitrogen amendment did not enhance decomposition of horse stall materials over 84 d of
composting. The authors speculated that the rapid utilization of urea by microorganisms may
have resulted in an exponential increase in microorganism populations without additional
nutrient supply for continued population sustainability.
The most common nitrogen amendment is urea, mainly due to its low cost and high
nitrogen content (46% N). Urea is extremely soluble in water at high temperatures and rapidly
hydrolyses to ammonium. At high temperatures under alkaline conditions the ammonium that
makes up urea readily converts to ammonia and carbon dioxide, which can be lost through
volatilization (Sartain and Kruse, 2001). Dilling and Warren (2007) reported that nitrogen loss
during composting was greatest in stall materials amended with urea at an optimal C:N ratio of
30:1.
Slow release nitrogen sources such as polymer sulfur coated urea (PSCU) or urea
formaldehyde (UF) may alleviate some of the negative affects found by Dilling and Warren
(2007) while composting horse stall material. PSCU is manufactured by coating hot urea with
molten sulfur and sealing with polyethylene oil. Nitrogen is released when the sealant is broken
or by diffusion through pores in the coating. Thus, the rate of release is dependent on the

85
thickness of the coating or the sealant weight. PSCU is broken down by microorganisms, as well
as chemical and mechanical action. The nitrogen in PSCU is released more readily in warm
temperatures and dry soils (Schwab et al., 2005). The nitrogen product of a condensation
reaction between urea and formaldehyde is UF. When used as fertilizer, approximately one third
of the total nitrogen in UF is available in the first few weeks, another third in a few months, and
the remaining portion in 1 to 2 years after land application (Kaempffe and Lunt, 1967). The
nitrogen in UF is released primarily by microbial action. Factors affecting microbial activity,
such as medium temperature, moisture, pH and aeration will affect nitrogen release (Kaempffe
and Lunt, 1967).
Conditions during composting include high temperature, moisture and pH-all of which are
optimal catalysts for the conversion of ammonium to ammonia and carbon dioxide. Therefore,
the use of urea for composting horse stall materials may not be the most efficient nitrogen
source. The objective of this study was to evaluate the use of various slow release nitrogen
sources as amendments and their ability to facilitate composting of horse stall material
containing pine wood shavings bedding. Use of slow release nitrogen sources, such as PSCU and
UF as an amendment for carbon-rich horse stall materials may prolong microbial proliferation,
thereby increasing the rate and extent of material decomposition.
Materials and Methods
Experimental Design
To evaluate the effects of slow-release nitrogen amendments on the composting of horse
stall materials, the addition of 1) UREA (46-0-0), 2) PSCU (Poly-S®, Scott’s, Marysville, Ohio;
37-0-0), or 3) UF (38-0-0) was compared to 4) a control treatment consisting of unamended stall
materials (CON). All composting was performed in a concrete-based, 8-bin system (each bin
measuring 3 m x 3 m) housed under roof cover. Horse manure and pine shavings bedding was
86
removed daily from stalls occupied by horses, weighed, and amassed in an assigned bin over a 7-
d period. After the 7-d amassing phase, materials were amended with nitrogen to a C:N ratio of
25:1 (as needed), mixed with a front-end loader, and the trial initiated (d 0). A new batch of stall
materials would then be amassed into a separate assigned bin. This schedule continued until 4
bins had been initiated. Active aeration was provided by mixing and/or moving materials with a
front end loader according to the following schedule: At d 0-30, materials were mixed within
their original bin every 7 d. At d 30-60, materials were moved to another randomly assigned bin
at 14-d intervals. At d 60-120, materials were moved to another randomly assigned bin at 30-d
intervals. When materials completed this schedule, they had been composted for 120 d. Three
replicates of each of the four treatments were performed, with treatments randomly distributed
throughout the trial period of September 2006 through September 2007. Compost temperature
and oxygen content were measured 3 d wk-1 and moisture content was adjusted as needed to
maintain 50-60% moisture. Representative samples of stall materials were obtained at d 0, 30,
60, 90 and 120.
The amount of urea, PSCU or UF needed to achieve the desired C:N ratio of (25:1) for
nitrogen amended treatments was determined using the formula described by Fitzpatrick (1993):
(Cstall) - (Desired C:N)(Nstall) Ureaadd = ______________________________________ [Equation 4-1] (Nurea)(Desired C:N) - (Curea)
Where Ureaadd = kg urea, PSCU or UF to be added per 1 kg stall material; Cstall=kg carbon in 1
kg stall material; Nstall = kg nitrogen in 1 kg stall material; Curea=kg carbon in 1 kg urea; and
Nurea=kg nitrogen in 1 kg urea. The carbon and nitrogen content of stall materials were
determined from analyses performed on random samples obtained during the 7-d amassing phase
prior to the addition of nitrogen amendment.
87
Data Collection and Analyses
Temperature of compost was determined using a bi-metal dial thermometer with an 54.7
cm stem (Omega model B(-17-121°C)-45.7cm). Temperature was determined by inserting
thermometer 55 cm into center of pile, repeated in triplication and average temperature recorded.
Moisture content was determined after forced-air drying in an oven at 60°C until a constant
weight was achieved. Changes in the physical properties and chemical composition and of the
stall materials were determined on samples obtained at d 0, 30, 60, 90 and 120 using standard
analytical protocols recommended by the US Composting Council (Thompson, 2002). In
preparation for analysis, sub-samples of materials were freeze dried and ground to 1 mm particle
size. Moisture content was determined after forced-air drying in an oven at 60°C until a constant
weight was acheived. Total nitrogen (N) and total carbon (C) analyses were performed with the
Dumas combustion method (VarioMax N analyzer, Elementar Americas) (TMECC methods
04.02-D and 04.01-A (Thompson, 2002)). Organic matter (OM) was determined after heating for
12 h in a muffle furnace at 550°C (TMECC method 03.02-A (Thompson, 2002)). The pH was
determined on a slurry prepared with stall materials and dionized water according to AOAC
method 973.04 using a Thermo Orion Posi-pHIo SympHony Electrode and Thermo Orion 410-A
meter (Thermo Fisher Scientific, Waltham, MA). Nitrate (NO3) was determined by RQflex
Reflectometer method (EMD Chemicals Inc., Nitrate in Waste Water, 1995, Gibbstown, NJ).
Ammonia (NH3) was determined by distillation method (AOAC 941.04). Phosphorus (P) and
potassium (K) were determined by acid extraction and analysis by inductively coupled plasma
radial spectrometry (Thermo IRIS Advantage HX, Thermo Fisher Scientific, Waltham, MA).
The neutral detergent fiber (NDF), acid detergent fiber (ADF) and lignin content were
determined using the ANKOM A200 filter bag technique (AOAC 973.18(B-D)). The
determination of pH, NO3, NH3, P, K, NDF, ADF and lignin was performed at Dairy One

88
Laboratory, Ithaca, NY. Population densities of several microbial groups (aerobic, anaerobic,
pseudomonas, nitrogen-fixing, actinomycetes, and fungi) were determined at all 30-d sampling
intervals by plate counts on semi-selective media (BBC Laboratories, Inc., Tempe, AZ).
Ambient temperature and rainfall were recorded weekly from the Alachua Florida Automated
Weather Network.
Nutrient data from compost piles were transformed using mass balance estimates. Total
mass balance estimates for each nutrient (i.e., N, NO3, NH3, P, K, NDF, ADF, lignin and C) were
determined using the formula described by Larney et al. (2006):
Mass balance (%) = 1 – ((Nutrientfconc x DMfmass)/(Nutrienticonc x DMimass))*100 [Equation 4-2]
Where mass balance = the percent change in the specified nutrient; Nutrienticonc = the initial
concentration (mg kg-1) of the nutrient; DMimass = the initial dry matter (kg) of the stall materials;
Nutrientfconc = the final concentration (mg kg-1) of the nutrient; and DMfmass = the final dry matter
(kg) of the composted stall materials. Loss of a nutrient is denoted by a positive mass balance
value, while a gain in a nutrient has a negative value.
Thermal unit days were determined using the formula described by Ring et al. (1983):
Thermal days = Temperaturecomp – Temperaturethreshold [Equation 4-3]
Where thermal days = the number of days where compost is at or above the specified
temperature threshold; Temperaturecomp= temperature (°C) of compost; Temperaturethreshold=
specified temperature (°C). Whenever, the Temperaturecomp= is less than the threshold, the
thermal day is set equal to zero. Whenever, the Temperaturecomp= is greater than the threshold,
the thermal day is set equal to one.

89
Statistical Analyses
Statistical analysis of each variable was performed as an ANOVA using the MIXED
procedure of SAS (V. 9.1, SAS Inst., Inc., Cary, NC). Nutrient data were transformed by mass
balance estimates to account for mass reduction using the equation 4-2. The WOOD piles were
further partitioned into seasons (summer: May - September; winter: December – April) to
analyze for seasonal effects. The model included treatment, time and treatment x time
interactions as fixed variables. The LSMEANS procedure was used to compare treatment means
and separation of means was performed using PDIFF. The effects of N amendment (CON vs.
UREA, PSCU and UF) were determined by use of contrast analysis. Contrast analysis was also
used to compare UREA vs. slow release nitrogen sources (PSCU and UF). Numbers of microbial
populations were log-transformed (log10 CFU gdw-1) and analyzed by ANOVA as described
above for other variables. For all analyses, a P-value less than 0.05 was considered significant,
whereas P-values less than 0.10 was discussed as a trend. Data were presented as mean ± SE.
Results
Weather Conditions
During the 52-wk trial period (September 2006 – September 2007), the mean daily
ambient temperature ranged from -7.2 to 35.5°C with an average temperature of 19.3°C. For
summer months (May – September), mean daily ambient temperatures ranged from 8.2 to
35.5°C and averaged 24.3°C. For winter months (December – April), mean daily ambient
temperatures ranged from -7.2 to 30.7°C and averaged 14.9°C.
Composting Temperatures and Effect of Season
Composting temperatures differed by treatment (P<0.0001), with the highest mean
temperature observed in CON (55±0.5°C), followed by UREA (54±0.7°C), PSCU (53±0.6°C)
and UF (52±0.6°C). In most cases, maximum composting temperatures required to destroy
90
pathogens and parasites (55°C) and weed seeds (63°C) (USDA, 2002) were reached within the
first 2 wks of composting. However, two of the twelve piles (one replicate for PSCU and UF) did
not reach temperatures high enough to destroy weed seeds and parasites. With the exception of
these two piles, all treatments had sufficient thermal unit days above 55°C for 3 d and 63°C for 5
d to destroy pathogens and weed seeds (Figure 4-1). Thermal unit days were affected by
treatment (P<0.0001), with UF having the least number of days above critical temperatures
compared to CON, UREA and PSCU (P<0.001). Stall materials amended with UF experienced
the fewest days above 55°C (P<0.001) and materials amended with urea remained above 63°C
for more days (P<0.0001) compared to other treatments. After 120 d of composting, the
temperature of materials remained above ambient temperature, in all treatments. Across all
treatments, composting conducted in the summer months generated higher mean temperatures
(P<0.0001) compared to the winter months.
Physical Properties and Chemical Composition of Compost
Composting reduced (P<0.01) the DM mass of stall materials by 25±5.0% and was not
affected by N amendment. The OM of stall materials decreased (P<0.01) by 26±8.0% after 120 d
of composting but was not affected by N amendment. The average concentration of NDF (854±9
g kg-1), ADF (705±14 g kg-1) and lignin (243±11 g kg-1) was not affected by N source or
composting. At d 0 the pH of stall materials was not affected by N amendment (7.5±0.1). After
120 d of composting, the pH decreased (P<0.0001) in treatments amended with N (PSCU, UF
and UREA) (6.4±0.2) compared to CON (7.2±0.2).
The concentrations of N, NO3, NH3, P and K at d 0 (after N amendment), d 120, and the
overall all treatment mean are presented in Table 4-1. The concentration of N was greater
(P<0.01) in treatments that received N amendment compared to CON and was not affected by
composting. At d 0, there were no differences in NO3 concentration between treatments.
91
However after 120 d of composting, treatments amended with N had increased NO3
concentrations compared to CON (P<0.01). Unamended CON treatments had a NH3
concentration of 0 on d 0 and 120 d after composting. Overall, slow release N treatments had
increased levels of NH3 when compared to UREA (P<0.0001). The average concentration of P
(1.5±0.1 g kg-1) and K (5.6±0.4 g kg-1) was not affected by N source or composting.
Mass Balance Estimates for Nutrients
Mass balance of N, NO3, NH3, P, K, NDF, ADF, lignin and C are presented in Table 4-2.
A reduction in N occurred in all N amended treatments with UREA having the largest loss
compared to slow release N sources (P<0.01). A gain in N was measured in CON, however it
was not significantly different than PSCU or UF. The largest gain in NO3 was observed for
PSCU, followed by UREA and UF. The lowest gain in NO3 was exhibited by CON. The
materials amended with slow release N had a gain (P<0.05) in NH3. The largest gain was
exhibited by PSCU followed by UF (P<0.01), however a reduction in NH3 (P<0.001) occurred in
UREA. The source of N did not affect reduction of P (37±5 %) and K (32±9 %) after 120 d of
composting. The reduction of NDF tended (P<0.10) to be influenced by N amendment, with
UREA having the lowest decrease. The ADF content of stall materials were reduced with CON
having the highest reduction compared to N amended treatments (P<0.01). A reduction of lignin
occurred in UF and CON, yet a numerical increase was exhibited by PSCU and UREA.
However, CON, PSCU and UREA were not significantly different from each other. Composting
reduced (P<0.05) the C of stall materials, with UF having the largest reduction compared to
CON, PSCU and UREA.
Microbial Populations
The changes in microbial populations pooled across all treatments during 120 d of
composting are presented in Figure 4-2. Numbers of aerobic bacteria, anaerobic bacteria,

92
pseudomonas, nitrogen-fixing bacteria, actinomycetes, and fungi present during composting
were similar in all treatments. The microbial population essentially followed the temperature
curve, with the highest number of microbes observed at the start of composting (P<0.05).
Aerobic, anaerobic, pseudomonas, and nitrogen-fixing bacteria decreased from d 0 to d 60
(P<0.05), then leveled off after 120 d of composting. Fungi numbers began to increase from d 60
to d 120 when pile temperatures were no longer above 45°C (P<0.05). Actinomycetes numbers
remained constant throughout 120 d of composting.
Discussion
Results of the present study demonstrated that horse stall materials containing wood
bedding can reach temperatures required to destroy parasites and weed seeds within the first 2
weeks of composting. Similar findings have been reported by others (Dilling and Warren, 2007;
Romano et al., 2006). During summer months, materials undergoing active composting
generated significantly higher temperatures than materials composted during winter months.
Larney et al. (2000) found similar results with volume loss of beef feedlot manure after
composting was increased during summer months compared to winter months.
Materials amended with UREA were exposed to temperatures above 60°C for a longer
period of time compared to materials amended with PSCU and UF (Figure 4-1). The nitrogen
within UREA is immediately available to microbes causing an explosion in growth and likely
resulting in higher composting temperatures. After approximately 60 days, unamended materials
and those amended with UREA began to cool, suggesting that available nitrogen may have
become a limiting factor for microbial activity. In contrast, materials amended with slow release
urea (PSCU or UF) continued to experience increases in temperature beyond day 60. Extended
high temperatures suggest that microbial activity is prolonged compared to stall material
amended with UREA or unamended materials. Composted materials are considered to be mature

93
if the declining temperature reaches ambient temperature (Rynk et al., 1992). In the current
study, composting temperatures remained elevated above ambient temperatures in all treatments,
suggesting that decomposition was incomplete and more time was needed to achieve maturity.
On average, the DM mass of stall materials was reduced by 25% with composting, but was
not affected by nitrogen amendment. A similar loss of mass after composting has been observed
by other researchers (Dilling and Warren, 2007; Eghball et al., 1997; Romano et al., 2006; Rynk
et al., 1992). A loss of total nitrogen occurred during composting with a greater loss in materials
amended with PSCU or UREA (Table 4-2). A greater loss of nitrogen from the urea treatment
likely resulted from volatilization of more readily available nitrogen. Urea can be rapidly
converted to ammonia, which then volatilizes into the atmosphere (Curtis et al., 2005). The rate
of conversion of urea to ammonia is influenced by factors such as moisture content, temperature,
pH and urease activity. Such conditions are at optimal levels during composting (Parkinson et
al., 2004). Michel et al., (2004) reported nitrogen loss of 8 to 43% for dairy manure and straw
bedding amended with urea. In contrast, slow release nitrogen sources, such as PSCU and UF,
release nitrogen based on microbial action. As a result, nitrogen is available as microorganisms
are proliferating and able to utilize the nitrogen, causing lower volatilization rates. Reducing the
loss of nitrogen can increase the overall value of compost as a fertilizer by preserving added
nitrogen. In addition, discouraging volatilization of nitrogen as ammonia will decrease potential
atmospheric pollutants.
The proportion of nitrate increased in response to composting, particularly in materials
amended with PSCU and UF (Table 4-2). A rise in nitrate resulted from the nitrification of
ammonia present when the materials began to cool (Mupondi et al., 2006). Ammonia was not
present in unamended stall materials before or after 120 d of composting (Table 4-1). This

94
finding is not surprising as the materials were not amended with nitrogen; further any residual
ammonia from urine would likely have been volatilized within hours of excretion by the horse
(Pratt et al., 2000), leaving no residual ammonia by the time materials had been amassed for 7
days prior to the start of composting. Compost amended with urea had a reduction in ammonia;
while materials amended with slow release nitrogen had a gain of ammonia after 120 days of
composting (Table 4-2). The reduction of ammonia in materials amended with urea was probably
lost due to atmospheric volatilization or converted to nitrate through nitrification. The gain of
ammonia in materials amended with slow-release nitrogen demonstrates the breakdown of urea
to ammonium carbonate and eventually to ammonia; yet conservation of ammonia occurred
because of the slow release mechanism.
Composting is a dynamic process carried out by a rapid succession of mixed microbial
populations. The main groups of microorganism involved are bacteria, including actinomycetes,
and fungi (Golueke, 1991). At the beginning of the composting process mesophilic bacteria
predominate, but thermophilic bacteria take over and thermophilic fungi appear when the
temperature increases to over 40°C. When the temperature exceeds 60°C, microbial activity
decreases dramatically, but after the compost has cooled mesophilic bacteria and actinomycetes
again dominate (McKinley and Vestal, 1985; Strom, 1985). During this study, the total aerobic
bacteria, anaerobic bacteria and pseudomonas counts were highest at the beginning of
composting (Figure 4-2). It is common for bacterial counts to be high in the beginning of
composting when using manure as a substrate (Tiquia et al., 2002). Because stall materials were
amassed over a 7-day period prior to the start of composting, this may have permitted a rapid rise
in microbial activity. In fact, pile temperatures had already reached thermophilic levels by the
time materials started on trial. The numbers of bacteria generally followed the temperature
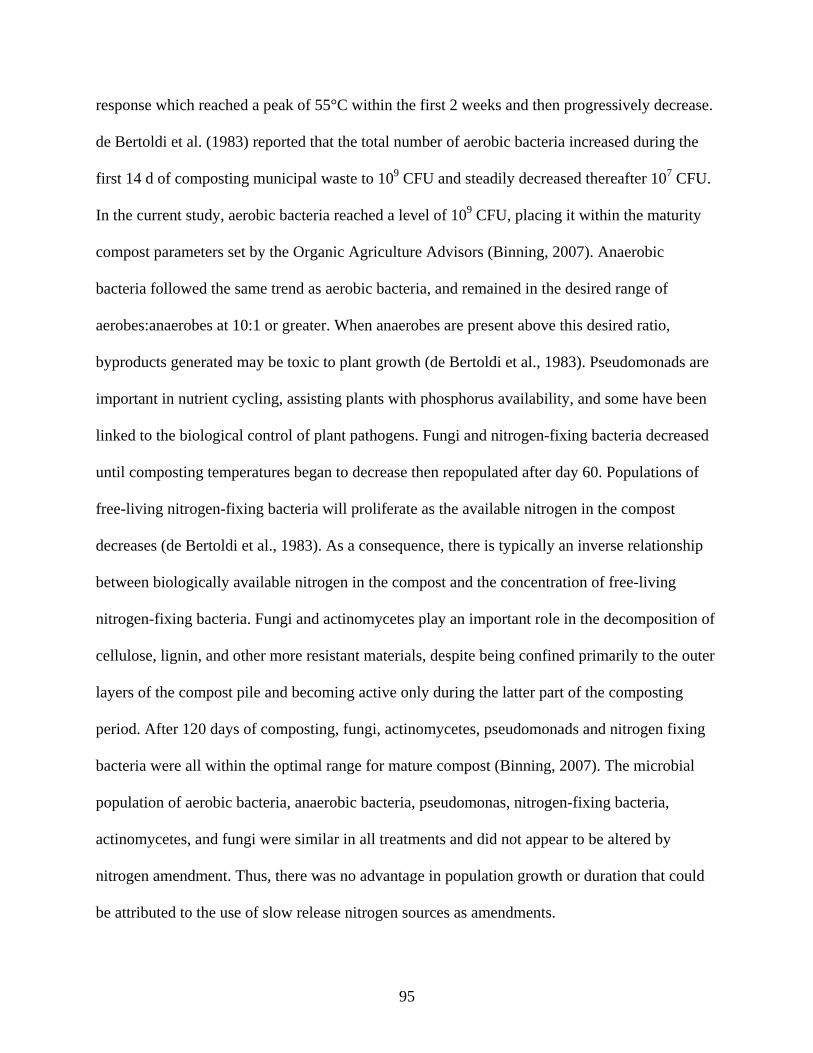
95
response which reached a peak of 55°C within the first 2 weeks and then progressively decrease.
de Bertoldi et al. (1983) reported that the total number of aerobic bacteria increased during the
first 14 d of composting municipal waste to 109 CFU and steadily decreased thereafter 107 CFU.
In the current study, aerobic bacteria reached a level of 109 CFU, placing it within the maturity
compost parameters set by the Organic Agriculture Advisors (Binning, 2007). Anaerobic
bacteria followed the same trend as aerobic bacteria, and remained in the desired range of
aerobes:anaerobes at 10:1 or greater. When anaerobes are present above this desired ratio,
byproducts generated may be toxic to plant growth (de Bertoldi et al., 1983). Pseudomonads are
important in nutrient cycling, assisting plants with phosphorus availability, and some have been
linked to the biological control of plant pathogens. Fungi and nitrogen-fixing bacteria decreased
until composting temperatures began to decrease then repopulated after day 60. Populations of
free-living nitrogen-fixing bacteria will proliferate as the available nitrogen in the compost
decreases (de Bertoldi et al., 1983). As a consequence, there is typically an inverse relationship
between biologically available nitrogen in the compost and the concentration of free-living
nitrogen-fixing bacteria. Fungi and actinomycetes play an important role in the decomposition of
cellulose, lignin, and other more resistant materials, despite being confined primarily to the outer
layers of the compost pile and becoming active only during the latter part of the composting
period. After 120 days of composting, fungi, actinomycetes, pseudomonads and nitrogen fixing
bacteria were all within the optimal range for mature compost (Binning, 2007). The microbial
population of aerobic bacteria, anaerobic bacteria, pseudomonas, nitrogen-fixing bacteria,
actinomycetes, and fungi were similar in all treatments and did not appear to be altered by
nitrogen amendment. Thus, there was no advantage in population growth or duration that could
be attributed to the use of slow release nitrogen sources as amendments.

96
Conclusion
The results from this study indicate that slow release nitrogen sources reduced the loss of
nitrogen during composting of horse stall material, but did not necessarily enhance the
decomposition process compared to urea. Slow release nitrogen sources did not sustain
thermophilic conditions any longer than the unamended compost, as evidenced by a plateau of
growth by day 60 in all treatments, which correlated with decreases in composting temperatures.
Compost amended with nitrogen contained much higher concentrations of inorganic nitrogen
(nitrate and ammonia), compared to the non-amended material. Nitrate and ammonia have the
potential to pollute surface and groundwater if applied in excess of agronomic rates onto
pastures. At the same time nitrogen amended compost may increase the value of compost as a
fertilizer, because nitrogen is in a plant available form. In contrast, unamended compost contains
mostly organic sources of nitrogen that must be mineralized before becoming available for plant
uptake. The use of slow release nitrogen amendments may decrease the risk of atmospheric
pollution and increase the value of the composted horse stall material as a fertilizer source.
However, more research is needed to determine an economically feasible method to further
decompose carbon-rich horse stall materials and generate a higher quality end product.
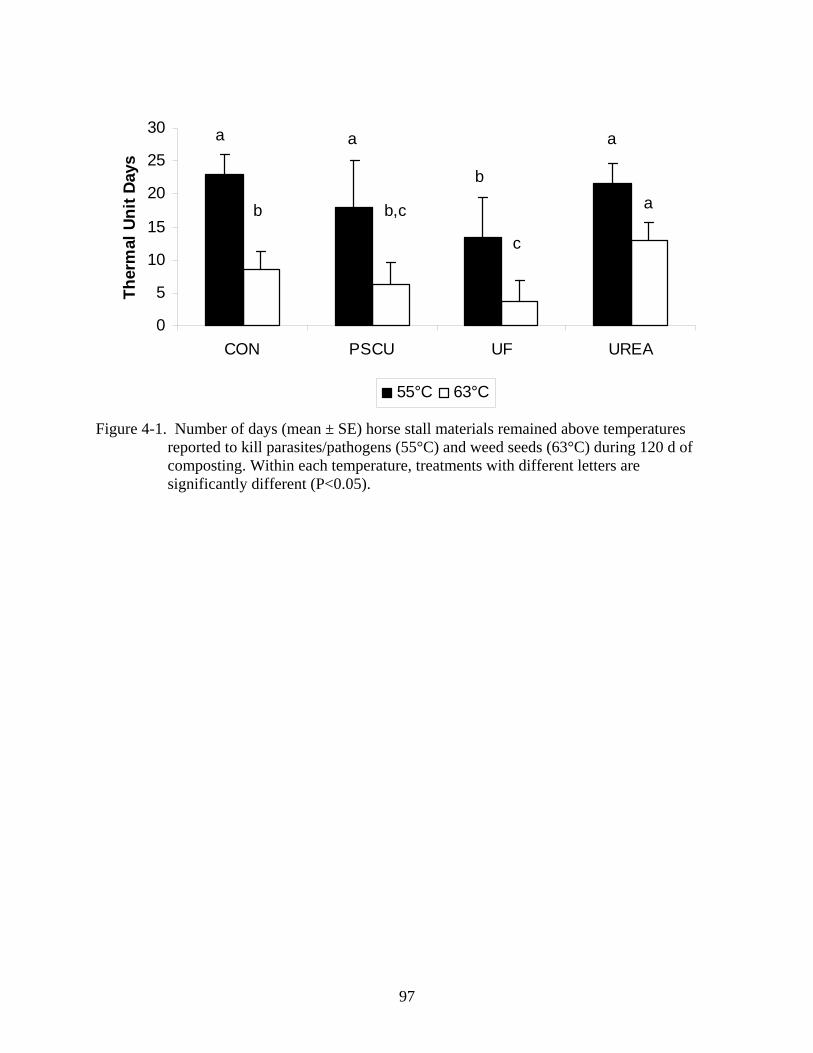
97
0
5
10
15
20
25
30
CON PSCU UF UREA
Ther
mal
Uni
t Day
s
55°C 63°C
a
b
aa
a
c
b,cb
Figure 4-1. Number of days (mean ± SE) horse stall materials remained above temperatures
reported to kill parasites/pathogens (55°C) and weed seeds (63°C) during 120 d of composting. Within each temperature, treatments with different letters are significantly different (P<0.05).

98
5678
9101112
0 30 60 90 120
log 1
0 (CF
U gd
w-1
)
Aerobic Anaerobic PsedumonasN-fixing Actinomycetes Fungi
Figure 4-2. Changes in microbial populations present in horse stall material during 120 d of
composting. Data represents pooled means across all treatments.
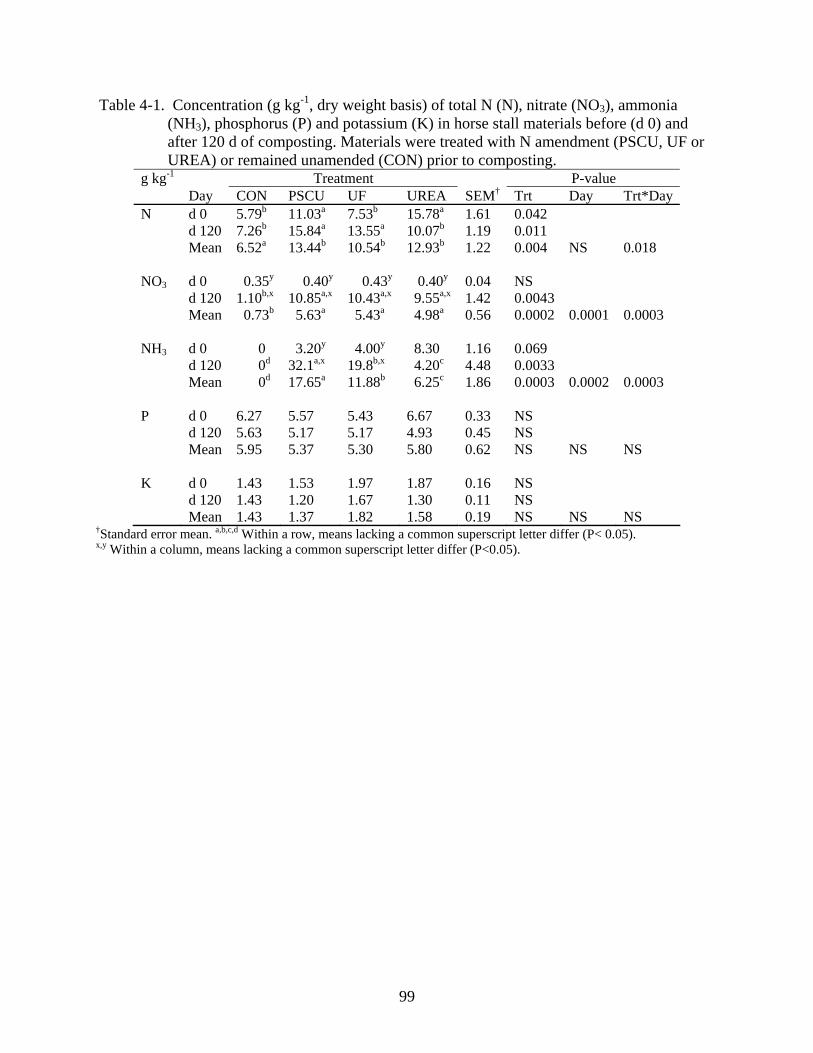
99
Table 4-1. Concentration (g kg-1, dry weight basis) of total N (N), nitrate (NO3), ammonia (NH3), phosphorus (P) and potassium (K) in horse stall materials before (d 0) and after 120 d of composting. Materials were treated with N amendment (PSCU, UF or UREA) or remained unamended (CON) prior to composting.
g kg-1 Treatment P-value Day CON PSCU UF UREA SEM† Trt Day Trt*DayN d 0 5.79b 11.03a 7.53b 15.78a 1.61 0.042 d 120 7.26b 15.84a 13.55a 10.07b 1.19 0.011 Mean 6.52a 13.44b 10.54b 12.93b 1.22 0.004 NS 0.018 NO3 d 0 0.35y 0.40y 0.43y 0.40y 0.04 NS d 120 1.10b,x 10.85a,x 10.43a,x 9.55a,x 1.42 0.0043 Mean 0.73b 5.63a 5.43a 4.98a 0.56 0.0002 0.0001 0.0003 NH3 d 0 0 3.20y 4.00y 8.30 1.16 0.069 d 120 0d 32.1a,x 19.8b,x 4.20c 4.48 0.0033 Mean 0d 17.65a 11.88b 6.25c 1.86 0.0003 0.0002 0.0003 P d 0 6.27 5.57 5.43 6.67 0.33 NS d 120 5.63 5.17 5.17 4.93 0.45 NS Mean 5.95 5.37 5.30 5.80 0.62 NS NS NS K d 0 1.43 1.53 1.97 1.87 0.16 NS d 120 1.43 1.20 1.67 1.30 0.11 NS Mean 1.43 1.37 1.82 1.58 0.19 NS NS NS
†Standard error mean. a,b,c,d Within a row, means lacking a common superscript letter differ (P< 0.05). x,y Within a column, means lacking a common superscript letter differ (P<0.05).

100
Table 4-2. Mass balance estimates† of total nitrogen (N), nitrate-N (NO3), ammonia-N (NH3), phosphorus (P), potassium (K), neutral detergent fiber (NDF), acid detergent fiber (ADF), lignin and total carbon (C) in unamended horse stall materials (CON) or materials treated with nitrogen amendment (PSCU, UF or UREA) prior to composting for 120 d.
Treatment (%) p-value CON PSCU UF UREA SEM‡ Trt N -2.3b 4.4b 7.2b 56.25a 9.0 0.006 NO3 -113a -2654d -734b -1724c 370 0.001 NH3 0a -718c -257b 72.3a 118.5 0.001 P 31.4 31.8 46.0 46.4 4.6 NS K 49.4 35.1 62.7 38.0 6.1 NS NDF 31.1a 34.5a 60.4a 8.6b 8.3 0.10 ADF 44.0a 9.8b 17.9b 17.8b 4.7 0.03 Lignin 7.9b -11.8b 50.3a -12.6b 9.2 0.03 C 26.5b 24.5b 53.6a 38.2b 4.4 0.03 †Calculated as: 1– ((Nutrient
fconc x DMfmass)/ (Nutrient iconc x DM
imass)) *100. Positive values represent loss, while negative values represent gain.‡Standard error mean. a,b,c Means within a row with different letters are significantly different (P<0.05).

101
Table 4-3. The pH in unamended horse stall materials (CON) or materials treated with nitrogen amendment (PSCU, UF or UREA) during composting for 120 d.
Treatment p-value Day CON PSCU UF UREA SEM† Trt Day Trt*Day pH d 0 7.1 7.5x 7.5x 7.8x 0.1 NS d 30 7.3 7.9x 7.4x 7.8x 0.1 NS d 60 7.1 6.8y 6.6y 6.9y 0.1 NS d 90 7.4 6.3y,z 6.3y 6.9y 0.2 0.091 d 120 7.2 6.1z 6.2y 6.8y 0.2 0.072 Mean 7.1 6.8 6.8 7.3 0.2 NS 0.0001 0.042 †Standard error mean. x,y,z Within a column, means lacking a common superscript letter differ (P<0.05).
102
CHAPTER 5 CHARACTERISTICS OF SOIL AND NEWLY ESTABLISHED BAHIAGRASS FORAGE IN RESPONSE TO SOIL INCORPORATION OF UNPROCESSED AND COMPOSTED HORSE
STALL MATERIALS
Introduction
Florida soils are generally sandy and low in organic matter concentration (USDA, 2006).
Such soils have a low nutrient and water retention capacity and low natural fertility. Therefore,
fertilizers are commonly utilized in Florida to enhance soil fertility. Fertilization increases the
total plant biomass produced, and accelerates plant residue decomposition, thereby increasing the
availability of nutrients from residues (Warman and Termeer, 2005; Cadisch et al., 1994;
Gijsman et al., 1997). In pasture systems high dry matter yields require a large nutrient supply,
and nitrogen (N) has been deemed as the most important nutrient controlling grass productivity
(Jarvis et al., 1995; Whitehead and Raistrick, 1990; Oliveira et al., 2001).
Inorganic fertilizers are the most widely used source of nutrients to support plant growth,
mainly due to high nitrogen content and, consequently, lower costs associated with storage,
freight and utilization. The nutrients contained in inorganic fertilizers (mainly N, phosphorus (P)
and potassium (K)) are in forms that are readily available to plants; however, this also makes
them a greater potential risk for surface and groundwater contamination. In the early 1990s, the
United States Environmental Protection Agency found nitrate contamination in many Florida
drinking water wells. Some urban and rural wells exceeded the nitrate maximum contaminant
level (MCL), suggesting that agricultural and fertilizer application practices might be
contributing to increased nitrate levels in the groundwater (Parsons and Boman, 2006). The
Florida Department of Agriculture and Consumer Services carried out a drinking water well
analysis throughout the state and found that 63% of the 3,949 drinking water wells sampled, had
detectable nitrate levels and 15% had nitrate-N levels above the 10 mg L-1 MCL (Parsons and

103
Boman, 2006). Nitrogen contamination of groundwater and wells can cause a medical condition
in people known as methemoglobinemia, whereby nitrite replaces oxygen in hemoglobin in the
blood. With increased levels of methemoglobin, oxygen levels in the blood decrease, resulting in
cyanosis, or oxygen starvation (Hubbard et al., 2004). Leaching of P has also been reported in
poorly drained soils high in organic matter (Sharpley et al., 1994) and regions with a long-term
history of organic manure applications (Breeuwsma et al., 1995). When nutrients, such as N and
P, exceed the loading rate for a body of water, eutrophication can occur (Bushee et al., 1998). Up
to 50% of the N in fertilizer can also be lost due to volatilization of ammonia, especially when
high rates are applied to the surface of pastures (Whitehead and Raistrick, 1990; Primavesi et al.,
2001; Martha, 2003). Loss of ammonia-N due to volatilization is reduced by incorporation of
fertilizer into the soil, when compared to surface application (Martha et al., 2004).
The addition of organic matter has been found to enhance the overall ability of soil to
retain both nutrients and water (Rynk et al., 1992). These are positive effects, both with regard to
enhancing soil fertility and protecting groundwater resources from potential contaminants that
might leach through the soil. The use of materials rich in organic matter, such as horse manure
and compost as fertilizer has gained a renewed interest as a management tool for recycling
nutrients. Yet, there are certain limitations when using fresh manure as a fertilizer source that
should be considered, including land and seasonal constraints on application, spreading of weed
seeds and intestinal parasites, fly and odor production, suppression of forage growth and the
potential for contamination of surface and groundwater (James, 2003; Lyons et al., 1999; Major
et al., 2005; Watson et al., 1998).
Treating manure through composting could provide a means of reducing the environmental
impact of horse manure by reducing the total volume of materials (Larney et al., 2000),

104
destroying parasites and weed seeds (Romano et al., 2006; Larney et al., 2003; Larney and
Blackshaw, 2003), reducing odor production compared to stockpiled manure (Li et al., 2007),
and generating stabilized end product for on- and off-farm use while lowering nonpoint source
pollution from horse farms (Michel et al., 2004). Composted manure has successfully been used
as a soil amendment for cropland, landscaping and gardening, and nursery potting mixes (Lynch,
2004). Composts have been found to enhance soil fertility, increase crop yields (Dick and
McCoy, 1993) and reduce diseases caused by soilborne plant pathogens (Hoitink and Fahy,
1986; Hoitink and Boehm, 1999). Many studies have demonstrated a positive effect of land
application of compost on forage, usually resulting in yields comparable to those produced by
inorganic fertilizer (Catroux et al., 1981; Hornick et al., 1984; Davis et al., 1985; Warman and
Termeer, 1996; Reider et al., 2000; Tiffany et al., 2000). In the few instances where a negative
response to compost application has been observed, reduced yields or negative effects on soils or
crops have been attributed to high carbon to nitrogen ratios (C:N), excess metals, high soluble
salts, or extremely high application rates of the compost (Warman and Termeer, 2005).
Utilization of compost could reduce the amount of inorganic fertilizer needed without decreasing
forage yield, and in turn, decrease the potential for nitrate contamination of surface and
groundwater.
Most investigations on the response of crops or pasture to compost application have
utilized composts prepared from cattle, swine or poultry manures. The objective of this study
was to compare the soil incorporation of unprocessed and composted horse stall material on soil
characteristics and establishment of Argentine bahiagrass (Paspalum notatum) in northern
Florida.
105
Materials and Methods
Site Description
A field study was conducted at the University of Florida, Institute of Food and Agricultural
Sciences, Horse Teaching Unit in Gainesville, Florida in 2006. A half hectare field was prepared
by herbicide application followed by tilling to remove any existing plant biomass prior to this
study. The soil type was a Millhopper (loamy, siliceous, semiactive, hyperthermic Grossarenic
Paleudult) (USDA, 2006).
Experimental Design
Four fertilizer treatments were examined for their effects on the establishment of Argentine
bahiagrass (Paspalum notatum): inorganic fertilizer (INORG; %N-P-K of 16-4-8), unprocessed
stall material (STALL; 0.6-0.1-0.3), semi-stabilized stall material (SEMI; 1.0-0.2-0.4), and
composted stall material (COMP; 1.2-0.2-0.4). Stall material consisted of horse manure and pine
wood shavings bedding that had been removed during routine stall cleaning and either stockpiled
for 7 d (STALL) or amended with urea to achieve a C:N ratio of 30:1 and composted for either
42 d (SEMI) or 84 d (COMP) before use. The SEMI treatment was included to simulate short-
term stockpiling of stall material, which is commonly practiced on horse operations, prior to land
applying manure on pastures (Cotton, D. personal communication, 2008). After preparation of
the soil bed, treatments were land applied on 24 randomly assigned 36.5 m x 1.8 m plots, with 6
replications per treatment, in a complete random block design. Application rates were based on
plant N requirements (112 kg N ha-1) for establishment of Argentine bahiagrass and were split
into two applications, as recommended (Newman et al., 2008). Organic fertilizers (STALL,
SEMI and COMP) were applied at a rate of 112 kg N ha-1 prior to incorporation and seeding,
then adjusted to balance approximated 50% mineralization rates from organically bound N by
supplementing 56 kg N ha-1 with inorganic fertilizer 30 d after germination. Dry matter

106
application rate of STALL was 17.6 Mg ha-1 and COMP was 11.6 Mg ha-1 was incorporated to
obtain recommended N rates. INORG was applied at an overall rate of 112 kg N ha-1 (34 kg N
ha-1 initial application; 78 kg N ha-1 30 d after germination). All materials were incorporated into
soil within 24 h after initial application. Bahiagrass was broadcast seeded at 34 kg ha-1 and
covered with 2.5 cm of soil. Water towers were placed onsite to provide proper moisture for
seedling germination. Mowing occurred after every harvest and material was removed from
plots.
Data Collection and Analysis
A biological assay was conducted on STALL, SEMI, and COMP prior to land application
to evaluate potential phytotoxicity. In vitro germination and root elongation tests were performed
with compost extract using United States Composting Council method 05.05-B (Thompson,
2001). Germination rates of cucumber seeds subjected to compost extract were compared to
seeds exposed to deionized water. Compost extracts were prepared from samples of STALL,
SEMI, and COMP obtained within 24 h and oven-dried to a constant weight. Stall materials were
mixed with deionized water in a 2:1 ratio (water: media, by weight) and allowed to stand for 3 hr
so that water could soak the media. The mixture was then filtered through Whatman #113 wet
strengthened filter paper and the extracts collected. Whatman filter papers were placed in 9-cm
petri dishes and moistened with 10 mL of compost extract. Ten cucumber (Cucumis sativus)
seeds were placed in each dish. Three replicates of each dish were preformed for each of the
STALL, SEMI and COMP stall materials. Deionized water served as the control. Petri dishes
were placed in a lighted area with lids left on to maintain adequate humidity. The germination
percentage was determined on d 3 and root elongation was measured on d 6.
Germination (%), root length (%) and germination index was determined using the
formulas described by Zucconi et al. (1981):

107
Germination (%) = (Germinatedsample / Germinatedcontrol) *100 [Equation 5-1]
Where Germination = the percentage of sample seeds germinated in proportion to the
control; where Germinatedsample= the average number of seeds germinated in the sample;
Germinatedcontrol = the average number of seeds germinated in the control.
Root length (%) = (Rootsample / Rootcontrol) *100 [Equation 5-2]
Where Root length = the percentage of length of root in proportion to the control; where
Rootsample = the average of root length in the sample; Rootcontrol = the average of root length in the
control.
Germination Index = (% Germination * % Root Length)/100 [Equation 5-3]
Soil samples were obtained at d 0 (prior to treatment), 30, 60 and 120. At each sampling
interval, 20 soil cores were randomly collected within each plot at a depth to 15 cm using a
stainless steel sampling probe. The cores within each plot were composited and oven dried at 65
°C for 7 d. Soil was analyzed for ammonium-N (NH4), pH, organic matter (OM), cation
exchange capacity (CEC) (calculation), and extractable phosphorus (P), potassium (K), calcium
(Ca), and magnesium (Mg). NH4-N was extracted from soils using a 1N KCl solution and
analyzed spectrophotometrically (Markus et al., 1985; Dorich and Nelson, 1983). Soil pH was
determined in a 1:2 soil:water extract of the soil using deionized water. Samples were stirred and
allowed to equilibrate for a minimum of 30 minutes after adding the water. The pH was
determined, using a hydrogen selective electrode (Schofield and Taylor 1955). Soil organic
matter (OM) was determined by loss-on ignition method (Magdoff et al., 1996). Double acid
Mehlich I extraction was preformed to determine P, K, Ca, and Mg and analyzed by inductively
coupled argon plasma (ICP) spectrometry (SRIEG, 1983) at all collection points. Soil analysis

108
was performed by Agro Services International Laboratory (Orange City, FL) on a dry weight
basis.
Forage samples were collected by hand clipping on d 30, 45, 60, 90 and 120. A 76 cm wire
cable hoop (76 cm diameter) was randomly placed in each plot and all forage material within the
hoop was removed to a height of 10 cm. This procedure was repeated in triplicate for each plot to
determine dry matter. Plots were individually mowed and material was collected to obtain
representative samples for tissue analysis. Forage samples were dried to a constant weight in a
forced air oven at 65°C to determine dry matter (DM) yield. Forage samples were analyzed for
total N with the Dumas combustion method (VarioMax N analyzer, Elementar Americas)
(TMECC method 04.02-D (Thompson, 2002)). Total P was determined on samples that had been
ashed prior to sulfuric acid digestion and then quantified colorimetrically (PowerWave XS
spectrophotometer, Winooski, VT). Nutrient removal was determined using the formula
described by Butler and Muir (2006):
Nutrient removal (kg ha-1) = Nutrientconc * Yield [Equation 5-4]
Where nutrient removal = the amount of nutrient removed in relation to DM yield; Nutrientconc =
the concentration of nutrient (kg kg-1); Yield = the DM yield of forage (kg ha-1).
Crude protein (CP) was calculated as % N * 6.25 [Equation 5-5]
Statistical Analysis
Bioassay, forage and soil data were analyzed using the MIXED procedure of SAS (V.9.1,
SAS Inst., Inc., Cary, NC). Fertilizer treatment, time and treatment x time were included in the
model as fixed variables and block was named as a random variable. Soil data obtained on d 0
was used as a covariate to account for residual soil nutrient concentrations. Contrast analysis was
used to compare the performance of organic (STALL, SEMI, and COMP) vs. INORG fertilizers
and composted (SEMI and COMP) vs. unprocessed (STALL) fertilizers. The LSMEANS
109
procedure was used to compare treatment means and separation of means was performed using
Tukey’s test. For all analyses, P-values less than 0.05 were considered significant, whereas P-
values less than 0.10 were discussed as trends. Data are presented as mean ± SE, unless
otherwise stated.
Results
Bioassay
Germination rate of cucumber seeds was not affected by treatment with an average of
102%. Root length was inhibited by COMP (43%) (P<0.05) but was similar between SEMI
(136%) and STALL (121%). The Cucumber seed germination index was affected by compost
extract prepared from COMP, STALL and SEMI. The lowest germination index was observed
for COMP (45%) (P<0.05) but was similar between SEMI (129%) and STALL (128%). The
high germination index (>100%) noted for STALL and SEMI was due to a greater root length
compared to that observed when seeds were exposed to deionized water.
Forage
Dry matter yield, N and P concentrations at d 30 (after germination), 45, 60, 90 and 120,
and the overall all treatment mean are presented in Table 5-1. During this 40 wk study (May to
December 2006), mean daily ambient temperature ranged from 9 to 27°C and averaged 23°C.
The highest temperatures were recorded in August and the lowest in November. Total rainfall
during the trial was 42 cm, which is below the average of 127 cm (Black, 2003). The majority of
the rainfall occurred during June, July and August 2006. These unusually warm, dry conditions
may have impacted the cumulative forage yield. Of the five harvests collected, the highest mean
yield (1.36 ± 0.07 Mg ha-1) was observed in September (P<0.0001). Forage dry matter yield was
influenced the first 45 d after germination, with INORG having the highest mean yield and
STALL the lowest yield (P<0.01). Incorporation of horse stall material into soil, whether

110
unprocessed or composted, supported similar cumulative forage yield to that observed with
INORG. Cumulative forage yield over the 40-wk experiment ranged from 3.3 to 3.9 Mg ha-1.
Fertilizer source did not affect bahiagrass tissue N, which ranged from 20 to 25 g kg-1 or
crude protein ranged from 12 to 19 %. The highest forage N and crude protein concentration,
were observed during the month of July after 45 d of growth (P<0.0001) (Table 5-1). Tissue P
was not affected by fertilizer source, but was affected by time. The lowest tissue P in bahiagrass
was harvested during the month of July (3.7 ± 0.2 g kg-1) (P<0.0001) but increased in August
(4.3 ± 0.05 g kg-1) and remained elevated throughout the remainder of this study.
The amount of N and P removed, which is a function of tissue nutrient concentration and
dry matter yield, followed a similar trend to that of yield. Cumulative N (17 ± 1.1 kg ha-1) and P
(15 ± 0.7 kg ha-1) removed by bahiagrass was not affected by fertilizer source (Figure 5-3),
however as yield increased N and P removal increased as well.
Soil
Soil NH4-N, P, K, Ca, Mg, CEC, pH and OM at d 0 (prior to fertilization), d 30, 60 and
120, and the overall treatment mean are presented in Table 5-2. At d 0, prior to incorporation of
fertilizer, no differences existed between plots in any of the soil measurements. Across
treatments, soil NH4-N increased (P<0.0001) from 2.8±0.2 mg kg-1 at d 0 to 4.5±0.5 mg kg-1 at d
120. With the exception of K, fertilizer source had no effect on any soil measures. Soil pH, CEC,
Ca, K and extractable P decreased (P<0.05) during the trial period. Soil OM decreased between d
0 and d 30 (P<0.0001) but by d 120 was not different than that observed prior to fertilization.
Mean soil K was highest in STALL (P<0.05) and lowest in INORG (P<0.05), but similar
between SEMI and COMP.

111
Discussion
The bioassay conducted using cucumber seeds indicated that unprocessed and composted
and partially composted horse stall materials did not contain toxic levels of nutrients or organic
acids that would likely affect seed germination or plant growth. The lowest germination index
was observed with extract from composted stall materials. This finding varies from most reports,
where unprocessed manure is usually cited as having higher potential for phytotoxicity when
compared to composted manure (Wu et al., 2000; Emino and Warman, 2004). Germination rates
with stall material extracts did not differ from the deionized water control; rather the root length
had the biggest influence on germination index. The shorter root length observed in composted
stall material may have resulted from lower availability of organic nutrients in compost,
compared to the more soluble forms available from unprocessed or partially composted
materials.
Incorporation of horse stall material into soil, whether unprocessed or composted,
supported similar cumulative forage yield to that observed with inorganic fertilizer (Table 5-1).
However the rate of bahiagrass establishment fertilized with organic sources was decreased
compared to inorganic fertilizer. However, after day 60, yield was similar between all fertilizer
sources. Many studies have demonstrated the positive effect of land application of compost on
forage yields, usually resulting in yields that were comparable to yields produced by inorganic
fertilizer (Catroux et al., 1981; Tiffany et al., 2000; Warman and Termeer, 2005). Similar
findings have been reported by Reider et al. (2000) when applying dairy manure compost to corn
grain resulted in yields comparable to inorganic fertilizer. Perennial grass forage yield has also
been found to respond similarly with inorganic fertilizer and dairy manure compost (Muir et al.,
2001).
112
Summer forages cut for hay often have insufficient crude protein for ruminant diets when
inadequately fertilized with nitrogen (Ball et al., 1991). The crude protein concentration of
bahiagrass fertilized with horse stall material responded similarly to that fertilized with inorganic
fertilizer, with an adequate concentration (150 g kg-1) for a non-mature, non-growing, non-
lactating, non-pregnant horse diet (NRC, 1989) (Figure 5-1).
The amount of nitrogen and phosphorus removed, which is a function of tissue nutrient
concentration and dry matter yield, followed a similar trend to that of yield (Butler and Muir,
2006) (Figure 5-2). Apparent nutrient recovery cannot be determined because this study lacked
an unfertilized control. Yet, soil ammonium-nitrogen concentrations at day 0 (prior to
fertilization) were minimal, therefore the nitrogen removed from bahiagrass was that supplied by
fertilizer. Bahiagrass fertilized with inorganic fertilizer at a rate of 112 kg N ha-1 removed
approximately 95 kg N ha-1. However, bahiagrass fertilized with horse stall material at a rate of
168 kg N ha-1, removed 82 kg N ha-1. Bahiagrass fertilized with horse stall material removed half
of the nitrogen, as a percent applied, when compared to inorganic fertilizer. A 50% nitrogen
mineralization rate was already balanced for prior to application of horse stall material, yet only
approximately 25% of the nitrogen was recovered. Lower nitrogen recovery values indicate that
not all the applied nitrogen from the unprocessed stall material or compost was available for
plant uptake during the first year of application.
During the course of the experiment, ammonium-nitrogen was the only soil parameter to
increase, most likely from mineralization of organic nitrogen to plant available nitrogen by soil
bacteria (Table 5-2). An increase in soil ammonium-nitrogen was also reported by Butler and
Muir (2006) after soil incorporation of dairy manure compost. In contrast, soil extractable
phosphorus, potassium, calcium, and magnesium concentration decreased in the current study

113
(Table 5-2). This finding is most likely due to bahiagrass uptake of the nutrients, and removal of
material after harvesting without reapplication of fertilizer to account for loss. It has been
reported that repeated application of manure will increase residual soil extractable phosphorus,
during this study, mehlich-extractable phosphorus was not increased due to application of horse
stall material. Although stall materials are high in organic matter, soil organic matter was not
enhanced in response to incorporation of horse stall material. An increase in soil organic matter,
with low organic matter levels, may require more than one yearly application of compost or stall
material, particularly on Florida’s sandy soils (Butler and Muir, 2006; Ferreras et al., 2006).
Conclusions
Results of this study suggest that the incorporation of unprocessed or composted horse stall
materials into soil can reduce or replace some of the use of inorganic fertilizers when
establishing bahiagrass pastures without reduction in forage quality or production. In this study,
unprocessed and composted horse stall material supported similar yield and crude protein as
inorganic fertilizer. When applied at agronomic rates composted horse stall material could
decrease the cost of manure disposal and purchase of inorganic fertilizer, recycle nutrients and
reduce environmental degradation by stabilizing nutrients that may threaten water quality.
However, more research is needed to determine long term effects of repeated land applications,
as well as the mineralization rates, of unprocessed and composted horse manure.
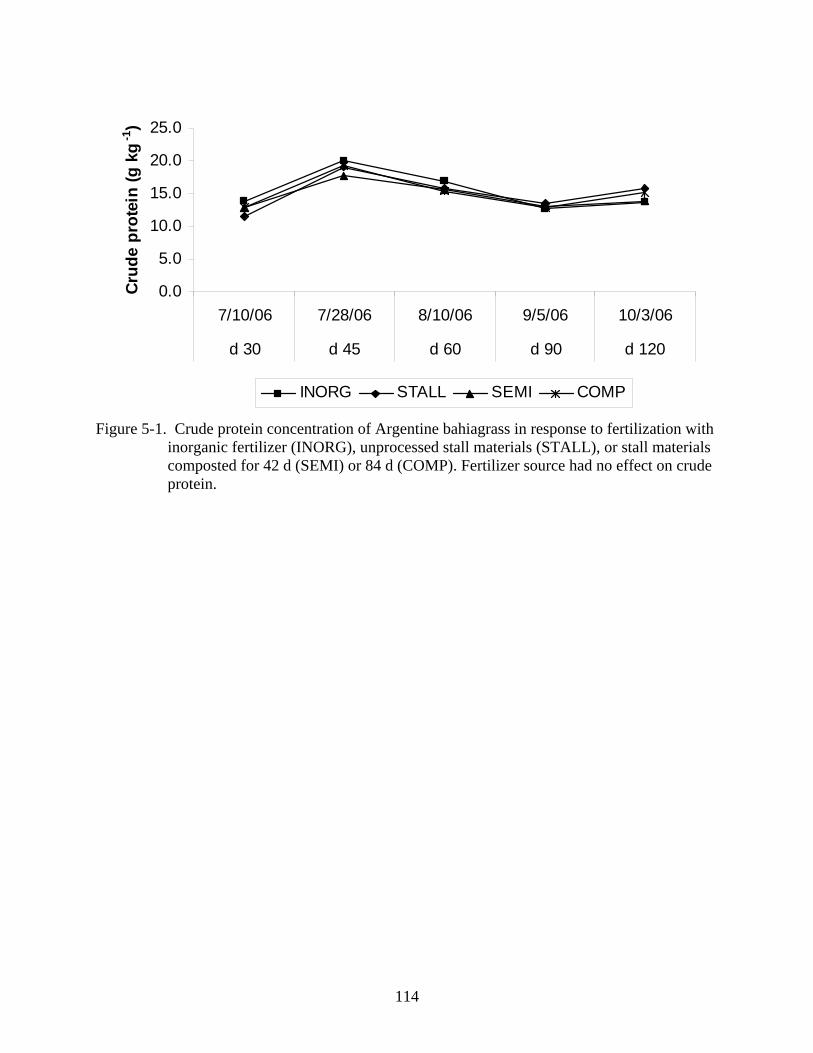
114
0.0
5.0
10.0
15.0
20.0
25.0
7/10/06 7/28/06 8/10/06 9/5/06 10/3/06
d 30 d 45 d 60 d 90 d 120
Crud
e pr
otei
n (g
kg
-1)
INORG STALL SEMI COMP
Figure 5-1. Crude protein concentration of Argentine bahiagrass in response to fertilization with inorganic fertilizer (INORG), unprocessed stall materials (STALL), or stall materials composted for 42 d (SEMI) or 84 d (COMP). Fertilizer source had no effect on crude protein.

115
0
20
40
60
80
100
120
INORG STALL SEMI COMP
Nut
rien
t Rem
oved
(kg
ha-1
)
Nitrogen Phosphorus
Figure 5-2. Nitrogen and Phosphorus removal (kg ha-1) by Argentine bahiagrass in response to fertilization with inorganic fertilizer (INORG), unprocessed stall materials (STALL), or stall materials composted for 42 d (SEMI) or 84 d (COMP). Fertilizer source had no effect on nitrogen and phosphorus removal.

116
Table 5-1. Dry matter yield, total nitrogen (N) and total phosphorus (P) concentration in Argentine bahiagrass in response to fertilization with inorganic fertilizer (INORG), unprocessed stall materials (STALL), or stall materials composted for 42 d (SEMI) or 84 d (COMP).
Treatments p-value Day INORG STALL SEMI COMP SEM† Trt Week Trt*Day Yield 30 390.7a 95.8c 272.1a,b 219.9b,c 34.6 0.0001 (kg ha-1) 45 767.6a 527.4c 570.7b,c 719.8a,b 41.1 0.0041 60 825.2 590.5 646.3 697.5 51.3 NS 90 1426 1471 1283 1270 123.9 NS 120 529.3 693.4 533.5 588.9 66.4 NS Mean 787.8 675.7 661.2 699.3 35.4 NS 0.0001 NS Total 3943 3376 3308 3503 208 NS N 30 22.2 18.6 20.6 20.5 0.5 NS (g kg-1) 45 31.9 30.6 24.8 30.6 1.1 NS 60 26.9 25.1 24.9 24.7 0.7 NS 90 20.4 21.7 20.9 20.5 0.5 NS 120 21.9 25.3 22.2 24.4 0.6 NS Mean 24.7 24.2 23.4 24.1 0.9 NS 0.0001 NS P 30 3.90 3.54 3.63 3.86 0.13 NS (g kg-1) 45 4.41 4.14 4.49 4.64 0.10 NS 60 4.22 4.06 4.39 4.15 0.13 NS 90 4.31 4.31 4.18 4.27 0.11 NS 120 4.43 4.28 4.46 4.43 0.09 NS Mean 4.26 4.06 4.23 4.27 0.17 NS 0.0001 NS †Standard error mean. a,b,c Means within a row with different letters are significantly different (P<0.05).

117
Table 5-2. Soil Ammonium-nitrogen (NH4), Mehlich-1 extractable phosphorus (P), potassium (K), calcium (Ca), magnesium (Mg) concentration and cation exchange capacity (CEC), pH, and organic matter (OM) from Argentine bahiagrass plots in response to fertilization with inorganic fertilizer (INORG), unprocessed stall materials (STALL), or stall materials composted for 42 d (SEMI) or 84 d (COMP).
Treatment p-value Day INORG STALL SEMI COMP SEM† Trt Day Trt*DayNH4-N 0 2.83 3.00 2.83 2.67 0.14 NS mg kg-1 30 2.50 2.67 2.67 2.50 0.15 NS 60 3.33 2.67 2.83 3.00 0.13 NS 120 3.83 5.25 4.25 4.83 0.55 NS Mean 3.13 3.39 3.15 3.25 0.17 NS 0.0001 NS P 0 89.5 88.9 96.1 87.1 3.7 NS mg kg-1 30 84.07 100.4 100.1 93.6 3.2 NS 60 78.02 80.5 88.4 82.43 5.65 NS 120 84.52 86.3 86.6 73.55 3.50 NS Mean 84.0 89.1 92.8 84.2 2.1 NS 0.0173 NS K 0 116.8 130.8 131.4 113.3 4.5 NS mg kg-1 30 94.04b 194.9a 119.2b 119.8b 10.8 0.0016 60 106.9 140.1 109.3 102.3 8.3 NS 120 86.46 101.7 93.5 84.9 7.1 NS Mean 101.1c 141.9a 113.3b 105.1c 4.2 0.0001 0.0001 0.0001 Ca 0 1988 1911 1799 1781 76 NS mg kg-1 30 1862 2033 1706 1940 94 NS 60 1889 1964 1808 1710 116 NS 120 1703 1583 1499 1449 106 NS Mean 1861 1873 1703 1720 50 NS 0.0014 NS Mg 0 125.0 121.5 120.8 112.3 4.6 NS mg kg-1 30 114.8 141.6 118.8 129.6 6.7 NS 60 106.3 128.4 126.1 115.1 7.5 NS 120 107.6 116.7 105.1 102.2 7.5 NS Mean 113.4 127.0 117.7 114.8 3.4 0.0869 0.0193 NS CEC 0 12.5 12.3 11.5 11.2 0.5 NS meq 100ml-1 30 11.6 13.2 10.9 12.3 0.6 NS 60 11.7 12.5 11.5 11.0 0.7 NS 120 10.7 10.2 9.5 9.2 0.7 NS Mean 11.7 12.0 10.9 10.9 0.3 NS 0.0008 NS pH 0 7.10 7.08 7.08 7.05 0.03 NS 30 7.22 7.23 7.23 7.22 0.04 NS 60 6.87 6.95 7.01 6.87 0.06 NS 120 6.70 6.73 6.62 6.55 0.05 NS Mean 6.97 7.00 6.99 6.92 0.03 NS 0.0001 NS OM 0 32.67 32.0 29.5 26.0 1.8 NS g kg-1 30 23.5 27.3 25.0 25.0 1.5 NS 60 29.0 33.0 31.3 30.0 1.9 NS 120 32.5 29.5 29.2 35.7 2.4 NS Mean 29.4 30.5 28.8 29.2 0.9 NS 0.0062 NS †Standard error mean. a,b,c Means within a row with different letters are significantly different (P<0.05).

118
CHAPTER 6 EVALUATION OF UNPROCESSED AND COMPOSTED HORSE MANURE ON SOIL
CHEMICAL PROPERTIES AND YIELD OF ESTABLISHED NORTH FLORIDA PASTURE
Introduction
Spreading manure and bedding removed from stalls onto pastures is a common method of
manure disposal on horse farms ((Cotton, D. personal communication, 2008); NAHMS, 1998).
Horse stall material has a high carbon to nitrogen ratio (C:N), due to carbon-rich bedding. Land
application of materials with high C:N ratio has been found to create competition between
microbes and pasture forage, thereby suppressing plant growth (Warman and Termeer, 2005).
Composting reduces C:N ratio, ultimately reducing microbial competition, increasing organic
matter (OM) and water holding capacity of sandy soils, thereby improving forage yield (Wei and
Lu, 2005). In addition, organic nitrogen and phosphorus are mineralized slowly, which provide
plants with a slow release of nutrients year-round. By comparison, the nutrients in inorganic
fertilizers are immediately available and quickly depleted due to plant uptake or environmental
loss. Using compost as fertilizer potentially could reduce the amount of commercial nitrogen
fertilizer applied without decreasing forage yield, while decreasing the potential for nitrate
surface and groundwater contamination.
This study was preformed as preliminary evaluation of the surface application of horse
stall material and its value as a fertilizer source for an established mixed bahiagrass pasture in
north Florida. Because the nitrogen content of stall materials is relatively low (see Chapters 3
and 4), the amount of material that has to be land applied to meet nitrogen requirements of mixed
bahiagrass pasture can be substantial. Therefore, one objective of this preliminary study was to
determine the effects of compost application on forage yield when applied at rates to meet
nitrogen requirements. A second objective was to compare the effects of unprocessed and
composted horse stall materials on forage yield to determine if there was an advantage to

119
composting these materials prior to land applying and to determine if either organic material
performed as well as inorganic fertilizer. The final objective was to evaluate the impact of
surface application of horse stall materials on soil characteristics.
Materials and Methods
Site Description
A field study was conducted at the University of Florida Institute of Food and Agricultural
Sciences, Horse Teaching Unit in Gainesville, Florida in 2006. A 0.5 hectare (ha) plot was used
within a 3 ha pasture. Prior to this study the pasture had received regular, repeated applications
of horse stall material for over 10 years. The soil type was a Millhopper (loamy, siliceous,
semiactive, hyperthermic Grossarenic Paleudult) (USDA, 2006).
Experimental Design
Six fertilizer treatments were examined: inorganic fertilizer (INORG; %N-P-K of 16-4-8),
unprocessed stall material (STALL; 0.6-0.1-0.3), composted stall material amended with
nitrogen (N) prior to composting (ACOMP; 1.0-0.2-0.4), composted stall material that was not
amended with N (UCOMP; 0.8-0.2-0.4), a mixture of ACOMP + INORG (MIX) and no fertilizer
(UNFERT). Stall material included horse manure and pine wood shavings bedding that had been
removed during routine stall cleaning and either stockpiled for 7 d (STALL) or composted for 84
d (ACOMP, UCOMP) before land application. Application rates were based on N requirements
for bahiagrass (Paspalum notatum) (Newman et al., 2008), adjusted to balance approximate
mineralization rates of 50% (Kidder, 2002), from organically bound N. Surface applied to plots
at a rate of 167 kg N ha-1 for STALL, ACOMP and UCOMP, 111 kg N ha-1 for INORG and a
combination of (84 kg N ha-1 from ACOMP and 56 kg N ha-1 from INORG) for MIX. Dry matter
application rate of STALL was 28 Mg ha-1, UCOMP was 21 Mg ha-1, ACOMP was 17 Mg ha-1
and MIX was 11 Mg ha-1 was surface applied to obtain recommended N rates. Each treatment

120
was randomly applied in one row) to mimic how horse producers spread stall material on
pastures with a manure spreader pulled behind a tractor) containing ten plots measuring 2 m x 3
m.
Data Collection and Analysis
A biological assay was conducted on STALL, UCOMP and ACOMP prior to land
application to evaluate potential phytotoxicity. In vitro germination and root elongation tests
were performed with compost extract using United States Composting Council method 05.05-B
(Thompson, 2001). Germination rates of cucumber seeds subjected to compost extract were
compared to seeds exposed to deionized water. Compost extracts were prepared from samples of
STALL, SEMI, and COMP obtained within 24 h and oven-dried to a constant weight. Stall
materials were mixed with deionized water in a 2:1 ratio (water: media, by weight) and allowed
to stand for 3 hr so that water could soak the media. The mixture was then filtered through
Whatman #113 filter paper and the extracts collected. Filter papers were placed in 9-cm petri
dishes and wetted with 10 mL of compost extract. Ten cucumber seeds were placed in each dish.
Three replicates of each dish were used to test STALL, UCOMP and ACOMP stall materials.
Deionized water served as the control. Petri dishes were placed in a lighted area with lids left on
to prevent water loss. The percent of seeds that had germinated were determined on 3 d and root
elongation was measured at 6 d.
Germination (%), root length (%) and germination index was determined using the
formulas described by Zucconi et al. (1981):
Germination (%) = (Germinatedsample / Germinatedcontrol) *100 [Equation 6-1]
Where Germination = the percentage of sample seeds germinated in proportion to the
control; where Germinatedsample= the average number of seeds germinated in the sample;
Germinatedcontrol = the average number of seeds germinated in the control.
121
Root length (%) = (Rootsample / Rootcontrol) *100 [Equation 6-2]
Where Root length = the percentage of length of root in proportion to the control; where
Rootsample = the average of root length in the sample; Rootcontrol = the average of root length in the
control.
Germination Index = (% Germination * % Root Length)/100 [Equation 6-3]
Soil samples were obtained at d 0 (prior to treatment), 30, 90 and 1 yr. At each sampling
interval, 20 soil cores were randomly collected within each plot at a depth to 15 cm using a
stainless steel sampling probe. The cores within each plot were composited and oven dried at 65
°C for 7 d. Soil was analyzed for ammonium-N (NH4), pH, organic matter (OM), cation
exchange capacity (CEC) (calculation), and extractable phosphorus (P), potassium (K), calcium
(Ca), and magnesium (Mg). NH4-N was extracted from soils using a 1N KCl solution and
analyzed spectrophotometrically (Markus et al., 1985; Dorich and Nelson, 1983). Soil pH is
determined in a 1:2 soil:water extract of the soil using deionized water. Samples were stirred and
allowed to equilibrate for a minimum of 30 min after adding the water. The pH determination
was made using a hydrogen selective electrode (Schofield and Taylor 1955). Soil OM was
determined by loss-on ignition method (Magdoff et al., 1996). Double acid Mehlich I extraction
was preformed to determine P, K, Ca, and Mg and analyzed by inductively coupled argon plasma
(ICP) spectrometry (SRIEG, 1983) at all collection points. Soil analysis was performed by Agro
Services International Laboratory (Orange City, FL) on a dry weight basis.
Forage samples were collected by hand clipping at 0 d (prior to fertilization), 20, 40, and
65 d. A 76 cm wire cable hoop (76 cm diameter) was randomly placed in each plot and all forage
material within the hoop was removed to a height of 10 cm. This procedure was repeated in
triplicate for each plot to determine dry matter. Plots were individually mowed and material was

122
collected to obtain representative samples for tissue analysis. Forage samples were dried to a
constant weight in a forced air oven at 65°C to determine dry matter. Forage samples were
analyzed for total N with the Dumas combustion method (VarioMax N analyzer, Elementar
Americas) (TMECC method 04.02-D (Thompson, 2002)). Total P was determined on samples
that had been ashed prior to sulfuric acid digestion and then quantified colorimetrically
(PowerWave XS spectrophotometer, Winooski, VT). Nutrient removal was determined using the
formula described by Butler and Muir (2006):
Nutrient removal (kg ha-1) = Nutrientconc * Yield [Equation 5-4]
Where nutrient removal = the amount of nutrient removed in relation to DM yield; Nutrientconc =
the concentration of nutrient (kg kg-1); Yield = the DM yield of forage (kg ha-1).
Crude protein (CP) was calculated as % N * 6.25 [Equation 5-5]
Statistical Analysis
Bioassay, forage and soil data were analyzed using the MIXED procedure of SAS (V.9.1,
SAS Inst., Inc., Cary, NC). Fertilizer treatment, time and treatment x time were included in the
model as fixed variables. Soil and forage nutrient data obtained at d 0 were used as covariates to
account for residual nutrient concentrations. If treatment differences existed in soil
characteristics at d 0, data were normalized by subtracting d 0 values from values obtained at all
subsequent sampling times. Contrast analyses were used to compared the performance of organic
(STALL, UCOMP, and ACOMP) vs. inorganic (INORG) fertilizers, composted (UCOMP and
ACOMP) vs. unprocessed (STALL) fertilizers, and N-supplemented (MIX and ACOMP) vs.
unamended (STALL and UCOMP) materials. The LSMEANS procedure was used to compare
treatment means and separation of means was performed using Tukey’s test. For all analyses, P-
values less than 0.05 were considered significant, whereas P-values less than 0.10 were discussed
as trends. Data were presented as mean ± SE unless otherwise stated.
123
Results
Bioassay
Germination rate of cucumber seeds was not affected by treatment with an average of
102%. Root length was lower in deionized water control compared to treatments, thereby
causing high root length percents. Seeds germinated in STALL extract (111%) was reduced
(P<0.05) compared to compost (ACOMP and UCOMP). Germination index of cucumber seeds
was affected by compost extract prepared from STALL, UCOMP and ACOMP. The lowest
germination index was observed for STALL (111%) (P<0.05), followed by ACOMP (136%) and
UCOMP (169%) (P<0.05).
Forage
During the 16-wk study (July to October 2006), mean daily ambient temperature ranged
from 10 to 34°C and averaged 24°C. The highest temperatures were recorded in August and the
lowest in October. Total rainfall during the trial was 28 cm, which was below the yearly average
of 127 cm for this period (Black, 2003). The majority of the rainfall occurred during June, July
and August. Of the three harvests collected, the highest mean yield (1.22 ± 0.05 Mg ha-1)
(P<0.0001) was observed 20 d after fertilizer application (Figure 6-1). Total forage yield for the
season was affected by source of fertilizer (P<0.0001) (Table 6-1). Total forage dry mater (DM)
yield was lowest in plots fertilized with STALL (P<0.05) and intermediate for plots treated with
INORG and ACOMP (P<0.05). The greatest total DM yield was observed in plots fertilized with
UCOMP and MIX, as well as plots that received no fertilizer (UNFERT) (P<0.05). Overall,
composted stall material generated higher total DM yield when compared to uncomposted
material (P<0.0001). A trend (P<0.10) was observed for N-supplemented stall material to result
in higher total DM yield compared to unamended materials.

124
Fertilizer source appeared to affect N concentration of bahiagrass forage (P<0.0001).
However, the N concentration of forage tissue was different (P<0.05) between plots prior to
fertilization (at d 0). When d 0 tissue N concentration was included in the statistical analysis as a
covariate, an effect of fertilizer treatment was still present (P<0.0001). Tissue N concentration
decreased (P<0.0001) from d 0 to d 20. After d 20, forage N concentration increased (P<0.001),
regardless of fertilizer, for the remainder of the trial. At d 20, after fertilizer application, forage
tissue N concentration was greatest in STALL, UCOMP, and ACOMP, and lowest in forage
treated with INORG, MIX and unfertilized control (P<0.01). At d 40, forage tissue N
concentration was highest in INORG, intermediate in forage fertilized with STALL, MIX,
UCOMP and ACOMP, and lowest in UNFERT forage (P<0.01). At d 65, forage tissue N
concentration was highest in INORG, STALL, UCOMP, and MIX, and lowest in forage of
ACOMP and UNFERT (P<0.01). Contrast analysis revealed that tissue N concentration was
higher in forage fertilized with composted horse stall material compared to unprocessed material
(P<0.01). Contrast analysis also revealed that N concentration was higher in forage fertilized
with N-amended material compared to unamended stall material (P<0.0001).The forage CP,
calculated from % N, followed the same trends of N concentration. Overall, CP ranged from 6 to
18%, during this trial, with an average of 11.5±0.1%, the greatest concentration occurring during
September (P<0.0001).
Cumulative nitrogen removed by bahiagrass forage ranged from 37.5 to 24.4 g N kg-1 and
was influenced by fertilizer source (P<0.005) (Table 6-1). The relative ranking of fertilizer
treatments and their impact on forage mean N removal was MIX > UCOMP > UNFERT >
ACOMP > INORG > STALL (Table 6-1). Overall, contrast analysis revealed plots treated with
125
composted material had higher N removal than those fertilized with unprocessed stall material
(P<0.0001).
Forage P concentration was affected by source of fertilizer (P<0.0001) and day
(P<0.0001). An overall increase in forage tissue P occurred between d 0 and d 65 (P<0.0001).
Tissue P concentration was not different between plots prior to fertilizer treatment (d 0). At d 20,
after fertilizer application, forage tissue P concentration was highest in ACOMP and MIX and
lowest in forage of unfertilized control (P<0.01).At d 40, forage P concentration was highest in
ACOMP and lowest in STALL and UNFERT (P<0.001). At d 60, tissue P was highest in
ACOMP and UCOMP and lowest in INORG (P<0.0001). Contrast analysis revealed that tissue P
concentration was higher in forage fertilized with organic materials compared to inorganic
fertilizer (P<0.05). Also, contrast analysis demonstrated, plots treated with composted material
had higher tissue P than those fertilized with unprocessed stall material (P<0.0001).
Cumulative P removed by bahiagrass forage ranged from 4.8 to 8.3 g P kg-1 and was
influenced by fertilizer source (P<0.001) (Table 6-1). The effect of fertilizer treatment on mean
forage P removed followed the same trends observed for mean N removal, where MIX >
UCOMP > UNFERT > ACOMP > INORG > STALL (Table 6-1). Contrast analysis
demonstrated, plots treated with composted material had higher P removal than those fertilized
with unprocessed stall material (P<0.0001).
Soil
The effects of fertilizer treatment on soil characteristics are presented in Table 6-2.
Differences in soil extractable P, Ca, Mg, CEC, pH and OM between plots were detected prior to
fertilization treatment on d 0. As a result, d 0 values for these variables were used as a covariate
to analyze the effect of fertilizer at all subsequent sampling times. Soil NH4 increased in
response to fertilizer treatment (P<0.0001). The greatest increase was observed for UNFERT and

126
ACOMP, a more moderate increase in plots treated with UCOMP and INORG, and the smallest
change observed when MIX and STALL were applied as fertilizer (P<0.01). Soil extractable P
and K concentrations decreased during the study period, but were not affected by treatment. Soil
Ca, Mg and CEC decreased over time and were affected by fertilizer treatment (P<0.05). Plots
treated with unprocessed stall material had a larger reduction in soil Ca, Mg and CEC compared
to plots treated with compost (amended or unamended) (P<0.01).
Soil pH differed prior to fertilizer treatment (d 0) (P<0.001), but was similar among plots
90 d after fertilizer application. After normalizing pH to account for differences at d 0, an effect
of fertilizer treatment was observed (P<0.01). A larger decline in pH was observed with ACOMP
(P<0.05) and no change in pH observed for MIX and UCOMP (P<0.05). Although soil OM was
different before fertilizer application (P<0.01), normalization of the data to account for this
variation continued to reveal an effect of treatment. Contrast analysis demonstrated a difference
in soil OM between plots treated with organic fertilizer (P<0.01). In addition, soil OM was
different between plots treated with unprocessed stall material (STALL) and composted material
(UCOMP and ACOMP) (P<0.001).
Discussion
Inherent differences in forage composition and soil characteristics before fertilizers were
applied make interpretation of results from this trial difficult (Table 6-2). In an effort to mimic
method of land application of stall materials on horse farms, the experimental was not designed
as a completely randomized block design; which could have eliminated the pre-existing
differences in forage and soil composition. Nonetheless, some key information can be gained
from this experience.
Forage yield appeared to be influenced by fertilizer treatment (Figure 6-1). Plots treated
with unprocessed horse stall material produced the lowest total yield of forage. The nutrients

127
within unprocessed stall material are in a form that lend themselves to being more available for
plant uptake compared to compost, however, the lower yield rates observed may have been due
to the high carbon-content of wood shavings bedding and the resulting high carbon:nitrogen ratio
of the material, which can create out competition by soil microorganisms with forage roots for
nitrogen uptake (Hodge et al., 2000). In addition, due to the relatively low concentration of
nitrogen in unprocessed stall material, application rates were higher compared to compost and
other fertilizers. The application of a larger amount of stall material may have initially shaded the
forage and slowed growth (James, 2003). Plots treated with compost that had either been
amended with nitrogen prior to composting or not had similar dry matter yield compared to
inorganic fertilizer. Land application of compost has been demonstrated to produce yields
comparable to dry matter yields by inorganic fertilization (Catroux et al., 1981; Hornick et al.,
1984; Davis et al., 1985; Warman and Termeer, 1996; Reider et al., 2000; Tiffany et al., 2000).
Eghball and Power (1999b) found that cattle feedlot manure compost, surface applied to corn
grain, produced dry matter yield similar to that of inorganic fertilizer.
The amount of nitrogen and phosphorus removed by forage is a function of nutrient
concentration and DM yield (Butler and Muir, 2006). In the current study, removal of nitrogen
and phosphorus by bahiagrass followed a similar trend to that of yield, where the lowest nitrogen
and phosphorus removal was observed when unprocessed stall materials were surface applied
(Table 6-1). Fertilizer source also influenced crude protein and phosphorus concentration of
forage biomass. Plots fertilized with unprocessed and composted material had higher mean
forage crude protein and phosphorus concentrations (Figure 6-3) than those treated with
inorganic fertilizer. Similar results have been reported by Butler and Muir (2006) who found that
organic nitrogen from composted dairy manure was taken up more effectively than inorganic
128
nitrogen in tall wheatgrass. The increased phosphorus concentration in plant tissue of organically
fertilized plots could be attributed to greater rates of phosphorus application, as an unbalance
exists between the nitrogen and phosphorus in manure and that needed by plants (Lynch et al.,
2004).
Although stall materials are high in organic matter, soil organic matter was not enhanced in
response to a single surface application of horse stall material. An increase in soil OM may
require more than one yearly application of compost, particularly on Florida’s sandy soils (Butler
and Muir, 2006; Ferreras et al., 2006). The increase in soil ammonium-nitrogen during the course
of this trial most likely resulted from mineralization of organic nitrogen to plant available
nitrogen by soil bacteria. An increase in soil ammonium-nitrogen was also reported by Butler
and Muir (2006) after soil incorporation of dairy manure compost. In the current study, soil
phosphorus levels decreased during the growing season and did not appear to be affected by
fertilizer treatment. This finding suggests that when unprocessed or composted horse stall
materials are surface applied to pastures at agronomic rates, the risk of soil phosphorus saturation
is not necessarily different than would be observed with inorganic fertilizer. If forage tissue
phosphorus concentration was higher with horse stall material, and more phosphorus was
applied, but soil phosphorus was not altered, perhaps reaching an equilibrium.
Conclusions
Results of this study suggest that surface application of composted horse stall materials at
rates to meet forage nitrogen requirements can successfully support the growth of bahiagrass
pasture. In contrast, surface application of unprocessed (fresh) horse stall materials as the sole
source of fertilizer may have limited value. In order to meet pasture nitrogen requirements, a
large amount of stall material must be applied, resulting in shading of forage and a reduction in
yield. In addition, the high carbon to nitrogen ratio of most stall materials may reduce nutrient

129
uptake by plants as soil microbes immobilize plant nutrients. As a result, inorganic fertilizer
sources (particularly nitrogen) will need to be included if unprocessed horse stall material is
surface applied to pastures. Further research is needed to validate the findings of this preliminary
study.

130
0.00.20.40.60.81.01.21.41.6
8/7/2006 8/29/2006 9/26/2006
d 0-20 d 20-40 d 40-65
DM Y
ield
(Mg
ha-1
)
UNFERT INORG MIX STALL UCOMP ACOMP
aa,b
c
ba,ba,b
bbbb
aa
Figure 6-1. Dry matter yield (Mg ha-1) of mixed bahiagrass in response to fertilization with
inorganic fertilizer (INORG), horse stall materials (STALL), N-amended stall materials (ACOMP), unamended composted stall materials (UCOMP), ACOMP + INORG (MIX) or no fertilization (UNFERT). a,b,cWithin each day, treatment means with different letters differ (P<0.05).
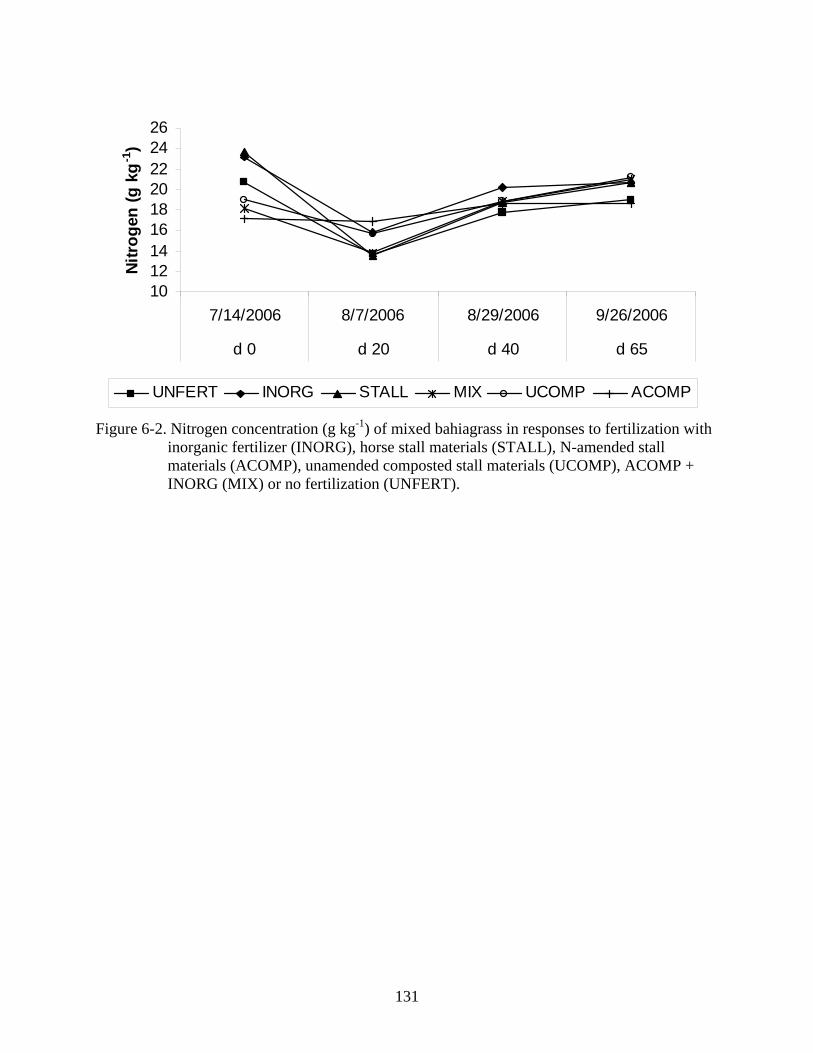
131
101214161820222426
7/14/2006 8/7/2006 8/29/2006 9/26/2006
d 0 d 20 d 40 d 65
Nitro
gen
(g k
g-1)
UNFERT INORG STALL MIX UCOMP ACOMP
Figure 6-2. Nitrogen concentration (g kg-1) of mixed bahiagrass in responses to fertilization with inorganic fertilizer (INORG), horse stall materials (STALL), N-amended stall materials (ACOMP), unamended composted stall materials (UCOMP), ACOMP + INORG (MIX) or no fertilization (UNFERT).
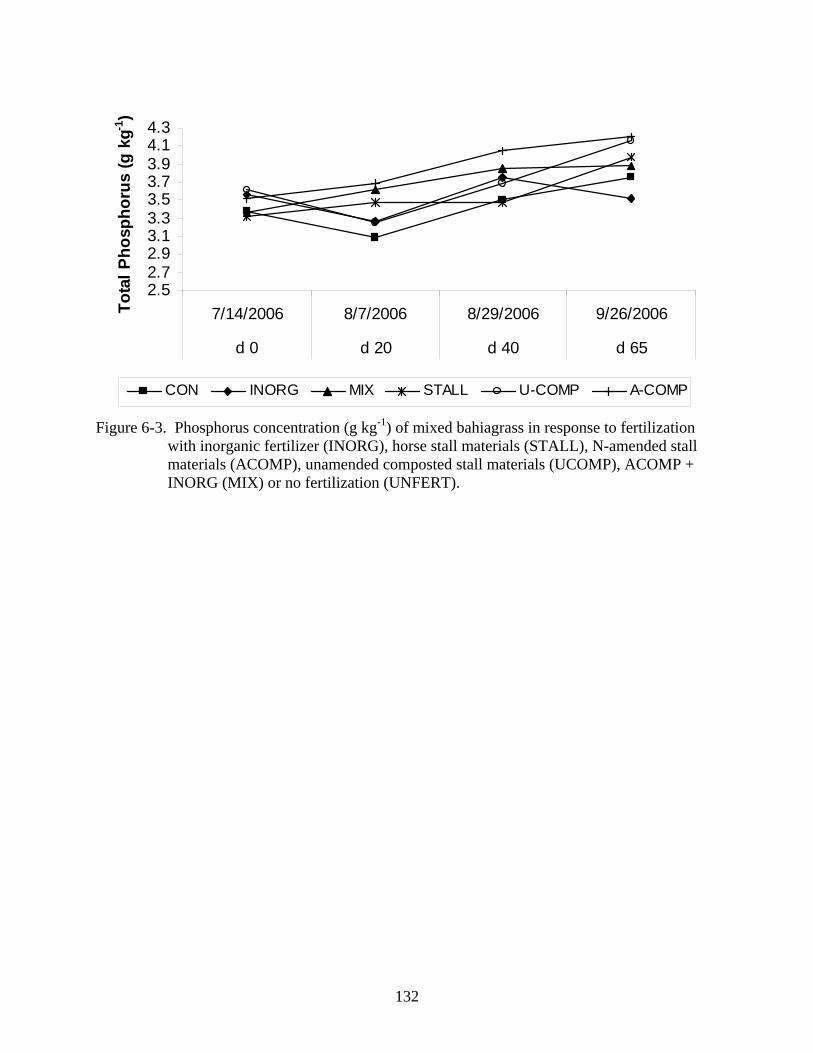
132
2.52.72.93.13.33.53.73.94.14.3
7/14/2006 8/7/2006 8/29/2006 9/26/2006
d 0 d 20 d 40 d 65
Tota
l Pho
spho
rus
(g k
g-1)
CON INORG MIX STALL U-COMP A-COMP
Figure 6-3. Phosphorus concentration (g kg-1) of mixed bahiagrass in response to fertilization with inorganic fertilizer (INORG), horse stall materials (STALL), N-amended stall materials (ACOMP), unamended composted stall materials (UCOMP), ACOMP + INORG (MIX) or no fertilization (UNFERT).

133
Table 6-1. Total dry matter (DM) yield, mean nitrogen (N) and phosphorus (P) concentration,
and mean N and P removed by mixed bahiagrass forage in response to fertilization with inorganic fertilizer (INORG), horse stall materials (STALL), N-amended stall materials (ACOMP), unamended composted stall materials (UCOMP), ACOMP + INORG (MIX) or no fertilization (UNFERT).
DM Yield N N removed P P removed Treatment Mg ha-1 g kg-1 g kg-1 g kg-1 g kg-1 UNFERT 2.25x 17.8y,z 33.6x,y,z 3.43z 7.3x INORG 1.85y 19.1x 27.8y,z 3.53y,z 6.2x,y MIX 2.24x 18.6x,y 37.5x 3.68y 8.3x STALL 1.40z 17.7y,z 24.4z 3.56y,z 4.9y UCOMP 2.34x 17.5y,z 37.3x,y 3.68y 8.0x ACOMP 1.85y 19.9x 31.0x,y,z 3.87x 6.8x,y ANOVA SEM† 0.10 0.2 2.3 0.01 0.5 Treatment 0.0001 0.0001 0.005 0.0001 0.0002 Trt*Day 0.0001 0.0001 0.0213 0.0001 ‡Contrast 1 NS NS 0.0673 0.0198 NS §Contrast 2 ¶Contrast 3
0.0001 0.0991
0.0058 0.0001
0.0001 NS
0.0120 0.0124
0.0001 0.0361
†Standard error mean. x,y,z Means within a column followed by different letters are significantly different (P<0.05). ‡Contrast 1: organic (STALL, UCOMP, and ACOMP) vs. inorganic (INORG) fertilizers. §Contrast 2: composted (UCOMP and ACOMP) vs. unprocessed (STALL) fertilizers. ¶Contrast 3: N-supplemented (MIX and ACOMP) vs. unamended (STALL and UCOMP) materials.

134
Table 6-2. Soil concentration of ammonia nitrogen (NH4), Mehlich extractable phosphorus (P), potassium (K), calcium (Ca) and magnesium (Mg), cation exchange capacity (CEC), pH, and organic matter (OM)) in response to fertilization with inorganic fertilizer (INORG), horse stall materials (STALL), N-amended stall materials (ACOMP), unamended composted stall materials (UCOMP), ACOMP + INORG (MIX) or no fertilization (UNFERT).
UNFERT INORG STALL MIX UCOMP ACOMP Trt SEM† NH4-N d0 2.4 2.7 2.3 2.2 2.2 2.2 NS 0.1 mg kg-1 d30 3.8 2.8 2.9 3.1 2.8 4.2 NS 0.3 d90 9.2a 8.2a,b 5.9b 5.9b 8.3a,b 8.9a 0.0008 0.3 Trt 5.1a 4.6a,b 3.7b 3.7b 4.4a,b 5.1a 0.0016 0.2 P d0 38 34 48 21 37 38 0.0505 2.5 mg kg-1 d30 30 32 35 21 20 36 0.0835 2.1 d90 33a 29a,b 29a,b 21b 22b 34a 0.0016 1.2 Diff‡ -6 -5 -20 0 -16 -4 NS 2.4 K d0 55 56 71 53 63 65 NS 3.8 mg kg-1 d30 51 58 47 54 50 68 NS 2.4 d90 29 43 32 30 35 41 NS 1.9 Trt 44 53 50 45 49 58 NS 1.8 Ca d0 1058a,b 853a,b 1249a 504b 862a,b 1109a,b 0.0421 71 mg kg-1 d30 995a,b 900a,b 622a,b 547b 691a,b 1089a 0.0076 52 d90 543 713 567 518 583 691 NS 29 Diff‡ -515a,b -140a,b -682b 15a -279a,b -418a,b 0.0239 66 Mg d0 49b 48b 66a 45b 54a,b 55a,b 0.0057 1.7 mg kg-1 d30 52a,b 54a,b 43b 56a 58a 63a 0.0008 1.4 d90 42b 48a,b 38b 39b 47a,b 55a 0.0006 1.3 Diff‡ -6a 0a -28b -6a -7a -0.9a 0.0017 2.2 CEC d0 6.5a,b 5.4a,b 7.8a 3.4b 5.5a,b 6.9a,b 0.0386 0.1 meq 100g-1 d30 6.1a,b 5.7a,b 4.3a,b 3.7b 4.5a,b 6.7a 0.0094 0.3 d90 3.5 4.5 3.6 3.3 3.8 4.5 NS 0.2 Diff‡ -3.0a,b -0.8a,b -4.2b 0.0a -1.7a,b -2.4a,b 0.0218 0.4 pH d0 6.8a,b,c 6.8a,b 7.1a 6.2c 6.5b,c 7.1a 0.0002 0.1 d30 6.8a,b,c 6.9a,b 6.4b,c 6.9b,c 6.3c 6.9a 0.0005 0.1 d90 6.1 6.4 6.4 6.4 6.4 6.2 NS 0.1 Diff‡ -0.6a,b -0.4a,b -0.7a,b -0.1a -0.1a -0.9b 0.0017 0.1 OM d0 15.2a,b 9.0b 23.3a 9.1b 12.3a,b 19.5a,b 0.0037 1.3 g kg-1 d30 16.8a,b 15.2a,b 10.3b 11.9b 14.4a,b 19.6a 0.0029 0.7 d90 7.4a,b 8.1a,b 5.8b 6.8a,b 7.5a,b 10.6a 0.0214 0.4 Diff‡ -7.8a,b -0.9a -17.5b -2.3a -4.8a -8.9a,b 0.0018 1.3 †Standard error mean. ‡Diff = Difference between d 90 and d 0 were calculated where differences were detected prior to fertilizer treatment at d 0. a,b,cMeans within a row with different superscripts are significantly different (P<0.05).
135
CHAPTER 7 EFFECTS OF UNPROCESSED AND COMPOSTED HORSE STALL MATERIALS ON SOIL
CHEMICAL PROPERTIES AND YIELD OF NORTH FLORIDA FORAGES
Introduction
Recycling nutrients present in horse stall material by using is as a fertilizer is a beneficial
tool for manure management. Yet, there are certain limitations when using fresh manure as a
fertilizer source that should be considered, including land and seasonal constraints on
application, spreading of weed seeds and intestinal parasites, fly and odor production,
suppression of forage growth due to the high carbon-content of bedding, and the potential for
contamination of surface and groundwater (James, 2003; Lyons et al., 1999; Major et al., 2005;
Watson et al., 1998). Nutrients, such as nitrogen (N) and phosphorus (P) in manure can
negatively affect water quality when the number of grazing animals per land area exceeds the N
fertility needs of the forages (Hubbard et al., 2004). In addition, the narrow N:P ratio in manure
often results in excess loading of P when application rates are based on crop N demands (Dao,
1999).
The primary concern with regard to using horse manure as an amendment for pastures is
the environmental issues associated with surface and groundwater contamination. The presence
of relatively mobile N, P, organic matter (OM), microbes, and other materials near the soil
surface following manure application can decrease the quality of runoff, particularly for the first
post-application runoff event. Studies such as those by Westerman et al. (1983), McLeod and
Hegg (1984), and Edwards and Daniel, (1993) indicate that runoff from grassed areas treated
with animal manures can contain elevated concentrations of nutrients, solids, and organic matter
relative to untreated areas. When N and P exceed the loading rate for a body of water,
eutrophication can occur. The plant available forms of these nutrients appear to be of most
concern in the degradation of water quality because of their potential for direct uptake by aquatic

136
vegetation and algae (Bushee et al., 1998). Management options such as buffer strips, soil
incorporation, and application timing have been advocated for reducing pollution potential from
pastures treated with manure (Young et al., 1980).
Several management strategies have been discussed to counteract some of the limitations
of using horse manure as fertilizer amendment for pastures. One management tool that has
gained a renewed interest in the horse industry is composting. Treating manure through
composting could provide a means of reducing the environmental impact by reducing the total
volume of materials (Larney et al., 2000), destroying parasites and weed seeds (Romano et al.,
2006; Larney et al., 2003; Larney and Blackshaw, 2003) and reduced odor production compared
to stockpiled manure (Li et al., 2007). All while, producing a storable end product for on and off
farm use, and lowers nonpoint source pollution from agricultural farms (Michel et al., 2004). The
stabilized end product can be used as a rich soil amendment for agricultural cropland,
landscaping and gardening and nursery potting mixes (Lynch, 2004).
Composts have been found to enhance soil fertility, increase crop yields (Dick and McCoy,
1993) and reduce diseases caused by soilborne plant pathogens (Hoitink and Fahy, 1986; Hoitink
and Boehm, 1999). Several studies have demonstrated that land application of compost on forage
crops resulted in yields that were comparable to those yields produced by inorganic fertilizer
(Catroux et al., 1981; Hornick et al., 1984; Davis et al., 1985; Warman and Termeer, 1996;
Reider et al., 2000; Tiffany et al., 2000). Negative responses on forage yield and soil
characteristics have been infrequently reported, and are generally attributed to using compost
with a high C:N ratio, excess metals, high soluble salts or extremely high application rates
(Warman and Termeer, 2005). Land application of compost could reduce the amount of
commercial N fertilizer applied, thereby decreasing the potential for nitrate surface and
137
groundwater contamination (Diepeningen et al., 2006). However, little is known about the effects
composted horse manure may have on forage yield.
The objective of this study was to compare the effects of unprocessed and composted
horse stall material on soil chemical properties and forage yield when surface applied to
established plots of Coastal bermudagrass (Cynodon dactylon (L.) Pers), Pensacola bahiagrass
(Paspalum notatum Flügge) and Florigraze perennial peanut (Arachis glabrata Benth.) in North
Florida.
Materials and Methods
Site Descriptions
Field studies were conducted on established Coastal bermudagrass, Pensacola bahiagrass
and Florigraze perennial peanut forage stands at the University of Florida, North Florida
Research and Education Center near Suwannee Valley, Florida (N 30° 18’, W 82° 54’, elevation
47 m) in 2007. The soil type is a Blanton (loamy, siliceous, semiactive, thermic Grossarenic
Paleudult) (USDA, 2006).
Experimental Design
For each forage, twenty-four plots, (each 6 m x 6 m), were blocked and randomly assigned
to one of four fertilizer treatments: 1) composted horse stall material (COMP) (% N-P-K, 1.2-
0.4-0.4), 2) unprocessed horse stall material (STALL) (0.6-0.3-0.3), 3) inorganic fertilizer
(INORG) or 4) an unfertilized control (UNFERT). Stall material included horse manure and pine
wood shavings bedding that had been removed during routine stall cleaning and either stockpiled
for 7 d (STALL) or amended with urea to achieve a C:N ratio of 30:1 and composted for 120 d
(COMP) before use. Initial INORG, COMP and STALL fertilizer treatments were surface
applied by hand in May 2007.

138
Experiment 1: Pensacola Bahiagrass
Pensacola bahiagrass pasture was managed as a medium N option grazed system,
requiring fertilization rates of 112 kg N ha-1 applied as a single application (Newman et al.,
2008). The availability of nutrients from the organic fertilizers was estimated to be 50% the first
season (Kidder, 2002). Therefore, STALL and COMP were applied at a rate of 224 kg N ha-1.
Dry matter application rate of STALL was 37 Mg ha-1 and COMP was 19 Mg ha-1. All fertilizer
treatments were applied in a single application in May 2007. Inorganic fertilizer used for INORG
treatment had a guaranteed % N-P-K analysis of 19-5-19 derived from diammonium phosphate,
ammonium nitrate, muriate of potash, ammonium sulfate and dolomitic limestone and was
applied at the recommended rate of 112 kg N-1. Bahiagrass samples were collected every 6 wk
from July to November 2007 to a height of 10 cm and remaining biomass was mowed and
removed from plots.
Experiment 2: Coastal Bermudagrass
Coastal bermudagrass pasture was managed for hay production with multiple harvests,
requiring fertilization rates of 90 kg N ha-1 prior to the first harvest and an additional 90 kg N ha-
1 after each harvest, except the last in the fall (Newman et al., 2008). The fertilizer application
rate for the INORG treatment followed these recommendations, with an initial application in
May 2007. For STALL and COMP, an initial rate of 180 kg N ha-1 was applied in May 2007
based on an estimated first-season N availability of 50% (Kidder, 2002). Dry matter application
rate of STALL was 29 Mg ha-1 and COMP was 15 Mg ha-1. After each harvest, inorganic
fertilizer was applied to INORG, STALL and COMP treatments at a rate of 90 kg N ha-1. The
inorganic fertilizer used in this study had a guaranteed %N-P-K analysis of 19-5-19, derived
from diammonium phosphate, ammonium nitrate, muriate of potash, ammonium sulfate and

139
dolomitic limestone. Bermudagrass samples were collected every 6 wk from July to November
2007 to a height of 10 cm and remaining biomass was mowed and removed from plots
Experiment 3: Florigraze Rhizoma Perennial Peanut
Florigraze rhizome perennial peanut pasture was managed for hay production with
multiple harvests, requiring fertilization rates of 33 kg P2O5 ha-1 before the first harvest and an
additional 17 kg P2O5 ha-1 after each harvest, except the last in the fall (Newman et al., 2008).
The fertilizer application rate for the INORG treatment followed these recommendations, with an
initial application in June 2007. For STALL and COMP, an initial rate of 67 kg P2O5 ha-1 was
applied in June 2007 based on an estimated first-season N availability of 50% (Kidder, 2002).
Dry matter application rate of STALL was 11 Mg ha-1 and COMP was 8 Mg ha-1. After each
harvest, inorganic fertilizer was applied to INORG, STALL and COMP treatments at a rate of 17
kg P2O5 ha-1. The inorganic fertilizer used in this study had a guaranteed % N-P-K analysis of 3-
7-28 derived from ammoniated phosphate, anhydrous ammonia, iron oxide, iron sulfate,
manganese oxide, manganese sulfate, muriate of potash, normal super phosphate, sodium borate,
sulfate of potash-magnesia, sulfuric acid, zinc oxide and zinc sulfate. Perennial peanut samples
were collected every 8 wk from August to October 2007 to a height of 10 cm and remaining
biomass was mowed and removed from plots.
Data Collection and Analysis
A biological assay was conducted on STALL and COMP prior to land application to
evaluate potential for phytotoxicity. Seedling emergence and relative growth was performed
using US Composting Council method 05.05-A (Thompson, 2001). Growing media was created
from 50:50 blend of treatment (COMP or STALL) and No. 2 grade vermiculite. Pure vermiculite
was included as negative control and soil-less potting media containing inorganic fertilizer was
included as a positive control. Two cucumber seeds were placed in each cell of a plastic seedling
140
flat and the respective growing media was added. Materials were watered with deionized waster
and then wrapped in a plastic bag. The plastic wrapped seedling tray was placed under a
florescent light fixture that provide 14 h continuous light and 10 h dark in a room maimtained at
a temperature of approximately 27°C. After 12 d, cucumber seedlings were evaluated for
emergence, health and vigor of the cucumber seedlings. The number of seedlings that had fully
exposed hypocotyl and fully expanded cotyledons were counted and recorded for emergence
evaluation. Healthy vigorous seedlings with height equal to or greater than the average seedling
height or the positive control were counted and recorded.
Soil samples were collected from all three forage sites in May 2007 to determine residual
soil physical and chemical properties. Ten soil cores were randomly collected from at depths of 0
to15 cm and 15 to 30 cm each of the twenty-four plots and pooled for a total of 48 samples per
forage site (24 plots x 2 depths). In addition, soil samples were obtained at wk 6, 12, and 24
(Bahiagrass and Bermudagrass) and wk 8 and 16 (Perennial peanut). Soil samples were obtained
using a stainless steel sampling probe. Samples were air dried at 24°C and analyzed for total N,
nitrate-N (NO3-N), ammonium-N (NH4-N), pH, and cation exchange capacity (CEC).
Extractable P, potassium (K), calcium (Ca), and magnesium (Mg) were determined by double
acid Mehlich I extraction and analyzed on inductively coupled argon plasma (ICP) spectrometry.
Sulfur (S), boron (B), zinc (Zn), manganese (Mn), iron (Fe), copper (Cu) and OM were also
determined by ICP spectrometry in samples obtained prior to fertilization (May 2007) and at
study conclusion (October/November 2007). Soil samples were analyzed by Water’s
Agricultural Laboratory (Camilla, GA) on a dry weight basis.
Bahiagrass and bermudagrass forage samples were hand collected at 6, 12, 18 and 24 wk
after initial fertilizer application. Perennial peanut was hand collected at 8 and 16 wk after initial
141
fertilizer application. A 76 cm wire cable hoop (76 cm diameter) was randomly placed in each
plot and all forage material within the hoop was removed to a height of 10 cm. This procedure
was repeated in triplicate for each plot to determine dry matter. Plots were individually mowed
and material was collected to obtain representative samples for tissue analysis. Forage samples
were dried to a constant weight in a forced air oven at 65°C to determine dry matter. Forage
samples were analyzed for total N with the Dumas combustion method (VarioMax N analyzer,
Elementar Americas) (TMECC method 04.02-D (Thompson, 2002)). Total P was determined on
samples that had been ashed prior to sulfuric acid digestion and then quantified colorimetrically
(PowerWave XS spectrophotometer, Winooski, VT). Nutrient removal was determined using the
formula described by Butler and Muir (2006):
Nutrient removal (kg ha-1) = Nutrientconc * Yield [Equation 7-1]
Where nutrient removal = the amount of nutrient removed in relation to total DM yield;
Nutrientconc = the concentration of nutrient (kg kg-1); Yield = the DM yield of forage (kg ha-1).
Crude protein (CP) was calculated as % N * 6.25 [Equation 7-2]
Apparent recovery of N and P from forage tissue was calculated using the formula
described by Lynch et al. (2004):
ANR (%) = [(NremT– NremU) / Nappl] * 100 [Equation 7-3]
Where apparent nutrient recovery (ANR) = the percentage of nutrient recovered by forage tissue
in relation to the amount applied; NremT = nutrient removed by treatment (kg ha-1); NremU =
nutrient removed by unfertilized control (kg ha-1); Nappl = amount of nutrient applied (kg ha-1).
Statistical Analysis
Bioassay, forage and soil data were analyzed using the MIXED procedure of SAS (V.9.1,
SAS Inst., Inc., Cary, NC). Four treatments (UNFERT, INORG, STALL, and COMP) were
assigned in a completely randomized block design with 6 blocks and 6 replications per treatment
142
for a total of 24 plots. Treatment, week, depth and treatment x week and treatment x depth
interactions were included in the model as fixed effects and block was named as a random
variable. Contrast analysis was performed to compare the effects of organic (STALL and
COMP) vs. inorganic (INORG) fertilizer sources, fertilized (INORG, STALL and COMP) vs.
unfertilized (UNFERT) treatments, and treatment with organic (STALL and COMP) vs. no
fertilizer (UNFERT). The LSMEANS procedure was used to compare treatment means and
separation of means was performed using Tukey’s test. For all analysis, P-values less than 0.05
were considered significant, whereas P-values less than 0.10 were discussed as trends. Data were
presented as mean ± SE, unless otherwise stated.
Results
Weather Conditions
During the 24-wk experiment (May to November 2007), mean daily ambieint temperature
ranged from 14.5 to 27.6°C and averaged 23.4°C. The highest temperatures were recorded in
August and the lowest in November. Total rainfall during the trial was 59.1 cm, which is below
the 5-yr average of 84.4 cm during an equivalent 24-wk period. The majority of the rainfall
occurred during June, July and August 2007.
Bioassay
Emergence and relative growth of cucumber seedlings was not negatively affected by
COMP or STALL. Percent emergence for COMP and STALL were both 100% when compared
to the positive fertilizer control. Additionally, health and vigor of seedlings grown in COMP or
STALL did not exhibit any relative differences compared to the fertilizer control. All cucumber
seedlings were well formed, had un-deformed cotyledons and turgid hypocotyls with a length
equal to or greater than the positive control.

143
Experiment 1: Pensacola Bahiagrass
Total DM yield and yield by harvest interval for Pensacola bahiagrass are presented in
Table 5-1. For fertilized plots, the average DM yield for each 6-wk harvest interval was 1,068 kg
ha-1 and mean total yield over the 24-wk study period was 3,550 kg ha-1. An overall effect of
treatment (P<0.0001) was observed, whereby mean harvest yield was greatest for bahiagrass
fertilized with INORG and STALL (P<0.05), intermediate for COMP (P<0.05) and lowest for
UNFERT (P<0.01). Additionally, a significant treatment x time interaction was detected for
yield (P<0.0001). At the 6 wk harvest, DM yield from INORG was greater than STALL and
COMP (P<0.05) and at 12 wk DM yield from both INORG and STALL were greater than
COMP (P<0.05). There were no differences in yield between INORG, STALL and COMP at 18
and 24 wk. All fertilizer treatments (INORG, STALL, COMP) resulted in greater DM yield than
UNFERT at each harvesting interval (P<0.05), with the exception of wk 18 when yield did not
differ among treatments. Contrast analysis of total yield revealed that bahiagrass responded to
fertilization with higher yields compared to the unfertilized control (P<0.0001), and total yield of
inorganic fertilizer was higher compared to organic sources (STALL and COMP) (P<0.0001).
Total DM yield from all harvests was greatest from plots fertilized with INORG and STALL
(P<0.05), intermediate for COMP (P<0.05), and lowest for UNFERT (P<0.01). Over the 24-wk
study, there was a significant effect of time (P<0.0001) on yield of Pensacola bahiagrass, with
yields generally being greatest at the wk 6 and 12 harvests (July and Aug), a significant decline
at wk 18 (Sept), and a further decline at the wk 24 harvest (Nov).
Tissue N and P concentrations of Pensacola bahiagrass are presented in Table 5-1. An
overall effect of treatment was observed for tissue N (P<0.0001), whereby mean harvest tissue N
was greater in plots fertilized with INORG or STALL (P<0.05) compared to COMP and
UNFERT. Contrast analysis of tissue N revealed that bahiagrass did not respond to fertilization

144
compared to the unfertilized control, or fertilization from organic compared to inorganic
fertilizer. An effect of time (P<0.0001) and treatment x time (P<0.0001) were also observed for
tissue N concentration. Across treatments, tissue N concentration was elevated at the wk 6 (July)
and wk 24 (Nov) harvests and lowest during the wk 12 and 18 harvests (Aug and Sept). Tissue
crude protein concentrations calculated from N concentrations followed the same treatment
(P<0.0001), time (P<0.0001) and treatment x time (P<0.0001) patterns described above for tissue
N. Mean harvest crude protein concentration was higher for INORG and STALL (each 7.6%)
(P<0.05) and lower for COMP (6.7%) and UNFERT (6.6%). Total N removed by bahiagrass
during the 24-wk study period was greatest when fertilized with INORG and STALL (P<0.05),
intermediate with COMP (P<0.05), and lowest in UNFERT (P<0.05) (Figure 5-1). An overall
effect of treatment was observed for tissue P (P<0.0001), whereby mean harvest tissue P was
greatest in plots fertilized with STALL (P<0.05), intermediate with UNFERT (P<0.05), and
lowest for INORG and COMP (P<0.05) (Table 5-1). Contrast analysis of tissue P revealed that
bahiagrass responded to organic fertilizer with higher tissue P compared to the inorganic
fertilizer (P<0.0001). An effect of time (P<0.0001) was observed for tissue P concentration,
whereby tissue P generally increased throughout the 24-wk study period. Additionally, a
treatment x time (P<0.001) interaction was detected, with some treatments experiencing no
change (INORG, COMP) or a decline (STALL) in tissue P concentration from wk 6 to 12,
followed by a subsequent increase at wk 18 and 24 above that observed at the 6 wk harvest.
Total P removed by bahiagrass during the 24-wk study period was greatest when fertilized with
STALL (P<0.05), followed by INORG (P<0.05), COMP (P<0.05), and lowest in UNFERT
(P<0.05) (Figure 5-1).

145
Treatment means of soil chemical properties of Pensacola bahiagrass plots are presented
in Table 5-2. Fertilizer application, regardless of source, did not influence soil extractable TN,
NO3-N, NH4-N, or Mg. Fertilizer source did have an effect on soil extractable P (P<0.05), K
(P<0.0001) and Ca (P<0.01) concentrations. Mean soil extractable P concentration was greater in
STALL compared to UNFERT (P<0.05), and mean soil K concentration was greater in STALL
compared to all other fertilizer treatments (P<0.05). Mean soil Ca concentration was greater in
INORG compared to COMP (P<0.05). Mean soil CEC was higher in INORG compared to
STALL, COMP or UNFERT (P<0.001). Fertilizer source did not affect soil pH or OM.
Although time effects were observed for many of the soil chemical properties measured,
no interactions of time x treatment were found, indicating that soil properties changed similarly
between fertilizer treatments over time. As a result, soil data for Pensacola bahiagrass were
pooled across fertilizer treatments and are presented by sampling interval in Table 5-3. An effect
of time was not detected for soil TN, but was observed for NO3-N (P<0.0001) and NH4-N
(P<0.0001). Both soil NO3-N and NH4-N experienced a decline (P<0.05) from wk 0 (before
fertilizer application) to wk 6. Soil NO3-N and NH4-N subsequently increased at wk 12 and 24
(P<0.05), but only NH4-N reached the same level observed prior to fertilizer application at wk 0.
An effect of time was also detected for soil extractable P (P<0.001), Ca (P<0.05), Mg (P<0.01),
S (P<0.0001), Zn (P<0.05), Mn (P<0.0001), Fe (P<0.01), and Cu (P<0.01) concentrations, but
not K and B concentrations. In most cases, soil mineral levels decreased in response to
fertilization (wk 0 to 6) and remained at steady concentrations through 24 wk. The exceptions to
this pattern were soil Fe, which increased throughout the 24-wk study period, and soil Cu, which
decreased from wk 0 to 6, but increased to pre-fertilization concentrations by 24 wk. Soil pH did
not change during the study period, but both CEC (P<0.05) and OM (P<0.05) decreased over
146
time. The decline in CEC and OM did not necessarily appear to be an acute response to
fertilization, but rather gradually declined over 24 wk.
No treatment x soil sampling depth interactions were observed in any of the soil chemical
properties measured; therefore, soil data were pooled across all fertilizer treatments and sampling
times and are presented in relation to sampling depth in Table 5-4. Soil NO3-N, K, Mg, Ca, S,
Zn, Mn, CEC and pH were present in higher concentrations above 15 cm than in the lower depth
profile (P<0.01). In contrast, soil extractable P and Fe were present at higher concentrations in
soil below 15 cm (P<0.0001). Sampling depth had no effect on soil TN, NH4-N, B, Cu or OM.
Experiment 2: Coastal Bermudagrass
Total DM yield and yield by harvest interval for Coastal bermudagrass are presented in
Table 5-5. For fertilized plots, the average DM yield for each 6-wk harvest interval was 1,903 kg
ha-1 and mean total yield over the 24-wk study period was 7,611 kg ha-1. An overall effect of
treatment (P<0.0001) was observed, whereby mean harvest yield was greatest for bahiagrass
fertilized with INORG (P<0.05), intermediate for STALL and COMP (P<0.05), and lowest for
UNFERT (P<0.01). Similarly, total DM yield from all harvests was greatest from plots fertilized
with INORG (P<0.05), intermediate for STALL and COMP (P<0.05), and lowest for UNFERT
(P<0.01). Contrast analysis of total yield revealed that bermudagrass responded to fertilization
with higher yields compared to the unfertilized control (P<0.0001), also total yield between use
of inorganic fertilizer was higher compared to organic sources (STALL and COMP) (P<0.001).
Over the 24-wk study, there was a significant effect of time (P<0.05) on yield of Coastal
bermudagrass, with yields generally being greatest at the wk 6 and 12 harvests (July and Aug),
followed by a progressive decline at wk 18 (Sept) and wk 24 (Nov). A significant treatment x
time interaction was not detected for DM yield. Nonetheless, separation of treatment means by
time interval demonstrated that STALL and COMP performed similarly to each other and to

147
INORG and UNFERT at the 6, 12 and 18 wk harvests. At the 24-wk harvest, fertilization with
STALL and COMP resulted in similar yield to INORG and were greater (P<0.05) than
UNFERT.
Tissue N and P concentrations of Coastal bermudagrass are presented in Table 5-5. An
overall effect of treatment was observed for tissue N (P<0.0001). Mean harvest tissue N was
greatest in plots fertilized with INORG or STALL (P<0.05), intermediate in COMP (P<0.05),
and lowest in UNFERT (P<0.05). Contrast analysis of tissue N revealed that bermudagrass
responded to fertilization with higher tissue N compared to the unfertilized control (P<0.0001),
but there was no difference in tissue N between use of inorganic fertilizer compared to organic
sources (STALL and COMP). An effect of time (P<0.0001) was observed for tissue N
concentration, but no treatment x time interaction was detected. Across treatments, tissue N
concentration increased (P<0.0001) from an average of 14 g kg-1 at wk 6 to 19.8 g kg-1 at wk 24.
Tissue crude protein concentrations calculated from N concentrations followed the same
treatment (P<0.0001) and time (P<0.0001) patterns described above for tissue N. Mean harvest
crude protein concentration was higher in INORG (18.7%), STALL (18.7%), and COMP
(16.7%) (P<0.05) than UNFERT (14.3%). Total N removed by bermudagrass during the 24-wk
study period was greater in INORG (P<0.05) compared to COMP and UNFERT (Figure 5-2).
Total N removed in plots treated with STALL were similar to INORG and COMP, but greater
than (P<0.05) than UNFERT (Figure 5-2). In contrast to N, tissue P concentration was not
affected by fertilizer treatment (Table 5-5). Contrast analysis of tissue P revealed that
bermudagrass responded to fertilization with higher tissue P compared to the unfertilized control
(P<0.0001), but there was no difference in tissue P between use of inorganic fertilizer compared
to organic sources (STALL and COMP). In addition, no effects of time or treatment x time were
148
observed for bermudagrass P concentration. However, total P removed by bermudagrass during
the 24-wk study period was affected by fertilizer treatment (P<0.01). The application of
fertilizer, regardless of source, resulted in a greater removal of P by bermudagrass compared to
unfertilized control (P<0.05) (Figure 5-2).
Treatment means of soil chemical properties of Coastal bermudagrass plots are presented
in Table 5-6. Fertilizer application, regardless of source, did not influence soil extractable TN,
NO3-N, NH4-N, P or Ca. Fertilizer source did have an effect on soil K (P<0.001) and Mg
(P<0.001) concentrations. Mean soil K concentration was greater in STALL compared to all
other fertilizer treatments (P<0.05). Mean soil Mg concentration was greater in STALL
compared to all other fertilizer treatments (P<0.05). Mean soil pH was higher in STALL
compared to INORG or COMP (P<0.01). Fertilizer source did not affect soil OM or CEC.
Although time effects were observed for many of the soil chemical properties measured,
no interactions of time x treatment were found, indicating that soil properties changed similarly
between fertilizer treatments over time. As a result, soil data for Coastal bermudagrass plots were
pooled across fertilizer treatments and are presented by sampling interval in Table 5-7. An effect
of time (P<0.0001) was detected for soil TN, NO3-N and NH4-N. Soil TN declined from wk 0 to
6 (P<0.05), but then increased to pre-fertilization levels by wk 12. Soil NO3-N was lower
(P<0.05) and soil NH4-N higher (P<0.05) at wk 6 and 12 compared to wk 0 and 24. An effect of
time was also detected for soil extractable P (P<0.01), K (P<0.001), Ca (P<0.0001), Mg
(P<0.0001), S (P<0.0001), Zn (P<0.0001), Mn (P<0.0001), Fe (P<0.05), and Cu (P<0.05)
concentrations, but not B. In most cases, soil mineral levels decreased over the course of the 24-
wk study. The exceptions to this pattern were soil extractable P, which increased at wk 6 and 12,
and soil Fe, which demonstrated a transient decrease at wk 6, followed by an increase to pre-

149
fertilization levels by wk 12. Soil pH did not change during the study period, but both CEC
(P<0.0001) and OM (P<0.05) decreased over time.
No treatment x soil sampling depth interactions were observed in any of the soil chemical
properties measured; therefore, soil data were pooled across all fertilizer treatments and sampling
times and are presented in relation to sampling depth in Table 5-8. Soil TN, P, K, Mg, Ca, Zn,
pH, CEC and OM were present in higher concentrations above 15 cm than in the lower depth
profile (P<0.001). Sampling depth had no effect on soil NO3-N, NH4-N, S, B, Mn, Fe or Cu.
Experiment 3: Florigraze Perennial Peanut
Total DM yield and yield by harvest interval for Florigraze perennial peanut are
presented in Table 5-9. For fertilized plots, the average DM yield for each 8-wk harvest interval
was 1,385 kg ha-1 and mean total yield over the 16-wk study period was 3,019 kg ha-1. An
overall effect of treatment (P<0.05) was observed, whereby mean harvest yield was greatest for
perennial peanut fertilized with INORG (P<0.05) compared to STALL, COMP and UNFERT.
Similarly, total DM yield from all harvests was greatest from plots fertilized with INORG
(P<0.05) compared to STALL, COMP and UNFERT. No differences in mean or total DM yield
were observed between STALL, COMP and UNFERT. Contrast analysis of total yield revealed
that perennial peanut responded to fertilization with higher yields compared to the unfertilized
control (P<0.0001), and inorganic fertilizer resulted in higher total yields than organic (STALL
and COMP). Over the 16-wk study, there was a significant effect of time (P<0.0001) on yield of
Perennial peanut, with yields generally being greatest at the 8 wk harvest (August) compared to
16 wk (Oct). A significant treatment x time interaction was not detected for DM yield, indicating
forage production responded similarly over time for all fertilizer treatments.
Tissue N and P concentrations of perennial peanut are presented in Table 5-9. An overall
effect of treatment was observed for tissue N (P<0.01). Mean harvest tissue N was greatest in

150
plots fertilized with COMP or UNFERT (P<0.05) compared to INORG and STALL. Contrast
analysis of tissue N revealed that perennial peanut responded to fertilization with higher tissue N
compared to the unfertilized control (P<0.01) and organic fertilizer (STALL and COMP)
resulted in higher tissue N than inorganic (P<0.01). An effect of time (P<0.01) was observed for
tissue N concentration, but no treatment x time interaction was detected. Across treatments,
tissue N concentration increased (P<0.01) from an average of 24.9 g kg-1 at wk 8 to 26.9 g kg-1 at
wk 16. Tissue crude protein concentrations calculated from N concentrations followed the same
treatment (P<0.01) and time (P<0.01) patterns described above for tissue N. Mean harvest crude
protein concentration was higher in UNFERT (17%) and COMP (16.9%) compared to INORG
(15.3%) and STALL (16%) (P<0.05). Total N removed by perennial peanut during the 16-wk
study period was greater in INORG (P<0.05) compared to COMP and UNFERT (Figure 5-3).
Total N removed in plots treated with STALL did not differ from COMP, INORG or UNFERT,
and total N removed by plots treated with COMP was similar to STALL and UNFERT (Figure
5-3). An overall effect of treatment was observed for tissue P concentration (P<0.001), whereby
mean harvest tissue P was greatest in plots receiving no fertilizer (UNFERT) (P<0.05) compared
to INORG, STALL and COMP. Contrast analysis of tissue P revealed that perennial peanut
responded to unfertilized control with higher tissue P compared to the fertilized (P<0.0001) and
organic fertilizer (STALL and COMP) resulted in higher tissue P than inorganic (P<0.0001). An
effect of time was observed for perennial peanut P concentration (P<0.0001), but not a treatment
x time interaction. Across treatments, tissue P decreased from the 8 wk to 16 wk harvest
(P<0.0001). Total P removed by perennial peanut during the 24-wk study period followed a
pattern similar to that observed for total N removal (Figure 5-3). Total P removed was greater
with application of INORG compared to COMP or UNFERT (P<0.05). Total P removed in plots

151
treated with STALL did not differ from COMP, INORG or UNFERT, and total P removed by
plots treated with COMP was similar to STALL and UNFERT (Figure 5-3).
Treatment means of soil chemical properties of perennial peanut plots are presented in
Table 5-10. Fertilizer application, regardless of source, did not influence soil extractable TN,
NO3-N, NH4-N, Ca or Mg. Fertilizer source did have an effect on soil extractable P (P<0.01) and
K (P<0.0001) concentrations. Mean soil extractable P concentration was lower in COMP
compared to all other fertilizer treatments (P<0.05). Mean soil K concentration was lower in
COMP and UNFERT compared to INORG and STALL (P<0.05). Fertilizer source did not affect
soil pH, OM or CEC.
Although time effects were observed for many of the soil chemical properties measured,
no interactions of time x treatment were found, indicating that soil properties changed similarly
between fertilizer treatments over time. As a result, soil data for perennial peanut plots were
pooled across fertilizer treatments and are presented by sampling interval in Table 5-10. An
effect of time (P<0.0001) was detected for soil NO3-N and NH4-N, but not TN. Soil NO3-N was
lower (P<0.05) and soil NH4-N higher (P<0.05) at wk 8 compared to wk 0 and wk 16. An effect
of time was also detected for soil extractable P (P<0.05), K (P<0.0001), B (P<0.001), Mn
(P<0.0001), Fe (P<0.0001), and Cu (P<0.0001) concentrations, but not Ca, Mg, S or Zn. Soil
extractable P, S, and Mn decreased and soil K, B, Fe and Cu increased over the course of the 16-
wk study. At wk 8, soil pH remained unchanged from wk 0, but decreased (P<0.05) at wk 16.
Both CEC (P<0.001) and OM (P<0.0001) increased during the study period.
No treatment x soil sampling depth interactions were observed in any of the soil chemical
properties measured from perennial peanut plots; therefore, soil data were pooled across all
fertilizer treatments and sampling times and are presented in relation to sampling depth in Table

152
5-12. Soil TN, NH4-N, P, K, Mg, Ca, S, B, Mn, pH and CEC were present in higher
concentrations above 15 cm than in the lower depth profile (P<0.01). Only soil Zn was present in
higher concentrations in the lower depth profile (P<0.0001). Sampling depth had no effect on
soil NO3-N, Fe, Cu or OM.
Discussion
Results from the bioassay indicated that unprocessed and composted horse stall materials
did not contain toxic levels of nutrients or organic acids that would affect cucumber seed
emergence or plant health and vigor. This finding varies from most reports citing that
unprocessed manure have higher potential for phytoxicity when compared to processed manure
(Wu et al., 2000; Emino and Warman, 2004).
When surface applied to bahiagrass or bermudagrass, horse stall material and compost
performed equally in regards to dry matter yield, but both generated lower yield than inorganic
fertilizer during the first 6 weeks of growth (Table 7-1; Table 7-5). In bahiagrass, which only
received a single application of fertilizer, unprocessed horse stall material produced similar dry
matter yield as inorganic fertilizer from 6 to 12 weeks. By comparison, bermudagrass received
supplemental inorganic fertilizer after every harvest, which was likely responsible for the lack of
difference in dry matter yield measured from 6 to 24 weeks between inorganic and organic
(STALL and COMP) fertilizers (Table 7-5). Perennial peanut dry matter yield was not affected
by fertilizer at the first harvest (week 8), yet fertilizer source did appear to influence the second
harvest (Table 7-9). Perennial peanut plots fertilized with inorganic fertilizer had the largest dry
matter yield, followed by organic fertilizer (STALL and COMP). Although dry matter yield in
the second harvest was lower than that observed in the first, perennial peanut plots treated with
fertilizer did out perform the unfertilized control.
153
The apparent nitrogen recovered from bahiagrass and bermudagrass fertilized with
inorganic fertilizer averaged 30%, while organic sources (STALL and COMP) had much lower
N recovery, averaging 14% (Figure 7-1; Figure 7-2). Motavalli et al. (1989) reported apparent N
recoveries of forage as 19, 19 and 15% for dairy manure application rates of 53, 97 and 138 Mg
ha-1 yr-1 (wet basis), respectively. Sullivan et al. (1997) reported cumulative annual apparent N
recoveries of 17, 28, and 36% in harvested prairiegrass receiving dairy manure with varying
application rates. In the current study the lower N recovery values observed for unprocessed and
composted stall material were an indication that very little of the N applied was available for
plant uptake during the first year of application. When calculating application rates for horse stall
materials in this study, a mineralization rate of 50% was chosen based on the warm climatic
conditions and high annual rainfall in Florida, which have been shown to enhance decomposition
of compost (Kidder, 2002). By comparison, a 20% mineralization rate of horse manure has been
reported in cooler environments (UM, 1993). During this study, the nitrogen recovery from
organic fertilizer suggests that available nitrogen from horse stall materials is closer to 25%
during the first growing season. Therefore, the low rate of available nitrogen may limit land
application of horse stall materials and compost because of the sheer volume of material that
would have to be applied to meet forage nitrogen requirements. It could also be attributed, in
part, to the dry climatic conditions at the experiment site, dry conditions do not favor compost
mineralization (Sikora and Szmidt, 2001).
The dry conditions also impacted forage growth. Additionally, more than 85% of the total
annual production of bahiagrass and bermudagrass occurs during the six warmest months (April
through September) of the year, with very little growth as the temperature drops (Mislevy and
Everett, 1981). This explains the observed lower dry matter yield during the November harvest
154
of bahiagrass and bermudagrass. A further reason might be the C:N of the compost, which was
40:1. It has been reported that compost should have a C:N of 18 or less in order to prevent a
competition between plant roots and soil microorganisms for N (Vogtmann et al., 1993).
Soil ammonium-nitrogen and nitrate-nitrogen values remained unchanged in the upper 15
cm within all forage plots, regardless of fertilizer source (Table 7-4; Table 7-8; Table 7-12). Soil
residual ammonium-nitrogen and nitrate-nitrogen concentrations were also unchanged. Chang et
al. (1991) reported that despite high ammonium concentrations in cattle feedlot manure, repeated
annual applications of the manure did not affect soil ammonium levels. Schlegel (1992) reported
annual application of beef cattle manure compost up to 16 Mg ha-1 had no effect on soil nitrate
after 2 and 4 years. Xie and MacKenzie (1986) reported similar results, showing no residual
effects on soil nitrate from 2 years of beef cattle compost applications when samples were
collected in the following spring. Sanderson and Jones (1997) reported soil nitrate increased with
increasing manure application rate, but nitrate concentrations below 15 cm were not affected by
manure treatment. These authors further reported that although nitrate levels in the soil
increased, a maximum of only 7 mg kg-1 accumulated in the surface 15 cm of soil. It is not know
if inorganic N changed below 15 cm due to leaching, but the drought conditions would have
minimized the chance for leaching losses.
In the current study, soil extractable phosphorus did not increase in response to application
of unprocessed or composted stall material (Table 7-3; Table 7-7; Table 7-11). Evidence of prior
manure application was apparent on the bahiagrass plots where soil extractable phosphorus was
significantly higher than that observed in the bermudagrass or perennial peanut plots. In fact, a
swine production facility had been located near the bahiagrass field site 10 years prior. The
majority of the soil extractable phosphorus in the bahiagrass plots was located at the 15-30 cm in

155
depth, compared to bermudagrass and peanut plots where phosphorus accumulated in 0-15 cm
profile. A 7 year study conducted by Ferguson and Nienaber (2000) reported soil extractable
phosphorus levels in the top 0.6 m increased significantly with application of beef feedlot
manure or compost, but no evidence of phosphorus movement below that depth was observed.
Similarly, Chang et al. (1991) found that increases in soil extractable phosphorus were restricted
to the upper 30 cm zone after 11 annual applications of feedlot manure under irrigated, and under
non-irrigated conditions.
During this study, soil organic matter was not enhanced due to application of horse stall
material, an increase in soil organic matter may require more than one yearly application of
compost, particularly on Florida’s sandy soils (Butler and Muir, 2006; Ferreras et al., 2006).
Conclusion
The surface application of either fresh or composted horse stall material to bahiagrass,
bermudagrass and perennial peanut resulted in higher forage yield than the unfertilized control.
In many cases, one or both of these organic fertilizers performed equally as well as inorganic
fertilizer. However, addtional factors other than yield should be considered when using organic
fertilizer sources for pasture or hay crop fertilization. Application of unprocessed horse stall
material may be disadvantageous due to the potential to spread weed seeds and intestinal
parasites, fly and odor production, suppression of forage growth and the potential for
contamination of surface and groundwater (James, 2003; Lyons et al., 1999; Major et al., 2005;
Watson et al., 1998). In contrast, composting horse stall materials prior to land application may
aid in the destruction of weed seeds and internal parasites, along with fly eggs and larvae (Lyons
et al., 1999; Major et al., 2005; Watson et al., 1998). Mineralization rate of compost made from
horse stall materials is slow; therefore nutrients will continue to be supplied to forages for years
after application. Ultimately, while unprocessed horse stall material may have slightly

156
outperformed compost in this study, use of compost has more benefits over manure when overall
pasture management is considered.
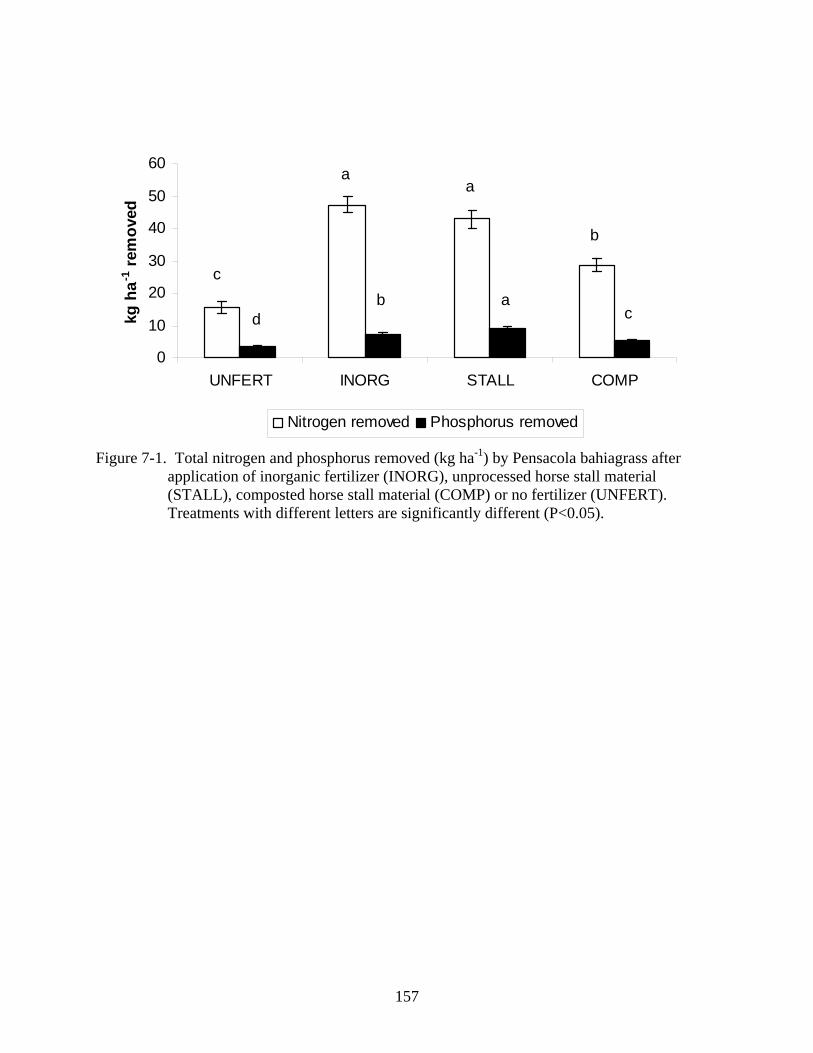
157
0
10
20
30
40
50
60
UNFERT INORG STALL COMP
kg h
a-1 r
emov
ed
Nitrogen removed Phosphorus removed
c
b
aa
d cb a
Figure 7-1. Total nitrogen and phosphorus removed (kg ha-1) by Pensacola bahiagrass after
application of inorganic fertilizer (INORG), unprocessed horse stall material (STALL), composted horse stall material (COMP) or no fertilizer (UNFERT). Treatments with different letters are significantly different (P<0.05).

158
0
50
100
150
200
UNFERT INORG STALL COMP
kg h
a-1 re
mov
ed
Nitrogen removed Phosphorus removed
ba a a
c
ba,b
a
Figure 7-2. Total nitrogen and phosphorus removed (kg ha-1) by Coastal bermudagrass after
application of inorganic fertilizer (INORG), unprocessed horse stall material (STALL), composted horse stall material (COMP) or no fertilizer (UNFERT). Treatments with different letters are significantly different (P<0.05).

159
0
20
40
60
80
100
UNFERT INORG STALL COMP
kg h
a-1 re
mov
ed
Nitrogen removed Phosphorus removed
aa,b
b b
a,bb ba
Figure 7-3. Total nitrogen and phosphorus removed (kg ha-1) by Florigraze perennial peanut
after application of inorganic fertilizer (INORG), unprocessed horse stall material (STALL), composted horse stall material (COMP) or no fertilizer (UNFERT). Treatments with different letters are significantly different (P<0.05).

160
Table 7-1. Forage dry matter (DM) yield and tissue nitrogen and phosphorus concentrations in Pensacola bahiagrass after application of inorganic fertilizer (INORG), unprocessed horse stall material (STALL), composted horse stall material (COMP) or no fertilizer (UNFERT).
Treatments p-value Week UNFERT INORG STALL COMP SEM† Trt Week Trt*Week DM Yield 6 636c,x 2066a,x 1397b,x 1375b,x 130 0.0001 (kg ha-1) 12 603b,x 1711a,y 1694a,x 1063b,x 111 0.0001 18 792x 627z 756y 718y 48 0.8686 24 122b,y 181a,b,z 250a,z 192a,b,z 13 0.0056 Mean 487c 1282a 1062a 860b 132 0.0001 0.0001 0.0001 Total 1624c 4062a 3718a 2869b 250 0.0001 Nitrogen 6 8.3c,x 13.4a,w 12.9a,x 10.6b,x 0.45 0.0001 (g kg-1) 12 9.6a,b,y 9.2a,b,x 10.1a,y 8.6b,y 0.20 0.0001 18 10.3y 11.4y 11.0y 10.1x 0.24 0.3092 24 14.1z 14.1z 14.1z 13.2z 0.18 0.1810 Mean 10.6 a 12.2 b 12.2 b 10.7 a 0.50 0.0001 0.0001 0.0001 Phosphorus 6 1.8b,x 1.8b,x 2.5a,x 1.7b,x 0.07 0.0001 (g kg-1) 12 2.2a,y 1.6b,x 1.3c,y 1.7b,x 0.07 0.0002 18 2.5y 2.6y 2.6x 2.4y 0.05 0.3895 24 2.7b,y 2.4b,y 3.2a,z 2.7b,z 0.07 0.0002 Mean 2.3b 2.0c 2.6a 2.1c 0.07 0.0001 0.0001 0.0002 †Standard error mean. a,b,c Within a row, means lacking a common superscript differ (P< 0.05).w,x,y,z Within a column, means lacking a common superscript differ (P<0.05).
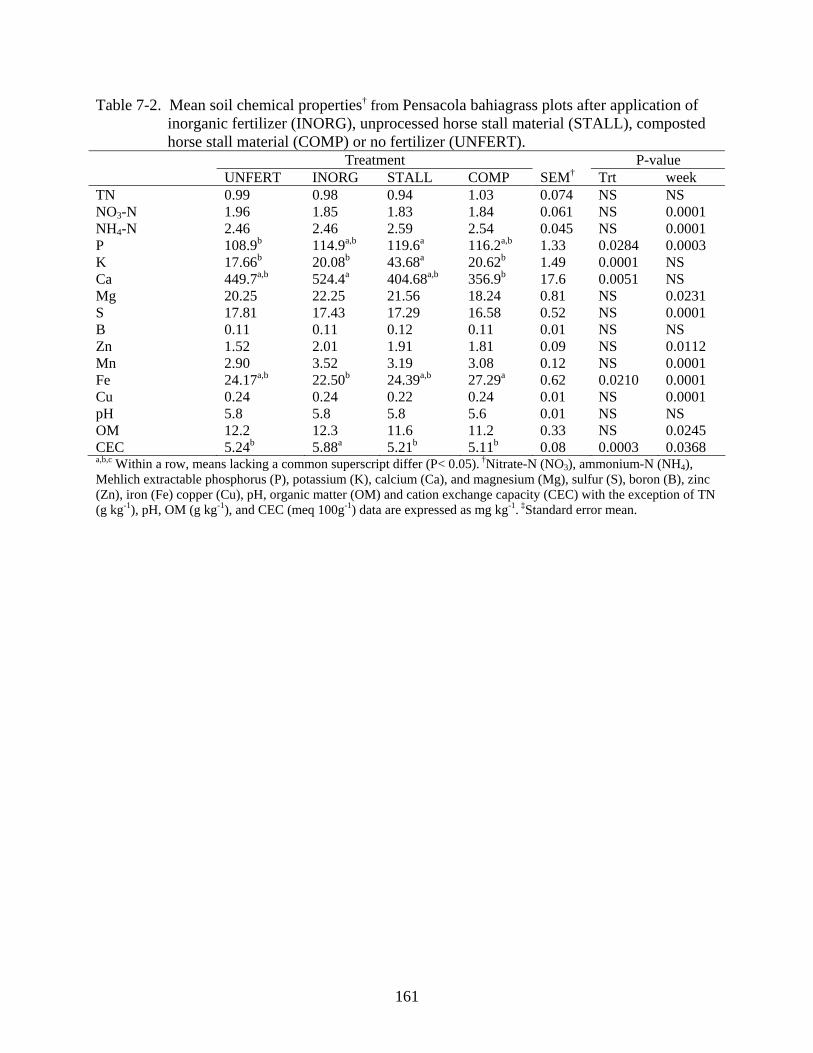
161
Table 7-2. Mean soil chemical properties† from Pensacola bahiagrass plots after application of inorganic fertilizer (INORG), unprocessed horse stall material (STALL), composted horse stall material (COMP) or no fertilizer (UNFERT).
Treatment P-value UNFERT INORG STALL COMP SEM† Trt week TN 0.99 0.98 0.94 1.03 0.074 NS NS NO3-N 1.96 1.85 1.83 1.84 0.061 NS 0.0001 NH4-N 2.46 2.46 2.59 2.54 0.045 NS 0.0001 P 108.9b 114.9a,b 119.6a 116.2a,b 1.33 0.0284 0.0003 K 17.66b 20.08b 43.68a 20.62b 1.49 0.0001 NS Ca 449.7a,b 524.4a 404.68a,b 356.9b 17.6 0.0051 NS Mg 20.25 22.25 21.56 18.24 0.81 NS 0.0231 S 17.81 17.43 17.29 16.58 0.52 NS 0.0001 B 0.11 0.11 0.12 0.11 0.01 NS NS Zn 1.52 2.01 1.91 1.81 0.09 NS 0.0112 Mn 2.90 3.52 3.19 3.08 0.12 NS 0.0001 Fe 24.17a,b 22.50b 24.39a,b 27.29a 0.62 0.0210 0.0001 Cu 0.24 0.24 0.22 0.24 0.01 NS 0.0001 pH 5.8 5.8 5.8 5.6 0.01 NS NS OM 12.2 12.3 11.6 11.2 0.33 NS 0.0245 CEC 5.24b 5.88a 5.21b 5.11b 0.08 0.0003 0.0368 a,b,c Within a row, means lacking a common superscript differ (P< 0.05). †Nitrate-N (NO3), ammonium-N (NH4), Mehlich extractable phosphorus (P), potassium (K), calcium (Ca), and magnesium (Mg), sulfur (S), boron (B), zinc (Zn), iron (Fe) copper (Cu), pH, organic matter (OM) and cation exchange capacity (CEC) with the exception of TN (g kg-1), pH, OM (g kg-1), and CEC (meq 100g-1) data are expressed as mg kg-1. ‡Standard error mean.
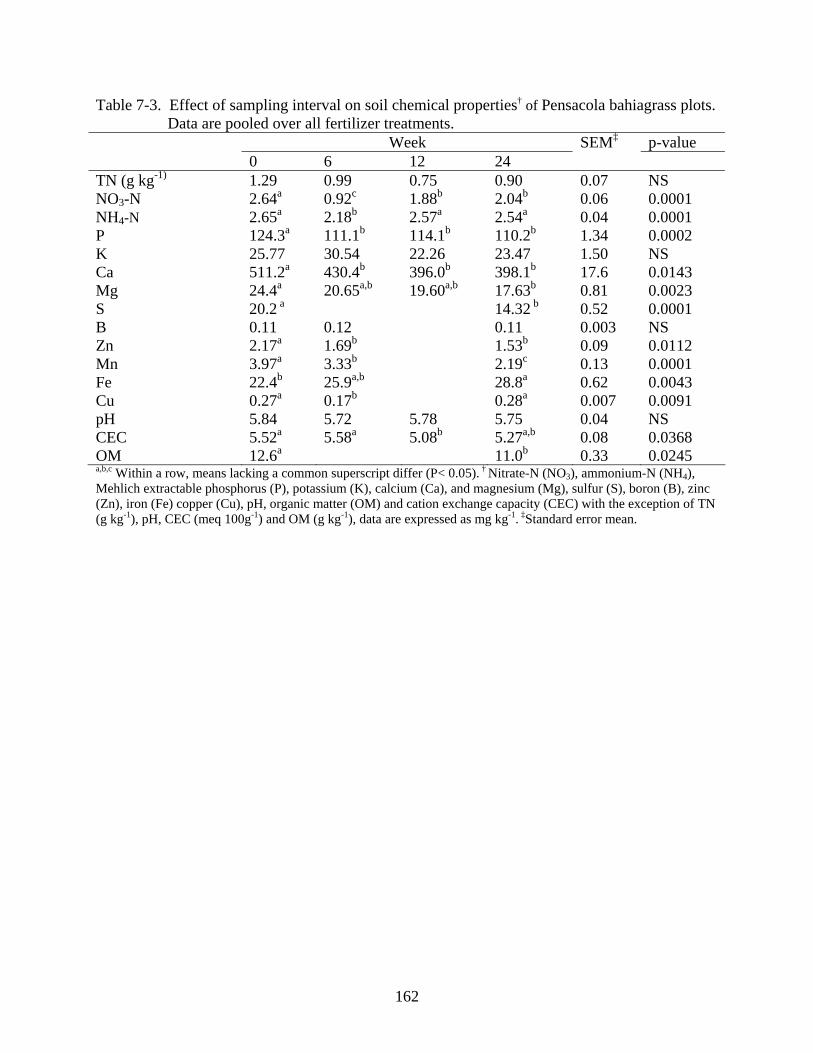
162
Table 7-3. Effect of sampling interval on soil chemical properties† of Pensacola bahiagrass plots. Data are pooled over all fertilizer treatments.
Week SEM‡ p-value 0 6 12 24 TN (g kg-1) 1.29 0.99 0.75 0.90 0.07 NS NO3-N 2.64a 0.92c 1.88b 2.04b 0.06 0.0001 NH4-N 2.65a 2.18b 2.57a 2.54a 0.04 0.0001 P 124.3a 111.1b 114.1b 110.2b 1.34 0.0002 K 25.77 30.54 22.26 23.47 1.50 NS Ca 511.2a 430.4b 396.0b 398.1b 17.6 0.0143 Mg 24.4a 20.65a,b 19.60a,b 17.63b 0.81 0.0023 S 20.2 a 14.32 b 0.52 0.0001 B 0.11 0.12 0.11 0.003 NS Zn 2.17a 1.69b 1.53b 0.09 0.0112 Mn 3.97a 3.33b 2.19c 0.13 0.0001 Fe 22.4b 25.9a,b 28.8a 0.62 0.0043 Cu 0.27a 0.17b 0.28a 0.007 0.0091 pH 5.84 5.72 5.78 5.75 0.04 NS CEC 5.52a 5.58a 5.08b 5.27a,b 0.08 0.0368 OM 12.6a 11.0b 0.33 0.0245 a,b,c Within a row, means lacking a common superscript differ (P< 0.05). † Nitrate-N (NO3), ammonium-N (NH4), Mehlich extractable phosphorus (P), potassium (K), calcium (Ca), and magnesium (Mg), sulfur (S), boron (B), zinc (Zn), iron (Fe) copper (Cu), pH, organic matter (OM) and cation exchange capacity (CEC) with the exception of TN (g kg-1), pH, CEC (meq 100g-1) and OM (g kg-1), data are expressed as mg kg-1. ‡Standard error mean.

163
Table 7-4. Effect of sampling depth on soil chemical properties† of Pensacola bahiagrass plots. Data are pooled over all fertilizer treatments and sampling intervals.
Soil Sampling Depth 0-15 cm 15-30 cm SEM‡ P-value Total N 1.04 0.93 0.07 NS NO3-N 2.00 1.74 0.06 0.0019 NH4-N 2.54 2.42 0.04 NS P 109.9 119.9 1.33 0.0001 K 35.67 15.35 1.49 0.0001 Mg 27.02 14.13 0.81 0.0001 Ca 561.9 305.9 17.62 0.0001 S 18.47 16.08 0.52 0.0049 B 0.11 0.11 0.003 NS Zn 2.21 1.41 0.09 0.0001 Mn 3.49 2.86 0.13 0.0036 Fe 23.01 26.1 0.62 0.0001 Cu 0.24 0.22 0.007 NS pH 6.05 5.49 0.04 0.0001 CEC 5.89 4.82 0.08 0.0001 OM 12.0 11.6 0.34 NS †Nitrate-N (NO3), ammonium-N (NH4), Mehlich extractable phosphorus (P), potassium (K), calcium (Ca), and magnesium (Mg), sulfur (S), boron (B), zinc (Zn), iron (Fe) copper (Cu), pH, organic matter (OM) and cation exchange capacity (CEC) with the exception of TN (g kg-1), pH, CEC (meq 100g-1) and OM (g kg-1), data are expressed as mg kg-1. ‡Standard error mean.

164
Table 7-5. Forage dry matter (DM) yield and tissue nitrogen and phosphorus concentrations in Coastal bermudagrass after application of inorganic fertilizer (INORG), unprocessed horse stall material (STALL), composted horse stall material (COMP) or no fertilizer (UNFERT).
Treatment p-value Week UNFERT INORG STALL COMP SEM† Trt Week Trt*WeekDM Yield 6 755b 2622a,x 1520a,b 1161a,b 244 0.0315 (kg ha-1) 12 1108b 2415a,x 2103a,b 2240a,b 192 0.0336 18 798 2154 1868 2175 199 0.0837 24 287b 1654a,y 1344a 1582a 135 0.0001 Mean 721c 2211a 1708b 1789b 166 0.0001 0.0154 0.6375 Total 2762c 8844a 6833b 7157b 393 0.0001 Nitrogen 6 12.6x 15.8x 15.1x 12.6x 0.62 0.1507 (g kg-1) 12 14.9x 17.6x,y 18.1x 14.9y 0.65 0.1713 18 16.2y 20.1y 19.6y 17.9y 0.77 0.2818 24 13.8b,x 21.5a,y 22.4a,y 21.5a,z 0.74 0.0001 Mean 14.3c 18.7a 18.7a 16.7b 0.60 0.0001 0.0001 0.2674 Phosphorus 6 2.0 1.9 2.0 1.8 0.06 0.8088 (g kg-1) 12 2.1 1.7 1.8 1.8 0.07 0.2129 18 2.2 1.8 2.1 2.1 0.09 0.3743 24 2.0 1.9 2.0 1.8 0.06 0.4824 Mean 2.1 1.8 2.0 1.9 0.07 0.1456 0.3594 0.7971 †Standard error mean. a,b,c Within a row, means lacking a common superscript differ (P< 0.05). w,x,y,z Within a column, means lacking a common superscript differ (P<0.05).

165
Table 7-6. Mean soil chemical properties† from Coastal bermudagrass plots after application of inorganic fertilizer (INORG), unprocessed horse stall material (STALL), composted horse stall material (COMP) or no fertilizer (UNFERT).
Treatment p-value UNFERT INORG STALL COMP SEM‡ Trt Week TN 0.98 0.96 1.01 1.01 0.01 NS 0.0001 NO3-N 2.53 2.55 2.75 2.77 0.07 NS 0.0001 NH4-N 3.57 3.51 3.51 3.72 0.06 NS 0.0001 P 29.73 30.55 31.57 29.09 0.49 NS 0.0070 K 54.24 57.36 65.68 55.68 1.31 0.0005 0.0004 Ca 227.1b 233.9b 272.7a 225.1b 8.71 NS 0.0001 Mg 13.64b 12.61b 16.41a 13.11b 0.41 0.0002 0.0001 S 5.10 7.23 7.63 7.42 0.44 NS 0.0655 B 0.15a 0.12b 0.15a 0.15a 0.01 0.0113 0.0029 Zn 0.58 0.61 0.59 0.56 0.03 NS 0.0001 Mn 5.30 5.35 5.44 5.44 0.13 NS 0.0001 Fe 16.21 15.41 14.91 15.86 0.34 NS 0.0224 Cu 0.21 0.23 0.18 0.19 0.01 NS 0.0482 pH 5.6a,b 5.6b 5.7a 5.6b 0.02 0.0030 NS CEC 4.51 4.79 4.72 4.71 0.06 NS 0.0001 OM 12.54 12.70 12.65 12.99 0.21 NS 0.0240 †Nitrate-N (NO3), ammonium-N (NH4), Mehlich extractable phosphorus (P), potassium (K), calcium (Ca), and magnesium (Mg), sulfur (S), boron (B), zinc (Zn), iron (Fe) copper (Cu), pH, organic matter (OM) and cation exchange capacity (CEC) with the exception of TN (g kg-1), pH, OM (g kg-1), and CEC (meq 100g-1) data are expressed as mg kg-1. ‡Standard error mean. a,b,c Within a row, means lacking a common superscript letter differ (P< 0.05).

166
Table 7-7. Effect of sampling interval on soil chemical properties† of Coastal bermudagrass plots. Data are pooled over all fertilizer treatments.
Week 0 6 12 24 SEM‡ P-value Total N 0.99a 0.83b 1.07a 1.02a 0.01 0.0001 NO3-N 3.57a 2.29b 2.06b 2.91a 0.07 0.0001 NH4-N 3.07b 4.12a 4.21a 2.91b 0.06 0.0001 P 26.0a,b 29.29b 32.8a 28.8b 0.49 0.0070 K 71.9a 58.94a 60.1a 50.9b 1.3 0.0004 Ca 308.3a 233.6b 262.4a,b 169.8c 0.4 0.0001 Mg 16.5a,b 13.76b 16.3a,b 10.6c 8.7 0.0001 S 9.08a 7.65b 0.44 0.0001 B 0.15 0.12 0.15 0.01 NS Zn 0.95a 0.56a,b 0.39b 0.03 0.0001 Mn 6.17a 5.30a,b 4.39b 0.13 0.0001 Fe 16.7a 15.7b 16.7a 0.3 0.0224 Cu 0.40a 0.20b 0.16b 0.01 0.0482 pH 5.68 5.61 5.67 5.58 0.02 NS CEC 5.07a 4.84a 4.96a 4.19b 0.06 0.0001 OM 15.6a 12.3b 0.23 0.0208 †Nitrate-N (NO3), ammonium-N (NH4), Mehlich extractable phosphorus (P), potassium (K), calcium (Ca), and magnesium (Mg), sulfur (S), boron (B), zinc (Zn), iron (Fe) copper (Cu), pH, organic matter (OM) and cation exchange capacity (CEC) with the exception of TN (g kg-1), pH, OM (g kg-1), and CEC (meq 100g-1) data are expressed as mg kg-1. ‡Standard error mean. a,b,c Within a row, means lacking a common superscript differ (P< 0.05).
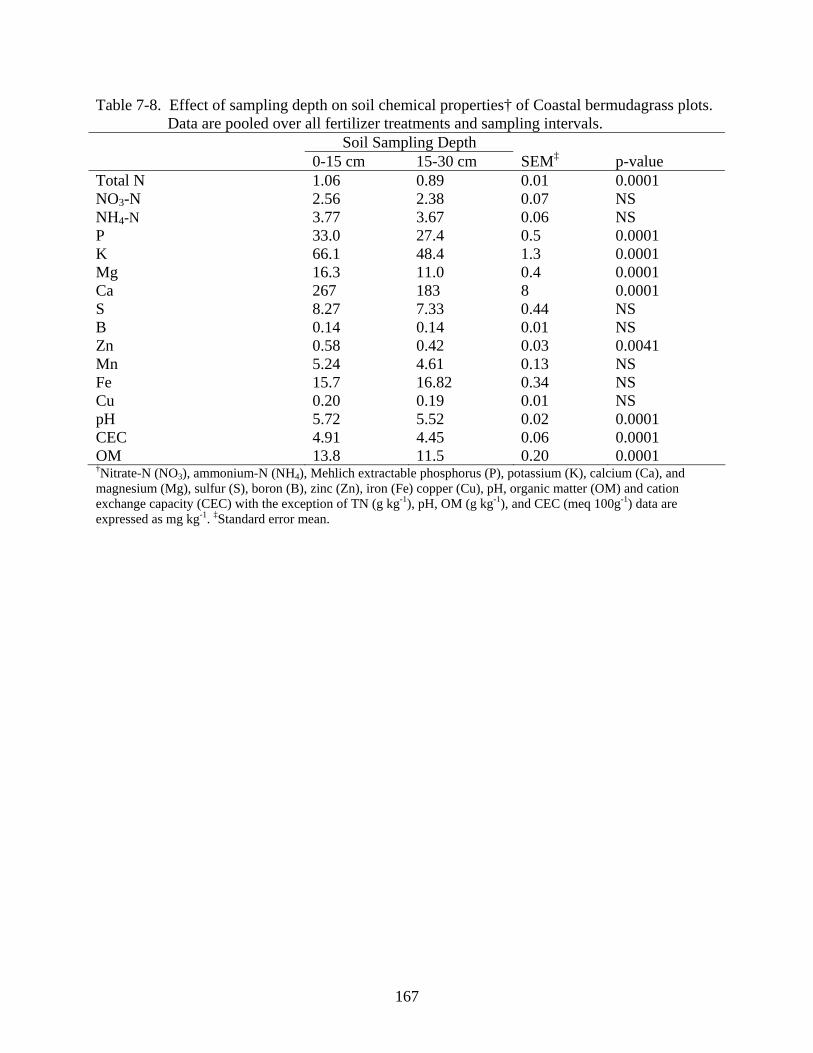
167
Table 7-8. Effect of sampling depth on soil chemical properties† of Coastal bermudagrass plots. Data are pooled over all fertilizer treatments and sampling intervals.
Soil Sampling Depth 0-15 cm 15-30 cm SEM‡ p-value Total N 1.06 0.89 0.01 0.0001 NO3-N 2.56 2.38 0.07 NS NH4-N 3.77 3.67 0.06 NS P 33.0 27.4 0.5 0.0001 K 66.1 48.4 1.3 0.0001 Mg 16.3 11.0 0.4 0.0001 Ca 267 183 8 0.0001 S 8.27 7.33 0.44 NS B 0.14 0.14 0.01 NS Zn 0.58 0.42 0.03 0.0041 Mn 5.24 4.61 0.13 NS Fe 15.7 16.82 0.34 NS Cu 0.20 0.19 0.01 NS pH 5.72 5.52 0.02 0.0001 CEC 4.91 4.45 0.06 0.0001 OM 13.8 11.5 0.20 0.0001 †Nitrate-N (NO3), ammonium-N (NH4), Mehlich extractable phosphorus (P), potassium (K), calcium (Ca), and magnesium (Mg), sulfur (S), boron (B), zinc (Zn), iron (Fe) copper (Cu), pH, organic matter (OM) and cation exchange capacity (CEC) with the exception of TN (g kg-1), pH, OM (g kg-1), and CEC (meq 100g-1) data are expressed as mg kg-1. ‡Standard error mean.
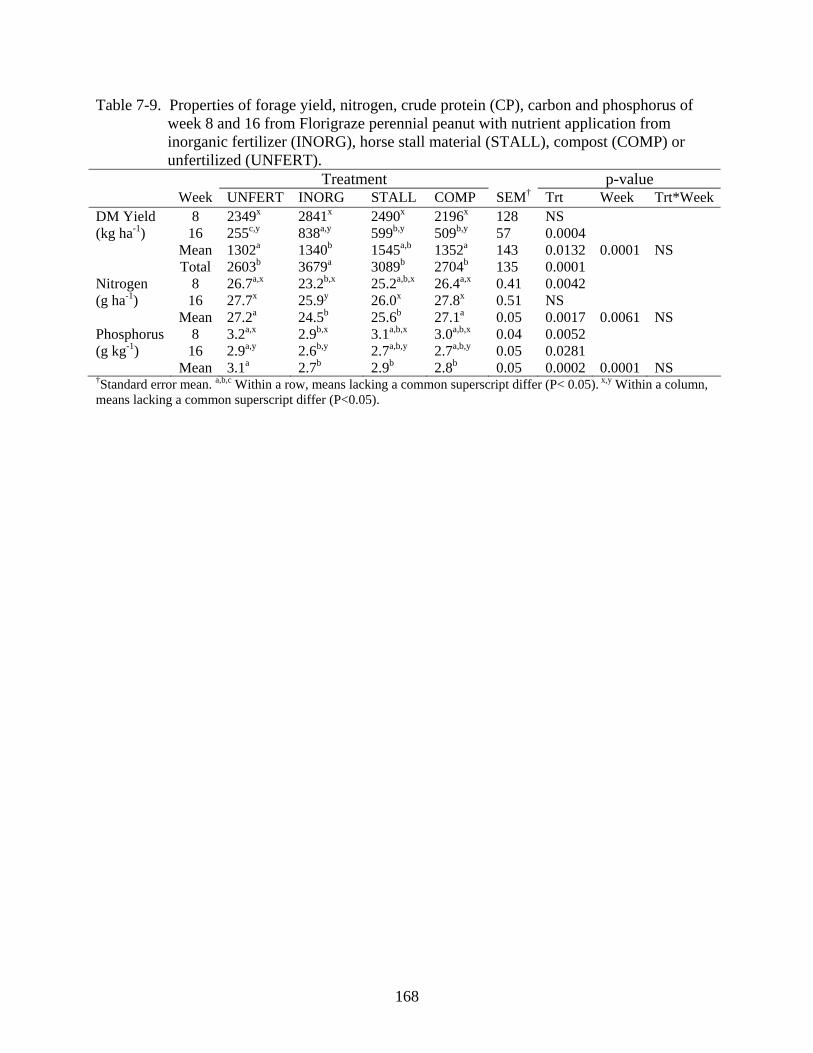
168
Table 7-9. Properties of forage yield, nitrogen, crude protein (CP), carbon and phosphorus of week 8 and 16 from Florigraze perennial peanut with nutrient application from inorganic fertilizer (INORG), horse stall material (STALL), compost (COMP) or unfertilized (UNFERT).
Treatment p-value Week UNFERT INORG STALL COMP SEM† Trt Week Trt*WeekDM Yield 8 2349x 2841x 2490x 2196x 128 NS (kg ha-1) 16 255c,y 838a,y 599b,y 509b,y 57 0.0004 Mean 1302a 1340b 1545a,b 1352a 143 0.0132 0.0001 NS Total 2603b 3679a 3089b 2704b 135 0.0001 Nitrogen 8 26.7a,x 23.2b,x 25.2a,b,x 26.4a,x 0.41 0.0042 (g ha-1) 16 27.7x 25.9y 26.0x 27.8x 0.51 NS Mean 27.2a 24.5b 25.6b 27.1a 0.05 0.0017 0.0061 NS Phosphorus 8 3.2a,x 2.9b,x 3.1a,b,x 3.0a,b,x 0.04 0.0052 (g kg-1) 16 2.9a,y 2.6b,y 2.7a,b,y 2.7a,b,y 0.05 0.0281 Mean 3.1a 2.7b 2.9b 2.8b 0.05 0.0002 0.0001 NS †Standard error mean. a,b,c Within a row, means lacking a common superscript differ (P< 0.05). x,y Within a column, means lacking a common superscript differ (P<0.05).
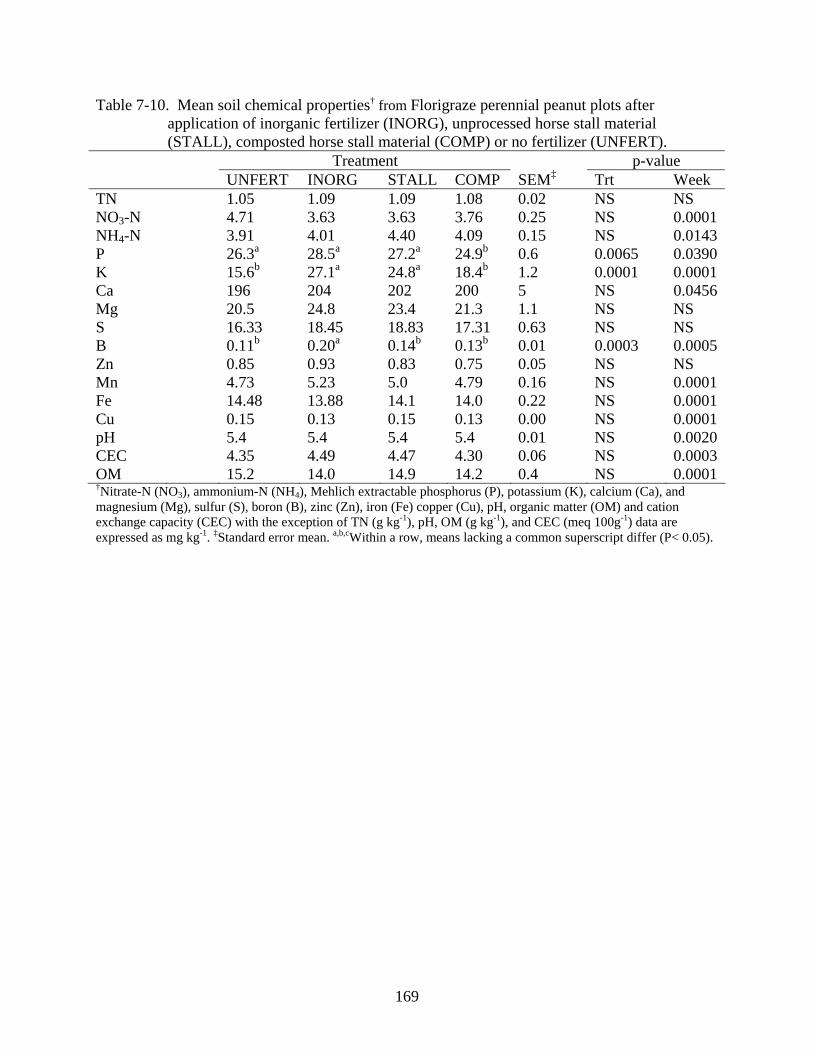
169
Table 7-10. Mean soil chemical properties† from Florigraze perennial peanut plots after application of inorganic fertilizer (INORG), unprocessed horse stall material (STALL), composted horse stall material (COMP) or no fertilizer (UNFERT).
Treatment p-value UNFERT INORG STALL COMP SEM‡ Trt Week TN 1.05 1.09 1.09 1.08 0.02 NS NS NO3-N 4.71 3.63 3.63 3.76 0.25 NS 0.0001 NH4-N 3.91 4.01 4.40 4.09 0.15 NS 0.0143 P 26.3a 28.5a 27.2a 24.9b 0.6 0.0065 0.0390 K 15.6b 27.1a 24.8a 18.4b 1.2 0.0001 0.0001 Ca 196 204 202 200 5 NS 0.0456 Mg 20.5 24.8 23.4 21.3 1.1 NS NS S 16.33 18.45 18.83 17.31 0.63 NS NS B 0.11b 0.20a 0.14b 0.13b 0.01 0.0003 0.0005 Zn 0.85 0.93 0.83 0.75 0.05 NS NS Mn 4.73 5.23 5.0 4.79 0.16 NS 0.0001 Fe 14.48 13.88 14.1 14.0 0.22 NS 0.0001 Cu 0.15 0.13 0.15 0.13 0.00 NS 0.0001 pH 5.4 5.4 5.4 5.4 0.01 NS 0.0020 CEC 4.35 4.49 4.47 4.30 0.06 NS 0.0003 OM 15.2 14.0 14.9 14.2 0.4 NS 0.0001 †Nitrate-N (NO3), ammonium-N (NH4), Mehlich extractable phosphorus (P), potassium (K), calcium (Ca), and magnesium (Mg), sulfur (S), boron (B), zinc (Zn), iron (Fe) copper (Cu), pH, organic matter (OM) and cation exchange capacity (CEC) with the exception of TN (g kg-1), pH, OM (g kg-1), and CEC (meq 100g-1) data are expressed as mg kg-1. ‡Standard error mean. a,b,cWithin a row, means lacking a common superscript differ (P< 0.05).

170
Table 7-11. Effect of sampling interval on soil chemical properties† of Florigraze perennial
peanut plots. Data are pooled over all fertilizer treatments. Week 0 8 16 SEM‡ P-value Total N 1.12 1.07 1.05 0.02 NS NO3-N 5.69a 1.86c 4.26b 0.25 0.0001 NH4-N 3.82b 4.63a 3.86b 0.15 0.0135 P 27.8a 25.6b 26.7a,b 0.60 0.0351 K 19.3b 18.3b 26.9a 1.15 0.0001 Ca 213 205 185 1.01 NS Mg 23.9 23.1 20.5 5.69 NS S 18.6 16.8 0.64 NS B 0.12b 0.17a 0.01 0.0005 Zn 0.85 0.83 0.06 NS Mn 5.61a 4.35b 0.16 0.0001 Fe 12.6b 15.6a 0.22 0.0001 Cu 0.11b 0.17a 0.01 0.0001 pH 5.41a 5.43a 5.32b 0.01 0.0023 CEC 4.13b 4.64a 4.45a 0.06 0.0003 OM 12.8b 16.3a 0.01 0.0001 †Nitrate-N (NO3), ammonium-N (NH4), Mehlich extractable phosphorus (P), potassium (K), calcium (Ca), and magnesium (Mg), sulfur (S), boron (B), zinc (Zn), iron (Fe) copper (Cu), pH, organic matter (OM) and cation exchange capacity (CEC) with the exception of TN (g kg-1), pH, OM (g kg-1), and CEC (meq 100g-1) data are expressed as mg kg-1. ‡Standard error mean. a,b,c Within a row, means lacking a common superscript differ (P< 0.05).

171
Table 7-12. Effect of sampling depth on soil chemical properties† of Florigraze perennial peanut
plots. Data are pooled over all fertilizer treatments and sampling intervals. Depth 0-15 cm 15-30 cm SEM‡ p-value Total N 1.7 0.98 0.02 0.0001 NO3-N 3.96 3.90 0.25 NS NH4-N 4.99 3.21 0.15 0.0001 P 32.2 21.2 0.60 0.0001 K 29.1 13.8 1.15 0.0001 Mg 32.0 12.9 1.01 0.0001 Ca 239 165 5.69 0.0001 S 19.6 15.8 0.64 0.0023 B 0.18 0.12 0.01 0.0003 Zn 0.12 0.56 0.06 0.0001 Mn 6.04 3.93 0.16 0.0001 Fe 13.9 14.3 0.22 NS Cu 0.14 0.14 0.01 NS pH 5.44 5.34 0.01 0.0008 CEC 4.78 4.02 0.06 0.0003 OM 14.3 14.8 0.10 NS †Nitrate-N (NO3), ammonium-N (NH4), Mehlich extractable phosphorus (P), potassium (K), calcium (Ca), and magnesium (Mg), sulfur (S), boron (B), zinc (Zn), iron (Fe) copper (Cu), pH, organic matter (OM) and cation exchange capacity (CEC) with the exception of TN (g kg-1), pH, OM (g kg-1), and CEC (meq 100g-1) data are expressed as mg kg-1. ‡Standard error mean.

172
CHAPTER 8 IMPLICATIONS
These studies demonstrated that composting horse stall material can be a beneficial
management tool in the horse industry. Composting substantially reduces the volume of stall
materials, thereby decreasing the amount of material to dispose of or land apply to pastures.
Within the first 2 weeks of composting horse stall materials, temperatures were elevated high
enough to kill pathogens, parasites, and fly larvae and to inactivate weed seeds. Nitrogen is
commonly used to amend horse stall material prior to composting due to high carbon content in
bedding, yet these studies indicated that bedding type had a larger influence on decomposition
rates than nitrogen amendment. Horse manure and wood shavings mixtures, with or without
added nitrogen, showed a greater degree of decomposition than hay bedding. Yet, nitrogen loss
due to volatilization was increased when stall materials were amended with nitrogen. The use of
slow-release nitrogen sources were found to decrease loss of nitrogen, due to volatization,
compared to urea nitrogen. The compost amended with nitrogen contained higher concentrations
of soluble nitrogen, such as nitrates and ammonium, compared to unamended materials. Nitrates
and ammonium have the potential to pollute surface and groundwater if applied in excess of
agronomic rates onto pastures. At the same time, nitrogen amendment may increase the value of
compost as a fertilizer, because the nitrogen is in a form readily available to plants.
Results from land application studies using horse stall materials as fertilizer suggest that
unprocessed and composted stall material can reduce or replace the use of inorganic fertilizers in
bahiagrass, bermudagrass and perennial peanut without reduction in forage quality or dry matter
yield production. Composted horse stall material could decrease the cost of manure disposal and
purchase of inorganic fertilizer, recycle nutrients and reduce environmental degradation by
stabilizing nutrient that may threaten water quality. During this study, soil extractable

173
phosphorus was not increased due to application from horse stall materials, which is a common
concern when using organic sources as fertilizers. When organic materials are applied at
agronomic rates, plants will absorb and utilize the majority of applied nitrogen and phosphorus.
During this study, unprocessed horse stall materials outperformed compost, yet the use of
compost has more benefits over manure when overall pasture management is considered.
Application of unprocessed horse stall material may spread weed seeds and intestinal parasites,
cause fly and odor production, and have the potential for contamination of surface and
groundwater. Composting stall material prior to land application will correct some of the
perturbations caused by unprocessed material.
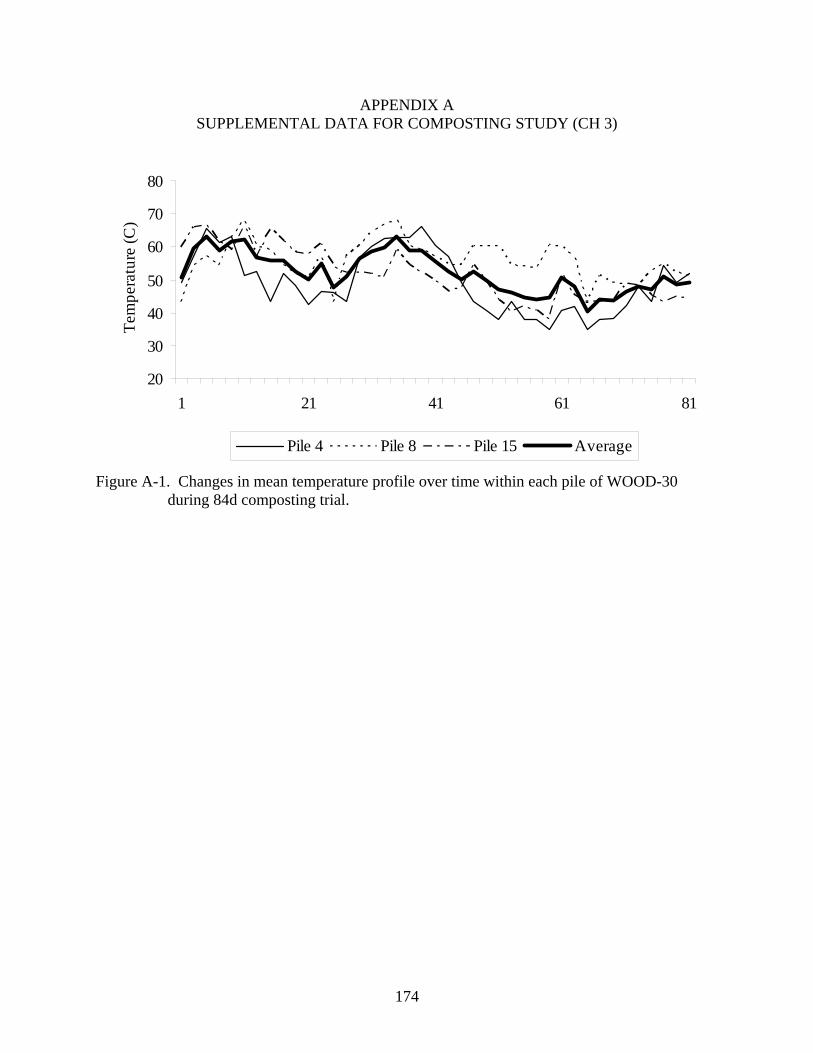
174
APPENDIX A SUPPLEMENTAL DATA FOR COMPOSTING STUDY (CH 3)
20
30
40
50
60
70
80
1 21 41 61 81
Tem
pera
ture
(C)
Pile 4 Pile 8 Pile 15 Average
Figure A-1. Changes in mean temperature profile over time within each pile of WOOD-30 during 84d composting trial.
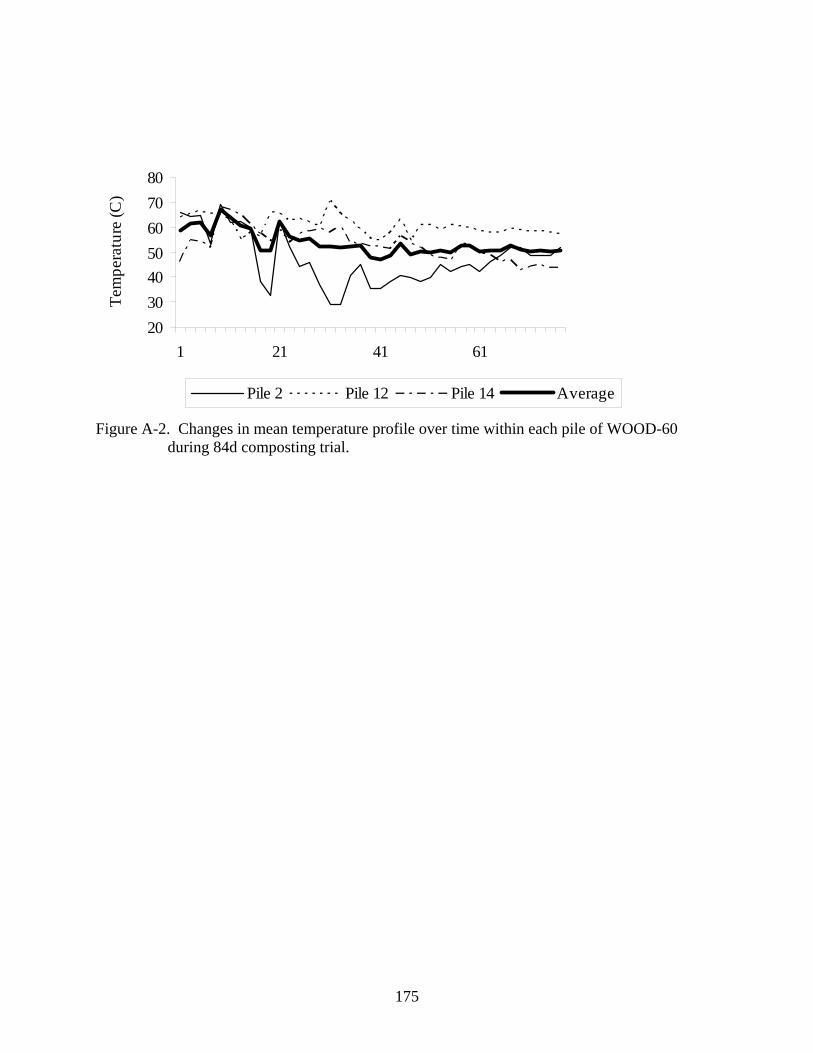
175
20304050607080
1 21 41 61
Tem
pera
ture
(C)
Pile 2 Pile 12 Pile 14 Average
Figure A-2. Changes in mean temperature profile over time within each pile of WOOD-60 during 84d composting trial.

176
20304050607080
1 21 41 61
Tem
pera
ture
(C)
Pile 1 Pile 6 Pile 11 Average
Figure A-4. Changes in mean temperature profile over time within each pile of WOOD-CON during 84d composting trial.
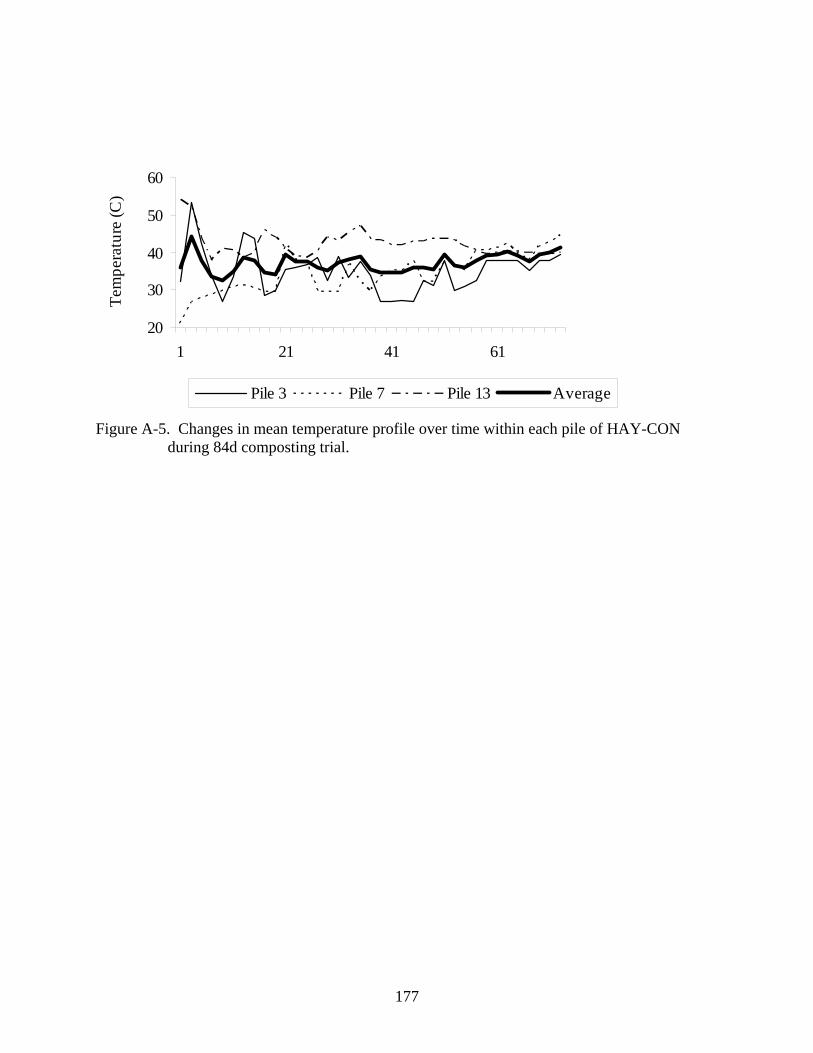
177
20
30
40
50
60
1 21 41 61
Tem
pera
ture
(C)
Pile 3 Pile 7 Pile 13 Average
Figure A-5. Changes in mean temperature profile over time within each pile of HAY-CON during 84d composting trial.

178
20
30
40
50
60
1 21 41 61
Tem
pera
ture
(C)
Pile 5 Pile 10 Pile 16 Average
Figure A-6. Changes in mean temperature profile over time within each pile of HAY-15 during 84 d composting trial.
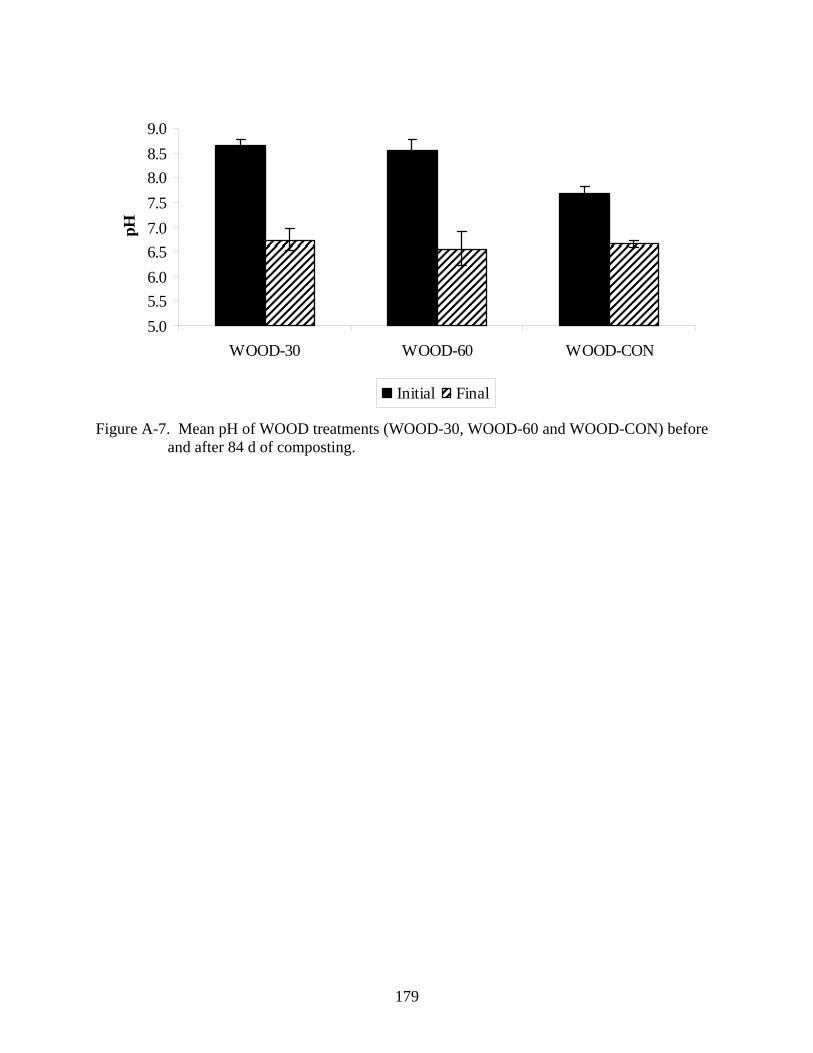
179
5.05.56.06.57.07.58.08.59.0
WOOD-30 WOOD-60 WOOD-CON
pH
Initial Final
Figure A-7. Mean pH of WOOD treatments (WOOD-30, WOOD-60 and WOOD-CON) before and after 84 d of composting.
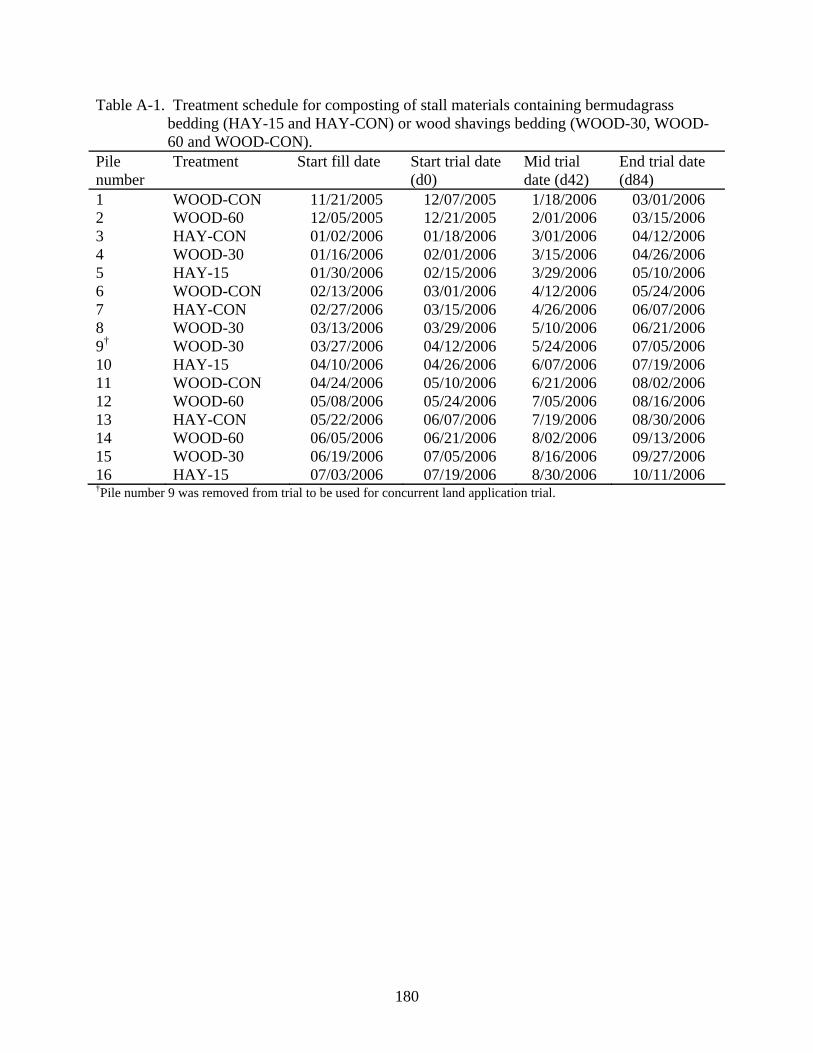
180
Table A-1. Treatment schedule for composting of stall materials containing bermudagrass bedding (HAY-15 and HAY-CON) or wood shavings bedding (WOOD-30, WOOD-60 and WOOD-CON).
Pile number
Treatment Start fill date Start trial date (d0)
Mid trial date (d42)
End trial date (d84)
1 WOOD-CON 11/21/2005 12/07/2005 1/18/2006 03/01/2006 2 WOOD-60 12/05/2005 12/21/2005 2/01/2006 03/15/2006 3 HAY-CON 01/02/2006 01/18/2006 3/01/2006 04/12/2006 4 WOOD-30 01/16/2006 02/01/2006 3/15/2006 04/26/2006 5 HAY-15 01/30/2006 02/15/2006 3/29/2006 05/10/2006 6 WOOD-CON 02/13/2006 03/01/2006 4/12/2006 05/24/2006 7 HAY-CON 02/27/2006 03/15/2006 4/26/2006 06/07/2006 8 WOOD-30 03/13/2006 03/29/2006 5/10/2006 06/21/2006 9† WOOD-30 03/27/2006 04/12/2006 5/24/2006 07/05/2006 10 HAY-15 04/10/2006 04/26/2006 6/07/2006 07/19/2006 11 WOOD-CON 04/24/2006 05/10/2006 6/21/2006 08/02/2006 12 WOOD-60 05/08/2006 05/24/2006 7/05/2006 08/16/2006 13 HAY-CON 05/22/2006 06/07/2006 7/19/2006 08/30/2006 14 WOOD-60 06/05/2006 06/21/2006 8/02/2006 09/13/2006 15 WOOD-30 06/19/2006 07/05/2006 8/16/2006 09/27/2006 16 HAY-15 07/03/2006 07/19/2006 8/30/2006 10/11/2006 †Pile number 9 was removed from trial to be used for concurrent land application trial.

181
APPENDIX B SUPPLEMENTAL DATA FOR COMPOSTING STUDY (CH 4)
40
45
50
55
60
65
70
1 26 51 76 101
Day
Tem
pera
ture
(C)
Figure B-1. Changes in mean temperature profile over time within each pile of CON during 120
d composting trial.

182
40
45
50
55
60
65
70
75
1 26 51 76 101
Day
Tem
pera
ture
(C)
Figure B-2. Changes in mean temperature profile over time within each pile of UREA during
120 d composting trial.
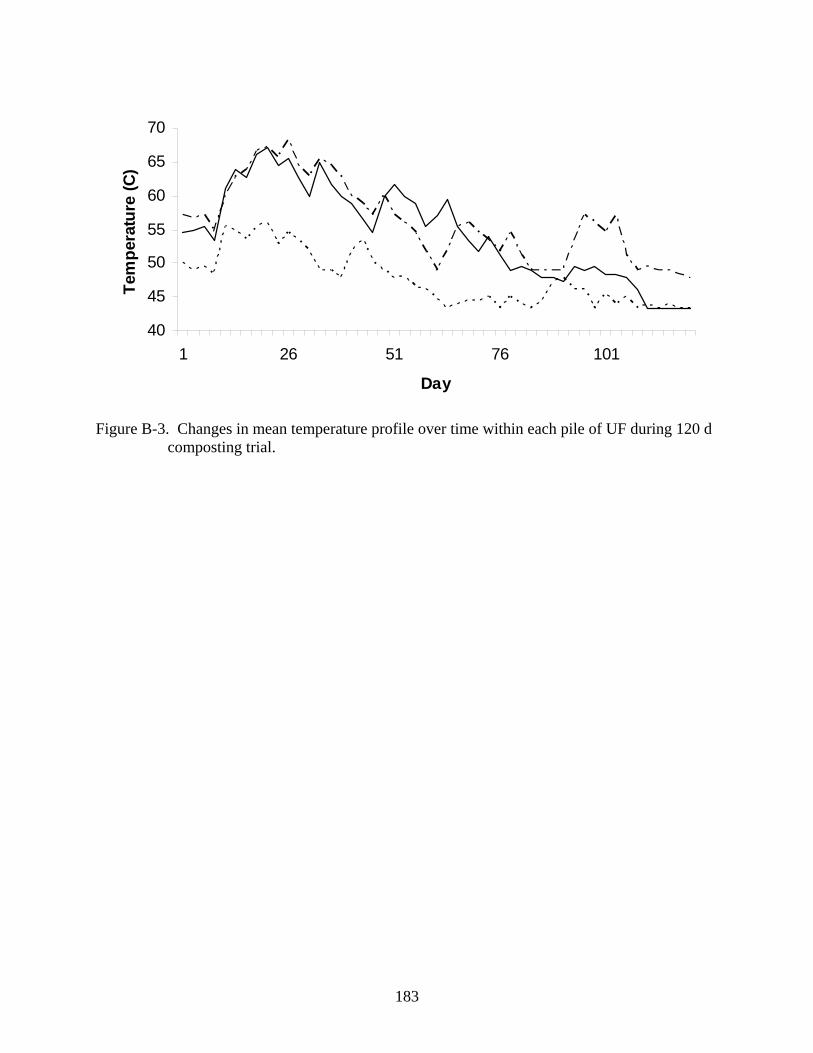
183
40
45
50
55
60
65
70
1 26 51 76 101
Day
Tem
pera
ture
(C)
Figure B-3. Changes in mean temperature profile over time within each pile of UF during 120 d
composting trial.
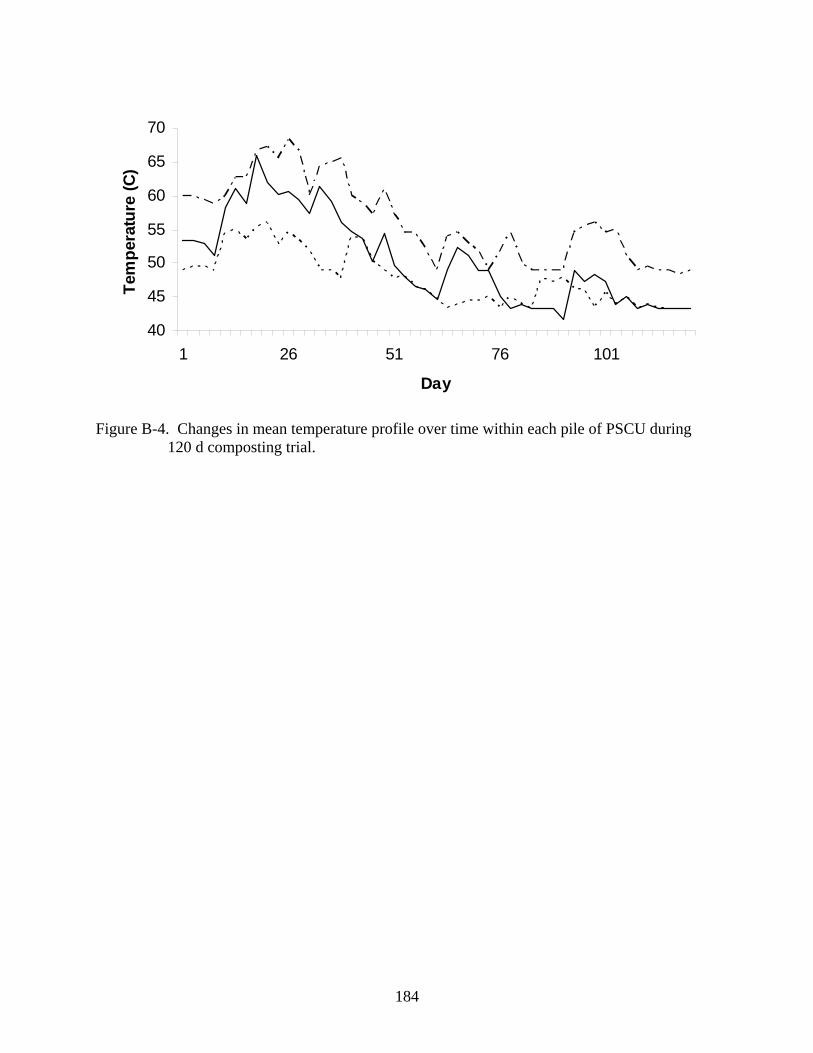
184
40
45
50
55
60
65
70
1 26 51 76 101
Day
Tem
pera
ture
(C)
Figure B-4. Changes in mean temperature profile over time within each pile of PSCU during
120 d composting trial.

185
0
4E+10
8E+10
1.2E+11
1.6E+11
0 30 60 90 120
Mic
roor
gani
sms
(cfu
)
Aerobic Anaerobic Pseudumonas
Figure B-1. Microbial profile of aerobic, anaerobic and pseudomonas for all treatments (CON, UREA, PSCU, and UF) during composting of horse stall material for 120 d.

186
0
50000000
100000000
150000000
200000000
250000000
0 30 60 90 120
Mic
roor
gani
sms
(cfu
)
N-fixing Actinomycetes Fungi
Figure B-2. Microbial profile of N-fixing, actinomycetes and fungi for all treatments (CON, UREA, PSCU, and UF) during composting of horse stall material for 120 d.
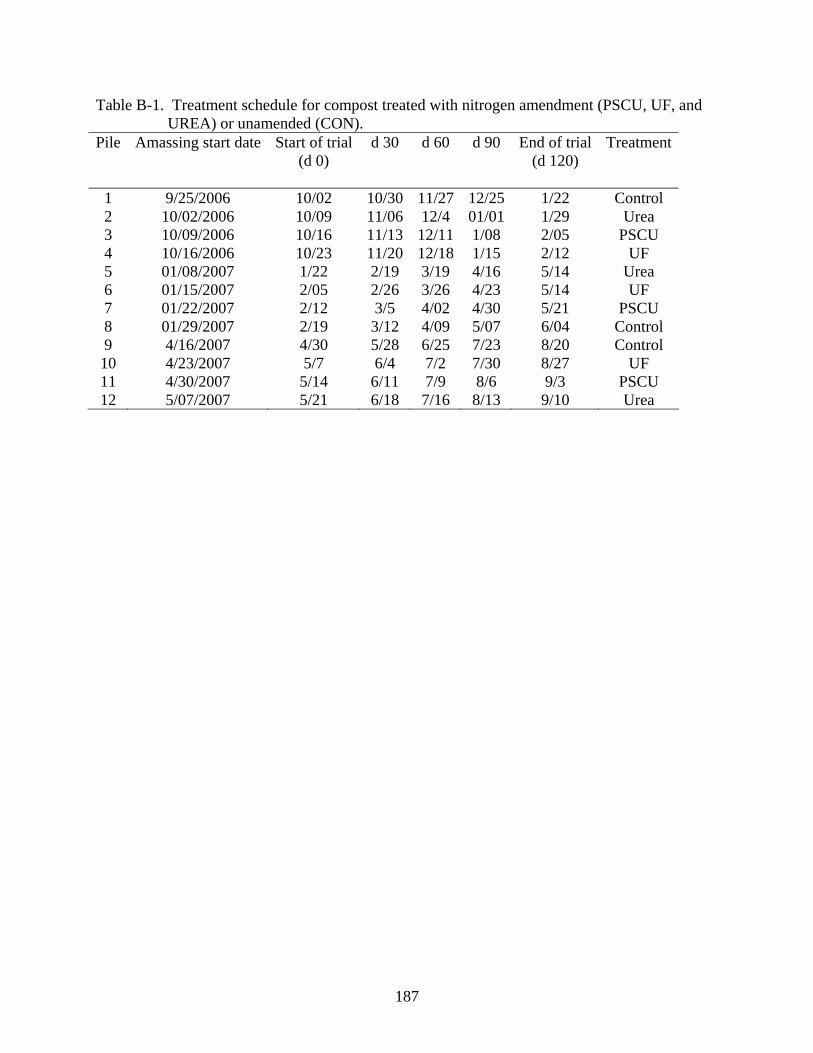
187
Table B-1. Treatment schedule for compost treated with nitrogen amendment (PSCU, UF, and UREA) or unamended (CON).
Pile Amassing start date Start of trial (d 0)
d 30 d 60 d 90 End of trial (d 120)
Treatment
1 9/25/2006 10/02 10/30 11/27 12/25 1/22 Control 2 10/02/2006 10/09 11/06 12/4 01/01 1/29 Urea 3 10/09/2006 10/16 11/13 12/11 1/08 2/05 PSCU 4 10/16/2006 10/23 11/20 12/18 1/15 2/12 UF 5 01/08/2007 1/22 2/19 3/19 4/16 5/14 Urea 6 01/15/2007 2/05 2/26 3/26 4/23 5/14 UF 7 01/22/2007 2/12 3/5 4/02 4/30 5/21 PSCU 8 01/29/2007 2/19 3/12 4/09 5/07 6/04 Control 9 4/16/2007 4/30 5/28 6/25 7/23 8/20 Control 10 4/23/2007 5/7 6/4 7/2 7/30 8/27 UF 11 4/30/2007 5/14 6/11 7/9 8/6 9/3 PSCU 12 5/07/2007 5/21 6/18 7/16 8/13 9/10 Urea

188
Table B-2. Concentrations (%, dry weight basis) of neutral detergent fiber (NDF), acid detergent fiber (ADF), lignin, total carbon (C), and organic matter (OM) in horse stall materials before (d 0) and after 120 d of composting. Materials were either treated with nitrogen amendment (PSCU, UF or UREA) or remained unamended (CON) prior to composting.
% Treatment P-value Day CON PSCU UF UREA SEM Trt Day Trt*Day NDF d 0 87.4 83.1 85.9 83.4 1.04 NS d 120 86.2a 85.8a 82.9b 88.5a 0.75 0.043 Mean 86.8 84.4 84.4 85.9 1.18 NS NS NS ADF d 0 71.3 67.4 65.9 63.5 1.35 NS d 120 74.6 74.5 72.0 74.4 0.57 NS Mean 72.9 70.9 68.9 68.9 1.34 NS NS NS Lignin d 0 24.1 20.8 21.9 21.5 0.60 NS d 120 27.9 26.5 22.3 29.2 1.17 NS Mean 25.9 23.6 22.1 25.3 1.18 NS NS NS C d 0 45.8 43.8 44.3 43.7 0.37 NS d 120 42.5 42.8 40.0 42.6 0.46 0.076 Mean 44.1 43.3 42.2 43.2 0.47 0.069 0.0001 0.062 OM d 0 96.3a,x 90.6b,x 93.5b,x 89.4b,x 1.04 0.024 d 120 89.3x 88.5x 83.6y 90.1x 1.19 NS Mean 92.8 89.5 88.5 89.7 1.32 NS 0.0034 0.049
a,b Means within a row with different letters are significantly different (P< 0.05).x,y Means within a column with different letters are significantly different (P<0.05).
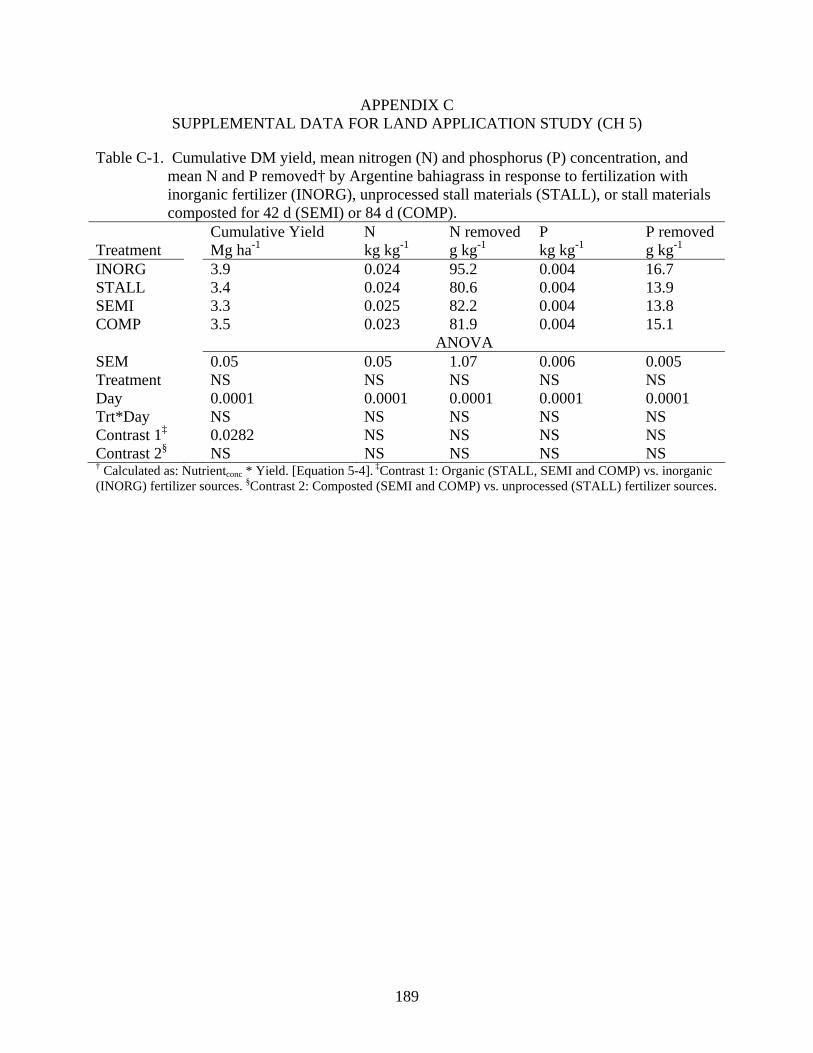
189
APPENDIX C SUPPLEMENTAL DATA FOR LAND APPLICATION STUDY (CH 5)
Table C-1. Cumulative DM yield, mean nitrogen (N) and phosphorus (P) concentration, and mean N and P removed† by Argentine bahiagrass in response to fertilization with inorganic fertilizer (INORG), unprocessed stall materials (STALL), or stall materials composted for 42 d (SEMI) or 84 d (COMP).
Cumulative Yield N N removed P P removed Treatment Mg ha-1 kg kg-1 g kg-1 kg kg-1 g kg-1 INORG 3.9 0.024 95.2 0.004 16.7 STALL 3.4 0.024 80.6 0.004 13.9 SEMI 3.3 0.025 82.2 0.004 13.8 COMP 3.5 0.023 81.9 0.004 15.1 ANOVA SEM 0.05 0.05 1.07 0.006 0.005 Treatment NS NS NS NS NS Day 0.0001 0.0001 0.0001 0.0001 0.0001 Trt*Day NS NS NS NS NS Contrast 1‡ 0.0282 NS NS NS NS Contrast 2§ NS NS NS NS NS † Calculated as: Nutrientconc * Yield. [Equation 5-4]. ‡Contrast 1: Organic (STALL, SEMI and COMP) vs. inorganic (INORG) fertilizer sources. §Contrast 2: Composted (SEMI and COMP) vs. unprocessed (STALL) fertilizer sources.

190
Table C-2. Mean soil parameters (organic matter (OM), pH, cation exchange capacity (CEC), Ammonia nitrogen (NH4), calcium (Ca), magnesium (Mg), potassium (K) and phosphorus (P) in response to fertilization with inorganic fertilizer (INORG), unprocessed stall materials (STALL), or stall materials composted for 42 d (SEMI) or 84 d (COMP).
Soil Mehlich-1 Treatment OM pH CEC NH4 Ca Mg K P g kg-1 meg 100ml-1 mg kg-1 mg kg-1 mg kg-1 mg kg-1 mg kg-1 INORG 29.4 6.9 11.6 3.1 1861 113 100z 84 STALL 30.4 7.0 12.0 3.4 1873 127 142x 89 SEMI 28.7 6.9 10.8 3.1 1703 118 113y 93 COMP 29.1 6.9 10.9 3.2 1720 115 105y 84 ANOVA SEM 1.83 0.03 0.45 0.14 76.7 4.6 4.4 3.6 Trt NS NS NS NS NS 0.086 0.0001 NS Day 0.0001 0.0001 0.0001 0.0001 0.0001 0.0001 0.0001 0.0001Trt x Day NS NS NS NS NS NS 0.0001 NS Contrast 1† NS NS NS NS NS NS 0.0002 NS Contrast 2‡ NS NS 0.024 NS 0.0456 0.0335 0.0001 NS
†Contrast 1: Organic (STALL, SEMI and COMP) vs. inorganic (INORG) fertilizer sources. ‡Contrast 2: Composted (SEMI and COMP) vs. unprocessed (STALL) fertilizer sources.
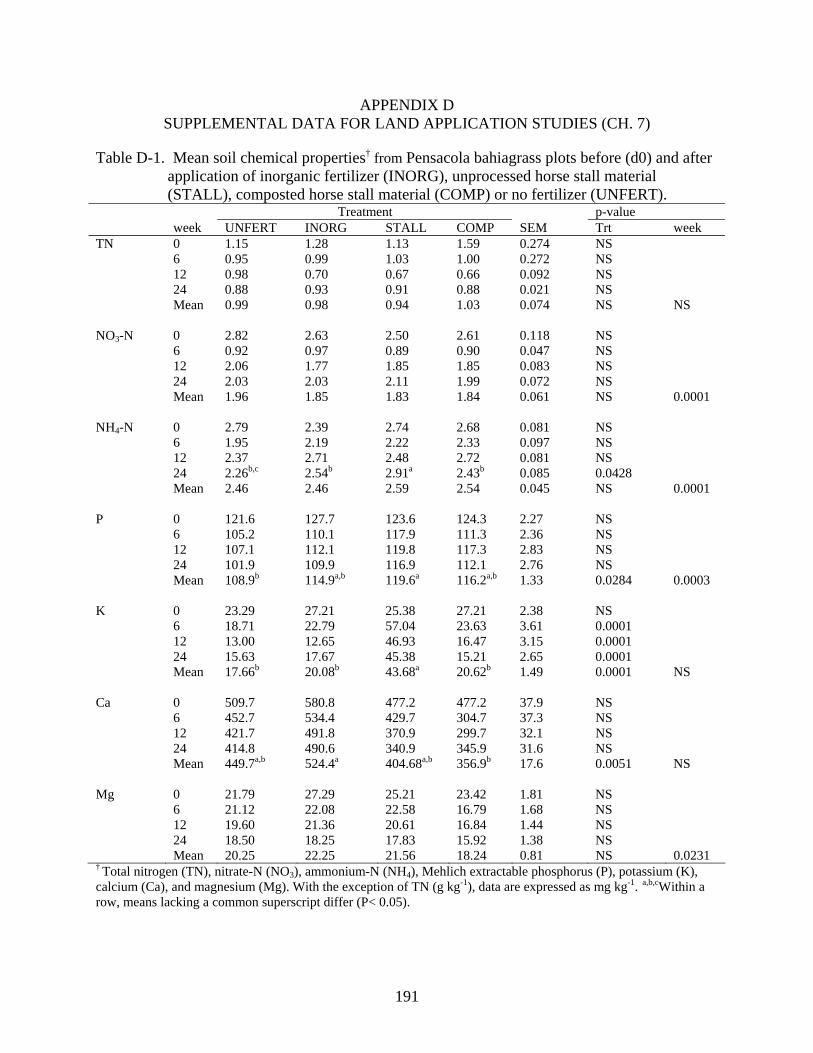
191
APPENDIX D SUPPLEMENTAL DATA FOR LAND APPLICATION STUDIES (CH. 7)
Table D-1. Mean soil chemical properties† from Pensacola bahiagrass plots before (d0) and after application of inorganic fertilizer (INORG), unprocessed horse stall material (STALL), composted horse stall material (COMP) or no fertilizer (UNFERT).
Treatment p-value week UNFERT INORG STALL COMP SEM Trt week TN 0 1.15 1.28 1.13 1.59 0.274 NS 6 0.95 0.99 1.03 1.00 0.272 NS 12 0.98 0.70 0.67 0.66 0.092 NS 24 0.88 0.93 0.91 0.88 0.021 NS Mean 0.99 0.98 0.94 1.03 0.074 NS NS NO3-N 0 2.82 2.63 2.50 2.61 0.118 NS 6 0.92 0.97 0.89 0.90 0.047 NS 12 2.06 1.77 1.85 1.85 0.083 NS 24 2.03 2.03 2.11 1.99 0.072 NS Mean 1.96 1.85 1.83 1.84 0.061 NS 0.0001 NH4-N 0 2.79 2.39 2.74 2.68 0.081 NS 6 1.95 2.19 2.22 2.33 0.097 NS 12 2.37 2.71 2.48 2.72 0.081 NS 24 2.26b,c 2.54b 2.91a 2.43b 0.085 0.0428 Mean 2.46 2.46 2.59 2.54 0.045 NS 0.0001 P 0 121.6 127.7 123.6 124.3 2.27 NS 6 105.2 110.1 117.9 111.3 2.36 NS 12 107.1 112.1 119.8 117.3 2.83 NS 24 101.9 109.9 116.9 112.1 2.76 NS Mean 108.9b 114.9a,b 119.6a 116.2a,b 1.33 0.0284 0.0003 K 0 23.29 27.21 25.38 27.21 2.38 NS 6 18.71 22.79 57.04 23.63 3.61 0.0001 12 13.00 12.65 46.93 16.47 3.15 0.0001 24 15.63 17.67 45.38 15.21 2.65 0.0001 Mean 17.66b 20.08b 43.68a 20.62b 1.49 0.0001 NS Ca 0 509.7 580.8 477.2 477.2 37.9 NS 6 452.7 534.4 429.7 304.7 37.3 NS 12 421.7 491.8 370.9 299.7 32.1 NS 24 414.8 490.6 340.9 345.9 31.6 NS Mean 449.7a,b 524.4a 404.68a,b 356.9b 17.6 0.0051 NS Mg 0 21.79 27.29 25.21 23.42 1.81 NS 6 21.12 22.08 22.58 16.79 1.68 NS 12 19.60 21.36 20.61 16.84 1.44 NS 24 18.50 18.25 17.83 15.92 1.38 NS Mean 20.25 22.25 21.56 18.24 0.81 NS 0.0231 † Total nitrogen (TN), nitrate-N (NO3), ammonium-N (NH4), Mehlich extractable phosphorus (P), potassium (K), calcium (Ca), and magnesium (Mg). With the exception of TN (g kg-1), data are expressed as mg kg-1. a,b,cWithin a row, means lacking a common superscript differ (P< 0.05).

192
Table D-2. Mean soil chemical properties† from Coastal bermuda plots before (d0) and after application of inorganic fertilizer (INORG), unprocessed horse stall material (STALL), composted horse stall material (COMP) or no fertilizer (UNFERT).
Treatment p-value Week UNFERT INORG STALL COMP SEM Trt Week TN 0 1.01 1.03 1.09 1.04 0.02 NS 6 0.85 0.81 0.82 0.85 0.02 NS 12 1.05 1.01 1.12 1.10 0.03 NS 24 1.02 1.00 1.02 1.05 0.02 NS Mean 0.98 0.96 1.01 1.01 0.01 NS 0.0001 NO3 0 3.25 3.27 3.28 3.55 0.11 NS 6 2.04 2.04 2.73 2.39 0.17 NS 12 2.00 2.08 2.00 2.17 0.13 NS 24 2.84 2.82 2.99 2.97 0.10 NS Mean 2.53 2.55 2.75 2.77 0.07 NS 0.0001 NH4 0 3.24 2.82 3.08 3.16 0.10 NS 6 3.93 4.15 3.95 4.45 0.10 NS 12 4.09 4.14 4.18 4.41 0.10 NS 24 3.02 2.94 2.82 2.85 0.10 NS Mean 3.57 3.51 3.51 3.72 0.06 NS 0.0001 P 0 29.08 30.92 29.29 30.88 0.77 NS 6 29.27 29.20 31.95 26.77 0.81 NS 12 30.83 33.67 35.83 30.88 1.36 NS 24 29.75 28.41 29.21 27.88 0.75 NS Mean 29.73 30.55 31.57 29.09 0.49 NS 0.0070 K 0 61.67 60.12 64.17 66.25 3.14 NS 6 49.53b 58.11a,b 73.48a 54.65b 2.95 0.0023 12 58.21a,b 60.75a,b 67.92a 53.58b 2.08 0.0407 24 47.54b 50.46a,b 57.17a 48.25a,b 1.81 0.0381 Mean 54.24 57.36 65.68 55.68 1.31 0.0005 0.0004 Ca 0 241.6 290.8 311.1 328.5 19.2 NS 6 267.1 232.8 254.8 179.7 14.7 NS 12 248.0 245.4 336.5 219.9 19.3 NS 24 151.8 166.5 188.6 172.5 10.1 NS Mean 227.1 233.9 272.7 225.1 8.71 NS 0.0001 Mg 0 13.92 14.88 16.3 15.25 0.67 NS 6 14.56 12.59 15.50 12.42 0.68 NS 12 15.96a,b 13.79b 20.92a 14.58a,b 1.03 0.0250 24 10.12a,b 9.17b 12.88a 10.21a,b 0.62 0.0334 Mean 13.64 12.61 16.41 13.11 0.41 0.0002 0.0001 † Total nitrogen (TN), nitrate-N (NO3), ammonium-N (NH4), Mehlich extractable phosphorus (P), potassium (K), calcium (Ca), and magnesium (Mg). With the exception of TN (g kg-1), data are expressed as mg kg-1. a,b,c Within a row, means lacking a common superscript differ (P< 0.05).
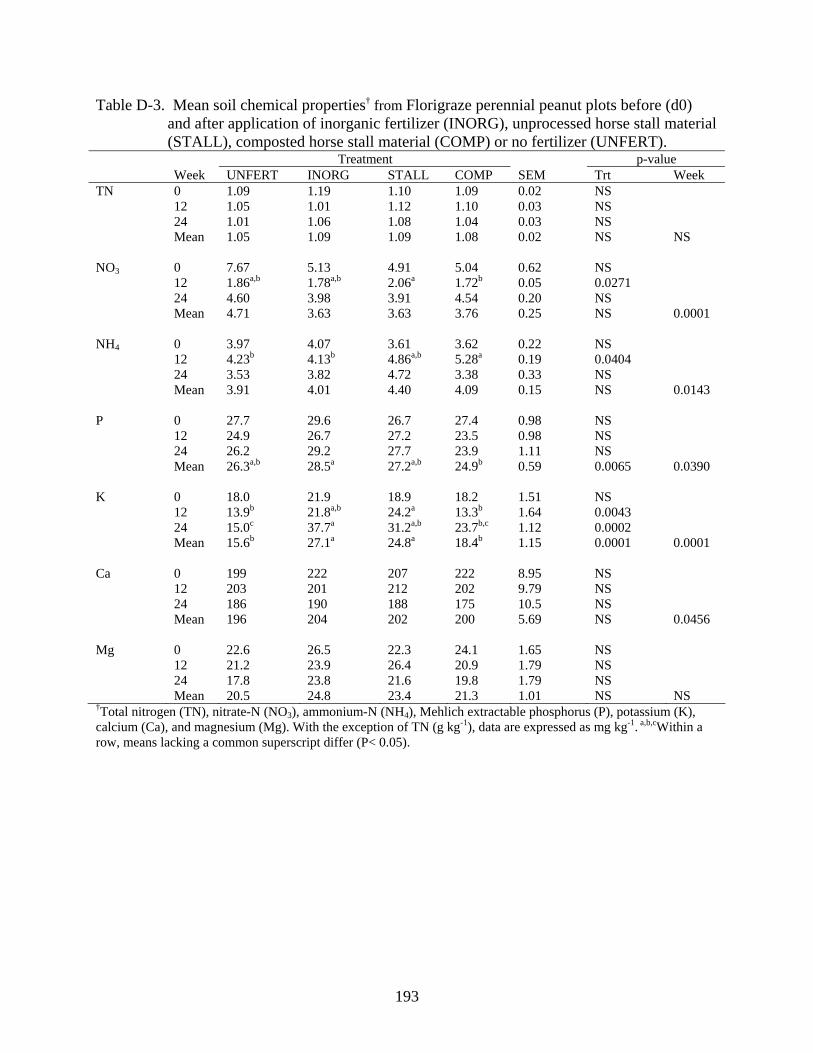
193
Table D-3. Mean soil chemical properties† from Florigraze perennial peanut plots before (d0) and after application of inorganic fertilizer (INORG), unprocessed horse stall material (STALL), composted horse stall material (COMP) or no fertilizer (UNFERT).
Treatment p-value Week UNFERT INORG STALL COMP SEM Trt Week TN 0 1.09 1.19 1.10 1.09 0.02 NS 12 1.05 1.01 1.12 1.10 0.03 NS 24 1.01 1.06 1.08 1.04 0.03 NS Mean 1.05 1.09 1.09 1.08 0.02 NS NS NO3 0 7.67 5.13 4.91 5.04 0.62 NS 12 1.86a,b 1.78a,b 2.06a 1.72b 0.05 0.0271 24 4.60 3.98 3.91 4.54 0.20 NS Mean 4.71 3.63 3.63 3.76 0.25 NS 0.0001 NH4 0 3.97 4.07 3.61 3.62 0.22 NS 12 4.23b 4.13b 4.86a,b 5.28a 0.19 0.0404 24 3.53 3.82 4.72 3.38 0.33 NS Mean 3.91 4.01 4.40 4.09 0.15 NS 0.0143 P 0 27.7 29.6 26.7 27.4 0.98 NS 12 24.9 26.7 27.2 23.5 0.98 NS 24 26.2 29.2 27.7 23.9 1.11 NS Mean 26.3a,b 28.5a 27.2a,b 24.9b 0.59 0.0065 0.0390 K 0 18.0 21.9 18.9 18.2 1.51 NS 12 13.9b 21.8a,b 24.2a 13.3b 1.64 0.0043 24 15.0c 37.7a 31.2a,b 23.7b,c 1.12 0.0002 Mean 15.6b 27.1a 24.8a 18.4b 1.15 0.0001 0.0001 Ca 0 199 222 207 222 8.95 NS 12 203 201 212 202 9.79 NS 24 186 190 188 175 10.5 NS Mean 196 204 202 200 5.69 NS 0.0456 Mg 0 22.6 26.5 22.3 24.1 1.65 NS 12 21.2 23.9 26.4 20.9 1.79 NS 24 17.8 23.8 21.6 19.8 1.79 NS Mean 20.5 24.8 23.4 21.3 1.01 NS NS †Total nitrogen (TN), nitrate-N (NO3), ammonium-N (NH4), Mehlich extractable phosphorus (P), potassium (K), calcium (Ca), and magnesium (Mg). With the exception of TN (g kg-1), data are expressed as mg kg-1. a,b,cWithin a row, means lacking a common superscript differ (P< 0.05).
194
LIST OF REFERENCES
Adjei, M.B., and J.E. Rechcigl. 2002. Bahiagrass production and nutritive value as affected by domestic wastewater residuals. Agron. J. 94:1400-1410.
Airaksinen, S., H. Heinonen-Tanski, M.L. Heiskanen. 2001. Quality of different bedding
materials and their influence on the compostability of horse manure. J. Equine Vet. Sci. 21(3):125-130.
American Horse Council Foundation (AHCF). 2005. The Economic Impact of the Florida Horse
Industry in the United States. Deloitte, Washington, DC. American Society of Agricultural Engineers (ASAE). 2005. Manure production and
characteristics. D384.2. St. Joseph, MI. [Online] http://www.asabe.org/ (verified 01/23/2008).
Andrae, J., and G. Heusner. 2003. Forage systems for horses in Georgia. Bulletin 1224. The
University of Georgia College of Agricultural and Environmental Sciences. Cooperative Extension Services, GA.
Angelidaki, I., L. Ellegaard, and B. Ahring. 1999. A comprehensive model of anaerobic
bioconversion of complex substrates to biogas. Biotech. Bioeng. 63(3):363-372. AOAC International. Protein (crude) in animal feed combustion method. Sec. 4.2.08, Method
990.03. In: Official Methods of Analysis of AOAC International, 16th Edition. Cunniff, PA (Editor); AOAC International, Gaithersburg, MD. 1999, Chapter 4, pp 18-19.
Arner, R., D. Pogue, and R. Kashmanian. 1995. By George composting at Mount Vernon.
BioCycle 36(12):79-80. Ball, A.S., D. Shah, and C.F. Wheatley. 2000. Assessment of the potential of a novel
newspaper/horse manure-based compost. Bioresour. Technol. 73:163-167. Ball, D.M., C.S. Hoveland, and G.D. Lacefield. 1991. Southern forages. The Potash and
Phosphate Institute and the Foundation for Agronomic Research, Atlanta, GA. Barrington, S., D. Choiniere, M. Trigui, and W. Knight. 2003. Compost convective airflow under
passive aeration. Bioresour. Technol. 86:259-266. British Columbia Agriculture and Food (BCAF). 1996. Composting fact sheet. British Columbia
Ministry of Agriculture and Food, Abbotsford, BC, Canada. Beck, P.A., C.B. Stewart, J.M. Phillips, K.B. Watkins, and S.A. Gunter. 2007. Effect of species
of cool-season annual grass interseeded into Bermudagrass sod on the performance of growing calves. J. Anim. Sci. 85:536-544.
195
Bellows, B. 2001. Nutrient cycling in pastures. In: R. Earles (ed.) Livestock systems guide. Appropriate technology transfer for rural areas. [Online] http://www.attra.ncat.org/attra-pub/nutrientcycling/html (verified 01/23/2008).
Bengtson, G.W., and J.J. Cornette. 1973. Disposal of composted municipal waste in a plantation
of young slash pine: effects on soils and trees. J. Environ. Qual. 2:441-444. Bernal, M.P., C. Paredes, M.A. Sanchez-Monedero, and J. Cegarra. 1998. Maturity and stability
parameters of composts prepared with a wide range of organic wastes. Biores. Tech. 63:91-99.
Binning, S. 2007. Compost Quality Standards. Organic Agriculture Advisors. California
Integrated Waste Management Board, CA. [Online] http://www.ciwmb.ca.gov/Organics/ (verified 02/20/2008).
Bishop, B.L., and C. Godfrey. 1983. Nitrogen transformations during sludge composting.
BioCycle. 24(5):34-39. Black, R.J. 2003. Florida climate data. EES5. Environmental Horticulture Department, Florida
Cooperative Extension Service, IFAS, UF. [Online] http://edis.ifas.ufl.edu/EH105 (verified 03/05/2008).
Blaser, R.E. 1986. Forage-animal management systems. Virginia Agric. Exp. Stn. Bull. 86. Both, R. 2001. Directive on odour in ambient air: an established system of odour measurement
and odour regulation in Germany. Wat. Sci. Technol. 44(9):119-126. Brady, N.C., and Weil, R.R. 2002. Soil phosphorus and potassium. p. 592-634. In S. Helba (ed.)
The nature and properties of soils. Prentice Hall, Upper Saddle River, NJ. Breeuwsma, A., J.G.A. Reijerink, and O.F. Schoumans. 1995. Impact of manure on
accumulation and leaching of phosphate in areas of intensive livestock farming. p. 239-249. In K. Steele (ed.) Animal wastes and the land-water interface. Lewis Publication, Boca Raton, FL.
Breidenbach, A.W. 1971. Composting of municipal solid wastes in the United States. p. 103
Solid Waste Management Series SW–47r. USEPA, Washington D.C., USA. Brown, M.T. 2005. Landscape restoration following phosphate mining: 30 years of co-evolution
of science, industry and regulation. Ecological Engineering 24:309-329. Bush, B.J., and N.R. Austin. 2001. Timing of phosphorus fertilizer application within an
irrigation cycle for perennial pasture. J. Environ. Qual. 30:939-946. Bushee, E.L., D.R. Edwards, and P.A. Moore. 1998. Quality of runoff from plots treated with
municipal sludge and horse bedding. Transactions of the ASAE. 41(4):1035-1041.
196
Butler, T.J., and J.P Muir. 2006. Dairy manure compost improves soil and increases tall
Wheatgrass yield. Agron. J. 98:1090-1096. Calibeo-Hayes, D., S.S. Denning, S.M. Stringham, and D.W. Watson. 2005. Lesser mealworm
(Coleoptera: Tenebrionidae) emergence after mechanical incorporation of poultry litter into field soils. J. Econ. Entomol. 98(1):229-235.
Cappaert, I., O. Verdonk, and M.D. Boodt. 1975. Composting of hardwood bark. Compost Sci.
16(4):12-15. Caraballo, A., D.E. Morillo, J. Faria-Marmol, and L.R. McDowell. 1997. Frequency of
defoliation and nitrogen and phosphorus fertilization on Andropogon guyanas Kunth. I. Yield, crude protein content, and in vitro digestibility. Commun. Soil Sci. Plant Anal. 28:823-831.
Castellanos, J.Z., and P.F. Pratt. 1981. Mineralization of manure nitrogen – correlation with
laboratory indexes. Soil Sci. Soc. Am. J. 45:354-357. Catroux, G., P. L’Hermite, E. Suess (ed). 1981. The influence of sewage sludge application on
physical and biological properties of soils. D. Reidel Publishing Company, Boston, MA. Chambliss, C.G., and M.B. Adjei. 2006. Bahiagrass. SS-AGR-36. Agronomy Department
Florida Cooperative Extension Service, IFAS, UF, Gainesville, FL. [Online] http://edis.ifas.ufl.edu/AA184 (verified 02/06/2008).
Chambliss, C.G., E.L. Johnson, and M.B. Adjei. 2006. Bermudagrass production in Florida. SS-
AGR-60. Agronomy Department Florida Cooperative Extension Service, IFAS, UF, Gainesville, FL. [Online] http://edis.ifas.ufl.edu/AA200 (verified 01/14/2008).
Chambliss, C.G., E.L. Johnson, and I.V. Ezenwa. 2006. Pastures and forage crops for horses. SS-
AGR-65. Agronomy Department Florida Cooperative Extension Service, IFAS, UF, Gainesville, FL. [Online] http://edis.ifas.ufl.edu/AA216 (verified 01/14/2008).
Chang, C., T.G. Sommerfeldt, and T. Entz. 1991. Soil chemistry after eleven annual applications
of cattle feedlot manure. J. Environ. Qual. 20:475-480. Chiumenti, A., F.Da Borso, T. Rodar, R. Chiumenti. 2006. Swine manure composting by means
of experimental turning equipment. Waste Management 27:1774-1782. Cid, M.S., and M.A. Brizuela. 1998. Heterogeneity in tall fescue pastures created and sustained
by cattle grazing. J. Range Man. 51:644-649. Cotton, D.L., L.K. Warren, R.A. Nordstedt, J. Kivipelto, and S.C. Dilling. 2006. Nutrient
composition of stall waste produced by Florida horse operations. J. Anim. Sci. Suppl. 84:330.

197
Crowford, J.H. 1983. Composting of agricultural wastes – A review. Process Biochemistry 18,
14-18. Cunha Queda, A.C., G. Vallini, M. Agnolucci, C.A. Coelho, L. Campos, and R.B. de Sousa.
2002. Microbiological and chemical characterization of composts at different levels of maturity, with evaluation of phytotoxicity and enzymatic activities. p. 345-355. In: H. Insam et al. (ed.) Microbiology of Composting. Springer Verlag, Heidelberg, Germany.
Curtis, M.J., W.A. Kleiner, V.P. Claassen, and R.A. Dahlgren. 2005. Differences in a composted
animal waste and straw mixture as a function of three compost methods. Compost Science and Util. 13(2):98-107.
Dao, T.H. 1999. Co-amendments to modify phosphorus extractability and nitrogen/phosphorus
ratio in feedlot manure and composted manure. J. Environ. Qual. 28:1114-1121. Davis, R.D., H. Haeni, P. L’Hermite (ed). 1985. Factors influencing sludge utilization practices
in Europe. Elsevier Applied Science Publishers, London. de Bertoldi, M., G. Vallini, and A. Pera. 1983. The biology of composting: a review. Waste
Manag. and Research 1:157-176. Dorich, R.A. and D.W. Nelson. 1983. Direct colorimetric measurement of ammonium in
potassium chloride extracts of soil. Soil Sci. Soc. Am. J. 47:833-836. Dick, W.A., and E.L. McCoy. 1993. Enhancing soil fertility by addition of compost. p. 622-644.
In: H.A.J. Hoitink (ed.), Science and Engineering of Composting: Desing, Environmental, Microbiological and Utilization Aspects. Renaissance Publications, Ohio.
Diepeningen, A.D., O.J. de Vos, G.W. Korthals, and A.H.C. van Bruggen. 2006. Effects of
organic versus conventional management on chemical and biological parameters in agricultural soils. Appl. Soil. Ecology 31:120-135.
Dilling, S.C., and L.K. Warren. 2007. On-Farm Composting of Horse Stall Materials: Effect of
Carbon:Nitrogen Ratio and Bedding Type. Proc 20th Equine Sci Soc Symp. June 5-8, Hunt Valley, MD. [abstract].
Drudge, J.H., S.E. Leland, Z.N. Wyant, and J.W. Rust. 1958. Winter survival of some cattle
parasites on a Kentucky pasture with observations on the effects of low-level phenothiazine treatment. J. Parasitology 434-438.
Duggan, J.C. 1973. Utilization of municipal refuse compost. Field-scale compost
demonstrations. Compost Sci. 14:24-25. Edwards, D.R., and T.C. Daniel. 1993. Effects of poultry litter application rate and rainfall
intensity on quality of runoff from fescue grass plots. J. Environ. Qual. 22(2):361-365.

198
Eggen, T., and O. Vethe. 2001. Stability indices for different composts. Compost Sci. and Util.
9(1):19-26. Eghball, B., and J.F. Power. 1999. Phosphorus and nitrogen based manure and compost
application: corn production and soil phosphorus. Soil Sci. Soc. Am. J. 63:895-901. Eghball, B., and J.F. Power. 1999. Composted and noncomposted manure application to
conventional and no-tillage systems: corn yield and nitrogen uptake. Agron. J. 91:819-825.
Eghball, B. 2000. Nitrogen mineralization from field-applied beef cattle feedlot manure or
compost. Soil Sci. Soc. Am. J. 64:2024-2030. Eghball, B. J.F. Power, J.E. Gilley, and J.W. Doran. 1997. Nutrient, carbon, and mass loss of
beef cattle feedlot manure during composting. J. Environ. Qual. 26:189-193. Emino, E.R., and P.R. Warman. 2004. Biological assay for compost quality. Compost Sci. and
Util. 12(4):342-348. Epstein, E. 1997. The science of composting. CRC Press, New York. Ferguson, R.B., and J.A. Nienaber. 2000. Composted beef feedlot manure application impacts on
nitrogen and phosphorus accumulation and movement in soil. In: Charles Ross (ed.), Proc. Animal, Agriculture and Food Processing Waste. 8:719-727. Des Moines, IA. October 2000. ASAE.
Ferreras L, E. Gomez, S. Toresani, I. Firpo, and R. Rotondo. 2006. Effect of organic
amendments on some physical, chemical and biological properties in a horticultural soil. Bioresource Technology 97:635-640.
Fisher, M.J., I.M. Rao, and R.J. Thomas. 1997. Nutrient cycling in tropical pastures, with special
reference to the neotropical savannas. p. 371-382. 18th Int. Grassl. Cong., Winnipeg and Saskatoon, Canada.
Fitzpatrick, G.E. 1993. A program for determining cocompost blending ratios. Compost Sci.
Util. 1(3):30-33. Fitzpatrick, G.E., E.R. Duke, and K.A. Klock-Moore. 1998. Use of Compost Products for
Ornamental Crop Production: Research and Grower Experience. HortScience 33(6):941-944.
Fitzpatrick, G.E., E.C. Worden, and W.A. Vendrame. 2005. Historical development of
composting technology during the 20th century. Hort Technology 15(1): 48-51.
199
Follet, J.R., and R.F. Follet. 2001. Utilization and metabolism of nitrogen by humans. p. 65-92. In: Nitrogen in the environment: sources, problems and management. R. Follett and J.L. Hatfield (ed). Elsevier Science, Amsterdam, The Netherlands.
Fontanive, V., D. Effron, F. Tortarolo, and N. Arrigo. 2004. Evaluation of parameters during
composting of two contrasting raw materials. Compost Sci. and Util. 12(3):268-272. Fraser, B.S., and A.K. Lau. 2000. The effects of process control strategies on composting rate
and odor emission. Compost Sci. and Util. 8(4):274-292. French, E.C., G.M. Prine, and A.R. Blount. 2006. Perennial peanut: an alternative forage of
growing importance. SS-AGR-39. Agronomy Department, Florida Cooperative Extension Service, IFAS, UF, Gainesville, FL. [Online] http://edis.ifas.ufl.edu/AA148 (verified 02/06/2008).
Garcia, C., T. Hernandez, F. Costa, and M. Ayuso. 1992. Evaluation of the maturity of municipal
waste compost using simple chemical parameters. Commun. Soil Sci. Plant Anal. 23:1501-1512.
Garcia-Gomez, A., M.P. Bernal, and A. Roig. 2002. Growth of ornamental plants in two
composts prepared from agroindustrial wastes. Bioresource technology 83:81-87. Golueke, C.G. 1991. Principles of composting. p. 14-27. In: The Staff of BioCycle Journal of
Waste Recycling. The Art and Science of Composting. JG Press Inc., Pennsylvania, USA.
Hainze, M.T.M, R.B. Muntifering, C.W. Wood, C.A. McCall, and B.H. Wood. 2004. Faecal
phosphorus excretion from horses fed typical diets with and without added phytase. Anim. Feed Sci. Technol. 117:265-279.
Hao, X., C. Chang, F.J. Larney, and G.R. Tavis. 2001. Greenhouse gas emissions during cattle
feedlot manure composting. J. Environ. Qual. 30:376-386. Hartung, J., and V.R. Philips. 1994. Control of gaseous emissions from livestock buildings and
manure stores. J. Agric. Engng. Res. 57:173-189. Harvey, R.W., J.P. Mueller, J.A. Barker, M.H. Poore, and J.P. Zublena. 1996. Forage
characteristics, steer performance, and water quality from bermudagrass pastures fertilized with two levels of nitrogen from swine lagoon effluent. J. Anim. Sci. 74:457-464.
Haug, R.T. 1993. Biological fundamentals. p. 121-140 In: The practical handbook of compost
engineering. Lewis Publishers, Boca Raton, FL.
200
Haynes, R.J., P.H. Williams. 1993. Nutrient cycling and soil fertility in the grazed pasture ecosystem. p. 119-200. In: D.L. Sparks (ed.), Advances in Agronomy, vol. 49. Academic Press, New York, NY.
Hesketh, N., and P.C. Brookes. 2000. Development of an indicator for risk of phosphorus
leaching. J. Environ. Qual. 29:105-110. Hodge, A., D. Robinson, and A. Fitter. 2000. Are microorganisms more effective than plants at
competing for nitrogen? Trends in Plant Science 5(7):304-308. Hogan, K.B., J.S. Hoffman, and A.M. Thompson. 1991. Methane on the greenhouse agenda.
Nature (London) 354:181-182. Hogsette, J.A. 1993. The influence of poultry operations on the urban fly problem in the eastern
United States. p. 17-24. In: Thomas, G.D. and S.R. Skoda (eds). Rural flies in the urban environment. Res. Bull. No. 317, Agric. Res. Div., Institute of Agric. and Natural Resources, Univ. of Nebraska-Lincoln, NE.
Hoitink, H.A.J., and M.J. Boehm. 1999. Biocontrol within the context of soil microbial
communities: A substrate dependent phenomenon. Annu. Rev. Phytopathol. 37:427-446. Hoitink, H.A.J., and P.C. Fahy. 1986. Basis for the control of soilborne plant pathogens with
composts. Ann. Rev. Phytopathol. 24:93-114. Holechek, J.L. 1988. An approach for setting the stocking rate. Rangelands 10(1):10-14. Hooda, P.S., V.W. Truensdale, A.C. Edwards, P.J.A. Withers, M.N. Aitken, A. Miller, and A.R.
Rendell. 2001. Manuring and fertilization effects on phosphorus accumulation in soils and potential environmental implications. Advances in Environmental Research 5:13-21.
Hornick, S.B., L.J. Sikora, S.B. Sterrett, J.J. Murray, P.D. Milner, W.D. Binge, D. Colacicco,
J.F. Parr, R.L. Chaney, and G.B. Willson. 1984. Utilization of sewage sludge compost as a soil conditioner and fertilizer for plant growth. USDA ARS, Ag Info. Bull. No. 464, US Government. Printing Office, Washington, DC.
Howard, A. 1935. The manufacture of humus by the Indore process. J. of the Royal Society of
Arts 84:26-29. Huang, G.F., M. Fang, Q.T. Wu, L.X. Zhou, X.D. Liao, J.W.C. Wong. 2001. Co-composting of
pig manure with leaves. Environ. Technol. 22:1203-1212. Hubbard, R.K., G.L. Newton, and G.M. Hill. 2004. Water quality and the grazing animal. J.
Anim. Sci. 82(E. Suppl):E255-E263.
201
Hubbard, R.K., and J.M. Sheridan. 1994. Nitrates in groundwater in the southeastern United States. p. 303-345. In: D.C. Adriano, A.K. Ishkandar, and I.P. Murarka (eds). Advances in Environmental Science. Science Reviews, Northwood, U.K.
Iannotti, D.A., T. Pang, B.L. Toth, D.L. Elwell, H.M. Keener, and H.A. Hoitink. 1993. A
quantitative respirometric method for monitoring compost stability. Compost Sci. and Util. 1:52-65.
Intensive Livestock Operations Committee. 1995. Code of practice for the safe and economic handling of animal manures. Agdex 400/27-2. Alberta Agriculture, Food and Rural Development, Edmonton, AB, Canada.
Itavaara, M., O. Venelampi, M. Vikman, and A. Kapanen. 2002. Compost maturity-Problems
associated with testing. p. 373-382. In: H. Insam et al. (ed.), Microbiology of Composting. Springer Verlag, Heidelberg, Germany.
James, R.E. 2003. Horse manure management: the nitrogen enhancement system. AGF-212-03.
Horticulture and Crop Science. Ohio State University Extension. [Online] http://ohioline.osu.edu/agf-fact/0212.html (verified 01/29/2008).
Jarvis, S.C., D. Scholefield, and B. Pain. 1995. Nitrogen cycling in grazed systems. p. 381-419
In: P.E. Bacon (ed.), Nitrogen Fertilization in the Environment. New York, NY. Jeris, J.S., and R.W. Regan. 1973. Controlling environmental parameters for optimal
composting. Part III. Compost Sci. 14(3):16-22. Jimenez, E.I., and V.P. Garcia. 1989. Evaluation of city refuse compost maturity: a review. Biol.
Wastes 27:115-142. Johnson, A.F., D.M. Vietor, F.M. Rouquette, and V.A. Haby. 2004. Fate of phosphorus in dairy
wastewater and poultry litter applied on grassland. J. Environ. Qual. 33:735-739. Johnson, C.R., B.A. Reiling, P. Mislevy, and M.B. Hall. 2001. Effects of nitrogen fertilization
and harvest date on yield, digestibility, fiber, and protein fractions of tropical grasses. J. Anim. Sci. 79:2439-2448.
Jongbloed, A.W., and N.P. Lenis. 1998. Environmental concerns about animal manure. J. Anim.
Sci. 76:2641-2648. Kaempffe, G.C., and O.R. Lunt. Availability of various fractions of urea-formaldehyde. 1967. J.
Agr. Food. Chem. 15(6): 967-971. Khalil, M.A.K., and R.A. Rasmussen. 1992. The global sources of nitrous oxide. J. Geophys.
Res. 97:14651-14660.

202
Kidder, G. 2002. Using waste products in forage production. Fact Sheet: SS 315. Soil and Water Science Department, Florida Cooperative Extension Service, Institute of Food and Agricultural Sciences, University of Florida. [Online] http://edis.ifas.ufl.edu/SS315 (verified 03/18/2008).
Klock, K.A., and G.E. Fitzpatrick. 1999. Management of urban waste compost amendments in
ornamental production systems in Florida. Proc. Soil Sci. Soc. of Florida 59:22-24. Kolahchi, Z., and J. Jalali. 2007. Effect of water quality on the leaching of potassium from sandy
soil. J. Arid Environ. 68: 624-639. Lapointe, B.E., and B.J. Bedford. 2007. Drift rhodophyte blooms emerge in Lee County, Florida,
USA: evidence of escalating coastal eutrophication. Harmful algae 6:421-437. Larney, F.J., and R.E. Blackshaw. 2003. Weed seed viability in composted beef cattle feedlot
manure. J. Environ. Qual. 32:1105-1113. Larney, F.J., K.E. Buckley, X. Hao, and W.P. McCaughey. 2006. Fresh, stockpiled, and
composted beef cattle feedlot manure: nutrient levels and mass balance estimates in Alberta and Manitoba. J. Environ. Qual. 35:1844-1854.
Larney, F.J., A.F. Olson, A.A. Carcamo, and C. Chang. 2000. Physical changes during active
and passive composting of beef feedlot manure in winter and summer. Bioresour. Technol. 75:139-148.
Larney, F.J., L.J. Yanke, J.J. Miller, and T.A. McAllister. 2003. Fate of coliform bacteria in
composted beef cattle feedlot manure. J. Environ. Qual. 32:1508-1515. Lennox, S.D., R.H. Foy, R.V. Smith, and C. Jordan. 1997. Estimating the contribution from
agriculture to the phosphorus load in surface water. p. 55-75. In H. Tunney, O.T. Carbon, P.C. Brookes, and A.E. Johnson (ed.) Phosphorus loss from soil to water. CAB Int., New York.
Li, X., R. Zhang, Y. Pang. 2007. Characteristics of dairy manure composting with rice straw.
Bioresour. Technol. 99:359-367. Lory, J., and C. Roberts. 2000. Managing nutrients in pastures to improve profitability and water
quality. In: G.J. Bishop-Hurley, S.A. Hamilton, and R. Kallenbach (eds.) Missouri dairy grazing manual. Missouri University Extension. University of Missouri, Columbia, MO.
Lynch, D.H., R.P. Voroney, and P.R. Warman. 2004. Nitrogen availability from composts for
humid region perennial grass and legume-grass forage production. J. Environ. Qual. 33:1509-1520.
Lyons, E.T., S.C. Tolliver, J.H. Drudge. 1999. Historical perspective of cyathostomes:
prevalence, treatment and control programs. Vet. Parasitology 85:97-112.
203
Magdoff, F.R., M.A. Tabatabai, and E.D. Hanlon. 1996. Soil organic matter: analysis and
interpretation. Soil Sci. Spec. Pub. No. 46:21-31. Mahin, T.D. 2001. Comparison of different approaches used to regulate odors around the world.
Wat. Sci. Technol. 44(9):87-102. Major, J., C. Steiner, A. Ditommaso, N. Falcao, and J. Lehmann. 2005. Weed composition and
cover after three years of soil fertility management in the central Brazilian Amazon: compost, fertilizer, manure and charcoal applications. Weed Biology and Management 5:69-76.
Mallarino, A.P., and J.S. Schepers. 2005. Role of precision agriculture in phosphorus
management practices. In. A. Sharpley and T. Sims (eds.) Phosphorus: Agriculture and the Environment. American Society of Agronomy Monograph Series No. 46. Madison, WI.
Mallin, M.A., and T.L. Wheeler. 2000. Nutrient and fecal coliform discharge from coastal North
Carolina golf courses. J. Environ. Qual. 29:979-986. Markus, D.W., J.P. McKinnon, and A.F. Buccafuri. 1985. Automated analysis of nitrite, nitrate,
and ammonium nitrogen in soils. Soil. Sci. Soc. Am. J. 49:1208-1215. Martha, G.B., M. Corsi, P.C.O. Trivelin, and M.C. Alves. 2004. Nitrogen recovery and loss in a
fertilized elephant grass pasture. Grass and Forage Science 59:80-90. Martin, D.L., and G. Gershuny. 1992. The Rodale Book of Composting. Rodale Press, Emmaus,
PA. Martin, H.W., D.L. Sparks. 1985. On the behaviour of nonexchangeable potassium in soils.
Communications in Soil Science and Plant Analysis 16:133-162. Maryland Cooperative Extension. 1993. Estimated mineralization rates, nitrogen credits for
legumes and ammonia conservation factor for organic nitrogen. Maryland Nutrient Management Manual [Online]. http://www.mda.state.md.us/resource_conservation/nutrient_management/manual/index.php (verified 02/06/2008).
Mata-Alvarez, J., S. Mace, and P. Llabres. 2000. Anaerobic digestion of organic solid wastes. An
overview of research achievements and perspectives. Biores. Tech. 74:3-16. Mathews, B.W., L.E. Sollenberger, V.D. Nair, and C.R. Staples. 1994. Impact of grazing
management on soil nitrogen, phosphorus, potassium, and sulfur distribution. J. Environ. Qual. 23:1006-1013.

204
Mathews, B.W., L.E. Sollenberger, and J.P. Tritschler. 1996. Grazing systems and spatial distribution of nutrients in pastures – soil considerations. p. 213-229. In R.E. Joost and C.A. Roberts (ed.). Nutrient cycling in forage systems. PPI/FAR, Columbia, MO.
McCaleb, J.E., C.L. Dantzman, and E.M. Hodges. 1966. Response of pangolagrass and
Pensacola bahiagrass to different amounts of phosphorus and potassium. Soil Crop Sci. Soc. Fla. Proc., 26:248-256.
McCartney, D., and G. Eftoda. 2002. Choosing bulking agents for windrow composting.
BioCycle 43(1):47-48. McKinley, V.L., and J.R. Vestal. 1985. Physical and chemical correlates of microbial activity
and biomass in composting municipal sewage sludge. Appl. Environ. Microbiol. 50:1395-1403.
McLeod, R.V., and R.O. Hegg. 1984. Pasture runoff quality from application of inorganic and
organic nitrogen sources. J. Environ. Qual. 13(1):122-126. Mengel, K.B. 1997. Agronomic measures for better utilization of soil and fertilizer phosphates.
Europ. J. Agronomy 7:221-233. Mengel, K., B. Hutsch, Y. Kane. 2006. Nitrogen fertilizer application rates on cereal crops
according to available mineral and organic soil nitrogen. Europ. J. Agronomy 24: 343-348.
Michel, F.C., J.A. Pecchia, J. Rigot, and H.M. Keener. 2004. Mass and nutrient losses during the
composting of dairy manure amended with sawdust or straw. Compost Science and Util. 12(4):323-334. Mislevy, P. 1985. Forages for grazing systems in warm climates. p. 73-129. In L.R. McDowell
(ed.) Nutrition of grazing ruminants in warm climates. Academic Press, Orlando, FL. Mislevy, P., and P.H. Everett. 1981. Subtropical grass species response to different irrigation and
harvest regimes. Agron. J. 73:601-604. Mooso, G.D., W.D. Pitman, and D.G. Morrison. 1995. Rhizoma peanut responses to fertilizer
treatments of a Louisiana Coastal Plain soil. J. Plant. Nutr. 18(11):2273-2279. Motavalli, P.P., K.A. Kelling, and J.C. Converse. 1989. First-year nutrient availability from
injected dairy manure. J. Environ. Qual. 18:180-185. Muir, J.P., S.R. Stokes, and E.P. Prostko. 2001. The effect of dairy compost on summer annual
dicots grown as alternative silages. Anim. Sci. 17:95-100.

205
Mupondi, L.T., P.N.S. Mnkeni, and M.O. Brutsch. 2006. The effects of goat manure, sewage sludge and effective microorganisms on the composting of pine bark. Compost Sci. and Util. 14(3):201-210.
Mylavarapu, R., D. Wright, G. Kidder, C.G. Chambliss. 2007. UF/IFAS standardized
fertilization recommendations for agronomic crops. Fact Sheet: SL 129. Soil and Water Science Department, Florida Cooperative Extension Service, Institute of Food and Agricultural Sciences, University of Florida. [Online] http://edis.ifas.ufl.edu/SS163 (verified 01/17/2008).
NAHMS. 1998. Equine ’98 Study. United States Department of Agriculture, Animal and
Plant Health Inspection Service, Veterinary Services, National Animal Health Monitoring System, Washington, D.C.
National Research Council (NRC). 1993. Soil and water quality: an agenda for agriculture.
National Academy Press, Washington, D.C. Newman, Y.C., C. Mackowiak, R. Mylavaparu, and M. Silveira. 2008. Fertilizing and liming
forage crops. SS-AGR-176. Agronomy Department Florida Cooperative Extension Service, IFAS, UF. [Online] http://edis.ifas.ufl.edu/AG179 (verified 02/26/2008).
Newton, G.L., J.K. Bernard, R.K. Hubbard, J.R. Allison, R.R. Lowrance, G.J. Gascho, R.N.
Gates, and G. Vellidis. 2003. Managing manure nutrients through multicrop forage production. J. Dairy Sci. 86:2243-2252.
Nielsen, M.K., R.M. Kaplan, S.M. Thamsborg, J. Monrad, and S.N. Olsen. 2007. Climatic
influences on development and survival of free-living stages of equine strongyles: implications for worm control strategies and managing anthelmintic resistance. Vet. J. 174(1):23-32.
National Research Council (NRC). 1989. Nutrient Requirements of Horses. 5th rev. ed. National
Academy of Science, Washington, DC. Oliveira, O.C., I.P. Oliveira, E. Ferreira, B.J.R. Alves, C.H.B. Miranda, L. Vilela, S. Urquiaga,
and R.M. Boddey. 2001. Response of degraded pastures in the Brazilian Cerrado to chemical fertilization. Pasturas Tropicales 23:14-18.
Ott, E.A., E.L. Johnson, and R.A. Nordstedt. 2000. Composting horse manure. SS-
ANS-001. Department of Animal Sciences, Florida Cooperative Extension Service, IFAS, UF. [Online] http://edis.ifas.ufl.edu/AN040 (verified 01/24/2008).
Pant, H.K., M.B. Adjei, J.M. Scholbert, C.G. Chambliss, and J.E. Rechcigl. 2004. Forage
production and phosphorus phytoremediation in manure impacted soils. Agron. J. 96:1780-1786.

206
Parkinson R, P. Gibbs, S. Burchett, T. Misselbrook. 2004. Effect of turning regime and seasonal weather conditions on nitrogen and phosphorus losses during aerobic composting of cattle manure. Bioresource Technology 91:171-178. Parsons, L., and B. Boman. 2006. Best management practices for Florida citrus. Hort.
Technology 16(3): 389-393. Paterson, P.R., and J.R. Gerrish. 1996. Grazing systems and spatial distribution of nutrients in
pastures: livestock management considerations. P. 203-212. In R.E. Joost and C.A. Robers (eds.). Nutrient cycling in forage systems. PPI/FAR, Columbia, MO.
Perry, R. 1998. Agricultural phosphorus and water quality: A U.S. Environmental Protection
Agency perspective. J. Environ. Qual. 27:258-261. Poincelot, R.P. 1975. The biochemistry and methodology of composting. Bulletin 754.
Connecticut Agricultural Experiment Station, New Haven. Pratt, S.E., L.M. Lawrence, T. Barnes, D. Powell, and L.K. Warren. 2000. Measurement of
ammonia concentrations in horse stalls. J. Equine Vet. Science 20(3):197-200. Prine, G.M., and G.W. Burton. 1956. The effect of nitrogen rate and clipping frequency upon the
yield, protein content and certain morphological characteristics of Coastal bermudagrass (Cynodon dactylon). Agron. J. 48:296-301.
Rechigl, J.E., G.G. Payne, A.B. Botcher, and P.S. Porter. 1992. Reduced P application on
Bahiagrass and water quality. Agronomy J. 84:463-468. Reider, C.R., W.R. Herdman, L.E. Drinkwater, and R. Janke. 2000. Yields and nutrient budgets
under composts, raw dairy manure and mineral fertilizer. Compost Sci. and Utilization 8(4):328-339.
Richard, T. 1996. The effect of lignin on biodegradability. In: Cornell composting. [Online]
http://www.cfe.cornell.edu/compost/calc/lignin.html (verified 02/04/2008). Riggle, D. 1996. Controlling and preventing fires at compost facilities. BioCycle 37(5):58-66. Ring, D.R., M.K. Harris, J.A. Jackman, and J.L. Henson (1983). A fortran computer
program for determining start date and base temperature for degree-day models. The Texas Agricultural Experiment Station Bull MP-1537, The Texas University System, College Station, TX.
Romano P.V., U. Krogmann, M.L. Westendorf, and P.F. Strom. 2006. Small-scale composting of horse manure mixed with wood shavings. Compost Science and Util. 14(2):132-141.

207
Rynk, R., M. Van de Kamp, G.G. Wilson, M.E. Singley, T.L. Richard, J.J. Kolega, F.R. Gouin, L. Laliberty, Jr., D. Kay, D.W. Murphy, H.J. Hoitink and W.F. Brinton. 1992. On-Farm Composting Handbook. Northeast Regional Agric. Eng. Serv., Ithaca, NY.
Sanderson, M.A., and R.M. Jones. 1997. Forage yields, nutrient uptake, soil chemical changes
and nitrogen volatilization from bermudagrass treated with dairy manure. J. Prod. Agric. 10:266-271.
Sartain, J.B. 2007. Fertility considerations for sod production. Fact Sheet: SL 52. Soil and Water
Science Department, Florida Cooperative Extension Service, Institute of Food and Agricultural Sciences, University of Florida. [Online] http://edis.ifas.ufl.edu/SS164 (verified 01/23/2008).
Sartain, J.B., and J.K. Kruse. 2001. Selected fertilizers used in turfgrass fertilization. CIR 1262.
Soil and Water Science Department, Florida Cooperative Extension Service, Institute of Food and Agricultural Sciences, University of Florida. [Online] http://edis.ifas.ufl.edu/SS318 (verified 02/16/2008).
Scaglia, B., F. Tambone, P.L. Genevini, and F. Adani. 2000. Respiration index determination:
dynamic and static approaches. Compost Sci. and Util. 8:90-99. Scarsbrook, C., R. Dickens, A. Hiltbold, H. Orr, K. Sanderson, D. Sturkie. 1969. Conservation of
resources in municipal waste, final report. p. 142-147. Agricultural Experimental Station, Auburn University, Alabama.
Schiffman, S.S., E.A. Sattely Miller, M.S. Suggs, and B.G. Graham. 1995. The effect of
environmental odors emanating from commercial swine operations on the mood of nearby residents. Brain Research Bulletin 37(4):369-375.
Schlegel, A.J. 1992. Effect of composted manure on soil chemical properties and nitrogen use by
grain sorghum. J. Prod. Agric. 5:153-157. Schofield, R.K. and A.W. Taylor. 1955. The measurement of soil pH. Soil Sci. Soc. Am. Proc.
19:164-167. Schwab, G.J., E. Pena, T.S. Stombaugh, O. Wendroth, and L.W. Murdock. 2005. Wheat
yield population response to variable rate N fertilization strategies using active NDVI sensors. pp. 235-242. IN: Stafford, J.V., ed. Precision Agriculture ‘05. Proceedings, 5th European Conference on Precision Agriculture, Uppsala, Sweden.
Sellers, B.A., J.A. Ferrell, J.J. Mullahey, and B.J. Brecke. 2006. Pasture weed management. SS-
AGR-26. Agronomy Department. Florida Cooperative Extension Service, Institute of Food and Agricultural Sciences, University of Florida. [Online] http://edis.ifas.ufl.edu/BODY_AG174 (verified 01/29/2008).
208
Sharpe, R.R., H.H. Schomberg, L.A. Harper, D.M. Endale, M.B. Jenkins, and A.J. Franzluebbers. 2004. Ammonia volatilization from surface-applied poultry litter under conservation tillage management practices. J. Environ. Qual. 33:1183-1188.
Sharpley, A.N., S.C. Chapra, R. Wedephol, J.T. Sims, T.C. Daniel, and K.R. Reddy. 1994.
Managing agricultural phosphorus for the protection of surface waters: issues and options. J. Environ. Qual. 24:106-111.
Sharpley, A.N., T.C. Daniel, J.T. Simms, and D.H. Pote. 1996. Determining environmentally
sound soil phosphorus levels. J. Soil Water Conserv. 51(2):160-166. Sharpley, A.N., and B. Moyer. 2000. Phosphorus forms in manure and compost and their release
during simulated rainfall. J. Environ. Qual. 29:1462-1469. Shiraishi, M., N. Wakimoto, E. Takimoto, H. Kobayashi, and T. Osada. 2006. Measurement and
regulation of environmentally hazardous gas emissions from beef cattle manure composting. International congress series 1293:303-306.
Shiralipour, A., and D.B. McConnell. 1991. Influence of yard trash composting on weed tree
seed germination. Proc Env. Sound Agric. Conf., Vol. 2. Orlando, FL. Sikora, L., and R. Szmidt. 2001. Nitrogen sources, mineralization rates, and nitrogen nutrition
benefits to plants from composts. p. 287-305. In: P. Stoffella, and B. Kahn (eds)., Compost Utilization in Horticultural Cropping Systems. Lewis Publishers, Boca Raton, FL.
Sims, J.T. 1993. Environmental soil testing for phosphorus. J. Prod. Agric. 6:501-507. Sims, J.T., R.R. Simard, and B.C. Joern. 1998. Phosphorus loss in agricultural drainage:
Historical perspective and current research. J. Environ. Qual. 27:277-293. Simonsson, M., S. Andersson, Y. Andrist-Rangel, S. Hillier, L. Mattsson, and I. Oborn. 2007.
Potassium release and fixation as a function of fertilizer application rate and soil parent material. Geoderma 140: 188-198.
Skeffington, R.A., and E.J. Wilson. 1988. Excess nitrogen deposition: Issues for consideration.
Environ. Pollut. 54:159-184. Solano, M.L., F. Iriarte, P. Ciria, and M.J. Negro. 2001. Performance characteristics of three
aeration systems in the composting of sheep manure and straw. J. Agric. Eng. Res. 79(3)317-329.
Sollenberger, L.E., W.R. Ocumpaugh, V.P.B. Euclides, J.E. Moore, K.H. Quesenberry, and
J.C.S. Jones. 1988. Animal performance on continuously stocked Pensacola Bahiagrass and Floralta limpograss. J. Prod. Agric.:216-220.
209
Sollenberger, L.E., J.C.B. Dubeux, Jr., H.Q. Santos, and B.W. Mathews. 2002. Nutrient cycling in tropical pasture ecosystems. p. 151-179. In A.M.V. Batista, M.V.F. dos Santos, L.M.C. Ferreira (eds.). Reuniao Annual da Soc. Bras. Zootecnia. SBZ, Recife, PE, Brazil.
Sommer, S.G., and P. Dahl. 1999. Nutrient and carbon balance during the composting of deep
litter. J. Agric. Eng. Res. 74:145-153. Southern Region Information and Exchange Group on Soil Testing and Plant Analyses (SRIEG).
1983. Reference soil test methods for the southern region of the United States. Southern Cooperative Series Bull. 289. Univ. of Georgia, Athens, GA.
Sparks, D.L., and P.M. Huang. 1985. Physical chemistry of soil potassium. p. 202-264. In
Munson, R.D. (ed.), Potassium in Agriculture. American Society of Agronomy, Madison, WI.
Stanley, R.L., and F.M. Rhoads Jr. 2000. Bahiagrass production, nutrient uptake, and soil-test P
and K. Soil Crop Sci. Soc. Fla. Proc. 59:159-163. Staples, C.R. 2003. Bermudagrass: growing, storing, and feeding for Dairy animals. CIR1140.
Animal Science Department, Florida Cooperative Extension Service, IFAS, UF. [Online] http://edis.ifas.ufl.edu/DS131 (verified 02/06/2008).
Strom, P.F. 1985. Effect of temperature on bacterial species diversity in thermophilic solid-waste
composting. Appl. Environ. Microbiol. 50:899-905. Sullivan, D.M., S.C. Fransen, C.G. Cogger, and A.I. Bary. 1997. Biosolids and dairy manure as
nitrogen sources for prairiegrass on a poorly drained soil. J. Prod. Agric. 10:589-596. Sweeten, J.M. 1996. Cattle feedlot manure and wastewater management practices for water and
air pollution control. p.62-84. In R.C. Albin and G.B. Thompson (ed.) Cattle feeding: A guide to management, 2nd ed. Trafton Printing, Amarillo, TX.
Swinker A., M.K. Tanner, D.E. Johnson, and L. Benner. 1998. Composting
characteristics of three bedding materials. J. Equine Vet Sci. 18:462-466. Sylla, Y.B., T. Watanabe, K.J. Cho, and M. Kuroda. 2003. Effect of the number of the vertical
pipes for the passive aeration on the composting rate. J. Water and Environ. Tech. 1(2):225-232.
Tang, J., M. Nagamitsu, Y. Tada, and A. Katayama. 2006. Characterization of the maturing
process of cattle manure compost. Process biochemistry 41:380-389. Thompson, W.H. 2001. Test Methods for the Examination of Composting and Compost
(TMECC). The US Composting Council Research and Education Foundation, and the United States Department of Agriculture, Washington, DC.

210
Tiffany, M.E., L.R. McDowell, G.A. O’Connor, H. Nguyen, F.G. Martin, N.S. Wilkinson, and E.C. Cardoso. 2000. Effects of pasture-applied biosolids on forage and soil concentrations over a grazing season in North Florida. 1. Macrominerals, crude protein, and in vitro digestibility. Commun. Soil Sci. Plant Anal. 31:201-213.
Tiquia, S.M., and N.F.Y Tam. 2002. Characterization and composting of poultry litter in forced-
aeration piles. Process Biochemistry 37:869-880. Tiquia, S.M., N.F.Y Tam, and I.J. Hodgkiss. 1997. Composting of spent pig litter at different
seasonal temperatures in subtropical climate. Environmental Pollution 98(1):97-104. Tiquia, S.M., J.H.C. Wan, and N.F.Y. Tam. 2002. Microbial population dynamics and enzyme
activities during composting. Compost Sci. and Util. 10(2): 150-161. Twidwell, E., W.D. Pitman, and G.J. Cuomo. 1998. Bahiagrass production and management.
LSU publication # 2697. [Online] http://www.agctr.lsu.edu/wwwac (verified) 01/18/2008.
United States Census Bureau (USCB). 2006. American community survey. [Online]
http://www.census.gov/ (verified 03/20/2008). United States Composting Council. 2000. Field guide to compost use. [Online]
http://compostingcouncil.org/article.cfm?id=52 (verified 01/30/2008). United States Department of Agriculture National Organic Program Standards (USDA).
2002. Rule 7 CFR Part 205, RIN: 0581:AA40. United States Department of Agriculture (USDA). 2006. Soil Survey of Suwannee County,
Florida. U.S. Government Printing Office, Washington, DC. [Online] http://soildatamart.nrcs.usda.gov/Manuscripts/FL121/0/Suwannee.pdf (verified 02/22/2008).
United States Environmental Protection Agency (USEPA). 1998. p. 1-53. EPA530-R-97-003.
Organic materials management strategies. Office of Solid Waste and Emergency Response. US Government Printing Office, Washington, DC.
United States Environmental Protection Agency (USEPA). 1999a. Laws and Regulations, Policy
and Guidance Documents, and Legislation. [Online] http://www.epa.gov/OW/laws.html (verified 01/16/2008).
United States Environmental Protection Agency (USEPA). 1999b. Background report on
fertilizer use, contaminants and regulations. [Online] http://www.epa.gov/oppt/pubs/fertilizer.pdf (verified 01/23/2008).
United States Environmental Protection Agency (USEPA). 2000a. National Water Quality
Inventory. [Online] http://www.epa.gov/305b/2000report/ (verified 01/15/2008).
211
United States Environmental Protection Agency (USEPA). 2000b. National pollutant discharge
elimination system permit regulation and effluent limitation guidelines and standards for concentrated animal feeding operations. [Online] http://www.epa.gov/fedrgstr/EPA-WATER/2001/January/Day-30/w1976.htm (verified 01/15/2008).
United States Environmental Protection Agency (USEPA). 2002. Concentrated animal feeding
operations: What are the federal requirements for horse and sheep CAFOs. EPA 833-F-02-0011. [Online]. http://www.epa.gov/npdes/pubs/cafo_brochure_horse.pdf (verified 01/14/1008).
United States Environmental Protection Agency (USEPA). 2007. Municipal solid waste
generation, recycling, and disposal in the United States: Facts and Figures for 2006. EPA-530-F-07-030.
University of Maryland Cooperative Extension (UM). 1993. Estimated mineralization rates,
nitrogen credits for legumes and ammonia conservation factor for organic nitrogen. CO MAR 15.20.08.05. [Online] http://www.mda.state.md.us/resource_conservation/nutrient... (verified 03/20/2008).
Valentim, J.F., O.C. Rvelke, and G.M. Prine. 1988. Evaluation of forage yield, quality, and
botanical composition of a dwarf elephantgrass-rhizoma peanut association as affected by nitrogen fertilization. Proc. Soil and Crop Sci. Soc of Florida. 47:237-242.
van der Ploeg, R.R., W. Bohm, and M.B. Kirkham. 1999. On the origin of the theory of mineral
nutrition of plants and the law of the minimum. J. Am. Soil Sci. Soc. 63:1055-1062. van Horn H.H., G.L. Newton, and W.E. Kunkle. 1996. Ruminant nutrition from an
environmental perspective: factors affecting whole-farm nutrient balance. J. Anim. Sci. 74:3082-3102.
Vogtmann, H., K. Fricke, and T. Turk. 1993. Quality, physical characteristics, nutrient content,
heavy metals and organic chemicals in biogenic waste compost. Compost Sci. and Util. 1(4):69-87.
Waller, P.J., and M. Faedo. 1996. The prospects for biological control of the free-living stages of
nematode parasites of livestock. Int. J. Parasitol. 26:539-546. Warman, P.R. and W.C. Termeer. 1996. Composting and evaluation of racetrack, manure, grass
clippings and sewage sludge. Bioresource Tech. 55:95-101. Warman, P.R., and W.C. Termeer. 2005. Evaluation of sewage sludge, septic waste and sludge
compost applications to corn and forage: yields and N, P and K content of crops and soil. Bioresour. Technol. 96:955-961.
212
Warren, L.K. 2006. Determining grazing capacity. In Proceedings of the Florida Equine Institute and Trade Show, September 21, Ocala, Florida. pp. 10-11.
Watschke, T.L., R.O. Mumma, D.T. Linde, J.A. Borger, and S.A. Harrison. 2000. Surface runoff
of selected pesticides applied to turfgrass. p.94-105.In J.M. Clark and M.P. Kenna (ed.), Fate and management of turfgrass chemicals. Vol. 743. Am Chem. Soc., Washington, D.C.
Watson, D.W., D.A. Rutz, K. Keshavarz, and J.K. Waldron. 1998. House fly (Musca domestica
L.) survival after mechanical incorporation of poultry manure into field soil. J. Appl. Poultry Res. 7:302-308.
Wei Y., and Y. Liu. 2005. Effects of sewage sludge compost application on crops and cropland
in a 3-year field study. Chemosphere 59:1257-1265. Westerman, P.W., T.L. Donnelly, and M.R. Overcash. 1983. Erosion of soil and poultry manure
– a laboratory study. Transactions of the ASAE 26(4):1070-1078. Whalen, J.K., and C. Chang. 2001. Phosphorus accumulation in cultivated soils from long-term
annual applications of cattle feedlot manure. J. Envir. Qual. 30:229-237. Whitehead, D.C., and N. Raistrick. 1990. Ammonia volatilization from five nitrogen compounds
used as fertilizers following surface application to soils. J. Soil Sci. 41:387-394. Wright, D., J. Marois, M. Vargas, and P. Wiatrak. 2003. Perennial grasses, soil organic matter,
and crop yield. Proceedings of Sod Based Cropping Systems Conference, Quincy, Florida. pp. 34-44.
Wu, L., L.Q. Ma, and G.A. Martinez. 2000. Comparison of methods for evaluating stability and
maturity of biosolids compost. J. Environ. Qual. 29:424-429. Xie, R.J., and A.F. MacKenzie. 1986. Urea and manure effects on soil nitrogen and corn dry
matter yields. Soil Sci. Soc. Am. J. 50:1504-1509. Yamulki S. 2006. Effect of straw addition on nitrous oxide and methane emissions from
stored farmyard manures. Agriculture, Ecosystems and Environment.112:140-145. Young, R.A., T. Huntrods, and W. Anderson. 1980. Effectiveness of vegetated buffer strips in
controlling pollution from feedlot runoff. J. Environ. Qual. 9(3):483-487. Zucconi, F., A. Pera, and M. Forte. 1981. Evaluation toxicity of immature compost. BioCycle
22(2):54-57.

BIOGRAPHICAL SKETCH
Sarah Courtney Dilling was born in Glen Cove, New York, in 1979 to Robert and Susan
Walsh. She moved to Pine Island, Florida, in 1984 where she remained until 1996. Sarah
attended and graduated from Venice High School in Venice, Florida (1997). She obtained a
Bachelor of Science degree in environmental science and policy from the University of South
Florida (2001). Sarah took a year off between undergraduate and graduate school to work in an
environmental laboratory as a chemist in Tampa, Florida. In 2002, Sarah was accepted into a
graduate program in animal science under Dr. S.H. TenBroeck at the University of Florida, and
graduated with a Master of Science in 2004. Sarah began a Ph.D. program in January 2005, in
the Department of Animal Sciences at the University of Florida studying nutrient management
and composting of horse stall material. After completion of her program, Sarah will graduate
with a Ph.D. majoring in animal science with a minor in soil and water science. Sarah plans on
moving to South Florida and pursuing a career in the environmental science field.