on-line monitoring of moisture and salt contents by the ...ucanr.edu/datastorefiles/608-576.pdf ·...
TRANSCRIPT

Journal of Food Eqheen’ng 38 (1998) 153-167 0 1998 Ekevier Science Limited. Ali rights reserved
Printed in Great Britain
ELSEVIER 0260-8774/98/$ - see front matter
PII: SO260-8774(98)00118-6
On-line Monitoring of Moisture and Salt Contents by the Microwave ‘lkansmission Method in a Continuous Salted
Butter-making Process
Yasuhiko Shiinoki*, Yasuyuki Motouri & Kensuke Ito
Technology and Research Institute of Snow Brand Milk Products Co. Ltd, l-l-2 Minamidai, Kawagoe, Saitama 350-l 165, Japan
(Received 12 May 1997; revised 9 August 1998; accepted 10 August 1998)
ABSTRACT
The microwave transmission technique was applied to simultaneously monitor the moisture and salt contents in a butter-making process. The dielectric properties of a salted water-in-oil (WIO) emulsion as a model of salted butter was investigated. The dielectric loss tangent, tam?, of a non-salted W/O emulsion was independent of the volume fraction of the dispersed phase, whereas that of the salted WI0 emulsion increased with increasing volume fraction of the dispersed phase below a frequency of 3 GHz .It was theoretically confirmed that the moisture and salt contents of the salted W/O emulsion could be evaluated from the linear formula for phase shift and attenuation in the same frequency region, and that the electrolyte had more effect on attenuation than the phase shift. The moisture and salt contents of salted butter could be simultaneously monitored in the butter-making process by means of a linear regression formula for the phase shift and attenuation at a frequency of 3 GHz in a concentration range between 15-S and 17.5% by weight, and between 1.0 and 2.0% by weight, respectively. 0 1998 Elsevier Science Limited. All rights reserved.
NOTATION
A Attenuation (dB) C Velocity of light (m SC’)
*To whom correspondence should be addressed
153

154
& E .Y J k t Vl
z
ins
80
El
82
Ed
&??I
Er
E' I, E
PO
; Co
Electric field intensity (V m-‘) y component of the electric field intensity (V m-‘) Imaginary number (j” = - 1; dimensionless) Complex propagation constant (m-l) Time (s) Volume fraction of the dispersed phase (dimensionless) Traveling path length (m) Attenuation constant Phase constant (m-l)
(m-l)
Dielectric loss tangent (dimensionless) Permittivity ( = 8S54 x lo-i2 F m-‘) Relative permittivity of the continuous phase (dimensionless) Relative permittivity of the dispersed phase (dimensionless) Complex relative permittivity (dimensionless) Effective relative permittivity of an emulsion (dimensionless) Relative permittivity (dimensionless) Real part of &d (dimensionless) Imaginary part of &d (dimensionless) Absolute permeability of free space ( = 47c x lop7 H m-‘) Conductivity (S m-‘)
Angle (“) Angular frequency (rad s-‘)
INTRODUCTION
On-line monitoring of moisture and salt contents is very important for controlling the process and quality in salted butter making. It is very difficult to control the moisture and salt contents in a continuous butter-making process because they cannot be measured continuously or non-destructively.
A method for evaluating the moisture and salt contents of salted butter has been presented (Doi et al., 1991). They concluded that both the moisture and salt con- tents of salted butter were independently related to the specific gravity and permittivity. The results showed that both the moisture and salt contents could be satisfactorily evaluated by a linear regression formula for permittivity and specific gravity. However, no theoretical discussion was presented. Moreover, the monitoring system was complicated by the on-line specific gravity measurement that was employed.
When considered in a slightly different way, butter is a water-in-oil (W/O) emul- sion system. The dielectric properties at relatively low frequencies of a W/O emulsion system have been investigated by some workers. Clausse has noted this in his review of the dielectric properties of emulsions at low frequencies (Clausse, 1980). The representative study is that of Hanai (1968), whereas the dielectric properties of a W/O emulsion system in the microwave-frequency region have been studied by Per1 et al. (1990). They measured the dielectric properties of an emulsion at a frequency of 23.5 GHz by converting the sample attenuation and phase shift measurements to permittivity and loss factor values. It was concluded that a dielec- tric modulus, representing the ratio of the sample emulsion loss tangent to the pure water loss tangent, could be used to characterize both the emulsion type and

On-line monitoring of moisture and salt contents 155
moisture content over a broad range of frequency. Thomas et al. (1990) have confirmed these results by computation with interaction potential models and effect- ive medium theories.
A particular microwave apparatus has been used for measuring the moisture of food. Chouikhi et al. (1987) inserted a microwave strip line sensor into the barrel of a pilot-scale extrusion cooker and monitored the moisture content of maize grits by attenuation measurements. Rzepecka and Pereira (1974) measured the permittivity of several dairy products by using the cavity perturbation method at 2.45 GHz and compared the results with theoretical predictions. Kraszewski and Kulinski (1976) have proposed a method for measuring both the phase and attenuation of micro- wave power transmitted through a sample. The effect of density can be eliminated by using these two values. Kent and Meyer (1982) have developed a density-inde- pendent microwave moisture meter for heterogeneous foodstuff such as powders and fibers by using these two microwave parameters related to the phase shift and attenuation. A number of topics relating to the microwave measurement of the moisture content of a powder have already been fully reviewed by Kress-Rogers and Kent (1987).
This present paper reports the relationship between the dielectric properties of a W/O emulsion and such microwave propagation properties as the phase shift and attenuation, and discusses the potential of the microwave transmission method for monitoring on-line the moisture and salt contents in a continuous salted butter- making process.
EXPERIMENTAL
Dielectric property measurements of the W/O emulsion
A W/O emulsion as a model of salted butter was prepared by dispersing a NaCl solution in soy bean oil (Nisshin Oil Mills) containing 0.1% polyglycerol poly- rincinoleate (Sakamoto Yakuhin) with a T. K. homo-mixer (Tokushu Kikai Kogyo Co.) at 25°C. The volume fraction of the dispersed phase was kept at a constant value bellow 0.6 for each measurement. The average diameter of the dispersed- phase droplets was - 1.7 pm ( kO.85 pm SD). The salt concentration of the dispersed phase was between zero and 20% by weight. The dielectric properties of the W/O emulsion were measured with a Hewlett-Packard 86070B dielectric probe kit with software in the frequency range of O-2 to 20.0 GHz. The dielectric probe was connected to a Hewlett-Packard 8720C microwave network analyzer and con- trolled with a Hewlett-Packard 9858OA model 425 microcomputer. The principles of measurement and computation have been described by a number of authors (Mosig et al., 1981). The sensing probe was attached to the bottom of a vessel fitted with a jacket to control the sample temperature. All measurements were taken at 25°C.
Measurement of the microwave propagation properties of the W/O emulsion
Figure 1 shows the system used for measuring such microwave propagation proper- ties as the phase shift (in degrees) and attenuation [decibel (dB); dB = nepers x 8.6861 of the W/O emulsion. The phase shift and attenuation at

156 Y Shiinoki et al.
3 GHz were measured with the microwave network analyzer connected via coaxial cable to a rectangular waveguide (IEC R-32) at 25°C. The TElo mode of the waveguide was in a frequency range between 2.60 and 3.95 GHz. The flow cell was made up of low-permittivity Teflon material. The W/O emulsion was continuously passed through the flow cell with a pump to ensure that the sample was homoge- nized. The internal width of the flow cell was 32.0 mm. Calibration for measuring the phase shift and attenuation was carried out in the absence of the sample by the response calibration method.
On-line measurement of the microwave propagation properties of salted butter
The microwave propagation properties of salted butter were measured on-line with Micro-Moist LB-354 equipment (E. G. G. and G. Berthold), which can determine the phase shift and attenuation at a variety of measuring frequencies in the range of 2.7 to 3.4 GHz (Klein & Pesy, 1989). A microwave horn antenna (111 x 143 mm aperture) was mounted adjacent to a Teflon board situated on each side of the nozzle of the continuous butter-making machine as shown in Fig. 2. The thickness of each Teflon board was 80 mm in order to maintain the microwave traveling distance constant in the butter-making process: the path length between these Teflon boards was 100-O mm. The inside of each microwave horn antenna was kept dry by continu- ously passing dry air to eliminate the effect of any moisture change. The obtained
Network Analyzer
p 1
Mixer
Flow Cell
Fig. 1. Schematic diagram of the system for measuring microwave propagation properties.

On-line monitoring of moisture and salt contents 157
phase shift and attenuation data were transmitted to a microcomputer, and the moisture and salt contents were calculated by using these values. The apparatus was calibrated by connecting to a lo-dB attenuator. The chemical determination of the moisture and salt contents for this calibration was done as described in AOAC (1995) Official Methods 920.116 and 960.29, respectively.
Microwave propagation properties and dielectric constants
The complex permittivity, &d , was defined as
a Ed=&‘+ jE"=E,- j- (1)
O&o
where E’ is the real part of &d and is equal to E,, and &’ is the imaginary part of &d and is equal to -~/WE,,.
A plane wave traveling through a lossy dielectric medium can be represented by
Ey = E. exp [ j(ot - kz)] (2)
where
Horn antenna
Teflon board
Nozzle of butter- making machine
Fig. 2. Installation of horn antennae at the nozzle of a butter-making machine for on-line monitoring of the moisture and salt contents of salted butter.

158 Y Shiinoki et al.
k2 = w2p+,,osd (3)
Equation (2) has the same form as the equation for a plane wave in free space, except that phase coefficient /I has been replaced by k. p is a real number which describes the phase coefficient of a loss-less wave, whereas k is a complex number with real part fl and an imaginary part, attenuation coefficient CL
k=/?-ja (4)
Equations (l), (3) and (4) give
/I--- ja =w(~E~E’)“~(~ -j tan@“* (5)
where the relative permeability is really unity. The microwave propagation properties, a and /I, can be derived from eqn (5) as
follows:
0.487 Vi : 0.461
0.433 0.402 0.371 0.336 0.297 0.264 0.228 0.187 0.155 0.084 0.000
0.5 1.0 2.0 5.0 10.0 20.0
Microwave frequency [GHz] Fig. 3. Dependence of the relative permittivity of a non-salted W/O emulsion on the micro- wave frequency. (The arrow shows the direction of increase in the volume fraction of the
dispersed phase from 0 to O-42.)
I 1 I 1 I I 1

On-line monitoring of moisture and salt contents
Equations (6) and (7) lead to attenuation A and phase shift $ of
A = 8.686za
180~ $I=-_
27 p
I
/
,
I I
,
,
,
,
159
(6)
(7)
(8)
(9)
0.0 0.2 0.4 0.6
Volume fraction of dispersed phase Fig. 4. Dependence of the relative permittivity of a W/O emulsion on the volume fraction of the dispersed phase. (Salt concentrations: O%, -; lO%, ---A-- -; 20%,
-- -o- - -.)

where t is the microwave travelling distance in the medium. The phase shift and attenuation of the W/O emulsion were evaluated from eqns (6)-(9) by using the measured permittivity, E’, and dielectric loss tangent, tan 6 = Idla’l.
RESULTS AND DISCUSSION
Dielectric properties of the W/O emulsion
The dielectric properties of the W/O emulsion were measured in order to evaluate the change in microwave propagation properties of the phase shift and attenuation. Figure 3 shows the permittivity dependence of a non-salted W/O emulsion on the microwave frequency. The arrow shows the increase in moisture content in the range of dispersed-phase volume fraction from3 to 0.49. This volume fraction range covers the range of 0.08 to 0.10, which is a practical range used in a butter-making process. The permittivity of the non-salted W/O emulsion increased with increasing
Vl: 0.487 A 0.461
0.433 0.402 0.371 0.336 0.297 0.264 0.228 0.187 0.155 0.084
I 0.000
1 2 5 10 20
Microwave frequency [GHz] Fig. 5. Dependence of the dielectric loss tangent of a non-salted W/O emulsion on the microwave frequency. The arrow shows the direction of increase in the volume fraction of
the dispersed phase from 0 to 0.42.

On-line monitoring of moisture and salt contents 161
moisture content. The permittivity dependence on frequency was negligibly small at a low moisture content, with the permittivity dependence of the salted W/O emul- sion being similar to that of the non-salted W/O emulsion. Figure 4 shows the permittivity dependence of non-salted and salted W/O emulsions at a frequency of 3 GHz on the volume fraction of the dispersed phase. The plots in Fig. 4 present values predicted by the following equation using Hanai’s model:
The experimental value for the permittivity of the non-salted W/O emulsion was in good agreement with the values predicted by using Hanai’s model, whereas that of the salted W/O emulsion was larger than the predicted values. This discrepancy for the salted W/O emulsion may have been caused by the local polarization at the interface between the oil and water phases.
Figures 5 and 6 show the effect of frequency on the dielectric loss tangent, tan 6,
Vl : A
0.469 0.444
’ 0.416 0.385 0.355 0.321 0.283 0.251 0.216
1 2 5 10 20
Microwave frequency [Q-W Fig. 6. Dependence of the dielectric loss tangent of a salted W/O emulsion (10% salt concentration) on microwave frequency. The arrow shows the direction of increase in the
volume fraction of the dispersed phase from 0 to 0.42.
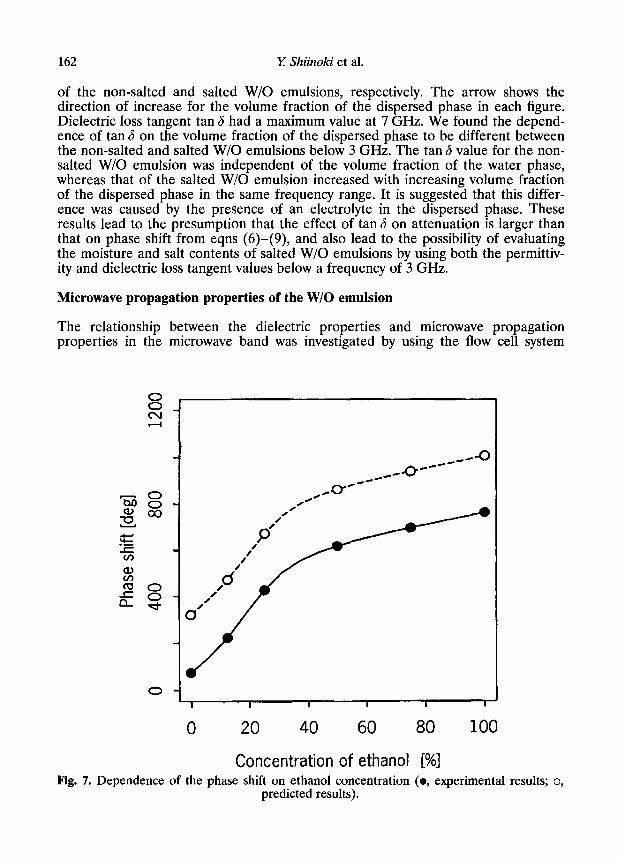
of the non-salted and salted W/O emulsions, respectively. The arrow shows the direction of increase for the volume fraction of the dispersed phase in each figure. Dielectric loss tangent tan 6 had a maximum value at 7 GHz. We found the depend- ence of tan 6 on the volume fraction of the dispersed phase to be different between the non-salted and salted W/O emulsions below 3 GHz. The tan 6 value for the non- salted W/O emulsion was independent of the volume fraction of the water phase, whereas that of the salted W/O emulsion increased with increasing volume fraction of the dispersed phase in the same frequency range. It is suggested that this differ- ence was caused by the presence of an electrolyte in the dispersed phase. These results lead to the presumption that the effect of tan 6 on attenuation is larger than that on phase shift from eqns (6)-(9), and also lead to the possibility of evaluating the moisture and salt contents of salted W/O emulsions by using both the permittiv- ity and dielectric loss tangent values below a frequency of 3 GHz.
Microwave propagation properties of the W/O emulsion
The relationship between the dielectric properties and microwave propagation properties in the microwave band was investigated by using the flow cell system
20 40 60
Concentration of ethanol Fig. 7. Dependence of the phase shift on ethanol concentration
predicted results).
80 100
[%I (0, experimental results; 0,

On-line monitoring of moisture and salt contents 163
shown in Fig. 1. An ethanol solution was used to characterize the flow cell system. Figure 7 shows the influence of ethanol concentration on the phase shift at a frequency of 3 GHz, the experimental phase shift being increased with increasing ethanol concentration. This behavior is similar to that of the phase shift predicted from eqns (7) and (9) using the measured dielectric properties at a frequency of 3 GHz. However, there was 240” difference between the measured and predicted phase shift over the full range of ethanol concentration, this difference being caused by the effect of calibration. The attenuation dependence on ethanol concentration is shown in Fig. 8. The experimentally measured attenuation was not in agreement with the value predicted from eqns (6) and (8). This disagreement is undoubtedly caused by diffraction and multi-reflection effects in the flow cell. We did, however, confirm the linear relationship between the microwave propagation properties and the moisture content over a narrow range that included 15.5175%, which is the practical moisture content in a butter-making process.
The microwave propagation properties of non-salted and salted W/O emulsions were investigated at 3 GHz with the flow cell, and the influence of moisture content on phase shift is shown in Fig. 9. In order to negate the effect of the calibration method, the difference between the phase shift of the W/O emulsion, 4emulsion, and
0 20 40 60
Concentration of ethanol Fig. 8. Dependence of the attenuation on ethanol concentration
predicted results).
80 100
WI (0, experimental results; 0,

164 2: Shiinoki et al.
that of the oil phase, 4oil, was applied. As shown in this figure, we found that the phase shift difference, +emulsion - +oil, increased linearly with increasing moisture content. Moreover, the slope of the plot was independent of the salt concentration. The slope predicted by using eqns (7) and (9) was the same as that from the measured values. Figure 10 shows the influence of moisture content on the attenua- tion of non-salted and salted W/O emulsions. In analogy with the phase shift, the difference between the attenuation of the W/O emulsion, Aemuhion, and that of oil phase, Aoil, was applied. The attenuation difference, Aemuhion -Aoil, also increased with increasing moisture content and salt concentration, the slope of the plots being in good agreement with the values predicted by using eqns (6) and (8). In addition, it was found that both the phase shift and attenuation difference were proportional to the salt content at a constant moisture content as shown in Figs 9 and 10. When the constant moisture content of W/O emulsion was 17%, the predicted increment of the attenuation difference per a unit percent of salt concentration was - O-15 dB. This value was 25% of the attenuation difference of non-salted W/O emulsion with the same moisture content. At the same time, the predicted increment of the phase shift difference was - 3.53”. This value was 6.2% of the phase shift difference of the
10 12 14 16 18 20
Moisture content [%I Fig. 9. Dependence of the microwave propagation property (phase shift difference) of a salted W/O emulsion on the moisture content. The arrow shows the direction of increase in
the salt content: 0, 0.5, 1.0, 1.5, 2.0%. -, experimental results; - - - predicted results.

On-line monitoring of moisture and salt contents 165
non-salted W/O emulsion with the same moisture content. It can therefore be presumed that the effect of salt concentration on the attenuation difference is larger than that on the phase shift difference in the salted W/O emulsion system. The moisture and salt contents of a salted W/O emulsion could accordingly be evaluated from the complex formula for the phase shift and attenuation.
On-line monitoring of the moisture and salt contents of salted butter
Values for the phase shift and attenuation were measured with a Micro-Moist instrument during the salted butter-making process. A linear regression analysis was conducted for over 120 different moisture and salt contents of salted butter. Conse- quently, it was confirmed that the moisture and salt contents could be expressed in terms of the phase shift and attenuation by the following linear regression formulae:
Moisture(%) = 0.22494 -0.0167A - 255.6036
Salt(%)= 0~2352~$-0~0460A-266G?263
(11)
(12)
lo 12 14 16 18 20
Moisture content [%I Fig. 10. Dependence of the microwave propagation property (attenuation difference) of a salted W/O emulsion on the moisture content. The arrow shows the direction of increase in
the salt content: 0, OS, 1.0, 1.5, 2.0%. -, experimental results; - - - predicted results.

166 Y Shiinoki et al.
Figure 11 shows a comparison of the determined moisture and salt contents with the values predicted from eqns (11) and (12). Close agreement in values was obtained. This microwave transmission method gave a maximum error for predicting the moisture content (SE) of f O*l%, and for the salt content of f0*2%. These errors were caused by the variation of microwave transmission distance in the butter- making process. In conclusion, we theoretically confirmed the relationship between the dielectric properties and microwave propagation properties of a salted W/O emulsion, and found that the moisture and salt contents of salted butter could be simultaneously monitored by means of the microwave transmission method during the continuous butter-making process.
CONCLUSION
We investigated the dielectric properties of a salted W/O emulsion to evaluate the application of the microwave transmission technique for monitoring the moisture and salt contents. The moisture content of a non-salted W/O emulsion did not
0 1 2 3 4 5
Time [h]
0 1 2 3 4 5
Time [h] Fig. 11. Monitoring of the moisture and salt contents of salted butter in the manufacturing process. Top, monitoring moisture content; bottom, monitoring salt content; -, moni-
tored values; o, determined by following the AOAC Official Method.

On-line monitoring of moisture and salt contents 167
influence the dielectric loss tangent, tan 6, below a frequency of 3 GHz, whereas tan 6 for a salted W/O emulsion increased with increasing moisture content in the same frequency range. These results indicate that the salt content had a greater influence on the attenuation of the microwaves transmitted through salted butter than on the phase shift. Therefore, the moisture and salt contents can be indepen- dently predicted by measuring the two microwave propagation properties of phase shift and attenuation. In other words, the content of each in salted butter can be predicted from the related linear regression equation as a function of the phase shift and attenuation below a frequency of 3 GHz.
It is clear that the microwave transmission technique is useful for monitoring the moisture and salt contents of salted butter in its manufacturing process. Measure- ment of the two microwave parameters of phase shift and attenuation was accurate to +0-l% and +0*2% for the moisture and salt contents, respectively.
REFERENCES
Chouikhi, S. M., Ferdinand, J. M., Smith, A. C. & Kent, M. (1987). Use of a microwave- attenuation sensor for moisture measurement inside an extrusion cooker. Journal of Food Engineering, 6, 113-121.
Clausse, M. (1980). Encyclopedia of Emulsion Technology, Vol. l(3). Dekker, NY. Doi, T., Kanzaki, M., Watanabe, T., Nakamuma, H., Shibuya, M. & Matsumoto, K. (1991).
Non-destructive continuous and simultaneous estimation of moisture and salt contents in butter by the combination of specific gravity and dielectric constant. Nippon Shokuhin Kogyo Gakkaishi, 38(10), 904-909.
Hanai, T. (1968). Emulsion Science. Academic Press, NY. Kent, M. & Meyer, W. (1982). A density-independent microwave moisture meter for hetero-
geneous foodstuffs. Journal of Food Engineering, 1, 31-42. Klein, A. & Pesy, W. (1989). Experiences with the ‘Micro-Moist’ microwave moisture meter.
Aujbereitungs-Technik, 9, 549-557. Kraszewski, A. & Kulinski, S. (1976). An improved microwave method of moisture content
measurement and control. IEEE Transactions on Industrial Electronics and Control Instru- mentation (ZECI), 23(4), 364-370.
Kress-Rogers, E. & Kent, M. (1987). Microwave measurement of powder moisture and density. Journal of Food Engineering, 6,345-375.
Mosig, J. R., Besson, J. E., Gex-Fabry, M. & Gardiol, F. E. (1981). Reflection of an open- ended coaxial line and application to nondestructive measurement of materials. IEEE Transactions Instrumentation and Measurement, 30(l), 46-51.
Perl, J. P., Thomas, C. & Wasan, D. T. (1990). Complex dielectric properties of macroemul- sions using a microwave interferometric dielectrometer. Journal of Colloid and Inter$ace Science, 137(2), 425-432.
Rzepecka, M. A. & Pereira, R. R. (1974). Permittivity of some dairy products at 2450 MHz. Journal of Microwave Power, 9(4), 277-288.
Thomas, C., Perl, J. P. & Wasan, D. T. (1990). Complex dielectric properties of macroemul- sions in the microwave region. Journal of Colloid and Interface Science, 139(l), 2-13.