on-line time-of-flight mass spectrometric analysis of ... time-of-flight mass spectrometric analysis...
TRANSCRIPT
Anal. Chem. 1994,66, 3696-3701
On-Line Time-of-Flight Mass Spectrometric Analysis of Peptides Separated by Capillary Electrophoresis Llllng Fang, Rong Zhang, Evan R. Wllllams,t and Rlchard N. Zare' Department of Chemistry, Stanford University, Stanford, California 94305
Time-of-flight mass spectrometry (TOFMS) is coupled on- line with capillary electrophoresis (CE) to analyze mixtures of biomolecules using an electrospray ionization (ESI) inter- face. The eluent is electrosprayed directly from the CE capillary using a thin gold wire to maintain its potential. The ions are extracted at right angles to the initial direction of the ion beam, and a complete mass spectrum is recorded every 100 ~ s . This CE/ESI-TOFMS apparatus achieves a separation efficiency of 50 000 theoretical plates with a concentration detection limit of (1-2) X molar, which corresponds to a mass detection limit of approximately 40-80 fmol per component.
Mass spectrometric detection of analytes separated by capillary electrophoresis (CE) offers several advantages over other detection systems. The analytes are differentiated not only by their migration times but also by their molecular masses and mass fragmentation patterns. Because of its universality, relatively high sensitivity, and structural elucidation capability, mass spectrometry (MS) is anticipated to become one of the most powerful and popular on-line detection methods for CE.' To date, however, this promise has not been fully realized because of technical problems and the high cost associated with combining CE separations with on-line MS detection.
The first successful coupling of CE to MS was demonstrated in 1987 by Smith and co-workers,2 who used an electrospray ionization (ESI) source with a quadrupole mass spectrometer. Since then, a variety of mass spectrometers have been coupled to CE;3 examples are a magneticsector,M a Fourier transform ion cyclotron resonance mass ~pectrometer,~ and an ion trap mass spectrometer.8 The duration of the peaks in a typical CE separation is a few seconds. Consequently, complete mass spectra must be acquired within this time frame. One strategy is to scm detection of mass with time, but this approach has the drawback of a skewed response because the concentration changes during the scan time. An alternative strategy is to use multichannel detection such as array detection to acquire a complete mass spectrum for each time interval over the
Present address: Department ofchemistry, University of California at Berkeley, Berkeley, CA 94720.
(1) Kuhr, W. G.; Monnig, C. A. Anal. Chem. 1992,64, 389R407R. (2) Olivares, J. A,; Nguyen, N. T.;Yonker,C. R.;Smith, R. D. Anal. Chem. 1987,
(3) Smith, R. D.;Hahl, J. H.;Goodlett, D. R.; Hofstadler,S. A. Anal Chem. 1993,
(,4) Caprioli, R. M.; Moore, W. T.; Martin, M.; Dague, B. B.; Wilson, K., Moring,
( 5 ) Dewit, J. S. M.; Deterding, L. J.; Moseley, M. A.; Tomer, K. B.; Jorgensen,
(6) Tomlinson, A. J.; Benson, L. M.; Johnson, K. L.; Naylor, S. Electrophoresis
(7) Hofstadler, S . A.; Wahl, J . H.; Bruce, J. E.; Smith, R. D. J . Am. Chem. SOC.
( 8 ) Ramsey, R. S.; Goeringer, D. E.; McLuckey, S. A. Anal. Chem. 1993, 65,
59, 1230-1232. 65, 574A-584A.
S . J . Chromatogr. 1989, 480, 247-257.
J. W. Rapid Commun. Mass Spectrom. 1988, 2, 100-104.
1994, 15, 62-71.
1993, 1 IS, 6983-6984.
3521-3524.
3696 Analytical Chemistty, Vol. 66, No. 21, November I, 1994
course of a CE peak. One way to implement this strategy is to use time-of-flight mass spectrometry (TOFMS), which has the advantages of high speed, simplicity, and high sensitivity. In this study, we use a linear TOFMS with a MS resolution of 100; however, the use of a reflectron design9 would offer mass resolution of more than 2000. ESI was first combined with TOFMS by Dodonov, Chernushevich, and Laiko,lo who used an orthogonal ion extraction geometry. Subsequently, several approaches for combining these techniques have been reported."-16
The major challenge to using ESI-MS as an on-line detector for CE separations is the provision of electrical contact at the capillary outlet. Liquid sheath" and liquid junction18 methods have been developed to provide electrical contact for the CE terminus. In these methods, however, a large portion of additional electrolyte is introduced; consequently, the con- centration of the analytes for ESI is substantially diluted. In addition, the added electrolyte competes for charges with the analytes, which degrades the detection sensitivity. A need exists to develop a more versatile and reliable interface that does not depend on the addition of electrolyte. To address this problem, Smith and co-workers3J9 gold-coated the etched capillaryoutlet. Instead, we inserted a thin gold wire into the capillary outlet to establish the capillary potential. We find this procedure to be simple and reliable. By this means we achieve a sheathless interface, but of course the choice not to introduce some buffer or a make-up solution restricts in general our operating conditions.
Using our on-line ESI-TOFMS system, we analyzed peptide mixtures at concentrations of 1-2 pM corresponding to 40- 80 fmol of each component loaded on the CE column. The power of this CE/ESI-TOFMS apparatus to mass analyze multiple, coeluting analytes is demonstrated in the separation of synthetic bag cell peptides and egg-laying hormone of the sea mollusk Aplysia cc~'~ornica.
(9) Mamyrin, B. A.; Karatajev, V. J.; Shmikk, D. V.; Zagulin, V. A. Sou. Phys. JETP 1973, 37, 45-48.
(10) Dodonov, A. F.; Chernushevich, I . V.; Laiko, V. V. Presented at the 12th International Mass Spectrometry Conference, Amsterdam, Holland, August 1991; poster.
(1 1) Boyle, J. G.; Whitehouse, C. M.; Fenn, J. B. Rapid Commun. MassSpectrom. 1991, 5, 40W05.
(12) Boyle, J. G.; Whitehouse, C. M. Anal. Chem. 1992, 64, 2084-2089. (13) Coles, J.; Guilhaus, M. TrAC, Trends Anal. Chem. 1993, 12, 203-213. (14) Michael, S. M.; Chien, B. M.; Lubman, D. M. Anal. Chem. 1993,65,2614
(15) Veterentchikov, A. N.; Ens, W.; Standing, K. G. Anal. Chem. 1994.66, 126-
(16) Mirgorodskaya, 0. A.; Shevchenko, A. A.; Chernushevich, I . V.; Dodonov, A.
(17) Smith, R. D.; Barinaga, C. J.; Udseth, H. R. Anal. Chem. 1988, 60, 1948-
(18) Lee, E. D.; Wolfgang, M.; Henion, J. D.; Covey,T. R. Biomed. Enuiron. Mass
(19) Wahl, J. H., Gale, D. C.,Smith, R. D. J . Chromatogr. A 1994,659,217-222.
2620.
133.
F.; Miroshnikov, A. I . Anal. Chem. 1994, 66, 99-107. 1952.
Spectrom. 1989, 18, 844850.
0003-2700/94/0366-3696$04.50/0 0 1994 Amerlcan Chemical Society

I Data I acquisition
uv detector
ES1 needle assembly
Fused silica Power capillary
~~
-.- I -:- ......_.._....._........ I - i
Capillary Electrophoresis €SI Interface TOF-MS
Flgure 1. Schematic diagram of the apparatus, which consists of three major sections: a capillary electrophoresis unit, an ESI interface, and a linear time-of-flight mass spectrometer.
Silver paint
25pm gold wire / Fused-silica
CE capillary
1 Stainless-steel capillaries
€SI Needle Assembly
Flgure 2. CE/ESI interface. A thin gold wire is inserted into the CE capillary outlet to establish electrical potential with the ESI needle assembly.
EXPERIMENTAL PROCEDURES Figure 1 is a schematic diagram of the apparatus, which
consists of three major sections: a capillary electrophoresis unit, an electrospray ionization interface, and a linear time- of-flight mass spectrometer. Each element of this instrument and the operation procedures are described briefly below.
CESeparation Unit. A Beckman P/ACE 2000 instrument (modified for MS interface) is used throughout this work with a 486 personal computer (Los Altos PC Store, Los Altos, CA) to control its operation. Fused silica capillaries (Polymi- croTechnology Inc., Phoenix, AZ) are used that have a length of 110-120 cm, an outer diameter (0.d.) of 200 pm, and an inner diameter (i.d.) of 100 pm. The CE running buffer is a 50 mM acetic acid solution in 5050 methanol/water. The pH value for the buffer is approximately 4. The peptide samples (American Peptide Co., Sunnyvale, CA, and Sigma, St. Louis, MO) used in the separations are dissolved and subsequently diluted in 5050 methanol/water to the desired concentration. The outlet of the capillary forms the initial element of the ESI interface. For some CEstudies, the P/ACE 2000 instrument is used with its UV absorption detector located 104 cm downstream of the inlet.
Figure 2 shows the CE/ESI interface, which is a modified form of a commercial ESI unit (Analytica, Branford, CT). The fused silica capillary of the CE column replaces the original inner stainless steel needle in the needle assembly. A gold wire (25 pm, California Fine Wire Co., Grover Beach, CA) is inserted approximately 2 mm into the terminus of the CE column. The other end of the gold wire is connected to the needle assembly (at ground potential) with silver paint (GC
Electronics, Rockford, IL). A microscope is needed to guide placement of the gold wire inside the capillary outlet. Care is taken to make sure that the gold wire makes contact with the edge of the capillary. Failure to make this contact results in the formation of methanol ion clusters, presumably because the gold wire acts as a discharge electrode.
Using the electrospray ionization unit, we can obtain stable electrospray current by maintaining the spray needle (capillary outlet) at ground while the counter electrodes inside the ESI source are at negative 3-4 kV. The electroosmotic flow from the fused silica capillary (0.15-0.26 pL/min) is sufficient to produce a stable electrospray current (2-3 PA). No extra solvent (e.g., from sheath flow) is needed. A stream of heated N2 gas flows counter to the electrospray direction to facilitate gas-phase ion formation from the sprayed charged droplets. The gas-phase analyte ions pass through a glass transport capillary (6-mm o.d., 0.5-mm i.d., 15 cm long, with gold- coated surfaces on both ends to establish electrical potentials) and two skimmers (skimmer 1, a 90° stainless steel cone with a l-mm aperture, and skimmer 2, a 90' stainless steel cone with a 1.5" aperture) before they enter the main vacuum chamber. An ion lens, which is a 90' skimmer with a 6-mm aperture, is placed equidistant between skimmer 1 and skimmer 2 to improve the ion transmission. The pressures in the first differentially pumped stage (between outlet of the glass capillary and skimmer 1 ), the second differentially pumped stage (between skimmer 1 and skimmer 2), and the ion storage and ion packet formation region are 1,7 X l e 2 , and 2 X l e 5 Torr, respectively. The pressure in the TOF tube is less than 2 X 1 W Torr. The ion current at the end plate is approximately 5 PA. TOFMS Chamber. Figure 3 shows the schematic con-
figuration of the TOFMS chamber (R. M. Jordon Co., Grass Valley, CA) and ion optics plates. An orthogonal geometry is used in which an ion packet is generated by pulsing the continuous ion beam at a 90° angle. A repeller plate is pulsed to 400 V (10-ns rise time) at a frequency of 10 kHz.
The potential on skimmer 2 must be kept relatively high (100-120 V) to obtain usable current ( 5 PA), which results in ions that have high translational energy (approximately 100 eV) and large translational energy spread (several tens of electronvolts) in the ion storage and ion packet formation region. Consequently, these ions are very difficult to turn 90' by pulsing to conduct TOF mass spectrometric analysis. Because of the large energy spread, applying a positive potential on the end plate could slow down only a portion of the entire ion beam.
Table 1 lists the dimensions and voltages applied on each element of the ion optics under experimental conditions. To overcome a large energy spread, ion optics were designed that use a simulation program (MacSimion) to increase the ion transmission efficiency. A positive potential is applied to the end plate to retard the velocity of the ion beam in the ion storage and ion packet formation region. Care is taken to choose the positive potential value on the end plate so that when it is combined with a 400-V transient pulsing potential, a turning mirror is formed to deflect the majority of the ions by 90° into the TOF flight tube. In addition, a long-focal- length ion lens (single ring shape) is used immediately after the acceleration grids. This ion lens gently refocuses the ion
Analytical Chemistty, Vol. 66, No. 21, November 1, 1994 3697

MCP
Ion beam from electrospray
I Accelerating Fli ht grids tu%e
To J
'I \)A Fast preamp
fier
Oscilloscope MCS
Pump Computer
Flguro 3. Schematic configuration of the TOFMS chamber and ion optics. For detailed dimensions, see Table 1.
Table 1. Ian Opth and Thelt Dl" and Applkd Potentlak ion optics geometric dimension (mm)
skimmer 1 focus lens skimmer 2 entrance for storage end plate repeller plate extractor plate grid 1 grid 2 soft focus lens X deflection plate Y deflection plate deceleration plate
90" cone with 41 aperture 90" cone with 46 aperture 90" cone with 41.5 aperture 470 cylinder cap with 46 aperture grid 29 X 70 X 1 80 X 70 X 1 80 X 80 X 1 with 30 X 10 grid 80 X 80 X 1 with 30 X 10 grid 80 X 80 X 1 with 30 X 10 grid 440 X I 2 5 25 X 15 X 1 25X 15X 1 4100 with 425 grid
electric potential (V)
250 141 140 0 290 74 V with 400 V transient pulse 105 0 -3000 -2400 -2970 -2880 -2000
function
differential pumping collimating ion beam differential pumping shielding for ion storage decelerating ion beam decelerating ion beam decelerating ion beam shielding for electric field accelerating for ions soft focusing ions to detector correcting ion path in Xdirection correcting ion path in Y direction shielding for detector
packet in the TOF tube. A pair of X and Y steering plates is located in the TOF tube to fine tune the ion trajectories.
Data Acquisition System. A digital ion-counting data acquisition system (MCS multichannel scalar, EG&G, Oak Ridge, TN) is used with a 100-ns bin width (peak width 1-2 ps). A 486 personal computer (Los Altos PC Store, Los Altos, CA) is interfaced with the MCS to monitor and control the data-collecting system and store the averaged data files. The ion-counting system allows us to obtain TOF mass spectra with good signal-to-noise ratios because it eliminates unwanted noise counts by setting a counting threshold. It runs at a repetition rate of 10 kHz (limited by the flight time of the heaviest ion) and is triggered by a pulse-and-delay generator (SRS DG535, Stanford Research System Inc., Sunnyvale, CA).
Procedure. The capillary column is treated with 0.1 N aqueous NaOH solution for 5 min. After being rinsed with water for 3 min, the column is flushed with running buffer for 5 min. A sample mixture is injected into this column by use of a 5-1 0-s pressure injection and then electrophoretically separated for 10-30 min under a constant voltage of 30 kV. The separation current is approximately 2 pA. A UV detection window is placed on the capillary 20 cm downstream from the inlet (total length of 110 cm). The UV absorption detection monitors the separation at one-fifth of the total separation time and helps estimate the elution time of analytes at the outlet. Before the analytes reach the capillary outlet, only a
few peaks with low m/z are observed in the ESI-TOF mass spectrum, presumably produced from buffer solvent molecules. Once the analyte molecules reach the capillary outlet, numerous analyte ions are produced. The data acquisition system counts the number of ions that reach the detector and accumulates these counts for a fixed period of time (e.g., 1 s for 10 000 scans). Thedata acquisition and storage processes are controlled by a software package provided by EG&G. With this software, 4 s is required for data formatting and storage. Thus, spectra are automatically taken and stored in the computer in 5-s intervals (taking data for 1 s out of every 5 s is quite undesirable, but it is not inherently a problem with TOF). In this way, a two-dimensional plot of migration time versus analyte mass is obtained.
RESULTS AND DISCUSSION ESI-TOFMS. To demonstrate the performance of our ESI-
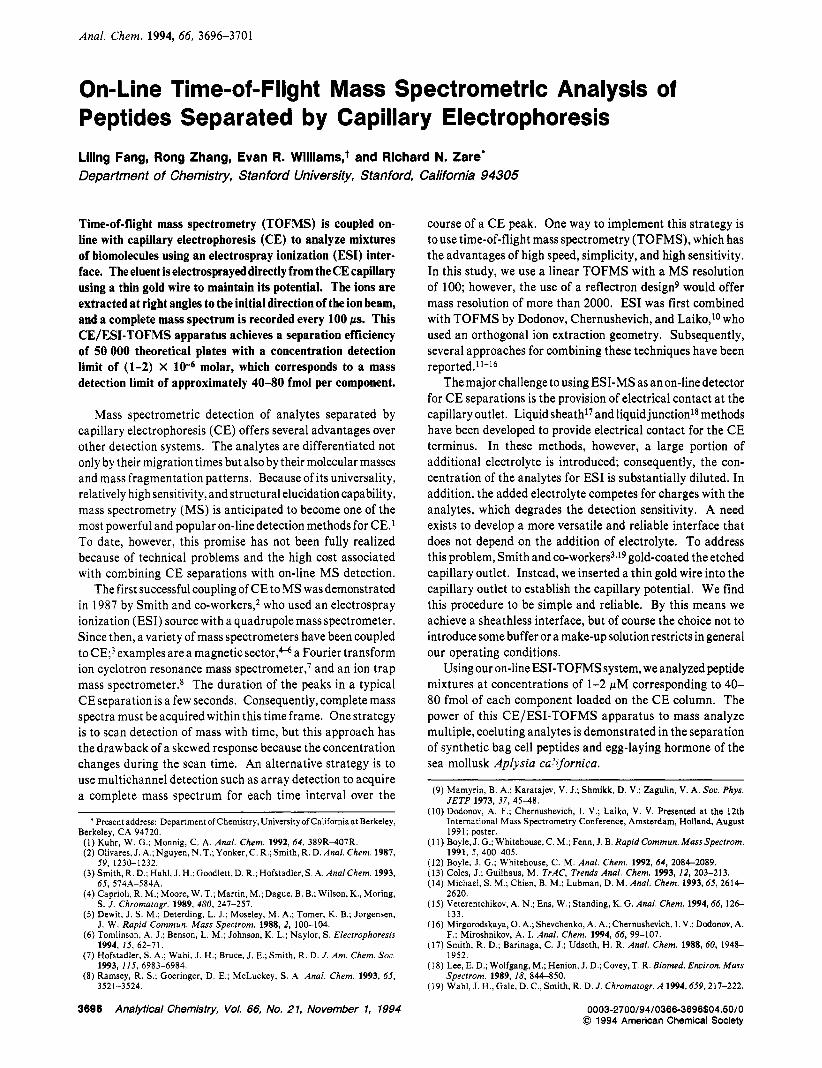
TOF mass spectrometer, we electrosprayed the single-strand 76-residue polypeptide ubiquitin first from a 5050 methanol/ water solution (Figure 4a) and then from the same solution plus 5% glacial acetic acid (Figure 4b). We chose ubiquitin because its ESI mass spectra have been reported previously.*2 In a 5050 methanol/water solution, ubiquitin is expected to
(20) Loo, J. A.; Loo. R. R. 0.; Udseth, H. R.; Edmonds, C. G.; Smith, R. D. Rupid
(21) Katta, V.; Chait, B. T. Rupid Commun. Muss Specfrom. 1991.5, 214-217. (22) Mirza, U. A.; Cohen, S. L.; Chait, B. T. Anal. Chem. 1993,63, Id.
Commun. Moss Specfrom. 3991.5, 101-105.
3698 Analytical Chemistry, Vol. 66, No. 21, November 1, 1994
v)
C 3 0
c
0
200 -
100 -
0 -
8+ I
(a) (b
1 0
c
I 9+ 7+ I 0 - -
1 o+ 6
v) I - 0
6+ 11+
200
100
0
(€+Hi+ (0+2H)2+ (571) C+ (560)
(3711
11'
500 -.
400 -
300 -
(b) ' 14+
m/z Flgure 4. ESI-TOF mass spectra of ubiqultin at a concentration of 20 mM (a) from a 5050 methanol/water solution and (b) from the same solution plus 5 % glacial acetic acid.
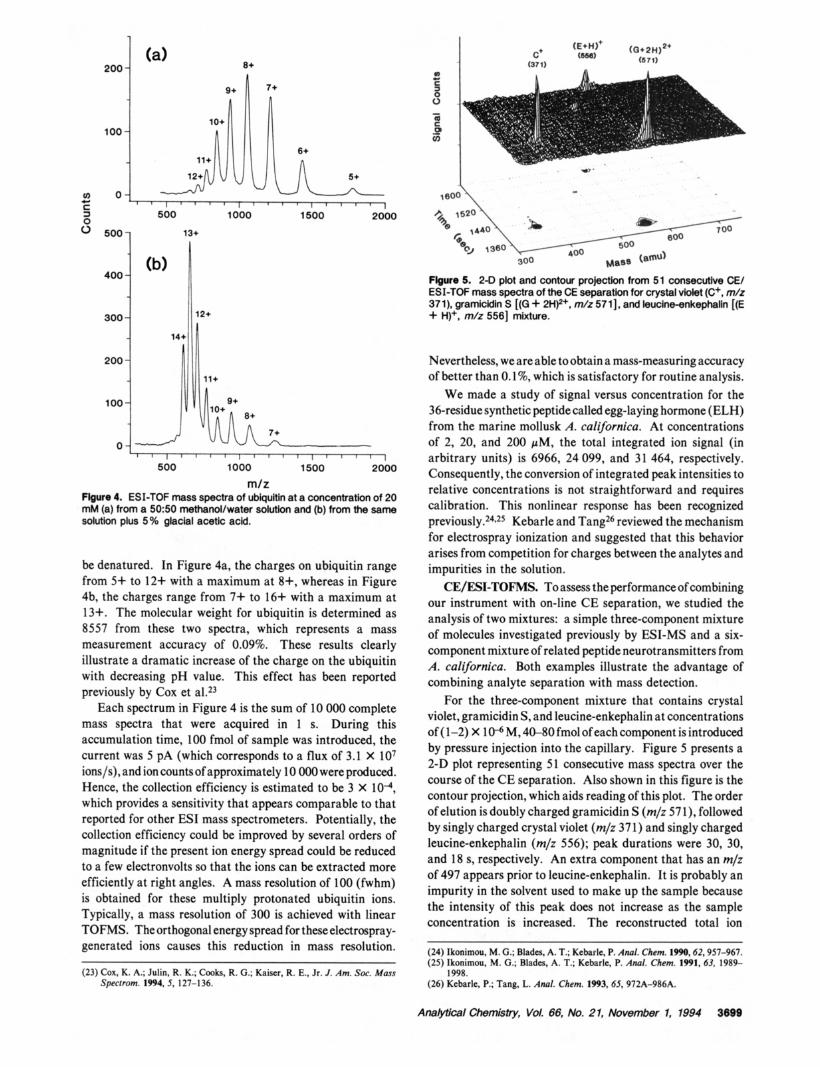
Flgure 5. 2-0 plot and contour projedon from 51 consecutive CE/ ESI-TOF mass spectra of the CE separation for crystal violet (C+, m/z 371), gramicidin S [(G -+ 2H)*+, m/z 5711, and leucine-enkephalln [(E -t H)+, m/z 5561 mixture. 12+
1
be denatured. In Figure 4a, the charges on ubiquitin range from 5+ to 12+ with a maximum at 8+, whereas in Figure 4b, the charges range from 7+ to 16+ with a maximum at 13+. The molecular weight for ubiquitin is determined as 8557 from these two spectra, which represents a mass measurement accuracy of 0.09%. These results clearly
Nevertheless, we are able to obtain a mass-measuring accuracy of better than 0.1 %, which is satisfactory for routine analysis.
We made a study of signal versus concentration for the lo+ 8+ 36-residue synthetic peptide called egg-laying hormone (ELH)
11+
9+
illustrate a dramatic increase of the charge on the ubiquitin with decreasing pH value. This effect has been reported previously by Cox et al.23
Each spectrum in Figure 4 is the sum of 10 000 complete mass spectra that were acquired in 1 s. During this accumulation time, 100 fmol of sample was introduced, the current was 5 pA (which corresponds to a flux of 3.1 X lo7 ions/s), and ion countsof approximately 10 000 were produced. Hence, the collection efficiency is estimated to be 3 X lo4, which provides a sensitivity that appears comparable to that reported for other ESI mass spectrometers. Potentially, the collection efficiency could be improved by several orders of magnitude if the present ion energy spread could be reduced to a few electronvolts so that the ions can be extracted more efficiently at right angles. A mass resolution of 100 (fwhm) is obtained for these multiply protonated ubiquitin ions. Typically, a mass resolution of 300 is achieved with linear TOFMS. The orthogonal energy spread for these electrospray-
from the marine mollusk A. californica. At concentrations
relative concentrations is not straightforward and requires calibration. This nonlinear response has been recognized p r e v i o u ~ l y . ~ ~ * ~ ~ Kebarle and Tang26 reviewed the mechanism for electrospray ionization and suggested that this behavior arises from competition for charges between the analytes and impurities in the solution.
CE/EsI-TOFMS. To assess the performance of combining our instrument with on-line CE separation, we studied the analysis of two mixtures: a simple three-component mixture of molecules investigated previously by ESI-MS and a six- component mixture of related peptide neurotransmitters from A. californica. Both examples illustrate the advantage of combining analyte separation with mass detection.
For the three-component mixture that contains crystal violet, gramicidin S, and leucine-enkephalin at concentrations of ( 1-2) X 1 V M, 40-80 fmol of each component is introduced by pressure injection into the capillary. Figure 5 presents a 2-D plot representing 51 consecutive mass spectra over the course of the CE separation. Also shown in this figure is the contour projection, which aids reading of this plot. The order of elution is doubly charged gramicidin S (m/z 571), followed by singly charged crystal violet (m/z 37 1) and singly charged leucine-enkephalin (m/z 556); peak durations were 30, 30, and 18 s, respectively. An extra component that has an m/z of 497 appears prior to leucine-enkephalin. It is probably an impurity in the solvent used to make up the sample because the intensity of this peak does not increase as the sample concentration is increased. The reconstructed total ion
7+
generated ions this reduction in (24) Ikonimou. M. G.; Blades, A. T.; Kebarle, P. AMf. Chem. 1990.62.957-967. (25) Ikonimou. M. G.: Blades. A. T.: Kebarle. P. Anof. Chem. 1991.63, 1989- . .
(23) Cox, K. A.; Julin, R. K.; Cooks, R. G.; Kaiser, R. E., Jr. J. Am. Sm. Mum 1998. Specrrom. 1994,5, 127-1 36. (26) Kebarle, P.; Tang, L. Awl. Chem. 1993.65.972A-986A.
Ana!ytlcal Chemistry, Vol. 66, No. 21, November 1, 1994 3699
1000 1
200 -
100 -
0
(G + 2H)2*
(G+ 2W2+, (E+ Na)*
I 1 I I
21 22 23 24 25 26 27 Time (min)
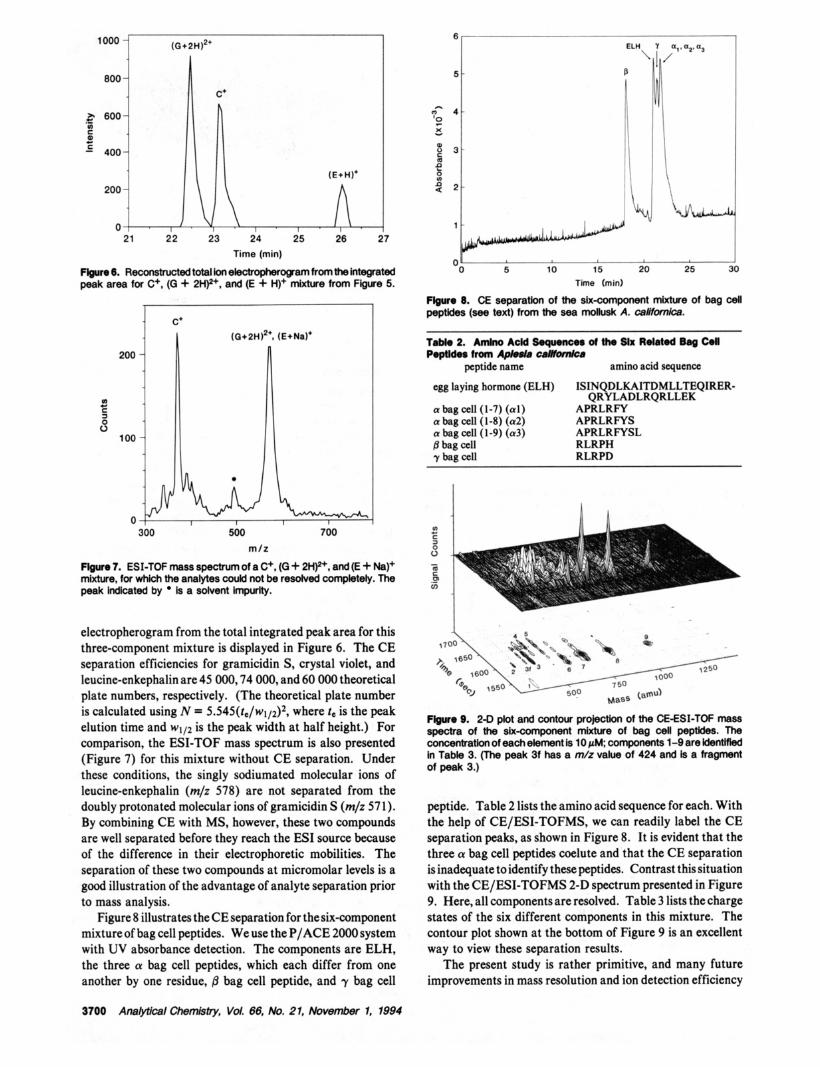
-6. Reconstructedtotaiionelectrapherogamfromthehrtegrated peak area for C+, (G + 2Hp, and (E 4- H)+ mixture from Figure 5.
(D
3 0 0
c
c. I
300 500 700
m l z
Ftgure 7. ESI-TOF mass spectrum of a C+, (G + 2H)2+, and (E + Na)+ mixture, for which the analytes could not be resolved completely. The peak indicated by is a solvent impurfty.
electropherogram from the total integrated peak area for this three-component mixture is displayed in Figure 6. The CE separation efficiencies for gramicidin S, crystal violet, and leucine-enkephalin are 45 000,74 000, and 60 000 theoretical plate numbers, respectively. (The theoretical plate number is calculated using N = 5.545(t&~1/2)~, where te is the peak elution time and w1/2 is the peak width at half height.) For comparison, the ESI-TOF mass spectrum is also presented (Figure 7) for this mixture without CE separation. Under these conditions, the singly sodiumated molecular ions of leucine-enkephalin (m/z 578) are not separated from the doubly protonated molecular ions of gramicidin S (m/z 571). By combining CE with MS, however, these two compounds are well separated before they reach the ESI source because of the difference in their electrophoretic mobilities. The separation of these two compounds at micromolar levels is a good illustration of the advantage of analyte separation prior to mass analysis.
Figure 8 illustrates the CE separation for thesix-component mixture of bag cell peptides. We use the P/ACE 2000 system with UV absorbance detection. The components are ELH, the three a bag cell peptides, which each differ from one another by one residue, /3 bag cell peptide, and y bag cell
0 5 10 15 20 25 30 Time (mid
8. CE Separation of the six-component mixture of bag cell peptides (see text) from the sea mollusk A. c8Mmica.
Table 2. A m h Add Sqwnces d the SIX Related Bag Cdl Peptides from Aplesla calllomlcs
peptide name amino acid sequence
egg laying hormone (ELH) ISINQDLKAITDMLLTEQIRER- QRYLADLRQRLLEK
a bag cell (1-7) (al) APRLRFY a bag cell (1-8) (a2) a bag cell (1-9) (a3) B bag cell RLRPH y bag cell RLRPD
APRLRFYS APRLRFYSL
I
FIgw 9. 2-0 plot and contow pro/ectron of the CE-ESI-TOF mass spectra of the six-component mixture of bag cell peptides. The concentration of each element is 10 pM; components 1-9 are identified in Table 3. (The peak 3f has a m/z value of 424 and is a fragment of peak 3.)
peptide. Table 2 lists the amino acid sequence for each. With the help of CE/ESI-TOFMS, we can readily label the CE separation peaks, as shown in Figure 8. It is evident that the three a bag cell peptides coelute and that the CE separation is inadequate to identify these peptides. Contrast this situation with the CE/ESI-TOFMS 2-D spectrum presented in Figure 9. Here, all components are resolved. Table 3 lists the charge states of the six different components in this mixture. The contour plot shown at the bottom of Figure 9 is an excellent way to view these separation results.
The present study is rather primitive, and many future improvements in mass resolution and ion detection efficiency
3700 Ana!yticalChemktry, Vol. 66, No. 21, November 1, 1994
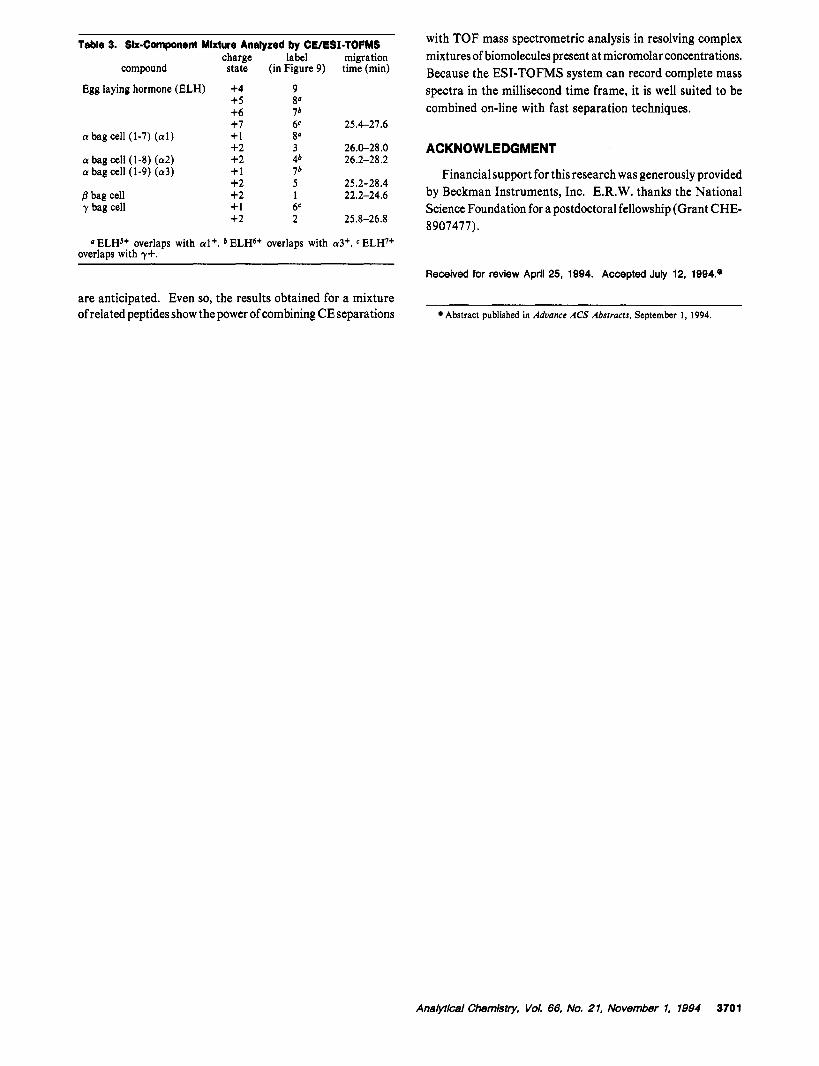
Table 3. Slx-Component Mldure Analyzed by CE/ESI-TOFMS charge label migration
compound state (in Figure 9) time (min)
Egg laying hormone (ELH) +4 9 +5 8" +6 76 +7 6e 25.4-27.6
a bag cell (1-7) (al) +1 8' +2 3 26.0-28.0
a bag cell (1-9) (a3) +1 76 a bag cell (1-8) (a2) +2 46 26.2-28.2
+2 5 25.2-28.4 j3 bag cell +2 1 22.2-24.6
+2 2 25.8-26.8 y bag cell +1 6e
a ELH5+ overlaps with al+. b ELH6+ overlaps with a3+. ELH7+ overlaps with y+.
are anticipated. Even so, the results obtained for a mixture of related peptides show the power of combining CE separations
with TOF mass spectrometric analysis in resolving complex mixtures of biomolecules present at micromolar concentrations. Because the ESI-TOFMS system can record complete mass spectra in the millisecond time frame, it is well suited to be combined on-line with fast separation techniques.
ACKNOWLEDGMENT
Financial support for this research was generously provided by Beckman Instruments, Inc. E.R.W. thanks the National Science Foundation for a postdoctoral fellowship (Grant CHE- 8907477).
Received for review April 25, 1994. Accepted July 12, 1994.'
Abstract published in Aduance ACS Abstracts, September 1 , 1994.
Analytical Chemlstry, Vol. 66, No. 21, November I , 1994 3701