on logical framework analysis (logframes in the …...on logical framework analysis (logframes in...
TRANSCRIPT

18/07/2013 1
Working Paper – Klaus Röder - Key Expert Data Quality
On Logical framework analysis (logframes in the context of the CSO – GIZ-IS Twining project )
Change log Who When (Version Name
in Time Stamp) What Comments
Version 0/ KR
08.05.2013 First Draft Introduction to the use of logframes in the project and 1. Example of project‘s logframe 2.Paragraph proposal on project’s logframe
Version 0.1/ KR
10.05.2013 Contents of LF for project : Afghanstat - CSO Twinning Project (2013 -2016) updated
Descriptions (page 14) added Modified structure of LF applied Contents for Goal, Outcome and Outputs added. Milestones, Indicators and Monitoring indicators for Output A,B,C, D input pending Comment on proposed changes in IR . Proposed Changes marked yellow
Version 0.2/ / KN and KR
12.05.2013 Contents of LF updated
Yellow change markers removed, changes applied , comments deleted Simplified structure of LF( Output A,B,C, D) applied Chapter 2.2. enhanced
Version 1.0 /KR
14.05.2013 completed Output-Section A corrected. Output-Sections B,C,D completed with detailed indicators; WB results frame with integrated LF added
Contents 1. From generic to a logframe for CSO – GIZ-IS Twining project ...................................... 2
1.1. The Logical Framework Approach .......................................................................... 2
1.2. An early template .................................................................................................... 2
1.3. WB generic approach includes (as principal difference) : M&E Supervision .......... 3
1.4. DFID Logframe Template (2009 revised format) .................................................... 4
1.5. DFID – Example of the REVISED LOGFRAME (December 2011) with high profile involvement of CSO .......................................................................................................... 6
2. The logframe proposal for the Afghanstat-CSO Twinning Project ................................ 16
2.1. Major difference between the two approaches DFID and WB: .............................. 16
2.2. Use of the Logframe: Afghanstat-CSO Twinning Project ...................................... 34
2.3. Integration of Logframe: Afghanstat-CSO Twinning Project into the WB-SRF logframe .......................................................................................................................... 35
18/07/2013 2
Working Paper – Klaus Röder - Key Expert Data Quality
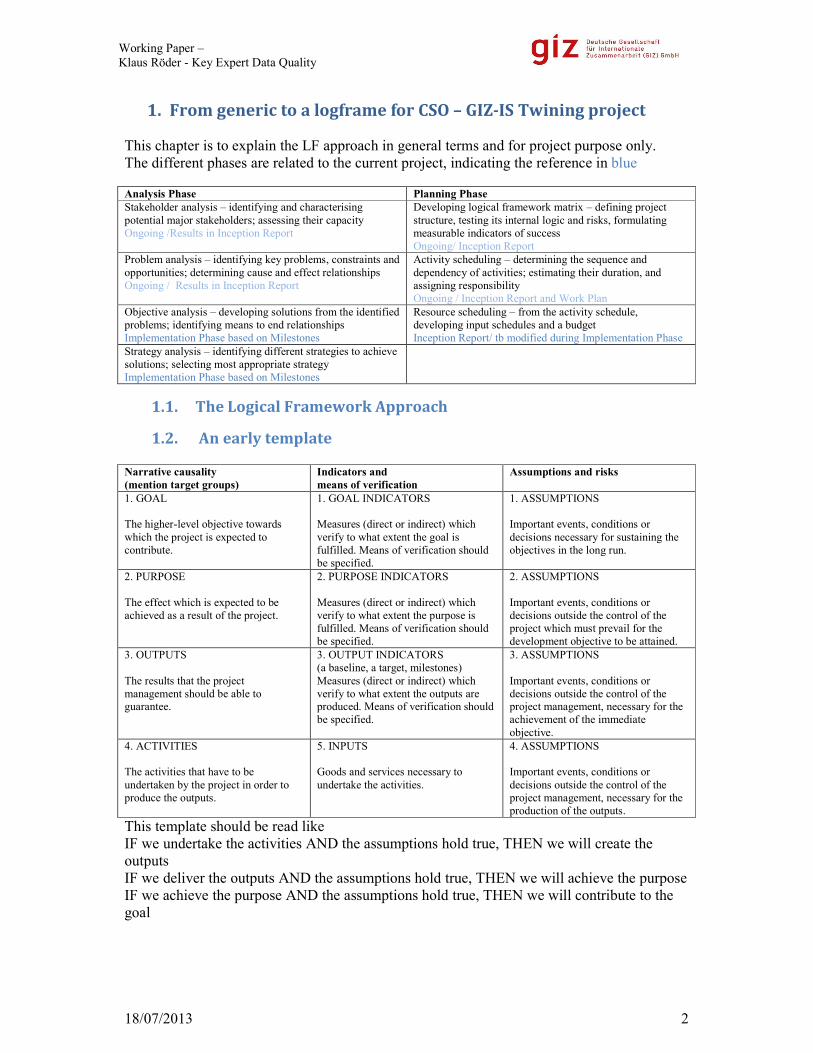
1. From generic to a logframe for CSO – GIZ-IS Twining project This chapter is to explain the LF approach in general terms and for project purpose only. The different phases are related to the current project, indicating the reference in blue
1.1. The Logical Framework Approach
1.2. An early template Narrative causality (mention target groups)
Indicators and means of verification
Assumptions and risks
1. GOAL The higher-level objective towards which the project is expected to contribute.
1. GOAL INDICATORS Measures (direct or indirect) which verify to what extent the goal is fulfilled. Means of verification should be specified.
1. ASSUMPTIONS Important events, conditions or decisions necessary for sustaining the objectives in the long run.
2. PURPOSE The effect which is expected to be achieved as a result of the project.
2. PURPOSE INDICATORS Measures (direct or indirect) which verify to what extent the purpose is fulfilled. Means of verification should be specified.
2. ASSUMPTIONS Important events, conditions or decisions outside the control of the project which must prevail for the development objective to be attained.
3. OUTPUTS The results that the project management should be able to guarantee.
3. OUTPUT INDICATORS (a baseline, a target, milestones) Measures (direct or indirect) which verify to what extent the outputs are produced. Means of verification should be specified.
3. ASSUMPTIONS Important events, conditions or decisions outside the control of the project management, necessary for the achievement of the immediate objective.
4. ACTIVITIES The activities that have to be undertaken by the project in order to produce the outputs.
5. INPUTS Goods and services necessary to undertake the activities.
4. ASSUMPTIONS Important events, conditions or decisions outside the control of the project management, necessary for the production of the outputs.
This template should be read like IF we undertake the activities AND the assumptions hold true, THEN we will create the outputs IF we deliver the outputs AND the assumptions hold true, THEN we will achieve the purpose IF we achieve the purpose AND the assumptions hold true, THEN we will contribute to the goal
Analysis Phase Planning Phase Stakeholder analysis – identifying and characterising potential major stakeholders; assessing their capacity Ongoing /Results in Inception Report
Developing logical framework matrix – defining project structure, testing its internal logic and risks, formulating measurable indicators of success Ongoing/ Inception Report
Problem analysis – identifying key problems, constraints and opportunities; determining cause and effect relationships Ongoing / Results in Inception Report
Activity scheduling – determining the sequence and dependency of activities; estimating their duration, and assigning responsibility Ongoing / Inception Report and Work Plan
Objective analysis – developing solutions from the identified problems; identifying means to end relationships Implementation Phase based on Milestones
Resource scheduling – from the activity schedule, developing input schedules and a budget Inception Report/ tb modified during Implementation Phase
Strategy analysis – identifying different strategies to achieve solutions; selecting most appropriate strategy Implementation Phase based on Milestones
18/07/2013 3
Working Paper – Klaus Röder - Key Expert Data Quality
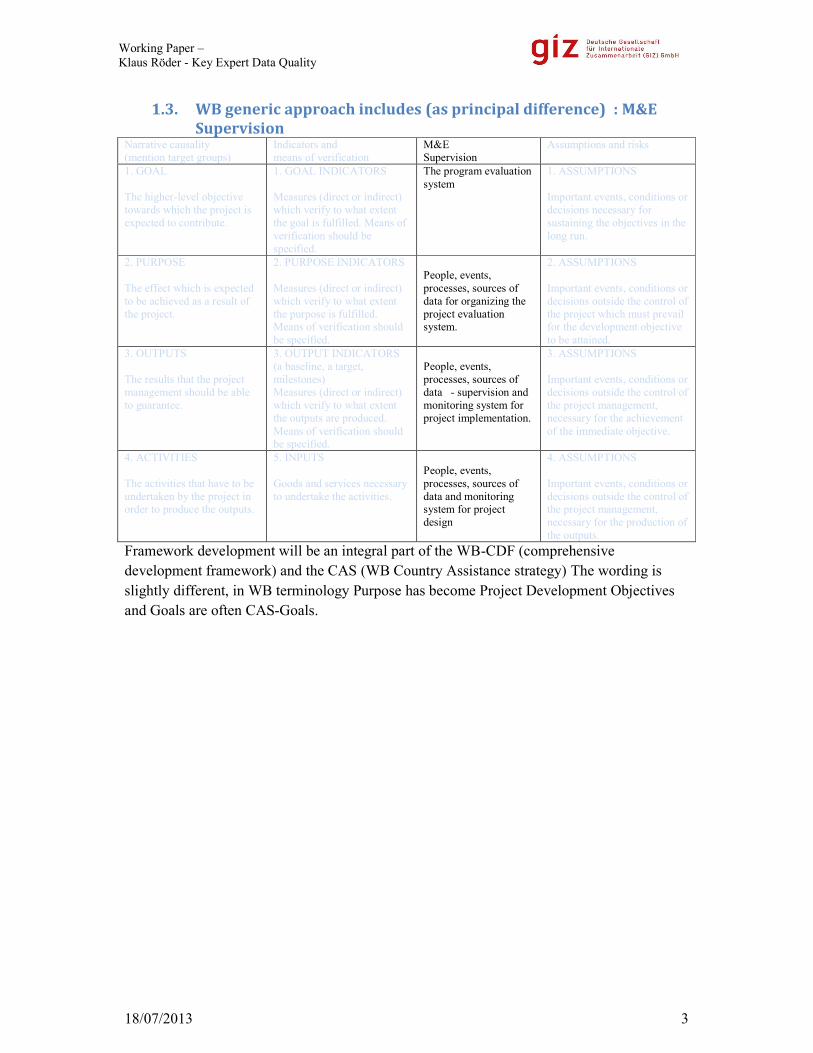
1.3. WB generic approach includes (as principal difference) : M&E Supervision
Narrative causality (mention target groups)
Indicators and means of verification
M&E Supervision
Assumptions and risks
1. GOAL The higher-level objective towards which the project is expected to contribute.
1. GOAL INDICATORS Measures (direct or indirect) which verify to what extent the goal is fulfilled. Means of verification should be specified.
The program evaluation system
1. ASSUMPTIONS Important events, conditions or decisions necessary for sustaining the objectives in the long run.
2. PURPOSE The effect which is expected to be achieved as a result of the project.
2. PURPOSE INDICATORS Measures (direct or indirect) which verify to what extent the purpose is fulfilled. Means of verification should be specified.
People, events, processes, sources of data for organizing the project evaluation system.
2. ASSUMPTIONS Important events, conditions or decisions outside the control of the project which must prevail for the development objective to be attained.
3. OUTPUTS The results that the project management should be able to guarantee.
3. OUTPUT INDICATORS (a baseline, a target, milestones) Measures (direct or indirect) which verify to what extent the outputs are produced. Means of verification should be specified.
People, events, processes, sources of data - supervision and monitoring system for project implementation.
3. ASSUMPTIONS Important events, conditions or decisions outside the control of the project management, necessary for the achievement of the immediate objective.
4. ACTIVITIES The activities that have to be undertaken by the project in order to produce the outputs.
5. INPUTS Goods and services necessary to undertake the activities.
People, events, processes, sources of data and monitoring system for project design
4. ASSUMPTIONS Important events, conditions or decisions outside the control of the project management, necessary for the production of the outputs.
Framework development will be an integral part of the WB-CDF (comprehensive development framework) and the CAS (WB Country Assistance strategy) The wording is slightly different, in WB terminology Purpose has become Project Development Objectives and Goals are often CAS-Goals.

18/07/2013 4
Working Paper – Klaus Röder - Key Expert Data Quality
1.4. DFID Logframe Template (2009 revised format) PROJECT TITLE
GOAL Indicator Baseline + year
Milestone 1
Milestone 2
Target + year
Source
Indicator Baseline + year
Milestone 1
Milestone 2
Target + year
Source
PURPOSE Indicator Baseline + year
Milestone 1
Milestone 2
Target + year
Assumptions
Source
Indicator Baseline + year
Milestone 1
Milestone 2
Target + year
Source
INPUTS (HR)
DFID (FTEs)
OUTPUT 1 Indicator Baseline + year
Milestone 1
Milestone 2
Target + year
Assumptions
Source
Impact Weighting
Indicator Baseline + year
Milestone 1
Milestone 2
Target + year
Source RISK RATING
INPUTS (HR)
DFID (FTEs)

18/07/2013 5
Working Paper – Klaus Röder - Key Expert Data Quality
OUTPUT 2++
Indicator Baseline + year
Milestone 1
Milestone 2
Target + year
Assumptions
Source
Impact Weighting
Indicator Baseline + year
Milestone 1
Milestone 2
Target + year
Source RISK RATING
INPUTS (HR)
DFID (FTEs)

18/07/2013 6
Working Paper – Klaus Röder - Key Expert Data Quality
1.5. DFID – Example of the REVISED LOGFRAME (December 2011) with high profile involvement of CSO In the new terminology, the Goals are now Impacts, Purpose has become Outcome
PROJECT TITLE ENHANCING THE INTERACTION AND INTERFACE BETWEEN CIVIL SOCIETY AND STATE TO IMPROVE POOR PEOPLE’S LIVES (ENCISS)
IMPACT Indicator I1 Baseline 2011 2012
Target 2013 Assumptions
To deliver sustainable peace, security and democracy through a capable and accountable governance system that responds to the needs of poor women, men, youth and children
Improvements in poor women, men, youth and children access to, use of and satisfaction with basic services
North Region = 3/5i South Region = 3/5 West Region = 2/5ii East Region = 2/5 UN Human Development Index Score 180/187
All ENCISS regions score 3/5 UN Human Development Index score 175 mark
• Citizenship continues to build up
• GoSL commitment to peaceful and constructive multi-stakeholders engagements and involvements.
• Political tolerance and stability • Sierra Leone continues to enjoy
peace and stability • GoSL commitment, and
openness to engage in consultations on national issues.
• GoSL continues to demonstrate its commitment to public accountability and transparency.
• Next Poverty Reduction Strategy retains focus on the poorest
Source ENCISS Baseline 2011 (Review 2013), Sierra Leone MDG Progress Report 2010, UN HDR Sierra Leone 2011, SL PRSP Progress Report 2011, Multi-dimensional Poverty Index (MPI) Country Report 2011 (uses data from 2008 however).
Indicator I2
Baseline 2011 2012
Target 2013
Poor women, men, youth and children perceive a reduction in community tension and disputes
ENCISS Regions = 3/5iii 58.4/100 overall Safety and Rule of Law Score (Ibrahim Index 2011) 14/53 Personal Safety Score (Ibrahim Index 2011) 17/53 National Security Score (Ibrahim Index 2011)
- 60/100 Safety and Rule of Law Score +5 point increase in personal safety and national security
All ENCISS regions score 4/5iv 67/100 Safety and Rule of Law Score +10 point increase in personal safety and national security
Source

18/07/2013 7
Working Paper – Klaus Röder - Key Expert Data Quality
Ibrahim Index (2011), SL PRSP Progress Report 2011, Sierra Leone MDG Progress Report 2010, ENCISS Baseline 2011 (and Review 2013) Justice Sector Coordination Office / Office for National Security 2011 Reports (yet to be completed)
Outcome Indicator O1 Baseline 2011 2012
Target 2013 Assumptions
To improve the quality of the lives of poor women, men, children and youth by enhancing their engagement with government so that resources are distributed in an equitable manner
Quality of governance in ENCISS supported CSOs (inclusiveness, responsiveness, transparency and capability).
Score 3/5v 3/5 4/5vi • Govt institutions across the board implement national policies and strategies.
• GoSL enforces performance contracts at national and local levels
• GoSL continues to demonstrate its willingness and commitment to principles of responsiveness and accountability to poor and marginalised people’s needs and concerns.
• Decentralisation continues to be used and viewed as a strategy for good governance, poverty reduction, peace and stability.
• GoSL commitment, and openness to engage on national issues
• CSOs are willing and have the capacity to engage on national issues
• Decentralised structures have the capacity and willingness to engage, respond and manage community needs, and expectations.
Source ENCISS Baseline 2011, ENCISS QPRs, ENCISS Final Evaluation 2013
Indicator O2 Baseline 2011 2012
Target 2013
Grantees and their constituents satisfaction with quality of governance in government (responsiveness, transparency, capability, accountability)1
Region N S E W Region N S E W Region N S E W
Responsiveness 2 3 3 2 Resp. - - - - Resp. 3 3 3 3
Transparency 2 2 2 3 Trans. - - - - Trans 3 3 3 3
Accountability 2 3 3 3 Acct. - - - - Acct 3 3 3 3
Capability 3 3 3 3 Cap. - - - - Cap 3 3 3 3
Source ENCISS Baseline, ENCISS QPRs, ENCISS Baseline review (2013), DFID Annual Review (2012) and ENCISS Final Evaluation (2013)
Indicator O3 Baseline 2011 2012 Target 2013 Passage of key legislation and / or policies which enhance the equitable distribution of resources2
Thematic practices being influenced through ENCISS policy monitoring, forums and grantee advocacy work: Gender = 15 Youth = 9 Elections = 9
50% of grantees policy advocacy / practice work in 2011 has contributed to passage of key legislation or changes in practice to enhance the equitable distribution of resources 2012 totals tbc
75% of all ENCISS grantee policy advocacy / practice work has contributed to passage of key legislation or changes in practice to enhance the equitable distribution of resources
1 This includes satisfaction with justice and redress, fair and free elections. 2 Focus on policy and practice changes

18/07/2013 8
Working Paper – Klaus Röder - Key Expert Data Quality
Decentralisation = 13 Justice and Security = 5 Others (Disability Act = 3, Freedom of Info Bill = 3)
Source ENCISS Grantee Applications 2011, 2012, 2013; ENCISS Policy Forum Reports, ENCISS QPRs, ENCISS Grantee documentation and ENCISS Final Evaluation (2013)
INPUTS (£) DFID (£) Govt (£) Other (£) (£1 = Euro 1.19)
Total (£) DFID SHARE (%)
4,500,000 4,453,782 8,953,782 50% INPUTS (HR) DFID (FTEs)
OUTPUT 1 Indicator 1.1
Baseline 2011 2012 Target 2013 Assumptions
Local levels of government are demonstrating increased democratic and responsive decision-making, targeting the needs of the most marginalised
Quality of dialogue sessions between citizens and state in ENCISS geographical areas3
Score 3/5vii in ENCISS supported districts
3/5 in ENCISS supported districts Score of 4/5viii. All grantees highlight good practice examples from across the Programme which illustrate dialogue sessions delivering towards the needs of marginalised in ENCISS geographical areas
• GoSL and district council willingness to open up, and engage in national consultations and dialogues.
• GoSL and district councils view and commits to use dialogue as a tool for information sharing and conflict resolutions.
• GoSL commitment to coordinate development efforts at local and national levels.
• GoSL and district council willingness and commitment to CSOs’ involvement in the implementation poverty reduction strategy
Source ENCISS Baseline; ENCISS Grantee QPRs, ENCISS regional monitoring reports, Local Governance and Decentralisation Study (early 2012), Grantee Policy Forum Reports on Decentralisation
Indicator 1.2 Baseline 2011 2012 Target 2013 ENCISS supported districts have WDCs that are actively engaged in and monitoring
Score 2/4ix Self Assessment Score tbc Score 3/4x
Source
3 ENCISS Geographical areas are four: North, South, East and West Region. Specifically - Bonthe District, Kenema District and Bo District

18/07/2013 9
Working Paper – Klaus Röder - Key Expert Data Quality
development in their communities for poor women, men, youth
ENCISS Baseline 2011, ENCISS Regional Monitoring Reports, Self Assessment Scores of WDCs (early 2012)
• Political stability. • The implementation of the
PRSP II tops the GoSL’ national agenda.
• District Budget Oversight Committees are able to get the relevant data from District Councils
• GoSL continues to support decentralisation and local councils
Indicator 1.3
Baseline 2011 2012 Target 2013
ENCISS district and municipal development plans are implemented in communities
100% of ENCISS supported district and municipal development plans focus on the needs and concerns of poor and marginalised groups
30% of ENCISS district and municipal development plans are achieving targets as laid out in their most recent development plan
50% of ENCISS district and municipal development plans are achieving targets as laid out in their most recent development plan
Source
ENCISS Baseline 2011, Grantee QPRs, ENCISS Regional Monitoring Reports of district, municipal implementation activities and progress of plans, Grantee Policy Forum Reports on Decentralisation
IMPACT WEIGHTING 25% RISK RATING
Medium INPUTS (£) DFID (£) Govt (£) Other (£) Total (£) DFID SHARE (%)
INPUTS (HR) DFID (FTEs)
OUTPUT 2
Indicator 2.1 Baseline 2011 2012 Target 2013 Assumptions
Poor women, men, youth and children are proactively participating in decision-making processes and monitoring the implementation of policies that affect their lives in
Grantees influence joint development processes with authorities on gender equality and women’s rights
No examples of change resulting from ENCISS grantee advocacy work as just beginning activities (Nov 2011)
60% of grantees focused on this theme demonstrate influential engagements with authorities on the issue of gender equality and women’s rights
70% of the total amount of grantees focused on this theme have tangible evidence of change in gender equality and women’s rights
• The Ministry of Local Government & Rural Development (MLGRD) continues to provide technical support to local councils
• The MLGRD willing to enforce guidelines for a participatory Source
18/07/2013 10
Working Paper – Klaus Röder - Key Expert Data Quality
ENCISS thematic areas4
Grantee Applications on Gender Equality and Women’s Rights, Grantee QPRs, ENCISS Case Studies, DFID Annual Review (2012), ENCISS Policy Forum Reports on Gender
local development planning and budgeting
• Citizens and CSOs willingness to hold their local authorities to account
• Local councils demonstrate capacity and openness to lead and facilitate a community driven development planning processes.
• District Councils have the capacity and willingness to transcend the politicization of local government dealings.
• Decentralized structures have the capacity and willingness to engage, respond and manage community expectations and needs.
• GoSL commitment to coordinate development efforts at local and national levels.
• GoSL willingness and commitment to CSOs’ involvement in the implementation of the PRS-II decentralisation process and the anti-corruption strategy.
• Political stability at district level.
• Central government budgetary responsiveness to district councils
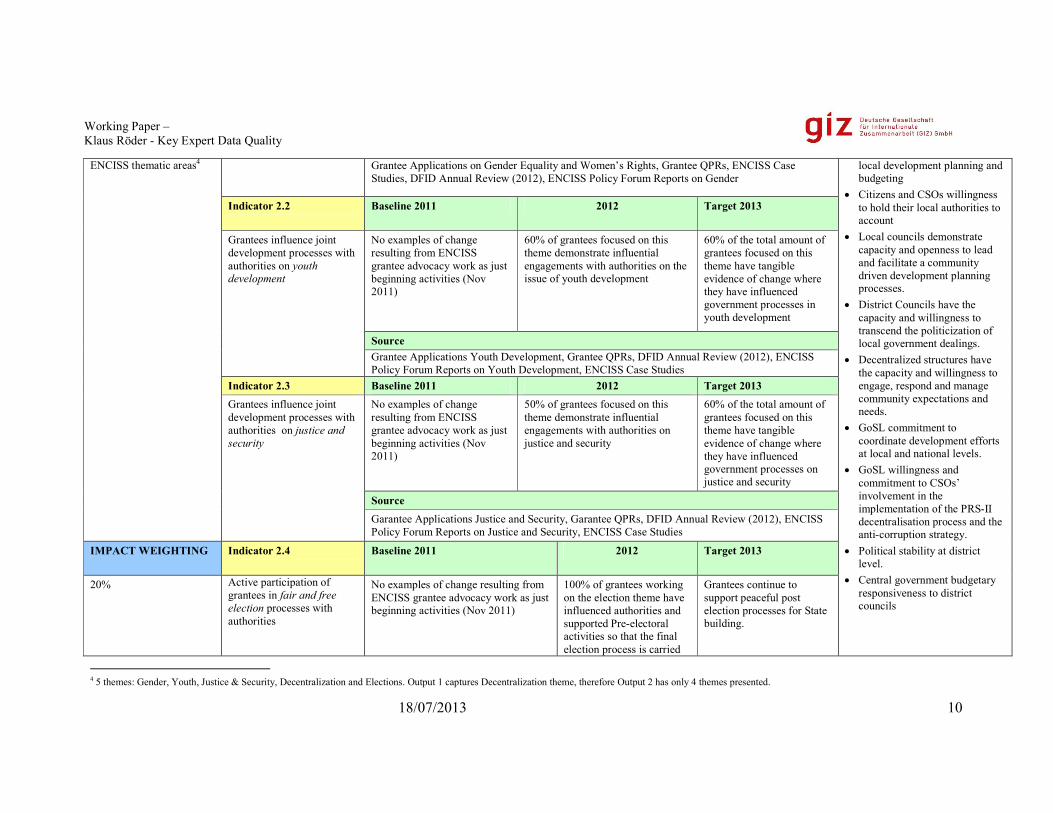
Indicator 2.2
Baseline 2011 2012 Target 2013
Grantees influence joint development processes with authorities on youth development
No examples of change resulting from ENCISS grantee advocacy work as just beginning activities (Nov 2011)
60% of grantees focused on this theme demonstrate influential engagements with authorities on the issue of youth development
60% of the total amount of grantees focused on this theme have tangible evidence of change where they have influenced government processes in youth development
Source Grantee Applications Youth Development, Grantee QPRs, DFID Annual Review (2012), ENCISS Policy Forum Reports on Youth Development, ENCISS Case Studies
Indicator 2.3 Baseline 2011 2012 Target 2013 Grantees influence joint development processes with authorities on justice and security
No examples of change resulting from ENCISS grantee advocacy work as just beginning activities (Nov 2011)
50% of grantees focused on this theme demonstrate influential engagements with authorities on justice and security
60% of the total amount of grantees focused on this theme have tangible evidence of change where they have influenced government processes on justice and security
Source Garantee Applications Justice and Security, Garantee QPRs, DFID Annual Review (2012), ENCISS Policy Forum Reports on Justice and Security, ENCISS Case Studies
IMPACT WEIGHTING Indicator 2.4
Baseline 2011 2012 Target 2013
20% Active participation of grantees in fair and free election processes with authorities
No examples of change resulting from ENCISS grantee advocacy work as just beginning activities (Nov 2011)
100% of grantees working on the election theme have influenced authorities and supported Pre-electoral activities so that the final election process is carried
Grantees continue to support peaceful post election processes for State building.
4 5 themes: Gender, Youth, Justice & Security, Decentralization and Elections. Output 1 captures Decentralization theme, therefore Output 2 has only 4 themes presented.
18/07/2013 11
Working Paper – Klaus Röder - Key Expert Data Quality
out successfully in a peaceful, fair and free way.
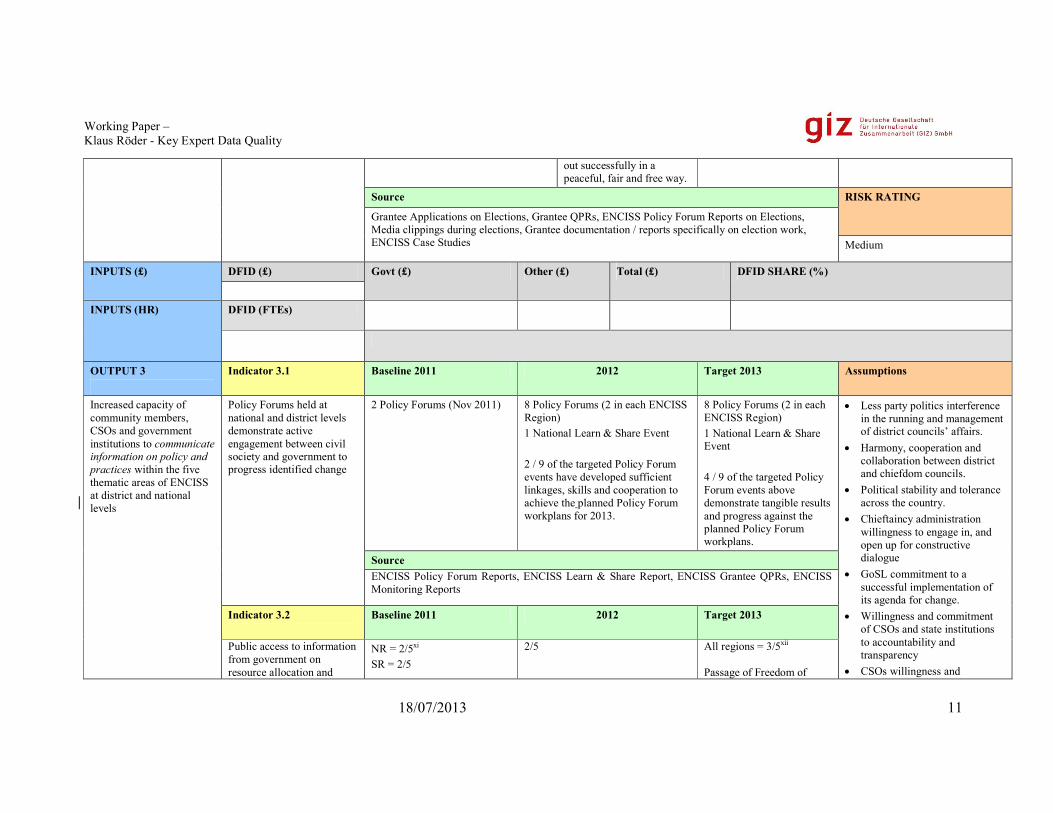
Source RISK RATING
Grantee Applications on Elections, Grantee QPRs, ENCISS Policy Forum Reports on Elections, Media clippings during elections, Grantee documentation / reports specifically on election work, ENCISS Case Studies Medium
INPUTS (£) DFID (£) Govt (£) Other (£) Total (£) DFID SHARE (%)
INPUTS (HR) DFID (FTEs)
OUTPUT 3
Indicator 3.1 Baseline 2011 2012 Target 2013 Assumptions
Increased capacity of community members, CSOs and government institutions to communicate information on policy and practices within the five thematic areas of ENCISS at district and national levels
Policy Forums held at national and district levels demonstrate active engagement between civil society and government to progress identified change
2 Policy Forums (Nov 2011)
8 Policy Forums (2 in each ENCISS Region) 1 National Learn & Share Event 2 / 9 of the targeted Policy Forum events have developed sufficient linkages, skills and cooperation to achieve the planned Policy Forum workplans for 2013.
8 Policy Forums (2 in each ENCISS Region) 1 National Learn & Share Event 4 / 9 of the targeted Policy Forum events above demonstrate tangible results and progress against the planned Policy Forum workplans.
• Less party politics interference in the running and management of district councils’ affairs.
• Harmony, cooperation and collaboration between district and chiefdom councils.
• Political stability and tolerance across the country.
• Chieftaincy administration willingness to engage in, and open up for constructive dialogue
• GoSL commitment to a successful implementation of its agenda for change.
• Willingness and commitment of CSOs and state institutions to accountability and transparency
• CSOs willingness and
Source ENCISS Policy Forum Reports, ENCISS Learn & Share Report, ENCISS Grantee QPRs, ENCISS Monitoring Reports
Indicator 3.2
Baseline 2011 2012 Target 2013
Public access to information from government on resource allocation and
NR = 2/5xi SR = 2/5
2/5
All regions = 3/5xii Passage of Freedom of

18/07/2013 12
Working Paper – Klaus Röder - Key Expert Data Quality
service delivery
ER = 2/5 WR = 3/5
Information Bill commitment to national growth and development. Source
ENCISS Regional Monitoring Reports, District Council bill boards and reports, MOFED published financial allocations, newspapers publication, Grantee QPR, ENCISS Baseline 2011 (and review 2013)
IMPACT WEIGHTING Indicator 3.3
Baseline 2011 2012 Target 2013
15%
Grantees working in the five thematic areas of ENCISS come together, share information and collaborate on their work
No examples of meetings held amongst grantees
50% of all ENCISS grantees hold meetings together beyond policy forums on ENCISS thematic areas
60% of all ENCISS grantees hold meetings together beyond policy forums on ENCISS thematic areas
Source RISK RATING Medium
ENCISS grant applications, ENCISS QPRs, ENCISS Policy Forum Reports, ENCISS Monitoring Reports, DFID Review 2012, 2013
INPUTS (£)
DFID (£) Govt (£) Other (£) Total (£) DFID Share (£)
INPUTS (HR) DFID (FTEs)
OUTPUT 4
Indicator 4.1
Baseline 2011 2012 Target 2013 Assumptions

18/07/2013 13
Working Paper – Klaus Röder - Key Expert Data Quality
Grantees demonstrating organisational and technical capability to fulfil their work plans and mandates
Assessment score of 13 technical areas: Score 1xiii = 7% Score 2xiv = 21% Score 3xv = 50% Score 4xvi = 22%
60% of grantees from 2011 score 3 / 4 Assessment score of 2012 Grantees
75% of all ENCISS grantees score 3 / 4
• Suitable and capable NGOs/CSOs with which to partner
• Interest and willingness of NGOs/CSOs to work in partnership with ENCISS
• Citizens acceptability of ENCISS value addition, role in Sierra Leone
• ENCISS grant-making operates efficiently and effectively with proper accountability
• Grant giving procedures enable small grants to be easily accessed and a change to grant success being its impact and not only compliance
• ENCISS does not overshadow activities but allows NGOs/CSOs to take the lead.
Increased capacity of grantees to influence and engage with government in ENCISS thematic areas
Source

18/07/2013 14
Working Paper – Klaus Röder - Key Expert Data Quality
ENCISS Baseline, Assessment Score Reviews, ENCISS Evaluation, ENCISS Training / Monitoring Reports
Indicator 4.2 Baseline 2012 Target 2013 Grants awarded to CSOs and Government working in citizen – government dialogue
16 strategic grants (funded till 2013) 14 project grants 15 micro grants (48 grants in total)
26 project grants 100 micro grants
16 strategic grants 40 project grants 130 micro grants (186 grants in total)
Source Grant applications awarded 2011, 2012, 2013
IMPACT WEIGHTING Indicator 4.3 Baseline 2011 2012 Target 2013 30% Grantees disseminate
effective and well documented evidence on policy issues and practices in the ENCISS thematic areas
No examples as beginning of activities for grantees.
50% of ENCISS grantees develop evidence on policy engagement practices in citizen – government dialogue
75% of ENCISS grantees develop evidence on policy engagement practices in citizen – government dialogue
Source Grant applications awarded 2011, ENCISS Thematic Policy Forum reports, DFID Annual Review (2012), Grantee QPRs, Grantee documentation (key publications).
RISK RATING High
INPUTS (£) DFID (£) Govt (£) Other (£) Total (£) DFID Share (£)

18/07/2013 15
Working Paper – Klaus Röder - Key Expert Data Quality
INPUTS (HR) DFID (FTEs)
i 3 = Generally satisfied as access to and use of basic services exists but needs improvement, to be built up and meet growing needs ii 2 = Little satisfaction as access to and use of basic services is very limited iii 3 = Notable positive changes in community tension and disputes. A reduction in disputes in community members daily lives but still a great amount of work to do in communities to maintain a peaceful and cooperative environment. iv 4 = Significant reduction in community tension and disputes. Communities are peaceful and few if any disputes occur. v 3 = CSOs are active in representing the marginalized and in empowering citizens but with limited change and results. Isolated cases of key social, economic and political concerns are finding a voice among citizens. CSOs work with their constituency in advocacy work and actively inform citizens vi 4 = CSOs are capable and active in representing the marginalized and empowering children, youth and women, with some success and examples of impact. CSOs are effective in taking up the key concerns of the population and have sustained relations with their constituency, which informs advocacy vii 3 - Some citizens feel their views and opinions are being heard, some can claim their rights and are able to hold government to account, but minimal change is taking place as a result of their efforts viii 4 = majority of citizens feel their views and opinions are being heard, they can claim their rights and that they are able to hold government to account, with some positive examples of change happening as a result. ix 2 = Some progress but still a great amount of work to do overall in engaging with communities and monitoring development of the communit y to meet the needs of poor women, men and youth x 3 = Achieving progress in community development initiatives with noticeable changes in WDC attitudes in engaging with and monitoring development in their communities xi 2 = CSOs have some access to information but government remains generally closed to sharing and making information accessible unless requested xii 3 - CSOs have some information from government and this is made available to the public by both CSO efforts and Government efforts xiii 1 = Little capacity xiv 2 = Basic level of capacity in place xv 3 = Moderate level of capacity in place xvi 4 = High level of capacity in place

18/07/2013 16
Working Paper – Klaus Röder - Key Expert Data Quality
2. The logframe proposal for the Afghanstat-CSO Twinning Project This chapter explains the project logframe and the integration into the results framework of the WB. We will use the new terminology: Impact, Outcome, and Output. Means of Verification has been renamed to ‘Source’. Inputs could be quantified in terms of funds (expressed in US$ for GIZ and all partners) and have been included for this LF for external sources but use of GIZ staff time (expressed as annual Full-Time Equivalents (FTEs) have been included. Assumptions are shown at Outcome and Output level only. Risks are shown at Activities level only, but also rated at Output level. At the Output level, the Impact Weighting is now shown in the logframe together with a Risk Rating for individual Outputs. Activities are shown separately (they do not normally appear in the logframe for approval), they are described in the Work plan and the various reports, Inception report to start with. Although they can be added to the logframe, it is more suitable to keep them in a separate logframe for project purposes. This avoids the blowing up of the logframe with reduced intelligibility and a duplication of the work plan. The logframe is an additional tool for project management. It does not replace the Work plan but indicates the logical impact chain of various layers of the project in a comprehensive way. Additional indications could be made for monitoring the indicators on various levels. Again this has been discarded to avoid overburdening the logframe. It is recommended to use the logframe at defined intervals (e.g. end of implementation phases) to describe the achievements of the project. The monitoring of the milestones and indicators will be defined by milestones’ definition and indicator assessment, which will be integral part of the Quality Assessment Framework. Some small design changes have been implemented for better readability: Impact and Risk have been moved to the lower right of each principal output section (A, B, C, D). FTEs have been replaced by customary unit of GIZ-IS (Man months / MM)
2.1. Major difference between the two approaches DFID and WB: WB: Top down – Policy oriented. The logframe is designed in view of the Country Strategy and its components are adapted to make the project contribution to the Goals visible. It is not as such a control mechanism but a visualisation of the project in the political context. DFID: Bottom up – Project oriented The DFID logframe is clearly a tool to visualize the monitoring of the project’s progress and (as the WB) to see the components of the project in the overall political context. It is more of a living monitoring framework to be extended to the subsequent years of project progress. As such it has more benefit for the project administration and will be used as such in the context. There is no disadvantage to use a DFID style logframe in the WB CAS context, even if different components of the WB country assistance will use another style of logframe. A synergy of both The present logframe is closely referenced to the Monitoring and Evaluation Arrangements of the Catalytic Fund Statistics for Results Facility (SRF-CF) The result chain should be transparent with the given logframe, Monitoring results are not given in figures but targets are indicated. A separate Monitoring framework in a detailed version of the LF will describe and indicator targets for specific milestones.

18/07/2013 17
Working Paper – Klaus Röder - Key Expert Data Quality
PROJECT TITLE
Afghanstat - CSO Twinning Project (2013 -2016) Improving the quality of the SSA by process management consulting in CSO by GIZ-International Services
IMPACT Indicator Baseline 2013 Milestone 1
(Implement. Phase I)
Milestone 2 (Implement. Phase II)
Target 2016 (Implement. Phase III + Finalisation)
CSO and statistical information impacts used for political decision making
Statistical information is used
Source
WB Country Assistance Strategy
Indicator Baseline 2013 Milestone 1 (Implement. Phase I)
Milestone 2 (Implement. Phase II)
Target 2016 (Implement. Phase III + Finalisation)
Visibility and reliability of the SSA for the Afghan and the foreign public
Newspaper, media and press assessment
Source
Afghanistan National Statistical Plan 2010
OUTCOME Indicator Baseline 2013 Milestone 1
(Implement. Phase I)
Milestone 2 (Implement. Phase II)
Target 2016 (Implement. Phase III + Finalisation)
Assumptions
The Statistical System of Afghanistan is working efficiently according to international standards and Statistical
Statistical system aligned with international Fundamental Principles of Official Statistics
Baseline: Inception Report statistical capacity building indicator proposed by project (A
Review of indicator achievement of Statistical system SCBI (+10%)
Review of indicator achievement of Statistical system SCBI t (+30%)
Review of indicator achievement of Statistical system SCBI (+50%)
CSO and Line Ministries cooperate on essential organizational issues Economic stability and
18/07/2013 18
Working Paper – Klaus Röder - Key Expert Data Quality
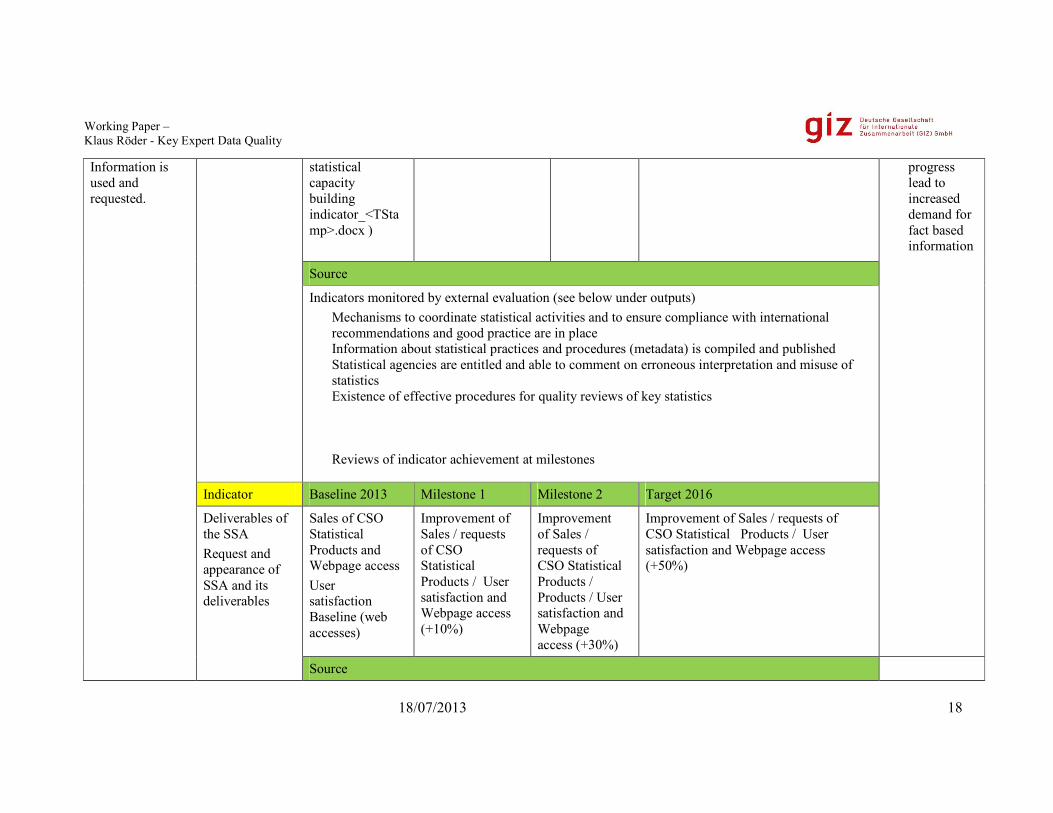
Information is used and requested.
statistical capacity building indicator_<TStamp>.docx )
progress lead to increased demand for fact based information
Source
Indicators monitored by external evaluation (see below under outputs) Mechanisms to coordinate statistical activities and to ensure compliance with international recommendations and good practice are in place Information about statistical practices and procedures (metadata) is compiled and published Statistical agencies are entitled and able to comment on erroneous interpretation and misuse of statistics Existence of effective procedures for quality reviews of key statistics
Reviews of indicator achievement at milestones
Indicator Baseline 2013 Milestone 1 Milestone 2 Target 2016
Deliverables of the SSA Request and appearance of SSA and its deliverables
Sales of CSO Statistical Products and Webpage access User satisfaction Baseline (web accesses)
Improvement of Sales / requests of CSO Statistical Products / User satisfaction and Webpage access (+10%)
Improvement of Sales / requests of CSO Statistical Products / Products / User satisfaction and Webpage access (+30%)
Improvement of Sales / requests of CSO Statistical Products / User satisfaction and Webpage access (+50%)
Source

18/07/2013 19
Working Paper – Klaus Röder - Key Expert Data Quality
Indicators monitored by: Sales and requests of CSO Statistical Handbook Demand for CSO Products and Webpage access / User-Producer survey External evaluation (see below under outputs)
INPUTS (US$) GIZ (US$) Govt (US$) Other (US$) Total (US$) GIZ Share (%)
INPUTS (HR) GIZ (MM)
187.0
OUTPUT A: CSO Institution developed as the principal provider of Statistical information in Afghanistan
Output A1 /A.2 Dissemination policy in and User-Producer Dialogue in improved
Indicators A.2
Baseline 2013 ( Inception Phase )
Milestone 1 (Implement. Phase I)
Milestone 2 (Implement. Phase II)
Milestone 3 (Implement. Phase III)
Target 2016 /Finalization Phase
Assumptions
User satisfaction Media visibility / Publications and Web appearance of CSO: No of requests of statistical
Draft dissemination strategy and User-Produce Dialogue analyzed Baseline information available
Needs assessed, reports on milestones delivered (A1, A7) No of requests of statistical products and media increased by 10%
Revised Statistical Yearbook (A3, A4, A5, A6) No of requests of statistical products (Statistical Yearbook) and
(A2) No of requests of statistical products (Statistical Yearbook) and media increased by 50%
User satisfaction assessed, and improved Media visibility / Publications and Web appearance Review of indicator achievement of Statistical system
Increase of web based publication against print media Gain of importance of civil society with need for statistical

18/07/2013 20
Working Paper – Klaus Röder - Key Expert Data Quality
products and media
media increased by 30%
SCBI (+50%) information Revival of the News, Information and Print Sector
Source Baseline / Indicators monitored by: (-> information on media clippings , Number of publications, Number of press release to be collected) Inception Report; ANSP: Metadata in CSO not apt to international standard. CPI publications are published t+40 from t = data collection Afghan Info is not workable Public perception of the quality of CSO’s products: User satisfaction survey. Scrutiny of media clippings or other media reactions./ Afghan Info is workable / CPI publications are published t+15
Output A3 Organisational Structure
Indicators A.3
Baseline 2013 ( Inception Phase )
Milestone 1 (Implement. Phase I)
Milestone 2 (Implement. Phase II)
Milestone 3 (Implement. Phase III)
Target 2016 /Finalization Phase
Assumptions
Training assessment and training strategy. Organisation structure of CSO / Institutional Framework
Baseline information provided by Statistical capacity building indicator proposed by project: Training impact measured by output C4.5.6. of SCBI
Structure reports drafted Framework ( Remuneration / grading system) drafted (A14, A12) C4.5.6. of SCB
Structure reports approved and implementation started (A9, A10, A13) C4.5.6. of SCB improve by 30%
New ANSP released (A8) C4.5.6. of SCB improve by 50%
Structure reports approved and implemented Institutional Framework in place Final assessment: output C4.5.6 of
Update of ANSP is reconciled with reorganisation of Organisation structure Training

18/07/2013 21
Working Paper – Klaus Röder - Key Expert Data Quality
New ANSP Training effectiveness assed by SCBI. Training impact measured by output C4.5.6. of SCBI
improve by 10%. SCBI becomes integral part of institution building Training is subject and sector (department) related
Source
Baseline / Indicators monitored by: Inception Report ANSP: Training assessment and training strategy drafted, approved and published. Organisation structure and Institutional Framework of CSO drafted, approved and published New and improved version of ANSP released Staff performance improvement measured by performance assessments / production of statistics deliverables
Output A4 Human Resource Structure
Indicators A.4
Baseline 2013 ( Inception Phase )
Milestone 1 (Implement. Phase I)
Milestone 2 (Implement. Phase II)
Milestone 3 (Implement. Phase III)
Target 2016 /Finalization Phase
Assumptions
HR strategy and HR Handbook. Advanced training offers and facilities Impact measured by output C2. of SCBI
Baseline information available (see below) No HR information system available.
Structure of HR information system approved (A15, A17, A18) Impact measured by output C2. of SCBI improve by 10%
Revision of HR information system. Impact measured by output C2. of SCBI improve by 30%
Revision of HR information system Impact measured by output C2. of SCBI improve by 50%
HR information system tested and implemented Final assessment: output C2. of SCBI
HR Structure is based on participatory ideas Training is believed to be integral part of HR capacity development
Source
Baseline / Indicators monitored by: Inception Report Statistical Law

18/07/2013 22
Working Paper – Klaus Röder - Key Expert Data Quality
ANSP Impact measured by output C2. of SCBI HR strategy and HR Handbook updated, reviewed, approved and released in a Personnel database. Personnel database in place and accessible to management and staff members / assessment of use of HR database Advanced training offers and facilities updated, reviewed, approved, released and transparent to staff (integrated into Personnel database ) Staff performance improved measured by performance assessments and staff satisfaction survey
Output A5 Enhance Skills
Indicators A.5
Baseline 2013 ( Inception Phase )
Milestone 1 (Implement. Phase I)
Milestone 2 (Implement. Phase II)
Milestone 3 (Implement. Phase III)
Target 2016 /Finalization Phase
Assumptions
Training strategy and Post training assessments HR database Training certificates First orientation course for new staff As A.3
Baseline information available (see below) As A.3 and Number of CSO staff with educational attainment of bachelor
Structure of HR training system approved (A19, A20, A23) As A.3 and Number of CSO staff with educational attainment of bachelor +10%
As A.3 and Number of CSO staff with educational attainment of bachelor +30%
New orientation trainig course (A22) As A.3 and Number of CSO staff with educational attainment of bachelor +50%
Structure of HR training system approved and implemented Final assessment: output C4.5.6. of SCBI
Skills are enhanced according to capability of staff Skills are enhanced according to necessity of sector (department)
Source
Baseline / Indicators monitored by: Inception Report Training Guide,

18/07/2013 23
Working Paper – Klaus Röder - Key Expert Data Quality
No of training, trainees and staff members in external trainings As A.3 and Quality of training assessments / Training strategy / Training certificates Number of CSO staff with educational attainment of bachelor
Output A6 Statistical Infrastructure
Indicators A.6
Baseline 2013 ( Inception Phase )
Milestone 1 (Implement. Phase I)
Milestone 2 (Implement. Phase II)
Milestone 3 (Implement. Phase III)
Target 2016 /Finalization Phase
Assumptions
Classifications and standards of CSO Business and Enterprise Registry Impact measured by output C3. of SCBI
Baseline information available (see below) No Business and Enterprise Registry / CSO standards declaration available.
Classifications and standards of CSO approved (A24) Impact measured by output C3. of SCBI improve by 10%
Impact measured by output C3. of SCBI improve by 30%
Business and Enterprise Registry approved (A26) and Impact measured by output C3. of SCBI improve by 50%
Classifications and standards of CSO / Business and Enterprise Registry implemented Final assessment: output C3. of SCBI
CSO adheres to international standards Selection of Registries and Data Storage systems are selected for the benefit of CSO and the public
Source
Baseline / Indicators monitored by: Inception Report Impact measured by output C3. of SCBI and Classifications and standards of CSO updated and defined, approved and implemented Business and Enterprise Registry defined, approved and implemented
INPUTS (US$)
GIZ (US$) Govt (US$) Other (US$) Total (US$) GIZ Share (%)

18/07/2013 24
Working Paper – Klaus Röder - Key Expert Data Quality
INPUTS (HR)
GIZ (Months) Impact and Risk
Impact Weighting Risk Rating
80.5 40% Medium
OUTPUT COMPONENT B: Data Collection and Analysis
Output B1 Data Quality Assurance CSO produces high and reliable quality information
Indicators B1 Baseline 2013 ( Inception Phase )
Milestone 1 (Implement. Phase I)
Milestone 2 (Implement. Phase II)
Milestone 3 (Implement. Phase III)
Target 2016 /Finalization Phase
Assumptions
Use of Metadata in SSA Progress of Quality Framework Impact measured by output C 4. 5. of SCBI
Status as in Inception Report and Impact measured by output C 4. 5. of SCBI
Number of data with proper metadata for CSO data Quality Framework (10%) and Impact measured by output C 4. 5.. of SCBI Improved by 10%
Number of data with proper metadata for SSA (+30%) Quality Framework (30%) and Impact measured by output C 4. 5. of SCBI Improved by 30%
Number of data with proper metadata for SSA (+60%) Quality Framework (60%) and Impact measured by output C 4. 5. of SCBI Improved by 60%
Number of data with proper metadata for SSA (100%) Quality Framework in place (100%) Final assessment: output C 4. 5. of SCBI
Data Quality Assurance framework is actively supported by CSO and Line Ministries. Metadata concept reconciled with Methodology of Line Ministries
Source
Baseline / Indicators monitored by: Inception Report ANSP Number of data with proper metadata,(of data collection and of freedom of political interference) / these indicators will have to be weighed, priority for CSO produced data (1.phase);Other data producers

18/07/2013 25
Working Paper – Klaus Röder - Key Expert Data Quality
(2.phase), reconciled Data (Target) Output B2 Routine Household Surveys HHH survey are conducted by CSO
Indicators B2 Baseline 2013 ( Inception Phase )
Milestone 1 (Implement. Phase I)
Milestone 2 (Implement. Phase II)
Milestone 3 (Implement. Phase III)
Target 2016 /Finalization Phase
Assumptions
2 HH Surveys (NRVA) are done by CSO
HH Survey (NRVA) is done externally
Progress indicator (1.phase 10%).
Progress indicator (1.phase 30%).
Progress indicator (+60%) Quality Framework (60%)
2 HH Surveys (NRVA) done by CSO Progress indicator (100%)
Finances for HH survey are allocated for the CSO. Staff capacity building responds to HH survey demands* (*here outputs are dependent from one another)
Source Baseline / Indicators monitored by: Inception Report ANSP Measure of advance on household survey / no index possible but progress indicator (1.phase 30%, 2.phase 60%, Target 100%)
Output B3 Establishment Surveys conducted by CSO
Indicators B3 Baseline 2013 ( Inception Phase )
Milestone 1 (Implement. Phase I)
Milestone 2 (Implement. Phase II)
Milestone 3 (Implement. Phase III)
Target 2016 /Finalization Phase
Assumptions
Business register is produced by CSO IBES is done by CSO Measured by
No Business register is produced by CSO No IBES is done by CSO
Business register is produced by CSO Measured by delivery
1.IBES is done by CSO Measured by delivery
2.IBES is done by CSO Measured by delivery
Business register is produced and IBES is done by CSO Progress indicator (100%)
Finances for Business register and IBES survey are allocated for the CSO. Staff capacity Source

18/07/2013 26
Working Paper – Klaus Röder - Key Expert Data Quality
delivery Baseline / Indicators monitored by: Inception Report Assessment of No of surveys / No of users of establishment surveys
building responds to demands*
Output B4 National Accounts System is produced according s to international standards by CSO
Indicators B4 Baseline 2013 ( Inception Phase )
Milestone 1 (Implement. Phase I)
Milestone 2 (Implement. Phase II)
Milestone 3 (Implement. Phase III)
Target 2016 /Finalization Phase
Assumptions
National Accounts System is revised according s to international standards and SNA are produced regularly Measured by delivery and impact measured by output C 5. 6. of SCBI
SNA as in Inception Report and Impact measured by output C 5. 6. of SCBI
Progress indicator SNA (1.phase 10%). Impact measured by output C 5. 6. of SCBI improved by 10%
Progress indicator SNA (1.phase 30%). Impact measured by output C 5. 6.. of SCBI Improved by 30%
Progress indicator SNA (+60%) Quarterly accounts started Impact measured by output C 5. 6.. of SCBI Improved by 60%
Progress indicator SNA (+100%) Quarterly accounts produced Final assessment: output C 5. 6. of SCBI
Products of SSA for National Accounts are robust and deliver reliable and timely data*
Source Baseline / Indicators monitored by: Inception Report
Progress indicator (1.phase 30%, 2.phase 60%, Target 100%) National Account that are developed
Output B5 Price Statistics is
Indicators B5 Baseline 2013 ( Inception Phase )
Milestone 1 (Implement. Phase I)
Milestone 2 (Implement. Phase II)
Milestone 3 (Implement. Phase III)
Target 2016 /Finalization Phase
Assumptions

18/07/2013 27
Working Paper – Klaus Röder - Key Expert Data Quality
produced according s to international standards by CSO timely and based country wide information
Price Statistics is produced by CSO timely and based country wide information and Impact measured by output C 5. 6. of SCBI
Status of Price Statistics as in Inception Report and Impact measured by output C 5. 6. of SCBI Number of provinces in which price data are collected = 6
Number of provinces in which price data are collected = 8 Timeliness of CPI production (t+30 of days). Impact measured by output C 5. 6. of SCBI improved by 10%
Number of provinces in which price data are collected = 15 Timeliness of CPI production (t+25 of days), Impact measured by output C 5. 6. of SCBI improved by 30%
Number of provinces in which price data are collected = 29 Timeliness of CPI production (t+20 of days), Impact measured by output C 5. 6.. of SCBI improved by 60%
Number of provinces in which price data are collected = 34 Timeliness of CPI production (t+15 of days), Final assessment: output C 5. 6. of SCBI
Project component C2 delivers efficient ICT environment for data sharing
Source Baseline / Indicators monitored by: Inception Report
Impact measured by output C 5. 6. of SCBI
Number of provinces in which price data are collected and included in the national CPI estimate / Timeliness of CPI production (t+No of days), Target t+15days
INPUTS (HR) Expert months Impact and Risk
Impact Weighting
Risk Rating
64.0 30% Medium OUTPUT COMPONENT C: Administrative Data Systems:
Output C1 Indicators C1 Baseline 2013 Milestone 1 Milestone 2 Milestone 3 Target 2016 Assumptions
18/07/2013 28
Working Paper – Klaus Röder - Key Expert Data Quality
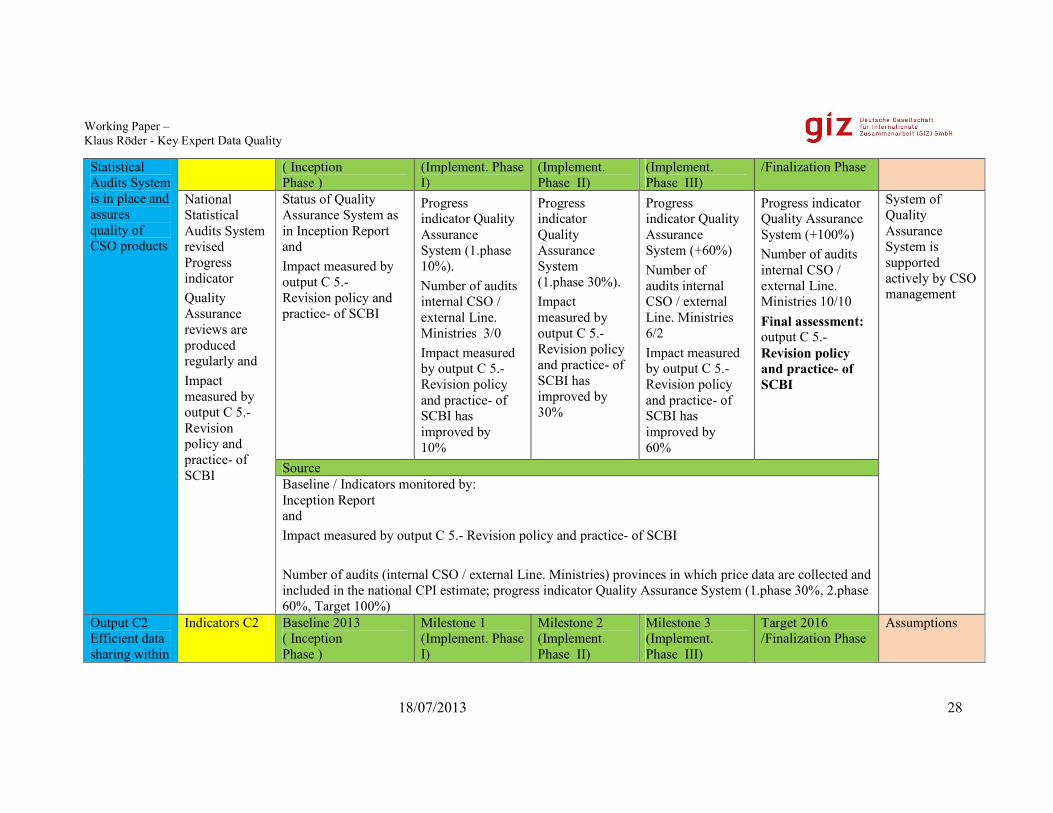
Statistical Audits System is in place and assures quality of CSO products
( Inception Phase )
(Implement. Phase I)
(Implement. Phase II)
(Implement. Phase III)
/Finalization Phase
National Statistical Audits System revised Progress indicator Quality Assurance reviews are produced regularly and Impact measured by output C 5.- Revision policy and practice- of SCBI
Status of Quality Assurance System as in Inception Report and Impact measured by output C 5.- Revision policy and practice- of SCBI
Progress indicator Quality Assurance System (1.phase 10%). Number of audits internal CSO / external Line. Ministries 3/0 Impact measured by output C 5.- Revision policy and practice- of SCBI has improved by 10%
Progress indicator Quality Assurance System (1.phase 30%). Impact measured by output C 5.- Revision policy and practice- of SCBI has improved by 30%
Progress indicator Quality Assurance System (+60%) Number of audits internal CSO / external Line. Ministries 6/2 Impact measured by output C 5.- Revision policy and practice- of SCBI has improved by 60%
Progress indicator Quality Assurance System (+100%) Number of audits internal CSO / external Line. Ministries 10/10 Final assessment: output C 5.- Revision policy and practice- of SCBI
System of Quality Assurance System is supported actively by CSO management
Source Baseline / Indicators monitored by: Inception Report and Impact measured by output C 5.- Revision policy and practice- of SCBI Number of audits (internal CSO / external Line. Ministries) provinces in which price data are collected and included in the national CPI estimate; progress indicator Quality Assurance System (1.phase 30%, 2.phase 60%, Target 100%)
Output C2 Efficient data sharing within
Indicators C2 Baseline 2013 ( Inception Phase )
Milestone 1 (Implement. Phase I)
Milestone 2 (Implement. Phase II)
Milestone 3 (Implement. Phase III)
Target 2016 /Finalization Phase
Assumptions

18/07/2013 29
Working Paper – Klaus Röder - Key Expert Data Quality
the SSA Data are shared within the SSA Efficiently and Impact measured by output C 6. of SCBI
Status of Data Sharing as in Inception Report and Impact measured by output C 6. of SCBI
Progress indicator Data Sharing (1.phase 10%). Impact measured by output C 6.of SCBI has improved by 10%
Progress indicator Data Sharing (1.phase 30%) 30% of publications of CSO are based on shared data Impact measured by output C 6.of SCBI has improved by 30%
Progress indicator Data Sharing (2.phase 50%) 50% of publications of CSO are. based on shared data Impact measured by output C 6.of SCBI has improved by 50%
Progress indicator Data Sharing (3.phase 100%) At least 50% of CSO data are shared internationally Final assessment: output C 6. of SCBI
Security Situation allows access to major population centres. PSO are connected to CSO to transfer PCI data*
Source Baseline / Indicators monitored by: Inception Report More efficient data sharing within the SSA / Index based on Users / Produces dialogue / satisfaction (to be developed by Key Expert for Users / Produces dialogue)
INPUTS (US$)
GIZ (US$) Govt (US$) Other (US$) Total (US$) GIZ Share (%)
INPUTS (HR)
GIZ (Months)
Impact and Risk
Impact Weighting Risk Rating
11.0 10% Medium OUTPUT COMPONENT:D : ICT Strategy and Operational Plan

18/07/2013 30
Working Paper – Klaus Röder - Key Expert Data Quality
Output D1 ICT Strategy and Operational Plan
Indicators D1 Baseline 2013 ( Inception Phase )
Milestone 1 (Implement. Phase I)
Milestone 2 (Implement. Phase II)
Milestone 3 (Implement. Phase III)
Target 2016 /Finalization Phase
Assumptions
ICT Strategy and Operational Plan
Status of Quality Assurance System as in Inception Report
ICT Progress index (1.phase 10%). Number of meetings internal CSO / external Line. Ministries 3/0
ICT Progress index (2.phase 30%). Number of meetings internal CSO / external Line. Ministries 6/2
ICT Progress index (3.phase 60%). Number of meetings internal CSO / external Line. Ministries 6/6
ICT Progress index (3.phase 100%). Number of meetings internal CSO / external Line. Ministries 10/10
Management and CSO share the view of an integrated SSA. The technical conditions for the ICT Strategy and Operational Plan go hand with the building of ICT infrastructure* Other Output pending
Source Baseline / Indicators monitored by: Inception Report Number of Meetings of ICT Task Force (internal CSO / external Line. Ministries ) Output of ICT Progress index (1.phase 10%, 2.phase 30% , 3.phase 60% ,Target 100%), Quantitative measure in other sub-output sections (to be developed by Key Expert for ICT)
Output D2 Implement SDCA
Indicators D2 Baseline 2013 ( Inception Phase )
Milestone 1 (Implement. Phase I)
Milestone 2 (Implement. Phase II)
Milestone 3 (Implement. Phase III)
Target 2016 /Finalization Phase
Assumptions
Data Centre is available and shared by users and producers of statistics.
Status of SDCA as in Inception Report
IT infrastructure coverage index (1.phase 10%).
IT infrastructure coverage index (2.phase 30%) Data Centre availability (50%), Number of users (50%)
Progress indicator Data Sharing (3.phase 50%)
Full computer: computer availability for all staffs that require it as per ICT plan Data Centre available (100%), Number of users assessed (100%),
Procurement and Service assurance system for ICT component has been developed and is functional for ICT of CSO
Source
18/07/2013 31
Working Paper – Klaus Röder - Key Expert Data Quality
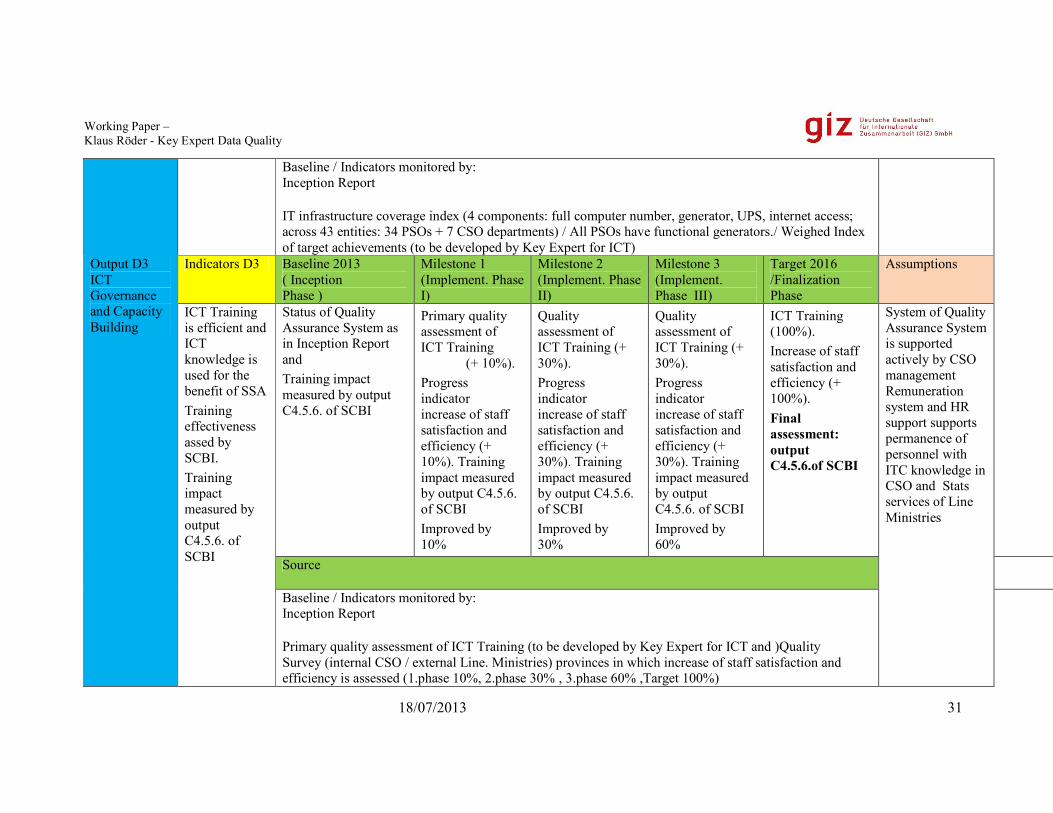
Baseline / Indicators monitored by: Inception Report IT infrastructure coverage index (4 components: full computer number, generator, UPS, internet access; across 43 entities: 34 PSOs + 7 CSO departments) / All PSOs have functional generators./ Weighed Index of target achievements (to be developed by Key Expert for ICT)
Output D3 ICT Governance and Capacity Building
Indicators D3 Baseline 2013 ( Inception Phase )
Milestone 1 (Implement. Phase I)
Milestone 2 (Implement. Phase II)
Milestone 3 (Implement. Phase III)
Target 2016 /Finalization Phase
Assumptions
ICT Training is efficient and ICT knowledge is used for the benefit of SSA Training effectiveness assed by SCBI. Training impact measured by output C4.5.6. of SCBI
Status of Quality Assurance System as in Inception Report and Training impact measured by output C4.5.6. of SCBI
Primary quality assessment of ICT Training (+ 10%). Progress indicator increase of staff satisfaction and efficiency (+ 10%). Training impact measured by output C4.5.6. of SCBI Improved by 10%
Quality assessment of ICT Training (+ 30%). Progress indicator increase of staff satisfaction and efficiency (+ 30%). Training impact measured by output C4.5.6. of SCBI Improved by 30%
Quality assessment of ICT Training (+ 30%). Progress indicator increase of staff satisfaction and efficiency (+ 30%). Training impact measured by output C4.5.6. of SCBI Improved by 60%
ICT Training (100%). Increase of staff satisfaction and efficiency (+ 100%). Final assessment: output C4.5.6.of SCBI
System of Quality Assurance System is supported actively by CSO management Remuneration system and HR support supports permanence of personnel with ITC knowledge in CSO and Stats services of Line Ministries
Source
Baseline / Indicators monitored by: Inception Report Primary quality assessment of ICT Training (to be developed by Key Expert for ICT and )Quality Survey (internal CSO / external Line. Ministries) provinces in which increase of staff satisfaction and efficiency is assessed (1.phase 10%, 2.phase 30% , 3.phase 60% ,Target 100%)

18/07/2013 32
Working Paper – Klaus Röder - Key Expert Data Quality
Output D4 GIS Capability
Indicators D4 Baseline 2013 ( Inception Phase )
Milestone 1 (Implement. Phase I)
Milestone 2 (Implement. Phase II)
Milestone 3 (Implement. Phase III)
Target 2016 /Finalization Phase
Assumptions
Performance of GIS Services
Status of Data Sharing as in Inception Report
GIS Services requested and delivered (1.phase +10%).
GIS Services requested and delivered (2.phase +30%).
GIS Services requested and delivered (2.phase +60%).
GIS Services requested and delivers +100% Final assessment: output C4.5.6.of SCBI
Source Baseline / Indicators monitored by: Inception Report Measuring GIS deliverables (maps, services, CSO survey support measured in MM delivered)
Output D5 Statistical SW Capability
Indicators D5 Baseline 2013 ( Inception Phase )
Milestone 1 (Implement. Phase I)
Milestone 2 (Implement. Phase II)
Milestone 3 (Implement. Phase III)
Target 2016 /Finalization Phase
Assumptions
CSO is largely self sufficient in Statistical SW Capability
Status of Data Sharing as in Inception Report
Number of primary data surveys conducted by CSO with own Statistical SW Capability = 1 / 6 MM. Statistical SW Capability support for Line Ministries (3 MM).
Number of primary data surveys conducted by CSO with own Statistical SW Capability = 1 / 9 MM. Statistical SW Capability support for Line Ministries (6 MM).
Number of primary data surveys conducted by CSO with own Statistical SW Capability = 3 / 12 MM. Statistical SW Capability support for Line Ministries (9 MM).
Data surveys conducted by CSO with own Statistical SW Capability (Al possible). Statistical SW Capability support for Line Ministries established as requested service. Final assessment: output C4.5.6.of SCBI
Components D1 and D2 are successfully progressing and measured as indicated

18/07/2013 33
Working Paper – Klaus Röder - Key Expert Data Quality
Source Baseline / Indicators monitored by: Inception Report Number of primary data surveys conducted by CSO with own Statistical SW Capability /MM delivered Number of services delivered for Line Ministries supporting Statistical SW Capability (measure in MM)
INPUTS (US$)
GIZ (US$) Govt (US$) Other (US$) Total (US$) GIZ Share (%)
INPUTS (HR)
GIZ (Months) Impact and Risk
Impact Weighting Risk Rating
31.0 20% High
18/07/2013 34
Working Paper – Klaus Röder - Key Expert Data Quality
2.2. Use of the Logframe: Afghanstat-CSO Twinning Project The above described logframe comprises various project information described in more detail:
• The Inputs • The Milestones • The Monitoring and Evaluation Arrangements • The Use of Reviews as Quality Assessment Tool • The Impact chain
The visualization of the Impact chain is the core element of the LF. The elements are connected by the reasoning described before, describing the envisaged project results on various layers The Goal/Impact is the larger development challenge for which the particular project or programme is part of solution.
• The Goal/Impact should be a high-level aim, shared with other projects and programmes. It is something which the project contributes towards achieving
• The Goal/Impact should be measureable • The project will have an Impact on the Goal/Impact :
The Outcome should identify what will change as a result of the project and who will benefit • • It is the effect which will be achieved if the project is successful • • The Outcome should be measureable
The Outputs are the specifics which the project will deliver. If the outputs are delivered then the Outcome will be achieved. Inputs are indicated by US$ and CSO and GIZ-IS MM, other donors could be added. Assumptions are stated in positive (affirmative) form. The risks are (among others) that these assumptions do not hold. The document on quality reviews and quality assurance systems will be integral part of the projects’ documentation. They are not part of the LF but are expected to be applied there. The Monitoring and Evaluation Arrangements will be linked to the elements of the LF, namely the milestones and monitoring of indicator achievements. Monitoring and Evaluation Arrangements:
• Baseline values and targets for indicators are identified in the logical framework are estimated for each country during the application
• The logical framework proposes that usually outcome-level monitoring should be based on user surveys. Sometimes assessment by project coordinators is used if applicable. Existing surveys or user feedback arrangements may be used, they should adhere to the quality standards of the project and should be conducted to independent assessment of the performance
• The logical framework also includes key output-indicators related to making improvements in statistical capacity. For the related assessments a version of the Data Quality Assessment Framework of the IMF adapted to the ANS will be applied.
• Measuring indicators will be conducted by Implementing agencies(GIZ-IS ad others) according to identified reporting frequencies stated in the LF.
• Progress reporting normally consists of six-monthly assessments of implementation status and results as part of project supervision activities.
• The supervising Administration (SRF Catalytic Fund) Unit will use information provided in project-level monitoring reports to assess progress against indicators listed in the logical framework for the Evaluation

18/07/2013 35
Working Paper – Klaus Röder - Key Expert Data Quality
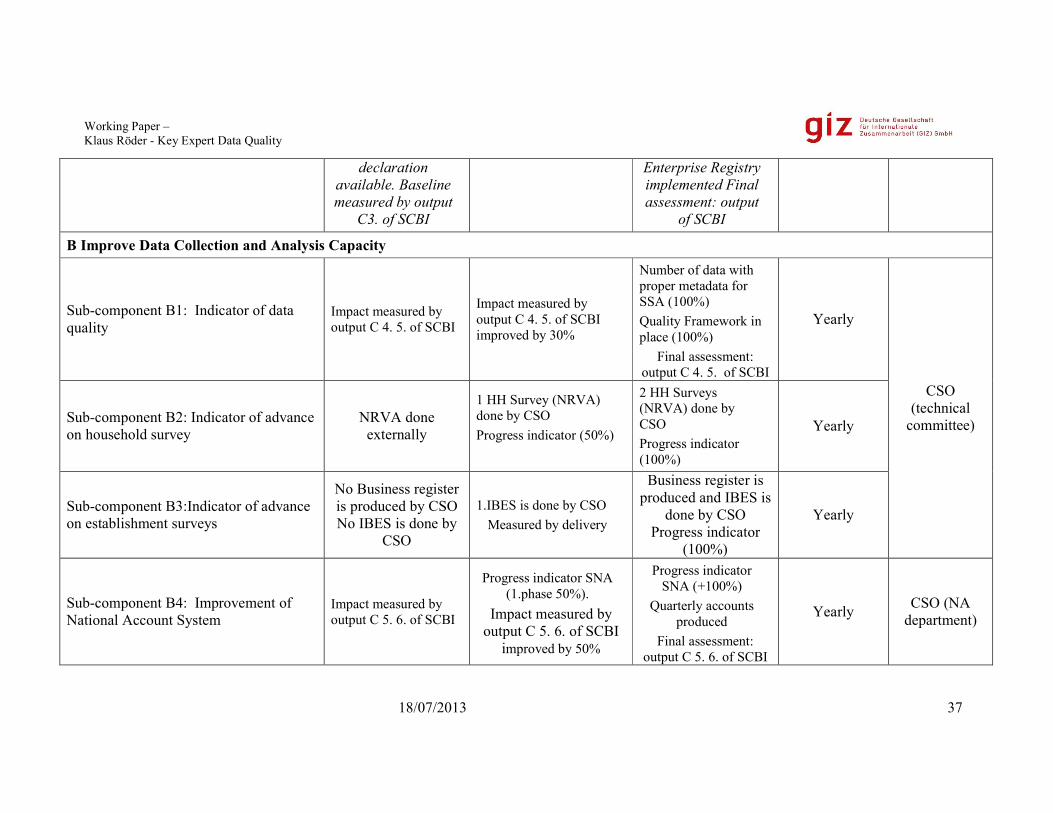
2.3. Integration of Logframe: Afghanstat-CSO Twinning Project into the WB-SRF logframe The following table is a combination of the WB results framework of the SRF-CF, which was responsible for the outcome indicators. The output and activity indicators have been merged from our GIZ-IS Logframe to this template KR130525: Dates have not been changed because it seems that old dates have not been updated in WB template.
Responsible for the Annex 3: Results Framework and Monitoring AFGHANISTAN: AFGHANSTAT: Strengthening the National Statistical System
Results Framework
Outcome indicators Baseline Midterm (March 2012) Target Frequency Responsibility World Bank Statistical Capacity Building Score for Afghanistan Methodology: 40 in 2010 Source data: 20 in 2010 Periodicity and timeliness: 57 in 2010
39 in 2010 38 45 Yearly WB
Number of NPP’s and MDG indicators which are supported by the CSO (and which are clearly sourced as CSO data) Note: Number of indicators in MDG 2008 report clearly sourced as CSO or NRVA.
17 (MDGs) 21 (MDGs) 26 (MDGs) Yearly CSO (PICT)
Percentage of users* who say they are satisfied or very satisfied with statistical products and services of the CSO and the line-ministries' statistical cells. (*) Users include: line-ministries, donors, NGOs, media, academics, private sectors. At list of selected entities
TBC by Nov 30, 2010 TBC by Nov 30, 2010 TBC by Nov 30,
2010 Yearly
User survey to be conducted
or commissioned
by the CSO

18/07/2013 36
Working Paper – Klaus Röder - Key Expert Data Quality
will be developed during design of the User Survey
Output indicators Baseline Midterm Target Frequency Responsibility A:Improved Framework for Statistical Production and Capacity Development
Sub -component A2: User Satisfaction / Media visibility / Publications and Web appearance of CSO / Method: Media visibility by SCBI survey / Sales by score.)
Statistical capacity building indicator
Media visibility / Publications and Web appearance by sales
core. Review by Statistical system SCBI (+25%)
Media visibility / Publications and Web appearance by sales
core. Review by Statistical system SCBI (+50%)
Sales core and Media
Quarterly / SCBI Yearly
CSO (technical
committee)
Sub -component A3: Training and training strategy assessment¸ Organisation structure of CSO / Method: Capacity score will be delivered by SCBI
Training impact measured by output
C4.5.6. of SCBI
C4.5.6. of SCB improve by 50%
Structure reports approved and implemented
Institutional Framework in place
Final assessment: output C4.5.6 of
SCBI
Yearly
Sub -component A4 and A5: Score of capacity delivery of the CSO departments and CSO staff. / Capacity score will be delivered by SCBI
Impact measured by output C2. of SCBI
and score of trainings
Impact measured SCB improve by 50%
Number of CSO staff with bachelor +50%
Structure of HR training system approved and implemented
Final assessment: output of SCBI
Yearly
Sub-component A6: Classification and Standards of CSO improved and Business Register established
No Business and Enterprise Registry
/ CSO standards
Impact measured by output C3. of SCBI
improve by 30%
Classifications and standards of CSO /
Business and Yearly CSO (PICT)
18/07/2013 37
Working Paper – Klaus Röder - Key Expert Data Quality
declaration available. Baseline measured by output
C3. of SCBI
Enterprise Registry implemented Final assessment: output
of SCBI
B Improve Data Collection and Analysis Capacity
Sub-component B1: Indicator of data quality
Impact measured by output C 4. 5. of SCBI
Impact measured by output C 4. 5. of SCBI improved by 30%
Number of data with proper metadata for SSA (100%) Quality Framework in place (100%)
Final assessment: output C 4. 5. of SCBI
Yearly
CSO (technical
committee) Sub-component B2: Indicator of advance on household survey
NRVA done externally
1 HH Survey (NRVA) done by CSO Progress indicator (50%)
2 HH Surveys (NRVA) done by CSO Progress indicator (100%)
Yearly
Sub-component B3:Indicator of advance on establishment surveys
No Business register is produced by CSO No IBES is done by
CSO
1.IBES is done by CSO Measured by delivery
Business register is produced and IBES is
done by CSO Progress indicator
(100%)
Yearly
Sub-component B4: Improvement of National Account System
Impact measured by output C 5. 6. of SCBI
Progress indicator SNA (1.phase 50%).
Impact measured by output C 5. 6. of SCBI
improved by 50%
Progress indicator SNA (+100%)
Quarterly accounts produced
Final assessment: output C 5. 6. of SCBI
Yearly CSO (NA department)

18/07/2013 38
Working Paper – Klaus Röder - Key Expert Data Quality
Sub-component B5: Number of provinces in which price data are collected and included in the national CPI estimate
Status of Price Statistics as in
Inception Report and Impact measured by output C 5. 6. of
SCBI
10 Provinces are covered
Impact measured by output C 5. 6.. of SCBI
improved by 60%
Number of provinces in which price data are collected = 34 Timeliness of CPI
production (t+15 of days),
Final assessment: output C 5. 6. of SCBI
Yearly CSO (CPI department)
C Improve Administrative Systems
Sub-component C1: Statistical Audits:
Impact measured by output C 5.- Revision policy and practice- of
SCBI
Impact measured by output C 5.- Revision policy and practice- of SCBI has improved by
60%
Quality Assurance System (+100%) Number of audits
internal CSO / external Line.
Ministries 10/10 Final assessment:
output C 5.- Revision policy and practice- of
SCBI
Yearly CSO (CPI department
Sub-component C2: More efficient data sharing within the SSA
Impact measured by output C 6. of SCBI
Impact measured by output C 6.of SCBI has
improved by 50%
Progress indicator Data Sharing (3.phase
100%) At least 50% of CSO
data are shared internationally
Final assessment: output C 6. of SCBI
Yearly CSO (CPI department
Component D: Improve Information and Communication Technology Infrastructure
Impact measured by of SCBI
Impact measured by output of SCBI has improved by 50%
ICT Progress index (3.phase 100%).
Data Centre available Yearly CSO (IT
department)

18/07/2013 39
Working Paper – Klaus Röder - Key Expert Data Quality
(100%), Number of users assessed (100%),
Activity progress indicators* Baseline Midterm Target Frequency Responsibility Component A – Institutional and Capacity Development Public perception of CSO performance
See above and Project Logframe
Deliverables, sales, clicks on web site) Quarterly
CSO (PICT)
User satisfaction survey and SCBI /see above Yearly
Use of Afghan Info (clicks) Quarterly Performance assessments of staff (SCBI) Yearly Number of deliverables Yearly Assessment of use of HR database Quarterly Staff satisfaction survey Yearly Quality of training assessments Yearly Number of CSO staff with educational attainment of bachelor Yearly
Component B - Data Collection and Analysis
User satisfaction survey and SCBI /see above
Yearly
CSO (PICT)
Use of quality tools Yearly Use of quality reviews Yearly IBES survey conducted (progress indicator cumulative %)
Yearly
Study on informal sector conducted (progress indicator cumulative %)
Yearly
Scope of price statistics extended (reach of number of milestones, progress)
Yearly
National Accounts data revised Yearly

18/07/2013 40
Working Paper – Klaus Röder - Key Expert Data Quality
Component C - Administrative Data Systems
Statistical audits at line ministries conducted Yearly
CSO (PICT Assessment of use of Administrative Data Systems Quarterly
Component D - ICT Infrastructure Number of PSOs connected to the internet,
Yearly
Data transfer between the PSOs and CSO operational and in use.(Number) Quarterly
ICT is used by staff for primary data statistics Yearly
*: Methodology to calculate activity progress indices. Each group will have specific activities to be taken, to be identified in the work plan. Each activity has a life cycle of its own and the progress can be captured through identified milestones of that activity. Once these milestones have been identified, weights will be assigned to the milestones according to their importance. To calculate the indices, the PICT will (i) compile milestones achieved at the reference point of time, (ii) apply appropriate weights, which will yield the index of progress for that activity, and (iii) take a simple average across all activities in the group to obtain the overall index for the group.