on opioids, with 63 attending; the next innovation acta
TRANSCRIPT

FY 18 and FY 19 Qtr 1
Quarterly Report Board of Trustees
Accelerating Discovery
NEW HIGHLIGHTED GRANTS
Devin Bloom, Systematics and Evolution of Migration of Clupeiformes, National Science Foundation, $699,310
Clement Burns and Co-PIs, Acquisition of a Physical Properties Measurement System, National Science Foundation, $621,618
Massood Atashbar, “Condition Monitoring Sensor Array,” Boeing Corporation, $200,000
DISTINCTIONS
The Association of Public and Land-Grant Universities’ Council on Research has named its second cohort of CoR Research Leader Fellows, with Dr. Sherine Obare, associate VP for research, among the seven in this select group of senior research officers chosen from the nation's public research universities.
Technology and Innovation Advancement — U.S. Patent No. 9,943,128, Helmet Impact Monitoring System, was awarded to WMU on April 17, 2018, for a novel printed, sensor technology that monitors impacts to the head that can result in concussions. It enables “point-of-impact mapping” of head trauma around the skull that no other system on the market provides.
Lemmer, Kristina (2017). Propulson for CubeSats, Acta Astronautica, 134, 231-243. Most highly cited faculty paper this year to date of recent WMU publications.
KEY NUMBERS
Introduction to Customer Discovery training, done in conjunction with Michigan Technological University, and the national I-Corps program sponsored by the National Science Foundation advances intellectual property and start-up companies
o 11 teams started in October – 4 from engineering, 3 from business, 2 from elsewhere at WMU, and 2 from the community at large
Research and Sponsored Program awards for FY 18 were $25.8 million, topped by College of Education and Human Development.
Federal awards were $14.5 million, up over FY 17
WMU received 207 awards with the largest number in the College of Arts and Sciences.
Grants and contracts submitted were $112.8 million
New research development events on finding funding and applying to the National Institutes of Health showed >100% growth in attendance over FY 17.
COLLABORATION / INTERNAL DEVELOPMENT
OVPR sponsored the first Innovation Networking Session on Opioids, with 63 attending; the next Innovation Networking Session on PFAS and other emerging contaminants will be held on Nov. 15
7 November 2018
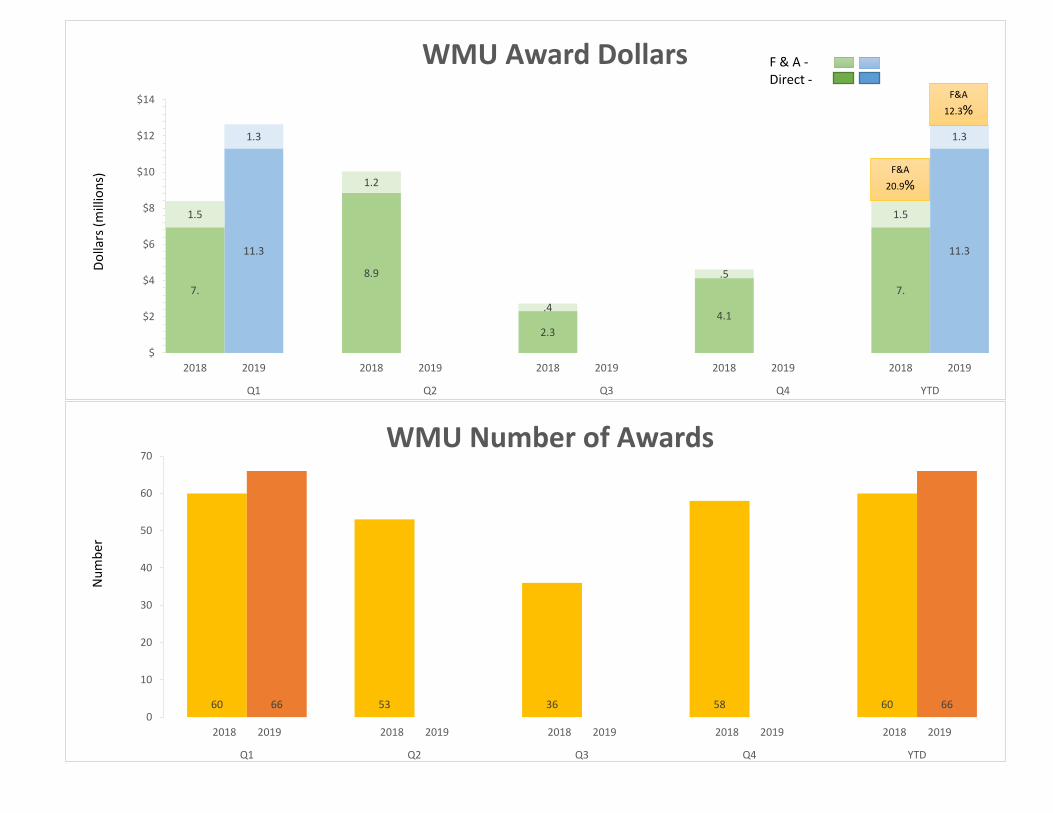
60 53 36 58 6066 660
10
20
30
40
50
60
70
2018 2019 2018 2019 2018 2019 2018 2019 2018 2019
Q1 Q2 Q3 Q4 YTD
WMU Number of Awards
Num
ber
7.
11.3
8.9
2.34.1
7.
11.3
1.5
1.3
1.2
.4
.5
1.5
1.3
$
$2
$4
$6
$8
$10
$12
$14
2018 2019 2018 2019 2018 2019 2018 2019 2018 2019
Q1 Q2 Q3 Q4 YTD
WMU Award DollarsDo
llars
(mill
ions
)
F & A -Direct -
F&A
20.9%
F&A
12.3%

5.86.5
4.6 4.4
6.25.8
6.5
1.2
1.2
.7.7
1.11.2
1.2
$
$1
$2
$3
$4
$5
$6
$7
$8
$9
2018 2019 2018 2019 2018 2019 2018 2019 2018 2019
Q1 Q2 Q3 Q4 YTD
WMU Expenditure Dollars
Dolla
rs(m
illio
ns)
F & A -Direct -
F&A20.62%
F&A18.04%

10178
9786
10193 93
0
20
40
60
80
100
120
2018 2019 2018 2019 2018 2019 2018 2019 2018 2019
WMU Wide Numbers
Num
ber S
ubmiss
ions
7.
11.3
8.9
2.34.1
7.
11.3
1.5
1.3
1.2
.4
.5
1.5
1.3
$
$2
$4
$6
$8
$10
$12
$14
2018 2019 2018 2019 2018 2019 2018 2019 2018 2019
Q1 Q2 Q3 Q4 YTD
WMU Wide SubmissionsDo
llars(in
millions)
F & A ‐Direct ‐
F&A20.9%
F&A12.3%

1 1
0 0
1
0
1
2
2018 2019 2018 2019 2018 2019 2018 2019 2018 2019
Q1 Q2 Q3 Q4 YTD
College of AviationAward Numbers
Num
ber
0
180
116
0 018
0
9
0
49
0 0
9
0$
$50
$100
$150
$200
2018 2019 2018 2019 2018 2019 2018 2019 2018 2019
Q1 Q2 Q3 Q4 YTD
College of AviationAward Dollars
Dolla
rs (t
hous
ands
)F & A -Direct -
F&A51.0%
F&A
0%
0

17
13 14
18 1720 20
0
5
10
15
20
25
2018 2019 2018 2019 2018 2019 2018 2019 2018 2019
Q1 Q2 Q3 Q4 YTD
College of Arts and Sciences Award Number
Num
ber
1,215
2,528
1,022 924625
1,215
2,528296
512
137 322
135
296
512
$
$1
$2
$3
$4
2018 2019 2018 2019 2018 2019 2018 2019 2018 2019
Q1 Q2 Q3 Q4 YTD
College of Arts and SciencesAward Dollars
Dolla
rs(m
illio
ns)
F & A -Direct -
F&A
24.3%
F&A
20.3%
9
6
1
4
9
3 3
0
1
2
3
4
5
6
7
8
9
10
2018 2019 2018 2019 2018 2019 2018 2019 2018 2019
Q1 Q2 Q3 Q4 YTD
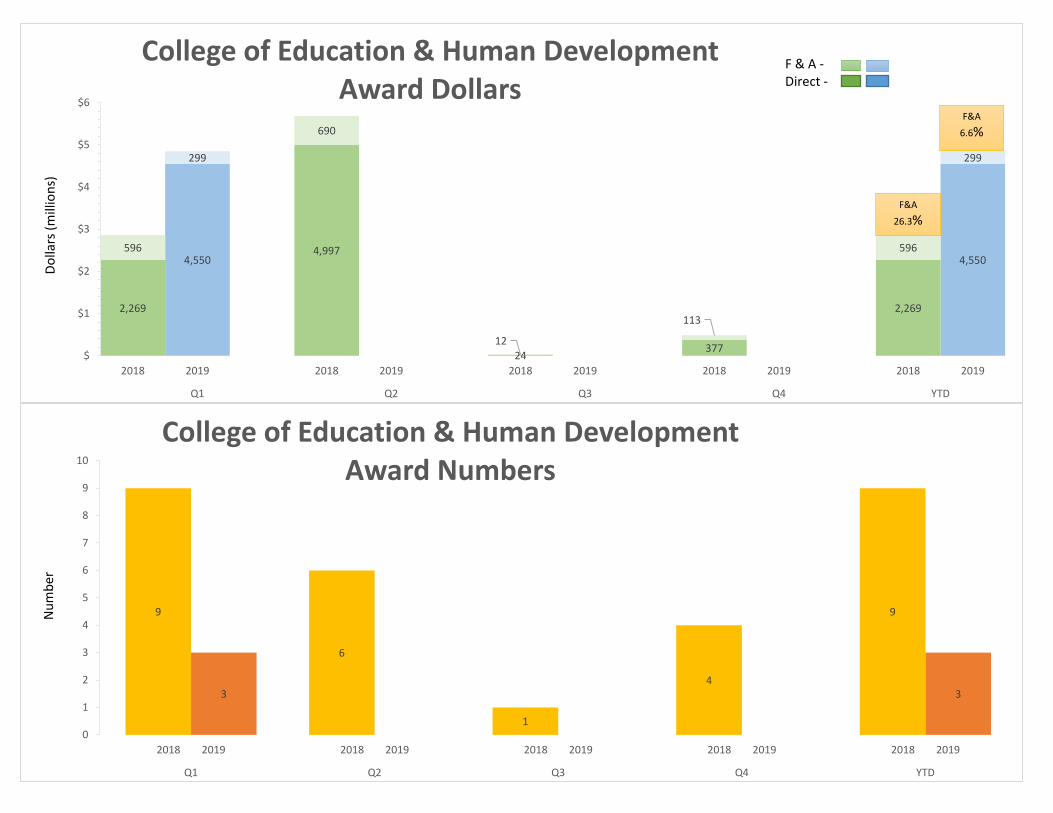
College of Education & Human DevelopmentAward Numbers
Num
ber
2,269
4,5504,997
24377
2,269
4,550596
299
690
12
113
596
299
$
$1
$2
$3
$4
$5
$6
2018 2019 2018 2019 2018 2019 2018 2019 2018 2019
Q1 Q2 Q3 Q4 YTD
College of Education & Human DevelopmentAward Dollars
Dolla
rs(m
illio
ns)
F & A -Direct -
F&A
26.3%
F&A
6.6%

8
11
6
11
8
17 17
0
2
4
6
8
10
12
14
16
18
2018 2019 2018 2019 2018 2019 2018 2019 2018 2019
Q1 Q2 Q3 Q4 YTD
College of Engineering and Applied SciencesAward Numbers
Num
ber
275
623 634
197
373275
62381
176 117
51
92
81
176
$.
$.1
$.2
$.3
$.4
$.5
$.6
$.7
$.8
$.9
2018 2019 2018 2019 2018 2019 2018 2019 2018 2019
Q1 Q2 Q3 Q4 YTD
College of Engineering and Applied SciencesAward Dollars
Dolla
rs(m
illio
ns)
F & A -Direct -
F&A
29.6%
F&A28.3%
0 0 0
1
00
1
2
2018 2019 2018 2019 2018 2019 2018 2019 2018 2019
Q1 Q2 Q3 Q4 YTD
College of Fine ArtsAward Numbers
Num
ber
0
0 0 0 0 2 0 0$
$50
2018 2019 2018 2019 2018 2019 2018 2019 2018 2019
Q1 Q2 Q3 Q4 YTD
College of Fine ArtsAward Dollars
Dolla
rs (t
hous
ands
)F & A -Direct -
F&A0.0%
F&A
0.0%
0
0
1
0 0 00
1
2
2018 2019 2018 2019 2018 2019 2018 2019 2018 2019
Q1 Q2 Q3 Q4 YTD
The Graduate CollegeAward Numbers
Num
ber
0
0 0
104
0 0 0 0$
$50
$100
$150
2018 2019 2018 2019 2018 2019 2018 2019 2018 2019
Q1 Q2 Q3 Q4 YTD
The Graduate CollegeAward Dollars
Dolla
rs (t
hous
ands
)F & A -Direct -
F&A0.0%
F&A
0.0%
0

1 1
0
1 1
2 2
0
1
2
2018 2019 2018 2019 2018 2019 2018 2019 2018 2019
Q1 Q2 Q3 Q4 YTD
Haworth College of BusinessAward Numbers
Num
ber
27
311 290
0
6527
311
3
570
03
5
$
$50
$100
$150
$200
$250
$300
$350
$400
2018 2019 2018 2019 2018 2019 2018 2019 2018 2019
Q1 Q2 Q3 Q4 YTD
Haworth College of BusinessAward Dollars
Dolla
rs (t
hous
ands
)F & A -Direct -
F&A12.0%
F&A
1.7%
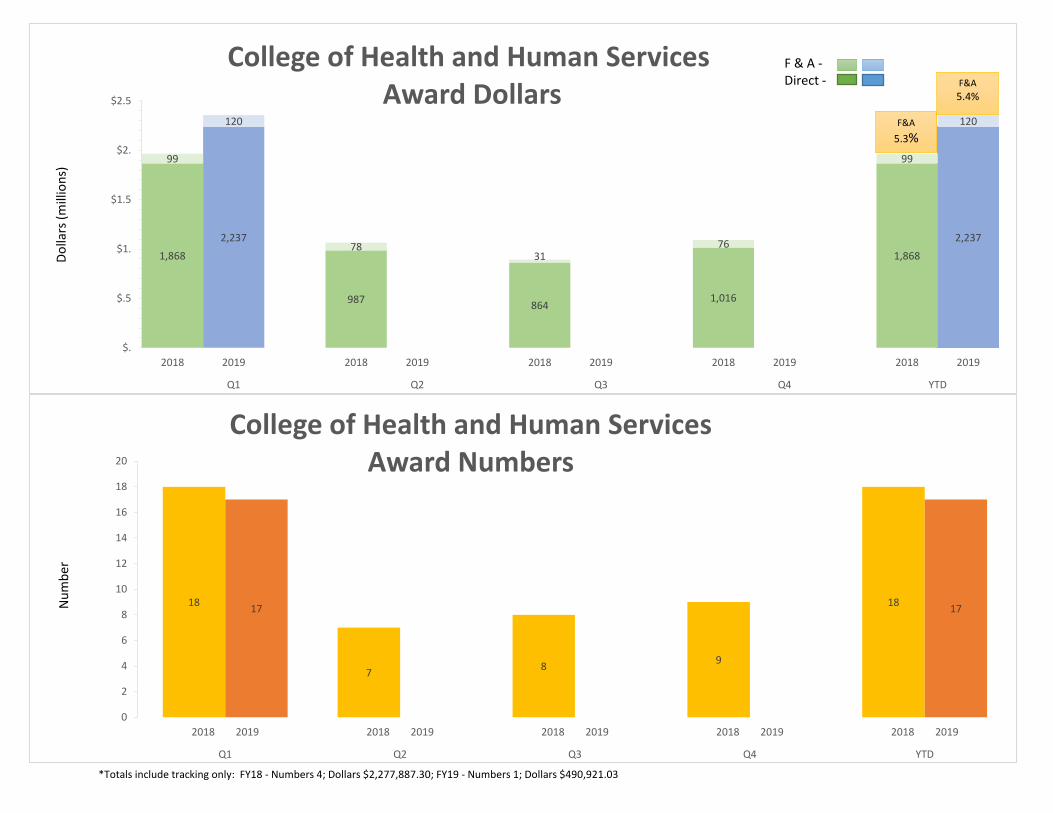
*Totals include tracking only: FY18 - Numbers 4; Dollars $2,277,887.30; FY19 - Numbers 1; Dollars $490,921.03
18
7 8 9
1817 17
0
2
4
6
8
10
12
14
16
18
20
2018 2019 2018 2019 2018 2019 2018 2019 2018 2019
Q1 Q2 Q3 Q4 YTD
College of Health and Human ServicesAward Numbers
Num
ber
1,868
2,237
987 8641,016
1,868
2,237
99
120
7831
76
99
120
$.
$.5
$1.
$1.5
$2.
$2.5
2018 2019 2018 2019 2018 2019 2018 2019 2018 2019
Q1 Q2 Q3 Q4 YTD
College of Health and Human ServicesAward Dollars
Dolla
rs(m
illio
ns)
F & A -Direct -
F&A
5.3%
F&A5.4%

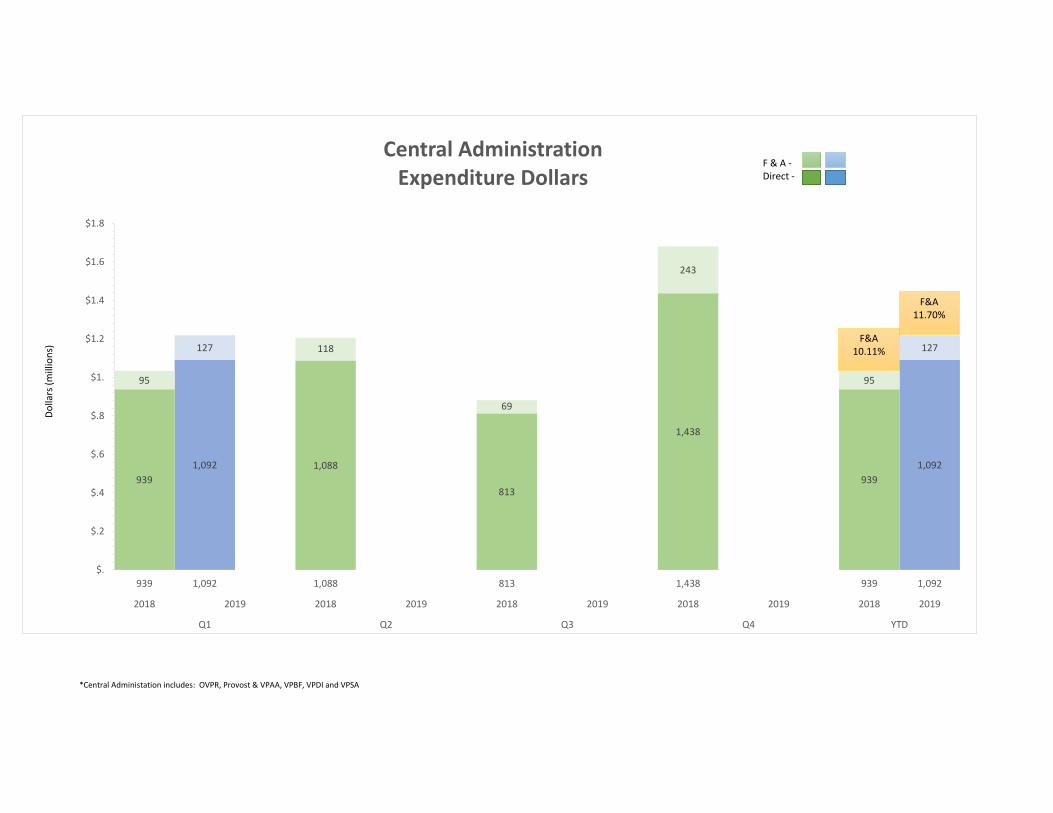
*Central Administation includes: OVPR, Provost & VPAA, VPBF, VPDI and VPSA
**VPBF - FY18 Q4 includes tracking only: Numbers 3; Dollars $1,065,138.53
6
13
7
14
67 7
0
2
4
6
8
10
12
14
16
2018 2019 2018 2019 2018 2019 2018 2019 2018 2019
Q1 Q2 Q3 Q4 YTD
Central AdministrationAward Numbers
Num
ber
1,2781,069
702
308
1,679
1,2781,069
367
217
48
4
70
367
217
$.
$.2
$.4
$.6
$.8
$1.
$1.2
$1.4
$1.6
$1.8
$2.
1,278 1,069 702 308 1,679 1,278 1,069
2018 2019 2018 2019 2018 2019 2018 2019 2018 2019
Central AdministrationAward Dollars
Dolla
rs(m
illio
ns)
F & A -Direct -
F&A
28.8%
F&A20.3%

54
93
210
4454
93
27
42
1 5
21
27
42
$
$50
$100
$150
2018 2019 2018 2019 2018 2019 2018 2019 2018 2019
Q1 Q2 Q3 Q4 YTD
College of AviationExpenditure Dollars
Dolla
rs (t
hous
ands
)
F & A -Direct -
F&A49.92%
F&A45.45%

1,446 1,291 1,368
942 1,0891,446 1,291
343317 220
179
280
343317
$
$1
$2
$3
$4
2018 2019 2018 2019 2018 2019 2018 2019 2018 2019
Q1 Q2 Q3 Q4 YTD
College of Arts and SciencesExpenditure Dollars
Dolla
rs(m
illio
ns)
F & A -Direct -
F&A23.70% F&A
24.59%

1,008
1,906
674
950
1,471
1,008
1,906
244
309
127
170
182
244
309
$
$1
$1
$2
$2
$3
2018 2019 2018 2019 2018 2019 2018 2019 2018 2019
Q1 Q2 Q3 Q4 YTD
College of Education & Human DevelopmentExpenditure Dollars
Dolla
rs(m
illio
ns)
F & A -Direct -
F&A24.24%
F&A16.18%
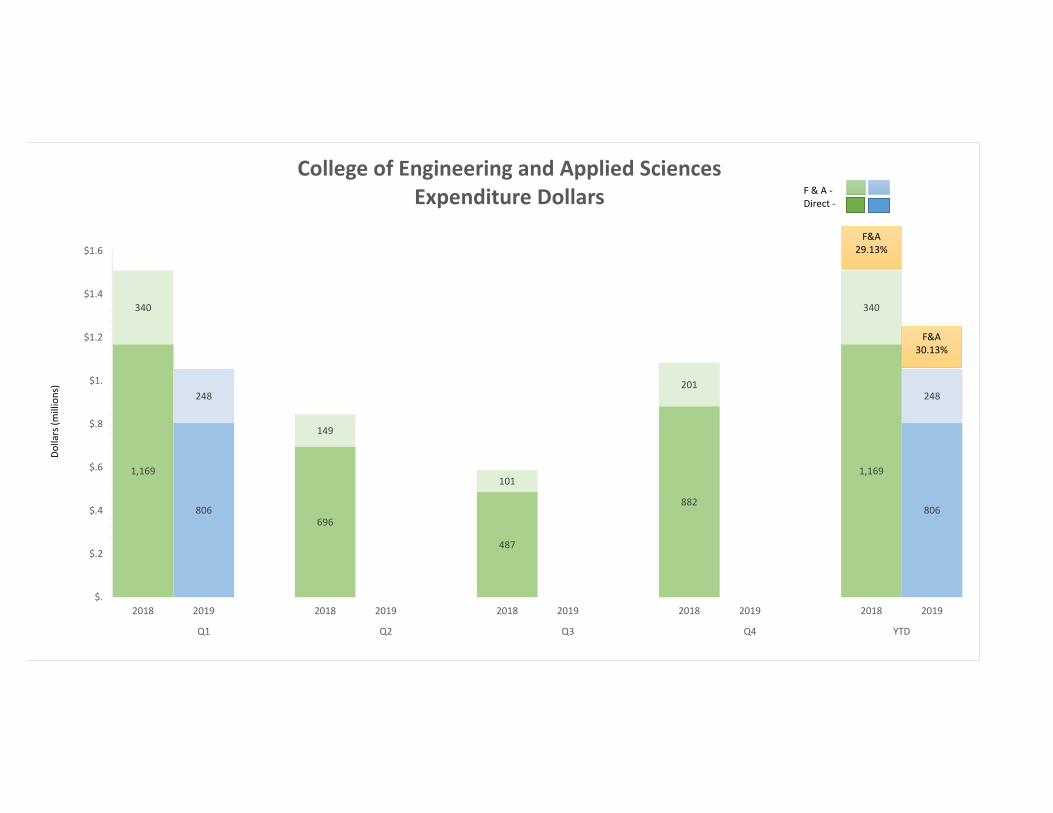
1,169
806696
487
882
1,169
806
340
248
149
101
201
340
248
$.
$.2
$.4
$.6
$.8
$1.
$1.2
$1.4
$1.6
2018 2019 2018 2019 2018 2019 2018 2019 2018 2019
Q1 Q2 Q3 Q4 YTD
College of Engineering and Applied SciencesExpenditure Dollars
Dolla
rs(m
illio
ns)
F & A -Direct -
F&A29.13%
F&A30.13%
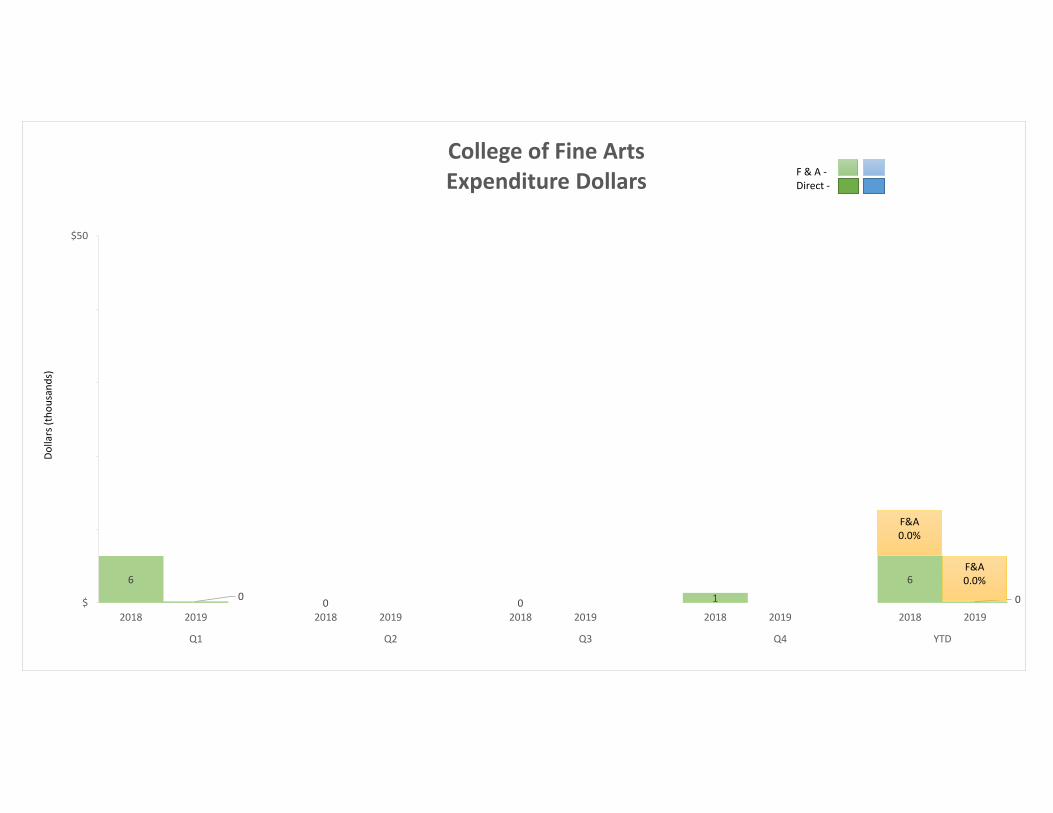
60 0 0 1
6
0$
$50
2018 2019 2018 2019 2018 2019 2018 2019 2018 2019
Q1 Q2 Q3 Q4 YTD
College of Fine ArtsExpenditure Dollars
Dolla
rs (t
hous
ands
)
F & A -Direct -
F&A0.0%
F&A0.0%

113
134
15
88
55
113
134
0
2
0
4
6
0
2
$
$50
$100
$150
2018 2019 2018 2019 2018 2019 2018 2019 2018 2019
Q1 Q2 Q3 Q4 YTD
The Graduate CollegeExpenditure Dollars
Dolla
rs (t
hous
ands
)
F & A -Direct -
F&A0.20%
F&A1.25%
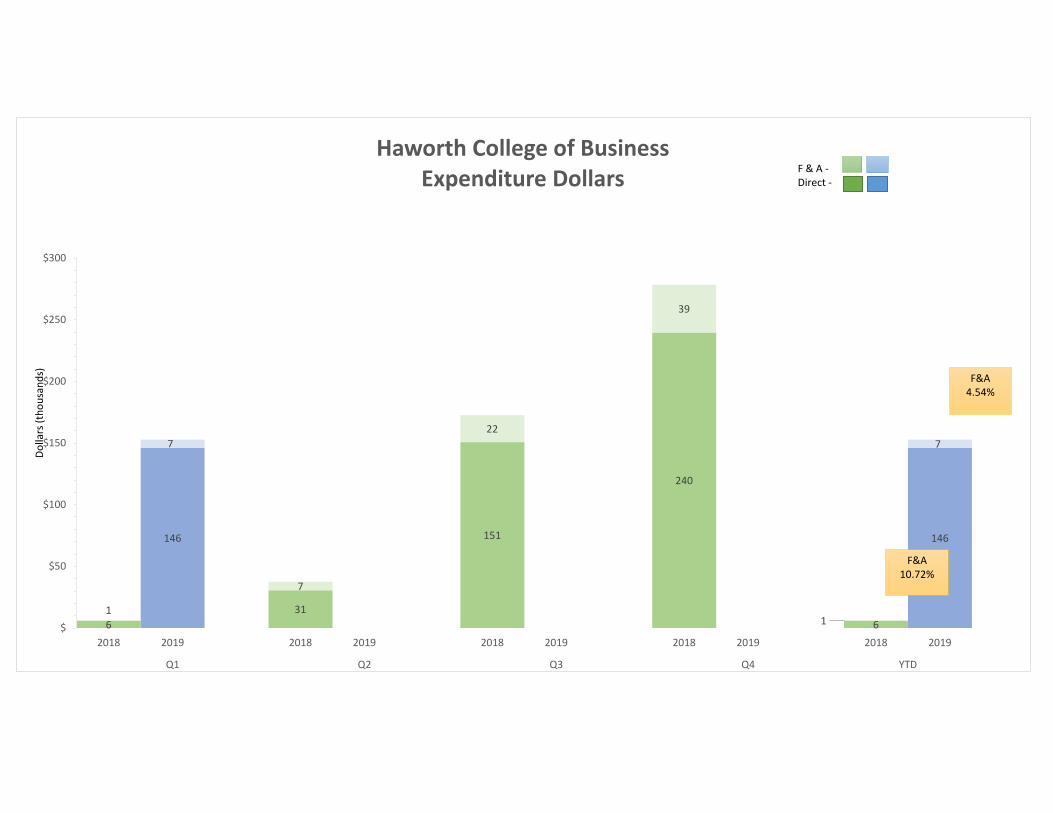
6
146
31
151
240
6
146
1
7
7
22
39
1
7
$
$50
$100
$150
$200
$250
$300
2018 2019 2018 2019 2018 2019 2018 2019 2018 2019
Q1 Q2 Q3 Q4 YTD
Haworth College of BusinessExpenditure Dollars
Dolla
rs (t
hous
ands
)
F & A -Direct -
F&A10.72%
F&A4.54%

1,0621,001
770
974 1,014 1,0621,001
146
115
118
110 128146
115
$.
$.2
$.4
$.6
$.8
$1.
$1.2
$1.4
2018 2019 2018 2019 2018 2019 2018 2019 2018 2019
Q1 Q2 Q3 Q4 YTD
College of Health and Human ServicesExpenditure Dollars
Dolla
rs(m
illio
ns)
F & A -Direct -
F&A13.77%
F&A11.47%
*Central Administation includes: OVPR, Provost & VPAA, VPBF, VPDI and VPSA
9391,092 1,088
813
1,438
9391,092
95
127 118
69
243
95
127
$.
$.2
$.4
$.6
$.8
$1.
$1.2
$1.4
$1.6
$1.8
939 1,092 1,088 813 1,438 939 1,092
2018 2019 2018 2019 2018 2019 2018 2019 2018 2019
Q1 Q2 Q3 Q4 YTD
Central AdministrationExpenditure Dollars
Dolla
rs(m
illio
ns)
F & A -Direct -
F&A10.11%
F&A11.70%