on permeability - nasa · influence of fiber packing structure on permeability zhong cai drexel...
TRANSCRIPT

INFLUENCE OF FIBER PACKING STRUCTURE
ON PERMEABILITY
Zhong CaiDrexel University
Philadelphia, PA 19104
Alexander L. BerdichevskyCR Industries
Elgin, IL 60123
/ ....
/
9N 4- 6857
The study on the permeability of an aligned fiber bundle is the key building block inmodeling the permeability of advanced woven and braided preforms. Available results on
the permeability of fiber bundles in the literature show that substantial difference existsbetween numerical and analytical calculations on idealized fiber packing structures, such as
square and hexagonal packing, and experimental measurements on practical fiber bundles.The present study focuses on the variation of the permeability of a fiber bundle under
practical process conditions. Fiber bundles are considered as containing openings and fiberclusters within the bundle. Numerical simulations on the influence of various openings on
the permeability have been conducted. Idealized packi_ng.s.trucm.ms.are used, but withintroduced openings distributed in different patterns, tlotn long_tumnat ana transverse floware considered. The results show that openings within the fiber bundle have substantial
effect on the permeability. In the longitudinal flow case, the openings become thedominant flow path. In the transverse flow case, the fiber clusters reduce the gap sizes
among fibers. Therefore the permeability is greatly influenced by these openings andclusters respectively. In addition to the porosity or fiber volume fraction, which iscommonly used in the permeability expression, another fiber bundle status parameter, theultimate fiber volume fraction, is introduced to capture the disturbance within a fiber
bundle.
INTRODUCTION
The permeability of an aligned fiber bundle has been studied extensively since it is animportant parameter in the composite manufacturing, processes. Different proposedformulas have been suggested and verified by experiments for both longitudinal and
transverse permeabilities [ 1-6]. It was found that the permeability is closely related to thefiber volume fraction or porosity. However, experimental measurements showed large
scattering of data. Numerical calculations of the permeability of idealized square and
hexagonal packing structures are also reported [7, 8].
The permeability is def'med as [9]
K=Q_. uA (Ap/L) (1)
Presented at FIBER-TEX92, Philadelphia, October, 1992.
167
https://ntrs.nasa.gov/search.jsp?R=19940012384 2018-06-06T23:09:47+00:00Z

whereQ is the volume flow rate, A is the total cross-section area, and la is the viscosity.The pressure difference ap is across the distance L. Here the positive values of Q and Apare used although their directions are opposite. In order to use the dimensionlessparameter, the permeability K is normalized by using the fiber radius rf. The normalized
permeability K* is def'med as
K* =K
(2)
When permeability in different directions is discussed, subscript x is used for the fiberdirection, and y and z refer to transverse directions. Since a fiber bundle is assumed to betransversely isotropic, only subscript z is used to express the transverse permeability.
The comparison of the permeability of these idealized packing structures and otherproposed formulas is summarized in Fig. 1 for both longitudinal and transverse cases. Inthe longitudinal direction, there is a substantial difference between the model predictions,which are backed by experimental data, and numerical solutions. The disturbance in thefiber bundle under the processing conditions contributes to the discrepancy. In thetransverse direction, two models are used in the comparison. Kardos' model [3, 4] onlycontains fiber volume fraction Vf, while Gutowski's model [2] introduced an additionalvariable, the ultimate fiber volume fraction Va. There are some differences betweenKardos' model and square packing results, and between Gutowski's model and hexagonal
packing results respectively. The difference between these two groups becomes substantialwhen Vf becomes high.
As a fiber bundle usually contains thousands of filaments, the random distribution of thesefilaments, and any disturbance within a bundle, can result in the change of permeability ofthe fiber assembly. In this study, micro-level cell models with introduced disturbance arebuilt to investigate these disturbances using numerical simulations. The variation of thepermeability due to these disturbances is then assessed and analyzed.
NUMERICAL SIMULATION
The numerical simulation work was done by using the available finite element packagesANSYS [10] and FIDAP [11]. The automatic meshing capability and the easiness of the
re-processing and post-processing of these FE packages especially with ANSYS greatlyelp build up various mesh models.
a) Longitudinal Permeability
For the longitudinal permeability, we assume the flow is parallel to the fiber axis, or xdirection, and only the velocity component Vx exists. Also we assume the Reynoldsnumber is very small and the gravity can be neglected so that this becomes the so-calledStokes flow. The flow equation can be written as
b__p1 _)2Vx b2V x- +
bx la Oy2 Oz2 (3)
where the terms at the left side are constant over the whole y-z plane. This is equivalent toa 2-D thermal equation with a uniform heat generation over the whole region which can be
expressed as
168

w_b r bZrk by2 bz 2 (4)
When this heat transfer equation is solved, the temperature distribution obtained isequivalent to the velocity field for the flow equation. The longitudinal permeability can besolved accordingly.
2-D thermal elements are used in the calculation. This is a four-node plane element with a
single degree of freedom, temperature, at each node. The reference temperature is set aszero at the fiber surface. Therefore the values of the temperature are directly used as therelative magnitude of the temperature rise.
The computational cell is set as a rectangle of Ly by Lz m y and z directions respectively.
Symmetry boundary conditions are set at four/:ell boundaries, y--0, y=Ly, z=0, and z=Lz.
b) Transverse Permeability
For the transverse flow with small Reynolds number, the Stokes equation becomes
1 _ = V2VzI.t bz
V 2 b 2 b 2--_+_
by 2 bz 2 (5)
The permeabilityK iscalculateddirectly from theaveraged flow rateaccordingto thedefinition.
The 2-D 4-node fluid element is used in the simulation. In the calculation the option is setas steady state flow, and the constants for the body force are set to be zero. Also the localReynolds number for the elements is set to be much smaller than 1. The boundary
conditions set on the representative cell _(Ly by Lz) are: 1) at the surfaces of z=0 and z=Lz,Vz=0 and _V_--0; 2) at the surfaces of y=0 and y=Ly, Vz=0 and _V_/i_,---0; and 3) thepressure difference (P)y=0 - (P)y=L = Ap. Along the surfaces of y=O and y_Ly, thepressure is also constant.
DENSELY PACKED HOLLOW STRUCTURES
Numerical simulationson hollow hexagonal packing and hollow squarepacking am
reportedin [8].These hollow packing structurespossessrelativelylow ultimatefibervolume fraction,0.589 for hollow squarepacking and 0.605 forhollow hexagonal
packing. The experimentaldataoftheultimatefibervolume fractionforan alignedfiberbundle was inthe range of 0.78to 0.85 [2].In thispartof the numerical simulation,
hexagonal and squarepacking structuresarestillused,with a portionof the fibersremoved
ina certainpattern.They become denselypacked hollow structures.In otherwords, the
169

denselypacked fibers are assumed to have sparsely distributed voids in the bundle.However, since they are densely packed, there are always "good" lock mechanisms. Inother words, these voids are not connected to each other and there is no direct flow pathwithin the bundle.
Since there are different amounts of the fibers removed in different mesh models, theultimate fiber volume fraction Va will be different for each of the options. Therefore thissimulation reveals more the effect of Va on the permeability variations.
The computation cells are chosen to be rectangular, so that mirror symmetric boundaryconditions can be set at each side. The hollow packing settings are also constructed such
that the isotropic behavior of the permeability is always preserved.
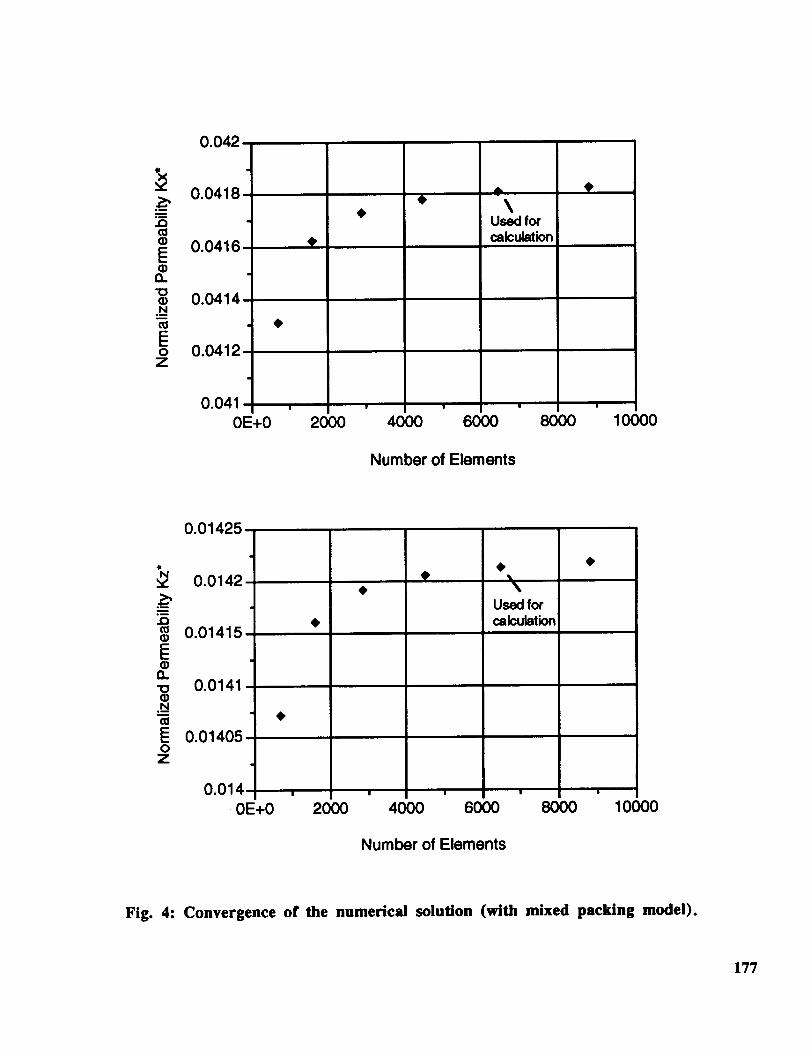
Different computational cells are shown in Figs. 2 and 3. Finite element meshes of thesecomputational cells are also shown in these figures. The convergence of the calculations ischecked by comparing the results with available "exact" solutions for hexagonal and squarepacking, and by varying mesh size and increasing element and node numbers. Theconvergence of the calculation for other structures is also checked on selected samples.Fig. 4 shows the convergence of the calculation versus element number for the mixedpacking structure. When determining the mesh size, a compromise is reached byconsidering both the accuracy and the computational time.
QUASI-RANDOM PACKING MODEL
In studying the transverse stiffness of the unidirectional composites, Adams and Tsai [12]proposed a numerical method which used a random array of cells to represent the micro-level composite structure. We adopt the same approach and build a random set of cells torepresent the micro-level fiber assembly with some random disturbance. In other words,the fiber assembly contains closely packed fibers and some open spaces among fibers,which are randomly placed into cells.
The representative volume contains twenty-five unit cells (5 by 5). It is a quarter of therepresentative volume of 10 by 10, as shown in Fig. 5. Mirror symmetry boundaryconditions are imposed on the 5 by 5 cell to reduce the amount of the calculation. It is alsoassumed that the cell retains the isotropic permeability, which means the permeabilities in
the y and z directions are the same. This is realized by the symmetry condition imposed onthe +45 degree diagonal.
Two random effects are investigated. One is the random packing pattern, which meanssome of the cells are filled with fibers while others are empty. The other is the random
positioning of fibers within the cell "box", which means fibers are placed at the off-centerlocations in cells.
The random function in the FORTRAN program language is used to generate the random
cell packing and the random center positions. The random function generator in theprogram is controlled by the seed number. In order to obtain the randomness of the seednumber, the time function was used which was related to the time to the one hundredth of asecond. The random number obtained from the time function was then transformed into a
series of random seed numbers. For each random fiber packing, 15 random numbers wereassigned to 25 cells under the rule of symmetry to the diagonal. These cells were rankedaccording to the magnitude of the random number. Then the lowest N cells were chosen asfilled with fibers, where N was determined according to the fiber volume fraction and fiberradius. This program was named as RAND-F. For the random center positions, 15random numbers were transformed to a value between -8 and +_i respectively, where _iwas
170

the maximum offset of the fiber center position determined by the cell mesh condition andthe fiber radius. This program was named as RAND-D.
Automatic meshing was used to generate different random packing models. As mentionedearlier, three sets of random packings were tried. The first was the random occupancy offiber cells, the second was the fully occupied fiber ceils with random offset fiber centerpositions, and the third was the combination of these two, which meant only some cellswere randomly f'dled with fibers which were located at random off-center positions.
For the random occupancy of fiber cells, two basic unit ceils were setup to represent thecells with and without fibers, as shown in Fig. 5. The packing pattern generated from the
RAND-F program was used as the input, and indices 1 and 0 were assigned tocorresponding ceils. 25 local coordinate systems were used for these cells and they werelocated at the center of these cells. Meshing was done for each cell according to the givenindex (1: with fiber; 0: without fiber). Finally these meshed ceils were combined together,repeated nodes were merged, and boundary conditions were set accordingly.
For the random offset position of fiber centers, the fiber center positions were firstdetermined by the RAND-D program. These positions were used to generate the fiberboundaries within the cell. The original cell center positions were used to generate cellboundaries. Then the meshes were automatically generated. Because the offset of the fibercenters sometimes introduced difficulty in automatic meshing, errors did occur and the pre-
processing was aborted. Due to the limitation of the automatic meshing used, fibers werealways contained in the original cells, which greatly limited the extent of the variation onthe permeability.
For the third situation of random fiber cells and random fiber center positions, both
programs (RAND-F and RAND-D) were used and automatic meshing was appliedaccordingly.
The computational error is directly related to the mesh size. This was checked for aparticular case by varying the mesh size. As a compromise of the accuracy and thecomputational time, the mesh model chosen contained 144 elements (12 by 12) for cellswithout fibers, and 240 or 288 elements (48 in the circumferential direction and 5 or 6 in
the radial direction) for cells with fibers. The estimated error in the worst case was lessthan 1 percent, and in most other cases, the error was around 0.2 to 0.5 percent.
RESULTS AND DISCUSSIONS
The permeability results of the densely packed fibers with introduced openings are shownin Fig. 6 and 7 for longitudinal and transverse directions respectively. These structureshave definite packing patterns. All the gaps among fibers are with the same width. All theopenings introduced are isolated. Therefore, if we keep squeezing these fiber bundles, thevalues of Va will be different in each case. It is shown in the figures that with relativelyhigh fiber volume fraction, the effect of Va on the permeability increases.
As we mentioned earlier, the effect of the openings on the permeability is different indifferent flow directions. In the longitudinal flow case, the openings provide the flow pathto the fluid. In the transverse flow case, the openings reduce the gap width among fibers,resulting in higher flow resistance. In Fig. 6, the three cases without introduced openings,hexagonal, square, and mixed packings, show relatively low longitudinal permeability.
The variation of the permeability due to different packing is substantial. In the longitudinal
direction, at the Vf=0.5, the permeability can be about 2.7 times of difference, while in the
171

transversedirection,thedifferencecanbeabout10times. Therefore,with only onevariable, usually the fiber volume fraction Vf, the permeability status of the fiber bundle ispossibly still very uncertain.
Fig. 8 shows the permeability variation of random packing structures. As shown in Fig. 5,there are three groups of packing situations with the randomly placed fiber cells. We definethem as with fiber locking, without fiber locking, and with direct flow path. In the case ofwith fiber locking, there exists a row of fibers or a combination of rows of fibers to lockthe flow if the maximum packing efficiency of that particular packing is reached. In otherwords, fluid has to pass through small gaps within the fiber row. In the case of withoutfiber locking, which means that even at the maximum packing efficiency flow is stillpossible, the relatively large gaps in the diagonal direction of the cell provide easier flowpath for the fluid. In other words, flow paths are mainly in the diagonal directions. In thecase of with direct flow path, there exists a row or a combination of rows of open spaces asthe flow path.
For each of the selected fiber volume fractions, there are options of number of fiber cells.The percentage of the occurrence of each of these three cases depends on the fiber cellnumbers. With 14 fiber cells out of the 25 total cells, there were a few cases of direct flow
path, and the rest were with fiber locking or without fiber locking. With 16 fibercells, the occurrence of direct flow path diminished so that there were mainly cases of withfiber locking and without fiber locking. With 18 or more fiber cells, most of the caseswere with the locking of fibers.
The number of cells with fibers is also limited by the fiber volume fraction. With relativelylow fiber volume fraction, less fiber cell numbers are possible. For example, for Vt=0.4,we tried fiber cell numbers of 14, 16, 18, and 20. For Vt=0.45, fiber cell numbers were16, 18, and 20. For Vf=0.5, fiber cell numbers were 17 and 19.
The simulation of the randomly packed fibers was done on these three groups. With 14 to20 fiber cells, the simulation covers Vf range of 0.2 to 0.5. With 25 fiber cells but randomcenter positions, the range of Vf was from 0.2 to 0.7. With 18 to 20 fiber cells and offsetfiber center positions, the range of Vf was 0.4 to 0.55. For each selected case, 25simulations were performed with different random settings. However, because of theautomatic mesh limitation, only meshes with "good" shape were accepted for the finite
element calculation. Therefore the successful simulations for each case were usually lessthan 25. The total simulation cases were over 700 for longitudinal and transverse flowrespectively.
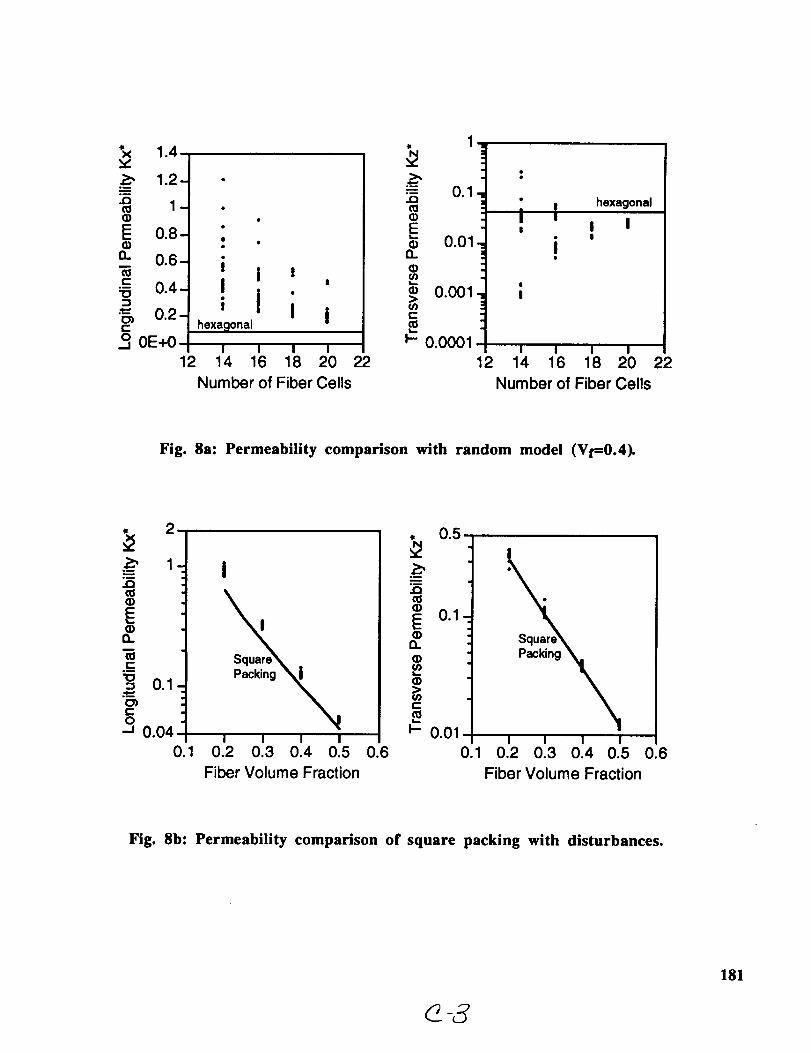
Fig. 8a shows the data variation of the permeability when different numbers of the fibercells are used in the simulation. With each selected fiber cell number, there are about 20
data points. The variations are very substantial. In the longitudinal case, the difference isas high as more than five times. In the transverse direction, the difference can be as high asover a hundred times.
Hexagonal packing is used as a reference in Fig. 8a. In the longitudinal flow case, it is alow limit of the permeability, since it possesses the most uniformly distributed flowchannels. In the transverse flow case, however, there were cases that the permeability ishigher or lower than that of the hexagonal packing. In the extreme cases, fibers may fullylock the flow path when they contact with each other, or they may be far away from eachother so that a large flow path with minimum flow resistance may form within the bundle.
In Fig. 8a about the transverse permeability, three groups of data can be distinguished. Inthe 14 fiber cell case, the group with locked fibers shows the normalized permeability of
[72

about 0.001, the group without fiber locking shows the normalized permeability of about0.04, and the group with direct flow path shows the normalized permeability of about 0.2.With 16 fiber cells, only two groups appear, with fiber locking and without fiber locking.
The permeability values are about 0.08 and 0.04 respectively. With 18 or more fiber cells,only locked fiber cells exist. Also with the increase of the fiber cells, the permeability dataof locked fibers gradually gets close to that of the hexagonal packing.
Fig. 8b shows the variation of the permeability when all 25 cells are filled with fibers, but thefiber center positions are randomly determined. The variation of the permeability in both
longitudinal and transverse cases is substantially smaller than that in Fig. 8a. It is alsointeresting to see that in the longitudinal case, the permeability of these random fiber sets is
always higher than that of the original square packing. In the transverse case, however, thevariation appears in both directions, resulting in either higher or lower permeability values.This agrees with the results shown in Fig. 1, where the longitudinal permeability data fromexperiments is substantially higher than that of the idealized packing, and the .transversepermeability data from experiments is more close to that of the idealized packing.
For a real fiber bundle under the processing conditions, the macro-level status of the fiberbundle is already determined. In other words, the relative positions of the fibers within thebundle are somewhat settled. Gently squeezing the fiber bundle will not change themacro-level status of the bundle. With this relatively determined fiber bundle status, the
variation of the permeability for a certain fiber bundle is limited. However, different fiberbundles may have substantially different status, such as opening size within the bundle.Therefore the permeability from bundle to bundle may be very different. To capture thismacro-level fiber bundle status, additional status variables are needed. In [2] and [7], theultimate fiber volume fraction is introduced in addition to the average fiber volume fraction.
More discussions and proposed models on selecting the ultimate fiber volume fraction as
the additional permeability parameter are presented in [13].
SUMMARY
Finite element simulations on the variation of the permeability of an aligned fiber bundlehave been carried out. These simulations are based on the idealized packing with
introduced openings, and based on the quasi-random fiber cell models. The results showthat even with the same fiber volume fraction, the permeability variation can vary
substantially. The disturbance within a fiber bundle has to be considered in order to reducethe uncertainty in the estimation about the permeability.
The numerical simulation results also suggest that in addition to the average fiber volumefraction, other parameters describing the macro-level status of a fiber bundle are needed.The effect of the ultimate fiber volume fraction on the permeability is investigated throughthe simulation.
ACKNOWLEDGEMENTS
The authors would like to thank D.J. Lawrie for many helpful discussions and technical
supports during the course of this work.
173

REFERENCES
1. Williams, J.G., Morris, C.E.M., and Ennis, B.C., "Liquid Flow Through Aligned
Fiber Beds", Polymer Engineering and Science, Vol. 14, No. 6, June, 1974, pp.413-419.
2. Gutowski, T.G., et. al., "Consolidation Experiments for Laminate Composites",
Journal of Composite Materials, Vol. 21, June, 1987, pp.650-669.3. Lain, R.C. and Kardos, J.L., "The Permeability of Aligned and Cross-Plied Fiber Beds
During Processing of Continuous Fiber Composites", Proceedings of AmericanSociety for Composites, Third Technical Conference, Seattle, Washington, September,
1988, pp.3-11.4. Lam, R.C. and Kardos, J.L., "The Permeability and Compressibility of Aligned and
Cross-Plied Carbon Fiber Beds During Processing of Composites", Proceedings of47th Annual Technical Conference (ANTEC'89), SPE, New York, 1989, pp.1408-1412.
5. Skartsis, L. and Kardos, J.L., "The Newtonian Permeability and Consolidation ofOriented Carbon Fiber Beds", Proceedings of American Society for Composites, FifthTechnical Conference, E. Lansing, Michigan, June, 1990, pp.548-556.
6. Kim, Y.R., McCarthy, S.P., Fanucci, J.P., Nolet, S.C., and Koppernaes, C., "ResinFlow Through Fiber Reinforcements During Composite Processing", SAMPEQuarterly, April, 1991, pp. 16-22.
7. Sangani, A.S. and Acrivos, A., "Slow Flow Past Periodic Arrays of Cylinders withApplication to Heat Transfer", International Journal of Multiphase Flow, Vol. 8, No.3, 1982, pp.193-206.
8. Berdichevsky, A.L. and Cai, Z., "Estimation of the Permeability of Aligned Fibers withthe Self-Consistent Method and FE Simulation", accepted by Polymer Composites,1992.
9. Scheidegger, A.E., The Physics of Flow Through Porous Media, University of TorontoPress, 1974, pp.75-78.
10. Kohnke, P.C., ANSYS Engineering Analysis System Theoretical Manual, SwansonAnalysis Systems, Inc., 1989.
11. Fluid Dynamics International, FIDAP Theoretical Manual, 1990.12. Adams, D.F. and Tsai, S.W., "The Influence of Random Filament Packing on the
Transverse Stiffness of Unidirectional Composites", Journal of Composite Materials,Vol. 3, July, 1969, pp.368-381.
13. Cai, Z. and Berdichevsky, A.L., "An Improved Self-Consistent Method for Estimatingthe Permeability of a Fiber Assembly", accepted by Polymer Composites, 1992.
174

°--
•_ 10-
0.. 1
¢-°--
"O" 0.1
t-O
._]
._ o.oiN
_ 0.001t,..
OZ
!13
I |
).2 ).3
Fiber Volume Fraction
0
Kozeny-Carman (kx=0.5) [3]
FE (Hexagonal Packing) [8]
D FE (Square Packing) [8]
._z,1
i 01 _--,
m 0.01
_'__ __ O0Ol-1_ 0.0001-_
0.00001.d_ -" rho 0.000001 .....
z 0.2 0.3 0.4 0.5 0.6 0.7 0.8
Fiber Volume Fraction
Kardos kz=l 1.0 [3] []
Gutowski kz=0.2; Va=0.8 [2] O
FE (Square packing) [8]
FE (Hexagonal Packing) [8]
Fig. 1: Comparison of the permeability of idealized packing and other data.
175

0000
0 O00 O0 0
oo,_ooo o0 ,010 0O_o_oo
Va=0.70537
00000000 "_00
oooo_OoOOoO00kDO,O000O0 '_0 00000000
Va-0.85022
00000000o o @o--_ o
O0OODO0000000 @--000 00000000000
0 000 0 000000000
OO
oOoOOOOo°_o_°_oo_ • oo
..OlO
Va-0.75575
000000@'00_I 000
0_00,00000 _-O0000 00000000o00o 0o0
000o00
Val0.83132
Va=0.80613
Fig. 2: Densely packed hollow hexagonal structures.
00000 0000000000 000 0
O0 O0 0000000000 0000000000 00000
Va-0.73631
00000 000000 000 000 000000 00000
0 0 0 0 000
00000 00000Va=0.63814 Va-0.68722
O0
O00 )000000( 0000oo _eao00_ _0ooo, 2-_;_oooc__oOO
0Mixed Hexagonal& Square Packing
(va=o.8505)
Fig. 3: Densely packed hollow square and mixed structures.
176
._z,o_
J_03
G)(3.
a).N_03
Oz
0.042-
0.0418
0.0416.
0.0414.
0.0412.
Av
\Used forcalculation
0.041 .....
0E+0 2000 4000 6000 8000 10000
Number of Elements
°_
.JD
(1)
(9O.
"10
.N_03
0.01425-
0.0142
0.01415
0.0141
{_ 0.01405Oz
0 014-• I l I
OE+O 2000 4000 6000
•\Used forcalculation
• I
8O0O 10000
Number of Elements
Fig. 4: Convergence of the numerical solution (with mixed packing model).
177

III f
°°°:o,,,,°,,'°"o i_0___
lele elOi_l _ ele!_ elel_ ei=io:°:°i ,°oo:o:i,,
Computational Cell for "Random" Packing
Randomly placed fibers
Fibers with random center positions
Fig. 5: Computational cell for "random" packing structures.
178

0.1
)#.m
._c"10
0.01.C0
.-I
0.001
0.2
@
irl
o0
I ' I ' I ' I0.3 0.4 0.5 0.6
Fiber Volume Fraction
+
[] Q&#
0
O0 X O
0
A
OX []
O
• I •0.7 0.8
o hex Va=0.9069
n squ Va=0.7854
o hol-hex Va=0.6046
¢, hol-squ Va=0.5891
x mixed Va=0.8505
m hol-squ Va=0.7363
o hol-squ Va=0.6872
+ hol-hex Va=0.7054
hol-hex Va=0.8061
v hol-hex Va=0.8502
e hol-hex Va=0.7558
# hol-hex Va=0.8313
Fig. 6: Normalized longitudinal permeability comparison.
179

0.1
0.01
E
u),- 0.001(1)
c
F-
0.0001
0.00_1
!-I
81o°i-I-
4,
0
D
a
-I-
• I ° I).2 0.4 0.6
Fiber Volume Fraction
0
0
&El X
&
El
0.8
o hex Va=0.9069 x mixed Va=0.8505 & hol-hex Va=0.8061
El squ Va=0.7854 [] hol-squ Va=0.7363 v hol-hex Va=0.8502
o hol-hex Va=0.6046 o hol-squ Va=0.6872 e hol-hex Va=0.7558
_, hol-squ Va=0.5891 + hol-hex Va=0.7054 # hol-hex Va=0.8313
Fig. 7: Normalized transverse permeability comparison.
180
"x 1.4v
._ 1.2-J_¢0 1-(9
_ 0.8-
o.. 0.6-
.c_ 0.4 -"0
c_ 0.2-c0_ 0E+0
j . =
hexagonal
I I I I12 14 16 18 20 22
Number of Fiber Cells
, 1
._z,
._ 0.1ca
E0.01
n
• 0.001>
c-
F- 0.0001
• I hexagonalI ', I I
i '
e
I
I I I I
12 14 16 18 20 22
NumberofFiber Cells
Fig. 8a: Permeability comparison with random model (Vf=0.4).
• 2
.__ 1-=_
m
E(1)
13.
.¢_10= 0.1
C
o, 0.04Packing
I I I I0.1 0.2 0.3 0.4 0.5 0.6
Fiber Volume Fraction
, 0.5
,_z,.0m
I:L
a)t_
¢/)t--
I.- 0.01I I I I
0.1 0.2 0.3 0.4 0.5 0.6
Fiber Volume Fraction
Fig. 8b: Permeability comparison of square packing with disturbances.
181
