on the chopping block: examining the fairness of observational
TRANSCRIPT

O N T H E C H O P P I N G B L O C K
AbstractSince the No Child Left Behind legislation, the assessment of teacher effectiveness (TE) for accountability purposes has been at the forefront of educational policy. Prominent among both already-existing and newly developed measures is the Classroom Assessment Scoring System (CLASS; Pianta, La Paro, & Hamre, 2008). The CLASS is used currently in over 40 states across the country (Teachstone, 2013; Office of Head Start, 2014) to make high-stakes decisions for teachers, including compensation, promotion, and termination. For this reason, it is important that measures like the CLASS are evaluated by research. Our research hypothesizes that if measures like the CLASS can be reliably used for high-stakes outcomes, then scores for individual teachers should remain stable over time, and particularly so within units of thematically related lessons. We used a single-subject design, reflective of the real-world uses of TE scores, to assess score stability for two kindergarten teachers purposively selected from a larger database. Stability ranges were created around mean scores and then visually examined. Significant variability was found between lessons for both teachers, particularly in the instructional support domain of the CLASS. We conclude that single observations are likely not sufficient to reliably evaluate teachers’ instructional effectiveness. Further research should investigate: (1) if similar variability is found with a larger number of teachers when observed for longer periods of time; (2) if this instability is found when using other TE measures; (3) the factors that contribute to observed instability; and (4) the number of teacher observations needed to obtain accurate views of teachers’ effectiveness patterns.
Wilson, C. B., Thomas, R. J., and Capps, L. P. (2014). On the chopping block: Examining the fairness of observational data of teacher effectiveness. Journal of Purdue Undergraduate Research, 4, 66–71. http://dx.doi.org/10.5703/jpur.04.1.09
Keywordseducation, kindergarten, classroom, teacher effectiveness, evaluation, observational measures, CLASS, instructional support, stability, single-subject design
Cody B. Wilson graduated in May 2014 and now teaches kindergarten in inner-city Indianapolis. He is simultaneously pursuing his master’s degree in teaching from Marion University.
Rebekah J. Thomas is a senior major-ing in elementary and special educa-tion with minors in Jewish and global studies. Upon graduation, she hopes to work in developing nations with orphans and underprivileged children.
Laura P. Capps is a junior majoring in special education and elementary education with minors in global studies and Spanish. She plans on becoming a special education teacher upon graduation.
Student Authors
Youli Mantzicopoulos is a professor of educational psychology in the College of Education. She received her PhD in educational psychology and human development from the University of California at Berkeley. Her research focuses on the effects of formal and informal learning contexts on children’s learning and motivation in specific content areas such as reading and science.
Mentors
Helen Patrick is a professor of educa-tional psychology in Purdue Univer-sity’s College of Education. She earned a BA and MA in education from the University of Auckland, New Zealand, and a PhD in education and psychology from the University of Michigan. Her research addresses classroom environ-ments, and associations of teachers’ instructional practices with student motivation, learning, and engagement.
66 journal of purdue undergraduate research: volume 4, fall 2014http://dx.doi.org/http://dx.doi.org/10.5703/jpur.04.1.09
INTRODUCTION
Teacher accountability has recently become one of the greatest concerns in educational policy. No Child Left Behind, the 2002 reauthorization of the Elementary and Secondary Education Act, added extensive accountability requirements to which teachers and schools must adhere or risk losing federal funding. The current federal education initiative, Race to the Top, also requires that states use teacher effectiveness (TE) measures in order to receive full funding. In fact, a rather significant portion of the Race to the Top funding criteria is based on teacher performance (U.S. Department of Education, 2009). The results from TE measures are used for teacher accountability by linking them to high-stakes decisions about teachers’ careers. These decisions include (but are not limited to) compensation, promotion, public labeling, and termination (Indiana Department of Education, 2014).
Measures of TE have been used in research for decades but are only now at the forefront of policy and decision making. TE measures are now being used for purposes beyond the ones for which they were originally developed. Because the stakes attached to their scores are so high, the accuracy of TE measures needs to be substantiated by rigorous research, and their appropriateness for teacher accountability purposes needs to be evaluated. Decisions based on erroneous scores may have devastating consequences for teachers.
Even though two to three observations per year are standard for teachers across states, there is little evidence that this number of observations is sufficient to provide an accurate snapshot of a teacher’s effectiveness. In fact,
there is some evidence that teachers’ scores vary from day-to-day and across contexts (Kane, McCaffrey, Miller, & Staiger, 2013). Teachers do have lower-than-average or exceptional days, and there are significant concerns that a small chunk of time may not capture a teacher’s overall effectiveness patterns. If this turns out to be the case, the end result of an observation would not be reflective of the teacher’s typical practices and—in our terms—would not be a fair assessment of a teacher’s effectiveness.
Our research investigates this particular issue with the Classroom Assessment Scoring System (Pianta et al., 2008), a widely used measure of TE in early education. In fact, the CLASS has recently been adopted as the mandatory TE measure of the federally funded Head Start program (Office of Head Start, 2014), albeit on the basis of very limited evidence about this measure’s stability. Studies that have evaluated the measure’s consistency have reported significant variability in teaching effectiveness scores even when teachers are observed within the same day (Curby et al., 2011). Of note, for data analysis purposes, the researchers averaged TE scores observed within the same day across a large number of teachers. However, because the real-world applications and implications of a teacher’s score remain on the individual level, our research uses a single-subject design to evaluate individual variability in TE scores over time. We hypothesize that if the CLASS can be used as a reliable observational assessment of TE, its scores should be stable for an individual teacher from one day to the next. Whereas previous studies of the CLASS have not examined whether stability is influenced by the content area taught, we expect that the greatest stability of TE scores will occur when lessons are taught in a sequence that addresses the same topic.
Cody B. Wilson, Rebekah J. Thomas, and Laura P. Capps, Elementary and Special Education
O N T H E C H O P P I N G B L O C K : Examining the Fairness of Observational Data of Teacher Effectiveness
on the chopping block 67
THE CLASSROOM ASSESSMENT SCORING SYSTEM
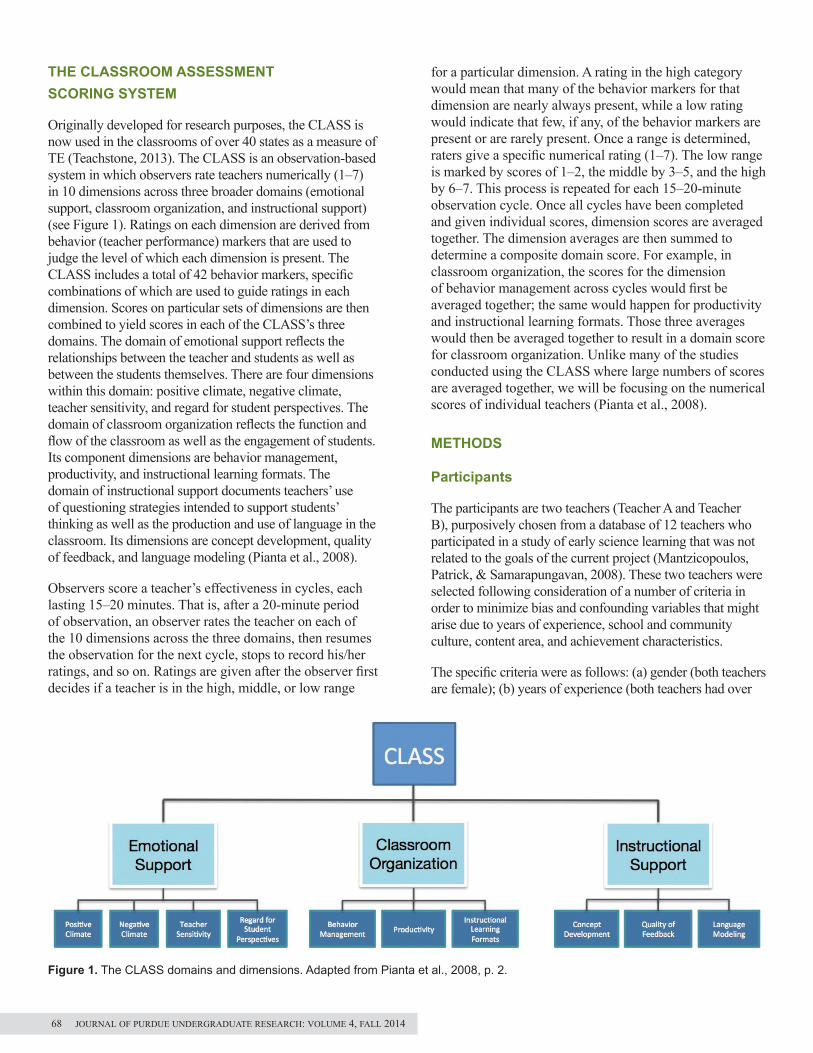
Originally developed for research purposes, the CLASS is now used in the classrooms of over 40 states as a measure of TE (Teachstone, 2013). The CLASS is an observation-based system in which observers rate teachers numerically (1‒7) in 10 dimensions across three broader domains (emotional support, classroom organization, and instructional support) (see Figure 1). Ratings on each dimension are derived from behavior (teacher performance) markers that are used to judge the level of which each dimension is present. The CLASS includes a total of 42 behavior markers, specific combinations of which are used to guide ratings in each dimension. Scores on particular sets of dimensions are then combined to yield scores in each of the CLASS’s three domains. The domain of emotional support reflects the relationships between the teacher and students as well as between the students themselves. There are four dimensions within this domain: positive climate, negative climate, teacher sensitivity, and regard for student perspectives. The domain of classroom organization reflects the function and flow of the classroom as well as the engagement of students. Its component dimensions are behavior management, productivity, and instructional learning formats. The domain of instructional support documents teachers’ use of questioning strategies intended to support students’ thinking as well as the production and use of language in the classroom. Its dimensions are concept development, quality of feedback, and language modeling (Pianta et al., 2008).
Observers score a teacher’s effectiveness in cycles, each lasting 15‒20 minutes. That is, after a 20-minute period of observation, an observer rates the teacher on each of the 10 dimensions across the three domains, then resumes the observation for the next cycle, stops to record his/her ratings, and so on. Ratings are given after the observer first decides if a teacher is in the high, middle, or low range
for a particular dimension. A rating in the high category would mean that many of the behavior markers for that dimension are nearly always present, while a low rating would indicate that few, if any, of the behavior markers are present or are rarely present. Once a range is determined, raters give a specific numerical rating (1‒7). The low range is marked by scores of 1‒2, the middle by 3‒5, and the high by 6‒7. This process is repeated for each 15‒20-minute observation cycle. Once all cycles have been completed and given individual scores, dimension scores are averaged together. The dimension averages are then summed to determine a composite domain score. For example, in classroom organization, the scores for the dimension of behavior management across cycles would first be averaged together; the same would happen for productivity and instructional learning formats. Those three averages would then be averaged together to result in a domain score for classroom organization. Unlike many of the studies conducted using the CLASS where large numbers of scores are averaged together, we will be focusing on the numerical scores of individual teachers (Pianta et al., 2008).
METHODS
Participants
The participants are two teachers (Teacher A and Teacher B), purposively chosen from a database of 12 teachers who participated in a study of early science learning that was not related to the goals of the current project (Mantzicopoulos, Patrick, & Samarapungavan, 2008). These two teachers were selected following consideration of a number of criteria in order to minimize bias and confounding variables that might arise due to years of experience, school and community culture, content area, and achievement characteristics.
The specific criteria were as follows: (a) gender (both teachers are female); (b) years of experience (both teachers had over
Figure 1. The CLASS domains and dimensions. Adapted from Pianta et al., 2008, p. 2.
68 journal of purdue undergraduate research: volume 4, fall 2014
20 years of experience); (c) school context (both teachers had worked in the same school for over 20 years); (d) grade-level assignment (both teachers taught half-day kindergarten in the morning); (e) student background (classes taught by both teachers come from comparable socioeconomic backgrounds and comparable achievement levels); and (f) time of year (both teachers were observed during the spring semester to avoid variables that could include teacher inexperience with specific student behavior and other situations unique to the beginning of the school year). Most importantly, the content of the curriculum presented by the teachers was comparable; each teacher taught a sequence of lessons on life science. We observed and scored each lesson, from the beginning of the unit to its conclusion.
Observation Procedures
The CLASS, version kindergarten through third grade, was used to code a sequence of video-recorded lessons from each teacher. Teacher A and Teacher B were observed for 8 and 11 consecutive lessons, respectively. The lessons for Teacher A varied in duration from 19 to 51 minutes (M = 34), whereas the lessons for Teacher B lasted from 25 to 68 minutes (M = 46). Consistent with the CLASS observation protocol, each lesson was divided into cycles of equal duration, each varying from approximately 15‒20 minutes. For example, a 30-minute lesson was split into two 15-minute cycles, whereas a 59-minute lesson was split into three, approximately 20-minute cycles.
To ensure inter-rater reliability, the lessons were scored by trained and certified CLASS observers, one of whom was the third author of this article. Formal certification requires observers to be able to score with a theoretical “true” score 80% of the time. This theoretical “true” score is determined by Teachstone, using “master coders” for the purposes of reliability measurement (Teachstone, 2013). Observers of our particular research also were trained to remain within 80% reliability of each other.
Analytic Strategy
Previous tests of the CLASS have used large samples of teachers to obtain averages across the three domains in order to generalize findings to the entire population of teachers. However, aggregated scores are minimally informative when used for real-world purposes (i.e., accountability) because they provide no information about an individual teacher’s progress or patterns of performance over time. Thus, to evaluate our data, we chose a time-series, single-case research design (Gast, 2010). This methodological choice is appropriate because it allows for an in-depth examination of the cases over time and is consistent with the use of the scores for teacher evaluation purposes in educational contexts.
We examined the stability of each teacher’s scores using visual inspection of the plots of scores on daily lessons over time within each domain as well as across domains. We examined trends in the data by evaluating two pieces of evidence for each of the three CLASS domains. First, we examined the plots for evidence of changes in slope (i.e., evidence of decline or growth in scores over time). Next, we evaluated the variability (fluctuations) in teacher’s scores by creating a “stability envelope” (Gast, 2010) around each teacher’s average score. To construct the stability envelope, we followed recommendations from Gast (2010) pertaining to stability ranges for free operant behaviors (i.e., teacher behaviors that are shaped by classroom consequences and may recur in the course of instruction) with more than five observations per participant. Thus, we created a 10% confidence interval around each teacher’s mean score in each CLASS domain. Specifically, after calculating and plotting each teacher’s lesson score on each domain, we computed the stability envelope (confidence interval) using a 10% criterion above and below the mean to plot these constants (parallel lines to the mean). The space between these two lines is considered the teacher’s stability range. To measure how stable a teacher’s scores were, we documented the percentage of times that her scores fell within her own stability range.
RESULTS
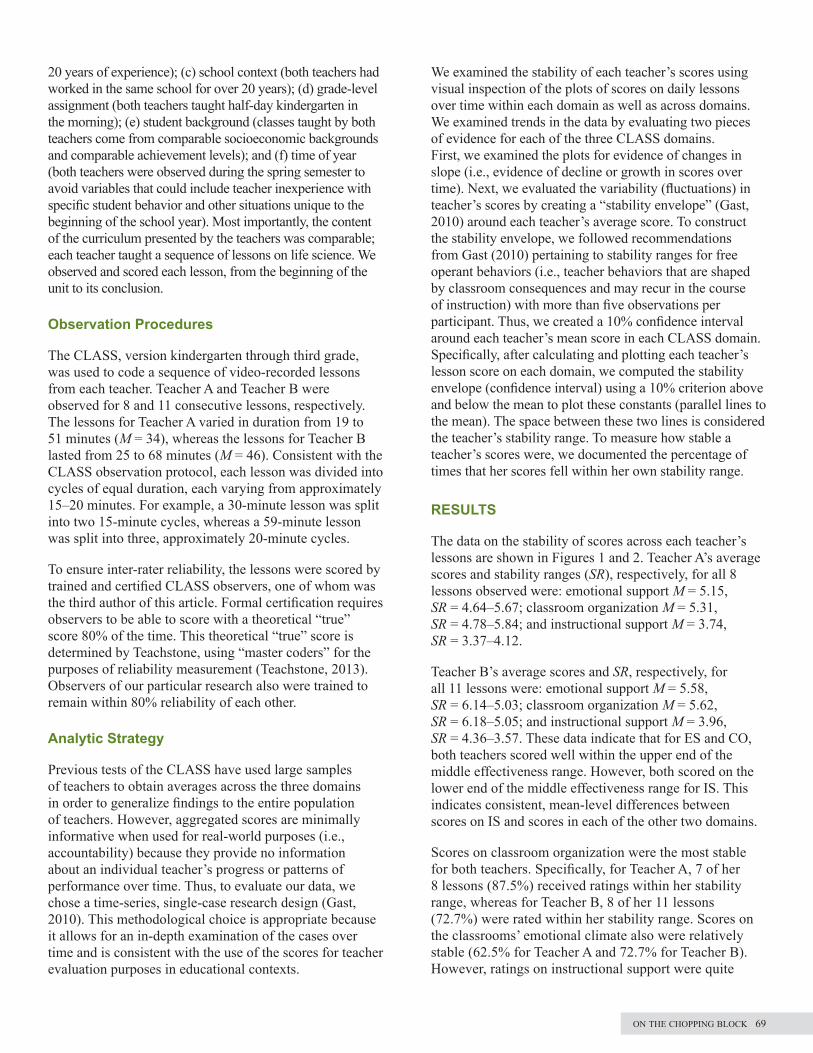
The data on the stability of scores across each teacher’s lessons are shown in Figures 1 and 2. Teacher A’s average scores and stability ranges (SR), respectively, for all 8 lessons observed were: emotional support M = 5.15, SR = 4.64‒5.67; classroom organization M = 5.31, SR = 4.78‒5.84; and instructional support M = 3.74, SR = 3.37‒4.12.
Teacher B’s average scores and SR, respectively, for all 11 lessons were: emotional support M = 5.58, SR = 6.14‒5.03; classroom organization M = 5.62, SR = 6.18‒5.05; and instructional support M = 3.96, SR = 4.36‒3.57. These data indicate that for ES and CO, both teachers scored well within the upper end of the middle effectiveness range. However, both scored on the lower end of the middle effectiveness range for IS. This indicates consistent, mean-level differences between scores on IS and scores in each of the other two domains.
Scores on classroom organization were the most stable for both teachers. Specifically, for Teacher A, 7 of her 8 lessons (87.5%) received ratings within her stability range, whereas for Teacher B, 8 of her 11 lessons (72.7%) were rated within her stability range. Scores on the classrooms’ emotional climate also were relatively stable (62.5% for Teacher A and 72.7% for Teacher B). However, ratings on instructional support were quite
on the chopping block 69

unstable. For Teacher A, 4 out of her 8 lessons (50%) were outside her stability range, whereas 8 of the 11 lessons (72.7%) taught by Teacher B were outside her stability range. This is illustrated in Figure 2.
DISCUSSION
This paper adds to the literature on the assessment of teacher effectiveness in several important ways. First, it examines the stability of teacher scores on an individual basis, rather than across large averages of teachers. This is an important distinction because of the actual use of this evaluation measure in school districts. Second, it
demonstrates that there is considerable score variability across the three domains, and especially within the instructional support domain, when lessons are examined over an extended time period. Third, our research further appears consistent with recent findings that TE ratings are considerably lower in the IS domain than the ES and CO domains (e.g., Plank & Condliffe, 2013; Praetorius, Pauli, Reusser, Rakocsy, & Klieme, 2014).
Specifically, both Teacher A and Teacher B showed some degree of variability in all three domains; however, the largest departures from stability were found in the instructional support domain. Only 50% of Teacher A’s lesson scores fell within her stability range, whereas less
Figure 2. Patterns of change in teachers’ domain ratings over time.
70 journal of purdue undergraduate research: volume 4, fall 2014

than one-third (27%) of Teacher B’s lesson scores fell within her stability range. This means that the data do not support the inference that teachers’ instructional strategies are highly stable from lesson to lesson, even when the lessons follow a thematic sequence within a single unit.
We venture that the instability found within the instructional support domain calls into question the practice of using measures like the CLASS for teacher accountability purposes. The results are especially troubling when considering that our sampling scheme controlled for other competing explanations of TE score fluctuations. Teacher A and Teacher B were selected specifically for their predicted stability (each having taught for over 20 years within the same school, in the same grade level, teaching a thematically grouped set of lessons in a single unit).
Our findings, though based on two representative cases, are remarkably consistent with a small body of recent evidence on the variability of TE over time; not all studies were in kinder-garten classrooms, however (Praetorius et al., 2014). Using generalizability theory to assess stability, Praetorius and col-leagues (2014) documented that middle school teachers’ cogni-tive activation practices (a domain very similar to the CLASS instructional support domain) were highly unstable over a series of five lessons. Of interest, these researchers determined that because classroom climate and organization are relatively stable, only one observation per teacher was needed to gain an accurate measure of TE, whereas at least nine observations were recommended for an accurate assessment of instructional support practices (Praetorius et al., 2014). Together, these find-ings highlight the need for further, more extensive research to document teachers’ instructional support patterns and examine the factors that contribute to variations within and across les-sons over time. Rigorous research is needed for other measures of TE, including Indiana’s RISE and its modifications.
The measurement of TE is an important tool with potential benefits for educational practice. However, before TE assess-ments can be used fairly to make high-stakes decisions that impact the lives and careers of individual teachers, the assess-ments’ reliability and validity must first be rigorously tested. If scores of individual teachers are repeatedly unstable from day-to-day, as was the case in this study, further research and revision of these observational measures is needed. Perhaps, until their fairness is demonstrated, these assessments could be used only to identify areas for ongoing teacher development, without attaching high-stakes outcomes like termination.
REFERENCESCurby, T. W., Stuhlman, M., Grimm, K., Mashburn, A., Chomat-Mooney, L., Downer, J., . . . & Pianta, R. C. (2011). Within-day variability in the quality of classroom interactions during third and fifth grade: Implications for children’s experiences and conducting classroom observations. Elementary School Journal, 112(1), 16‒37. http://dx.doi.org/10.1086/660682Gast, D. L. (2010). Single subject research methodology in behavioral sciences. New York: Routledge.Indiana Department of Education. (2014). Educator effectiveness. Retrieved from http://www.doe.in.gov/improvement/educator-effectivenessKane, T. J., McCaffrey, D. F., Miller, T., & Staiger, D. O. (2013). Have we identified effective teachers?: Validating measures of effective teaching using random assignments. Retrieved from http://www.metproject.org/downloads/MET _Validating_Using_Random_Assignment_Research_Paper.pdfMantzicopoulos, P., Patrick, H., & Samarapungavan, A. (2008). Young children’s motivational beliefs about learning science. Early Childhood Research Quarterly, 23(3), 378–394. http://dx.doi.org/10.1016/j.ecresq.2008.04.001Office of Head Start. (2014). Use of classroom assessment scoring system (CLASSTM) in Head Start. Retrieved from http://eclkc.ohs.acf.hhs.gov/hslc/sr/quality/classPianta, R. C., La Paro, K. M., & Hamre, B. K. (2008). Classroom assessment scoring system manual K-3. Baltimore, MA: Brookes Publishing.Plank, S. B., & Condliffe, B. F. (2013). Pressures of the season: An examination of classroom quality and high-stakes accountability. American Educational Research Journal, 50(5), 1152‒1182. http://dx.doi.org/10.3102/0002831213500691Praetorius, A. K., Pauli, C., Reusser, K., Rakoczy, K., & Klieme, E. (2014). One lesson is all you need? Stability of instructional quality across lessons. Learning and Instruction, 31, 2‒12. http://dx.doi.org/10.1016/j.learninstruc.2013.12.002Teachstone. (2013). Retrieved from www.teachstone.comU.S. Department of Education. (2009). Partners in Reform (Remarks of Arne Duncan to the National Education Association). Retrieved from http://www2 .ed.gov/news/speeches/2009/07/07022009.html
TeacherA B
Emotional SupportM 5.15 5.58Mdn 5.07 5.88SD 0.61 0.52Min 4.25 4.75Max 6.13 6.25M + 10% 5.67 6.14M – 10%% Stable
4.6462.5%
5.0372.7%
Classroom OrganizationM 5.31 5.62Mdn 5.33 5.67SD 0.33 0.70Min 4.67 3.83Max 5.78 6.50M + 10% 5.84 6.18M – 10%% Stable
4.7887.5%
5.0572.7%
Instructional SupportM 3.74 3.96Mdn 3.67 4.33SD 0.57 0.84Min 3.11 2.33Max 4.67 4.83M + 10% 4.12 4.36M – 10%% Stable
3.3750.0%
3.5727.3%
Table 1. Descriptive information for each teacher (across all lessons) by the CLASS domain.
on the chopping block 71