on the concept of risk analysis-driven design - tim · on the concept of “risk analysis-driven...
TRANSCRIPT
Proceedings of the World Tunnel Congress 2014 – Tunnels for a better Life. Foz do Iguaçu, Brazil.
1
1 Introduction
In the current tunneling practice, the Risk Analysis and the structural Design are frequently considered two separate and independent items. On the contrary, according to the Geodata Engineering (GDE) approach they are integrated in one unique rational process, structuring the so-called “Risk Analysis-driven Design (RAdD)”.
In the Figure 1, the basic flowchart is remarked, showing as well as it is combined with the Italian Guidelines for Design (SIG, 1997) to guarantee a complete treatment of all the fundamental items.
Recently, some key concepts of RAdD have been also shared in the AFTES Recommendations (2012).
In the present paper, a short insight in the RAdD approach is presented, with particular reference to some more recent practical applications, developed by the collaboration with Ingeroc (Santiago), mainly involving the access tunnels to the new production level of the El Teniente mine.
2 El Teniente mine
El Teniente Mine, located in the Libertador General Bernardo O'Higgins Region 80 km southeast of Chile’s capital Santiago, is the largest underground copper mine in the world, with more than 2400 kilometers of mine drifts and tunnels producing more than 400000 tons per year of fine copper recovered from the ore, either as refined ingots or as copper cathodes.
As a result of ore processing, nearly 5000 tons of molybdenum are recovered as a by-product.
The owner of the mine, Codelco (Corporación Nacional del Cobre de Chile, División El Teniente), is currently developing the New Mine Level Project to ensure the continuity of the exploitation and the increase of ore production.
The New Mine Level (NML) project, located at 1000m depth, is being planned to extend the life of the mine by 60 years, entering production phase in 2017. New reserves of 2020 million tons at present with 0.86% average copper grade and 220 ppm of molybdenum, will maintain the mine's production at its 137000 tons/day.
On the concept of “Risk Analysis-driven Design”
G. Russo, P. Grasso and L. P. Verzani Geodata Engineering (GDE), Torino, Italy.
A. Cabañas Codelco, Santiago, Chile.
ABSTRACT: In the current tunneling practice, the Risk Analysis and the structural Design are frequently considered two separate and independent items. On the contrary, according to the Geodata Engineering (GDE) approach they are integrated in one unique rational process, completely developed by probabilistic method, structuring the so-called “Risk Analysis-driven Design (RAdD)”. The key points of this innovative approach are presented, with general reference to one of the most recent application, in particular related to the construction of the tunnels to the new productive level of the El Teniente mine (Chile). El Teniente Mine, with more than 2400 kilometers of tunnels excavated is the largest underground copper mine in the world. The tunnel works for the new mine level, located at 1000 m depth, are actually under construction, permitting to complete the design process and check the foreseen geological-geomechanical scenarios.

Proceedings of the World Tunnel Congress 2014 – Tunnels for a better Life. Foz do Iguaçu, Brazil.
2
Figure 1. GDE Risk Analysis path linked to Italian Guide Lines for Underground Works (SIG, 1997).
A significant component of the NML project is the construction of 24 km of access tunnels, which began in March 2012, consisting of two adits (Ltot=6km), proposed by the Contractor (CTM – Constructora de Túneles Mineros, joint venture between Vinci and Soletanche Bachy), and two main tunnels (Ltot=9+9km): a tunnel for vehicular access of personnel and a twin conveyor tunnel for the transport of the ore. All the underground advancements are in conventional drill and blast method (D&B). The construction in process of these tunnels have been described by Decman et al. (2013) and Kontrec et al.(2013).
Figure 2. New Mine Level (NML).
Figure 3. NML Access Tunnel System actually under construction.
3 Key elements of RAdD
The design and construction of long tunnels particularly those at great depth, is generally associated with a high level of risks due to a whole series of uncertainties involved. The risk should not be ignored, but managed through the implementation of a specific Risk Management Plan (RPM, Grasso et al. 2002; 2006), fully integrated in each part of the design study, in accordance to a real development of a "Risk Analysis-driven Design" (RAdD).
Figure 4. Reducing Initial risk.
While it is recommended the specific reference to the cited papers for a detailed insight in the RMP methodology, including the basic definitions and classifications for the Risk Analysis (see also ITA, 2004), in the following focus is concentered to the sequential steps for the RAdD development.
In particular, with reference to the flow chart in the Figure 1, some relevant features of the design process are remarked. As it will be evident, the systematic implementation of the probabilistic approach is a key element in each step of the study.

Proceedings of the World Tunnel Congress 2014 – Tunnels for a better Life. Foz do Iguaçu, Brazil.
3
3.1 Reference geological scenarios
As above commented, the tunnels design and construction involve a high level of risk mainly due to geological-geomechanical uncertainties.
Uncertainty mainly concerns the inherent variability of the input geo-parameters and the real state of each parameter along the tunnel, conditioning the excavation behaviour.
Figure 5. Different type of uncertainties (Hoffman and al., 1994).
The two types of uncertainties described can be reasonably related to the Type A and B reported in the Figure 5 (Hoffman et al., 1994, Russo et al. 1999).
To manage the different types of uncertainties basically the following procedure are applied: Type A: on the basis of the statistical best-
fitting of the available data, adequate probabilistic distributions are associated to each geomechanical parameters (Figure 6);
Type B: three geological-geomechanical scenarios are considered to simulate the reference context: 1) Favorable, 2) Most likely and 3) Unfavorable scenario. Evidently, this approach permits to consider different faults extensions, contacts positions, parameter values, classification assessments, etc. In some case, as for the example reported in the present paper, the Most likely scenario is considered coincident with the Basic Design developed by the Owner (here called “H_lik”) and the effective position with respect the other scenarios is consequently checked.
Figure. 6: Managing parameter variability by best-fitting of the statistical data (above) and probabilistic calculations (below; example of quantitative GSI assessment).
In Figure. 7, the reference “H-Lik” scenario
for the examined example is reported, remarking the presence of n.11 Rock Mass Unit (RMU), as well various faults and tectonic/volcanic contacts between the igneous rock masses.
Figure 7: The reference “H-lik” scenario for the Access tunnels to the new productive level of El Teniente mine.

Proceedings of the World Tunnel Congress 2014 – Tunnels for a better Life. Foz do Iguaçu, Brazil.
4
In Figure 8, a simple example of the expected distributions of the GSI index for the three scenarios is reported, as resulting by the performed additional study.
Figure 8: Example for one RMU of the expected GSI distribution for the three scenarios (note: class 5= GSI<21;…class 1=GSI>80).
3.2 Hazard identification and quantification
Defined the geological setting, the reference context for the Designer is completed by the consequent identification of the main hazard for tunneling and their evaluation in terms of probability of occurrence and the specific intensity.
Two main categories of hazard events are identified in connection to geological and geomechanical issues (Figure 9), namely: Hazard phenomena associated with
unfavorable geological conditions. Geomechanical hazard related to rock mass
behaviour upon excavation.
Figure 9: Identification of the main hazards for tunnel excavation and support.
Geomechanical hazards are mainly related to
ground behaviour upon excavation, thus taking into account the intrinsic properties of rock masses and the associated stress conditions. The forecast analysis for evaluating the response
upon excavation and then the most probable hazard is performed for each RMU by necessarily taking into account both stress and geostructural analyses, as shown in the flow chart of Figure 10.
Figure 10: Simplified scheme for identifying the excavation behaviour by Stress and Geo-structural analyses (Russo and Grasso, 2007).
The reference classification of the excavation
behaviour is consequently based on both stress and geo-structural type analysis (11).
Figure 11: GDE classification of the excavation behaviour (same reference than Figure 10).
The matrix that results from such a double
classification approach allows an optimal focalization of the specific design problem.
Furthermore, a rational choice of the type of stabilization measures may be derived as a function of the most probable potential deformation phenomenon that is associated to the different stress and geo-structural combination.
For the quantification of the probability of occurrence of the hazards, the probabilistic analytical method is applied, by implementing the Convergence-Confinement (C.Carranza T. solution, 2004) for each RMU and geo-scenario. Some examples of the results are presented in Figure 12.
Proceedings of the World Tunnel Congress 2014 – Tunnels for a better Life. Foz do Iguaçu, Brazil.
5
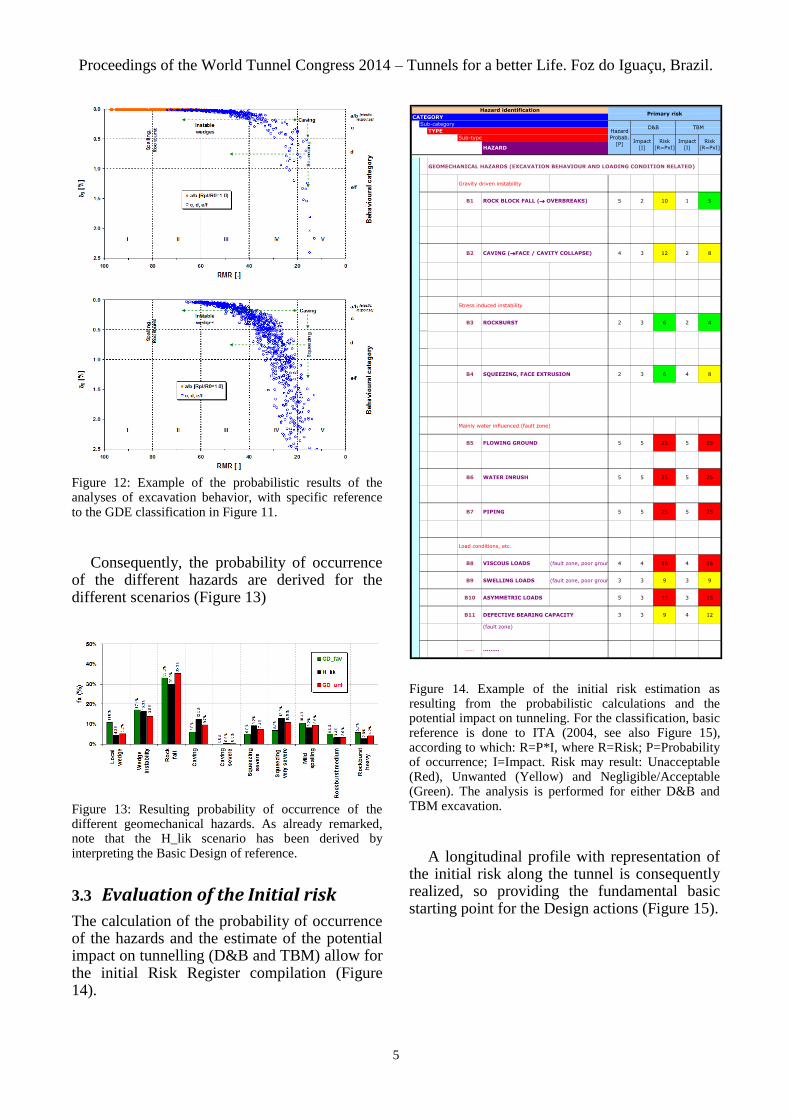
Figure 12: Example of the probabilistic results of the analyses of excavation behavior, with specific reference to the GDE classification in Figure 11.
Consequently, the probability of occurrence
of the different hazards are derived for the different scenarios (Figure 13)
Figure 13: Resulting probability of occurrence of the different geomechanical hazards. As already remarked, note that the H_lik scenario has been derived by interpreting the Basic Design of reference.
3.3 Evaluation of the Initial risk
The calculation of the probability of occurrence of the hazards and the estimate of the potential impact on tunnelling (D&B and TBM) allow for the initial Risk Register compilation (Figure 14).
Figure 14. Example of the initial risk estimation as resulting from the probabilistic calculations and the potential impact on tunneling. For the classification, basic reference is done to ITA (2004, see also Figure 15), according to which: R=P*I, where R=Risk; P=Probability of occurrence; I=Impact. Risk may result: Unacceptable (Red), Unwanted (Yellow) and Negligible/Acceptable (Green). The analysis is performed for either D&B and TBM excavation.
A longitudinal profile with representation of
the initial risk along the tunnel is consequently realized, so providing the fundamental basic starting point for the Design actions (Figure 15).
GEOMECHANICAL HAZARDS (EXCAVATION BEHAVIOUR AND LOADING CONDITION RELATED)
Gravity driven instability
B1 ROCK BLOCK FALL ( OVERBREAKS) 5 2 10 1 5M01,M02,M23
,M24
M01,M22,M23
,M24
B2 CAVING (FACE / CAVITY COLLAPSE) 4 3 12 2 8
M01,M02,M03
,M06,M07,M0
8,M24
M01,M08,M22
,M24,M25,M2
7
Stress induced instability
B3 ROCKBURST 2 3 6 2 4M1,M2,M21,M
23,M26,M27
M01,M22,M23
,M26
B4 SQUEEZING, FACE EXTRUSION 2 3 6 4 8
M01,M02,M05
,M07,M21,M2
4,M25,M27
M01,M22,M25
,M27
Mainly water influenced (fault zone)
B5 FLOWING GROUND 5 5 25 5 25
M01,M02,M06
,M07,M08,M2
4
M01,M08,M22
,M25,M27
B6 WATER INRUSH 5 5 25 5 25
M01,M02,M06
,M07,M08,M2
4
M01,M08,M22
,M25,M27
B7 PIPING 5 5 25 5 25
Load conditions, etc.
B8 VISCOUS LOADS (fault zone, poor ground) 4 4 16 4 16
B9 SWELLING LOADS (fault zone, poor ground) 3 3 9 3 9
B10 ASYMMETRIC LOADS 5 3 15 3 15
B11 DEFECTIVE BEARING CAPACITY 3 3 9 4 12
(fault zone)
..... .........
Hazard identificationPrimary risk Mitigation measures*
CATEGORY
Sub-category
Hazard
Probab.
[P]
D&B
HAZARD
TBM*or cross-reference to
geomechanical hazard [→]
TBMD&B
TYPE
Sub-typeImpact
[I]
Risk
[R=PxI]
Impact
[I]
Risk
[R=PxI]
M01,M02,M06
M24,M27
M24,M27
M08
M27
Proceedings of the World Tunnel Congress 2014 – Tunnels for a better Life. Foz do Iguaçu, Brazil.
6
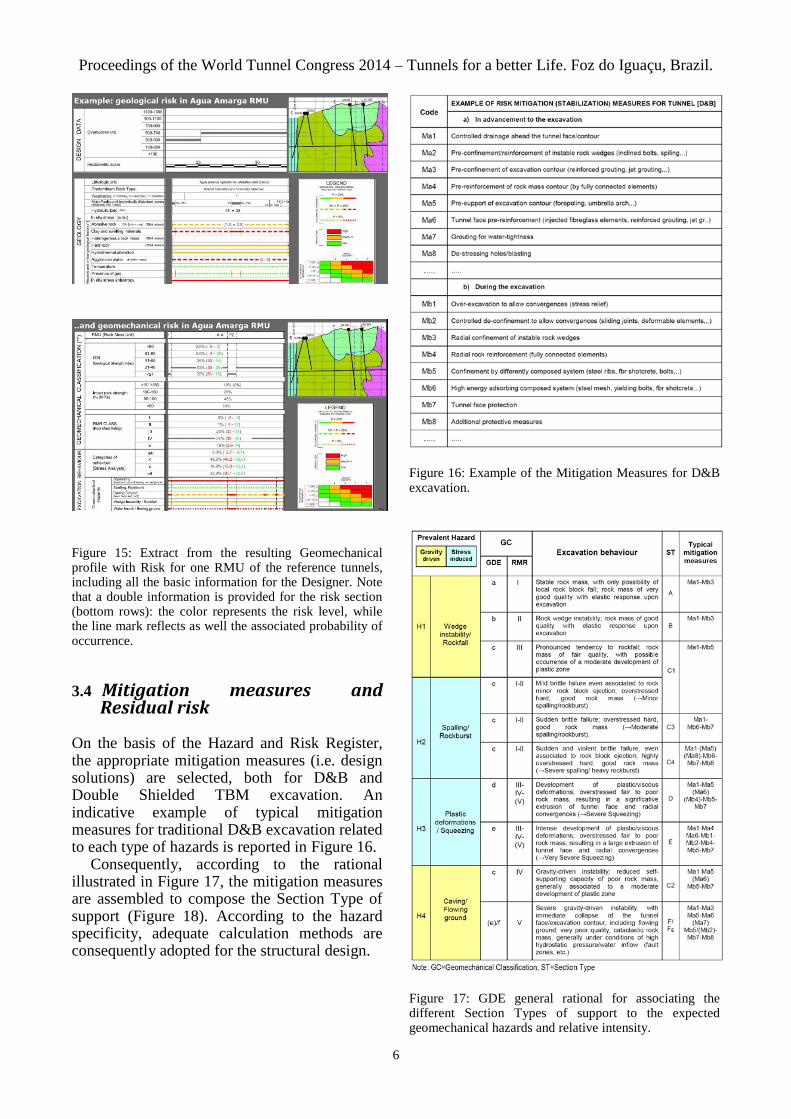
Figure 15: Extract from the resulting Geomechanical profile with Risk for one RMU of the reference tunnels, including all the basic information for the Designer. Note that a double information is provided for the risk section (bottom rows): the color represents the risk level, while the line mark reflects as well the associated probability of occurrence.
3.4 Mitigation measures and Residual risk
On the basis of the Hazard and Risk Register, the appropriate mitigation measures (i.e. design solutions) are selected, both for D&B and Double Shielded TBM excavation. An indicative example of typical mitigation measures for traditional D&B excavation related to each type of hazards is reported in Figure 16.
Consequently, according to the rational illustrated in Figure 17, the mitigation measures are assembled to compose the Section Type of support (Figure 18). According to the hazard specificity, adequate calculation methods are consequently adopted for the structural design.
Figure 16: Example of the Mitigation Measures for D&B excavation.
Figure 17: GDE general rational for associating the different Section Types of support to the expected geomechanical hazards and relative intensity.
Proceedings of the World Tunnel Congress 2014 – Tunnels for a better Life. Foz do Iguaçu, Brazil.
7
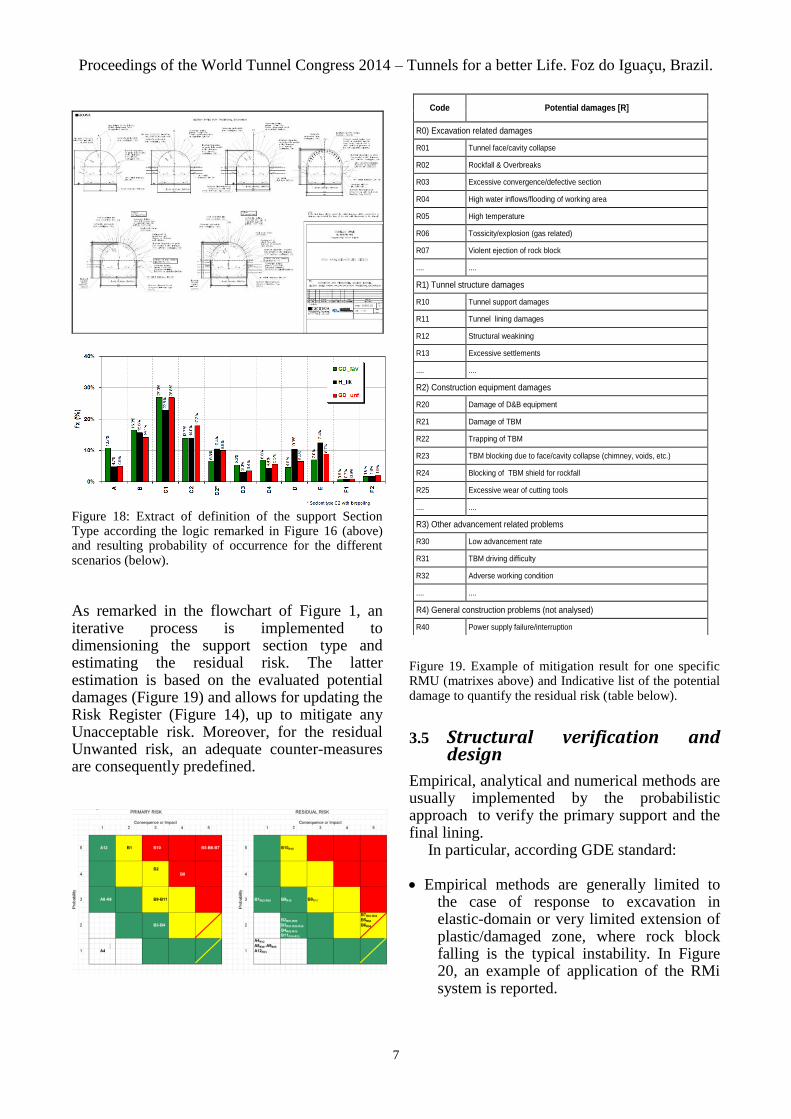
Figure 18: Extract of definition of the support Section Type according the logic remarked in Figure 16 (above) and resulting probability of occurrence for the different scenarios (below).
As remarked in the flowchart of Figure 1, an iterative process is implemented to dimensioning the support section type and estimating the residual risk. The latter estimation is based on the evaluated potential damages (Figure 19) and allows for updating the Risk Register (Figure 14), up to mitigate any Unacceptable risk. Moreover, for the residual Unwanted risk, an adequate counter-measures are consequently predefined.
Figure 19. Example of mitigation result for one specific RMU (matrixes above) and Indicative list of the potential damage to quantify the residual risk (table below).
3.5 Structural verification and design
Empirical, analytical and numerical methods are usually implemented by the probabilistic approach to verify the primary support and the final lining.
In particular, according GDE standard:
Empirical methods are generally limited to the case of response to excavation in elastic-domain or very limited extension of plastic/damaged zone, where rock block falling is the typical instability. In Figure 20, an example of application of the RMi system is reported.
Code Potential damages [R]
R0) Excavation related damages
R01 Tunnel face/cavity collapse
R02 Rockfall & Overbreaks
R03 Excessive convergence/defective section
R04 High water inflows/flooding of working area
R05 High temperature
R06 Tossicity/explosion (gas related)
R07 Violent ejection of rock block
.... ....
R1) Tunnel structure damages
R10 Tunnel support damages
R11 Tunnel lining damages
R12 Structural weakining
R13 Excessive settlements
.... ....
R2) Construction equipment damages
R20 Damage of D&B equipment
R21 Damage of TBM
R22 Trapping of TBM
R23 TBM blocking due to face/cavity collapse (chimney, voids, etc.)
R24 Blocking of TBM shield for rockfall
R25 Excessive wear of cutting tools
.... ....
R3) Other advancement related problems
R30 Low advancement rate
R31 TBM driving difficulty
R32 Adverse working condition
.... ....
R4) General construction problems (not analysed)
R40 Power supply failure/interruption

Proceedings of the World Tunnel Congress 2014 – Tunnels for a better Life. Foz do Iguaçu, Brazil.
8
0.01 0.1 1 10 100
1
10
100
grs,26.09.09
ros, 06.10.09
Geodata * Torino
Rock bolt spacing in shotcreted area (m)
1.5
2
3
3
2
3x3
2x2
1.5x1.5
1.25x1.251x1
Rock bolting
spacing (m)
2x2
3x3
40-5050-7
070-100
100-150
50mm
100mm
40mm
60mm
150mm
Siz
e r
atio [
Sr
= (
Dt/
Vb
1/3)*
(Co
/Nj)]
Ground condition factor [Gc = c*JP*SL*C]
200mm
150-250
Shotc
rete
thic
kness (m
m)
1.5x1.5
ONLY ROCK BOLT
SPOT BOLTIN
G
1.5
fibre reinforcement
(SPECIA
L DESIG
N)
RMi rock supported chart for discontinuous ground*
*adapted from Palmstrom, 2003
Figure 20. Example of probabilistic application of the RMi system of Palmstrom (2000) based on the input variability of geomechanical parameters.
Analytical methods, such as the “Convergence-Confinement” method, are applied to model support system that can be reasonably referred to a circular section subjected to isotropic stress conditions. In particular, the Capacity-Demand calculation is implemented to estimate the structural safety margin (Figure 21) of the Section Types.
0.00
0.20
0.40
0.60
0.80
0.0 4.0 8.0 12.0 16.0 20.0
pi/p0 [%]
ur [m
]
[C] - [D] < 0
[C] - [D] > 0
Figure 21. Probabilistic implementation of the Convergence-Confinement method (above; red lines=no ground-support equilibrium), used for the estimation of the Safety Margin by the “Capacity-Demand” analysis (below).
Numerical methods are used to verify the final lining, as well as all the cases in which anysotropy does not allow for the descrrbed simplification intrinsic to the analythical method. In the case, the Point Estimated Method (PEM, Rosenblueth, 1975) is used for probabilistic analysis.
Figure 22. Some example of numerical analysis by the code Phase2 (Rocscience, above) and FLAC (Itasca, below), and at the bottom a typical result by the application of the PEM (Russo et al., 1999).

Proceedings of the World Tunnel Congress 2014 – Tunnels for a better Life. Foz do Iguaçu, Brazil.
9
4 Probabilistic time & cost estimation
On the basis of the expected distribution of Section Types along the tunnels, the probabilistic estimation of the construction time and cost is finally developed, incorporating also the estimated probability and impact of the residual risk.
In particular, the calculation involves the probabilistic assessment of
the unitary cost of the Section Types; the relative advance rate; the time & cost estimation of the residual risk
(“accidents” in Figure 23)
Figure 23. Example of time & cost probabilistic estimation normalized with respect the resulting mean value of the H-lik scenario. Note that the upper shaded clouds incorporate a 5% for year increasing of costs for inflation, etc.
As it can be observed, mainly on the basis of the geomechanical classification assessments, either the Favorable and Unfavorable scenarios result in the case some better than the basic reference scenario. In particular, by referring to the obtained Expected Values (EV), it is obtained: EVFAV 0.85 EVHLIK EVUNFAV 0.95 EVHLIK
In other words, the reference scenario results about correspondent with the simulated unfavorable scenario and therefore it appears reasonable to expect some more favorable conditions.
5 Construction phase
As observed in the Section 2, the construction of the tunnels and realtive adits is actually in
progress and GDE provides with a specific team on site collaboration and technical support to Codelco. This is evidently fundamental to control and manage all the construction aspects and check the effective advantages of the proposed approach.
Also in this challenging phase, the same basic concepts described in the previous sections are implemented.
For example, the main hazards for the excavation are systematically checked during the advancements of the tunnels, by very detailled face mapping and the concurrent application of the “GDE Multiple graph” (Russo, 2008, 2013).
The GDE multiple graph is composed by 4 sectors (Figure 24), each of them finalized to a user-friendly quantification of the following engineering equations (proceeding clockwise from the bottom-right quadrant to the top-right):
1. Rock block volume (Vb) + Joint Conditions
(jC)= Rock mass fabric (GSI); 2. Rock mass fabric (GSI) + Strength of intact
rock (c) = Rock mass strength (cm) 3. Rock mass strength (cm) + In situ stress =
Competency (IC) 4. Competency (IC) + Self-supporting capacity
(RMR) = Excavation behaviour (Potential hazards)
Figure 24. Application of the GDE Multiple graph for one of the main access tunnels (TAP) in the RMU-V1.
In Figure 24 the application of the GDE
multiple graph is presented for the first RMU (V1) excavated by one of the main access tunnel, confirming, as it was expected, that the
Proceedings of the World Tunnel Congress 2014 – Tunnels for a better Life. Foz do Iguaçu, Brazil.
10
“wedge instability-rockfall” are in the case the main type of hazards.
6 Conclusion
The main features of the Risk Analysis-driven Design (RAdD) developed by Geodata Engineering have been described.
The key concept of RAdD is that the Design and the Risk Analysis are not two separate item, but a unique and fully probabilistic integrated process.
In each phase of the study, uncertainty and variability are adequately taken into account and reliability analysis are consequently performed to check the support system and lining.
A practical application has been presented, with specific reference to the design and construction of the tunnels to the new productive level of the El Teniente mine (Chile).
REFERENCES
AFTES 2012: Recommandation sur la caractérisation des incertitudes et des risques géologiques, hydrogéologiques et géotechniques. Tunnels et Espace Souterrain - n°232.
Bieniawski Z. T. 1989. Engineering Rock Mass Classification. John Wiley and Son.
Carranza-Torres, C. 2004. Elasto-plastic solution of tunnel problems using the generalized form of the Hoek-Brown failure criterion. Int J Rock Mech Min Sci. 4: supplement 1, 629-639.
Decman A., Stella F., Verzani L. P. 2013. Geomechanical follow-up of El Teniente new mine level access tunnels, ITA symposium Croatia, 7-8 May.
Diederichs M. S. 2005: Design methodology for spalling failure and rockburst hazards. Summary of meeting with GEODATA SPA. Torino.
Diederichs M. S. 2007. Mechanistic interpretation and practical application of damage and spalling prediction criteria for deep tunnelling. Can. Geotech. J., 44, 1082-1116.
Grasso P., Mahtab M. A., Kalamaras G., Einstein H.H. 2002. On the development of a Risk Management Plan for Tunnelling. Proc. World Tunnel Congress. Sydney.
Grasso P, Xu S., Pescara M, Russo G. and Repetto L. 2006. A methodology for the geotechnical design of long high-speed rail tunnels under the conditions of uncertainty ITA-sponsored 2006 China International Symposium on High-Speed Railway Tunnels & Exhibition 20-21 November 2006, Beijing, China.
Hoek E., Brown E. T. 1980. Underground excavations in Rock. The Institution of Mining and Metallurgy, London.
Hoek E., Brown E.T. 1997. Practical estimates of rock mass strength. Submitted for publication to the Int. J. Rock Mechanics & Mining Sciences.
Hoffmann J.S., Hammonds F.O. and Bartell S.M. 1994 An Introductory Guide to Uncertainty Analysis in Environmental and Health Risk Assessment -Prepared for OAK RIDGE NATIONAL LABORATORY Tennessee 37831-6285.
ITA/AITES. 2004. Guidelines for tunnelling risk management. International Tunnelling Association, Working Group No. 2. (Søren Degn Eskesen, Per Tengborg, Jørgen Kampmann, Trine Holst Veicherts). Tunnel. Underground Space Technol n. 19.
Kontrec P., Constandinidis V. 2013. Engineering geological characterization of the rock mass in the Adit P4600, Project El Teniente, Chile, ITA symposium Croatia, 7-8 May.
Palmström A. 2000. Recent developments in rock support estimates by the RMi. Journal of Rock Mechanics and Tunnelling Tecnology, vol. 6.
Rosenblueth E. 1975. Point Estimates for Probability Moments. Proceedings, Nat. Acad. Sci. USA 72 (10): 3812-3814.
RussoG., Kalamaras G.S., Xu S, Grasso P. 1999. "Reliability analysis of tunnel support systems". Proc. of the 9th ISRM Congress. Paris.
Russo G. 2008. A simplified rational approach for the preliminary assessment of the excavation behaviour in rock tunneling. Tunnels et Ouvrages Souterrains n. 207.
Russo G. 2009. A new rational method for calculating the GSI. Tunnelling an Underground Space Technology n.24.
Russo G., Grasso P. 2007. On the classification of the rock mass excavation behaviour tunneling. Proceedings of the 11th Congress of International Society of Rock Mechanics, Lisbon, 9-13 July 2007.
Russo G. 2013 (in press). An update of the “multiple graph” approach for the preliminary assessment of the excavation behaviour in rock tunneling. Tunnelling an Underground Space Technology n.41 (to be published March 2014).
SIG 1997. Italian National Project for Design and Construction Standards in Underground Works, "Guidelines for Design, Tendering and Construction of Underground Works". Gallerie e grandi Opere Sotterranee, n.51.