on the construct validity of stereotype threat measures
TRANSCRIPT
University of Missouri, St. LouisIRL @ UMSL
Dissertations UMSL Graduate Works
10-27-2009
On the Construct Validity of Stereotype ThreatMeasures: Some Possible Boundary ConditionsAndrea Jane MarsdenUniversity of Missouri-St. Louis, [email protected]
Follow this and additional works at: https://irl.umsl.edu/dissertation
Part of the Psychology Commons
This Dissertation is brought to you for free and open access by the UMSL Graduate Works at IRL @ UMSL. It has been accepted for inclusion inDissertations by an authorized administrator of IRL @ UMSL. For more information, please contact [email protected].
Recommended CitationMarsden, Andrea Jane, "On the Construct Validity of Stereotype Threat Measures: Some Possible Boundary Conditions" (2009).Dissertations. 505.https://irl.umsl.edu/dissertation/505

Running head: STEREOTYPE THREAT BOUNDARIES 1
On the Construct Validity of Stereotype Threat Measures:
Some Possible Boundary Conditions
A.J. Marsden
University of Missouri – St. Louis

STEREOTYPE THREAT BOUNDARIES 2
Abstract
Since 1995, much research has focused on the negative effects that stereotype threat (ST) may
have on task and test performance (e.g., Nguyen & Ryan, 2008). To date, however, no research
has examined the underlying meaning of this construct in a manner precise enough to determine
if it is indeed a unique and meaningful concept and any potential boundaries. Therefore, the
main goal of the current research was to obtain a better understanding of what distinctions, if
any, exist between ST and similar constructs. Using a factorial design and examining
correlations among variables, measures of ST were compared to measures of three similar or
related constructs: Stereotype Priming, Test Anxiety, and Test Motivation. In an attempt to
clarify the meaning of both (1) these commonly used self-report measures, and (2) common
experimental manipulations of those variables, a 3 (Blatant Stereotype Threat Cue vs. Implicit
Stereotype Threat Cue vs. Stereotype Prime) x 2 (Well-Known Stereotype vs. Novel Stereotype)
design was utilized. Significant differences between targets and non-targets of the ST were found
for two of the dependent variables. A significant main effect for novelty of the stereotype and
several significant interactions between novelty and cue type were found. More importantly,
however, analyses of the qualitative data provided a better understanding of the ST phenomenon,
its boundaries, and how it should be defined in the future. The potentials reasons for this effect
and the limitation of the study are discussed.
Keywords: stereotype threat, stereotype priming, test anxiety, test motivation

STEREOTYPE THREAT BOUNDARIES 3
TABLE OF CONTENTS
INTRODUCTION………………………………………………………………………….5
Conceptual and Operational Definitions of Stereotype Threat……………………..7
A Review of the Stereotype Threat Literature……………………………………...17
Specific Relationships of Interest and Hypotheses…………………………………39
Summary…………………………………………………………………………….61
METHOD……………………………………………………………………………………62
RESULTS……………………………………………………………………………………80
DISCUSSION……………………………………………………………………………….129
Implications, Future Research, and Limitations……………………………………..143
APPENDICES………………………………………………………………………………147
REFERENCES……………………………………………………………………………..175

STEREOTYPE THREAT BOUNDARIES 4
ACKNOWLEDGMENTS
I would like to thank my advisor, Mark Tubbs, Ph.D., for always challenging me and
providing support. I also want to thank my dissertation committee for all of the helpful feedback.
I would also like to thank Jennifer Bellm and Dominique Hamilton for helping me collect and
code all of my data. I want to thank my parents, Randy and Jean Ter Beest, for always being so
encouraging and supporting of me. And finally, and most importantly, I am thanking my
husband, Matt Marsden, for always believing in me, inspiring me, and having confidence in me.

STEREOTYPE THREAT BOUNDARIES 5
Introduction
In recent years an increasing amount of research has focused on understanding the
reasons for subgroup differences on cognitively loaded test performance in educational settings
(e.g., Lawrence & Crocker, 2009; Sackett, Schmitt, Ellingson, & Kabin, 2001). One reason for
this attention is the gap in college graduation rates between African-American and Caucasian
students (Cross, 2010). Although African-American enrollments are at an all-time high, the
graduation rate in 2009 was only about 45 percent, and since 2000, the graduation rate has
increased by only five percentage points. On average, the graduation rate for Caucasians is 20
points higher than it is for African-Americans (Cross, 2010).
Another reason for this focus is a concern regarding the lack of female students obtaining
scientific and engineering degrees (Bailey, 2004). In order for the United States to remain
competitive in the international market, it must continue to produce experts in the scientific
fields. Unfortunately, many large organizations are now recruiting talent from other countries
(McDonald, 2004). Although females represent over half of the U.S. workforce, only 8.5% of
engineers and 24% of the information technology (IT) labor market in the U.S. are female
(Bailey, 2004). In fact, the percentage of females obtaining a bachelor’s degree in computer
science decreased from 37% in 1984 to only 25% in 2004 (Singh, Allen, Scheckler, &
Darlington, 2007).
Understanding the reasons for such subgroup differences on cognitively loaded tests and
tasks remains a concern. Of course, the most obvious explanation is that these performance
differences result from a true difference between the groups in cognitive ability. But a number
of researchers have argued that subgroup differences do not actually reflect different levels of
cognitive ability, and instead might result from artifactual factors, such as the test takers’

STEREOTYPE THREAT BOUNDARIES 6
perceptions of the test (e.g., Smith, 2002). For example, when test takers encountered situations
where stereotypes about their group were apparent, they became concerned about what others
thought and this concern resulted in decreased performance (Steele & Aronson, 1995). This
phenomenon, called stereotype threat (ST), is argued to significantly reduce the working memory
capacity (WMC) and motivation of test takers and negatively affect test performance (Schmader,
2010; Smith, 2002).
Since 1995, much research has focused on ST and its hypothesized negative effects on
performance (e.g., Nguyen & Ryan, 2008), although some research has started to uncover
positive effects that ST might have on performance (e.g., Jamieson, 2009). Even though ST has
become a very highly researched topic, little attention has been paid to the crucial issues of the
exact nature and operationalization of the ST construct (Owens & Massey, 2011; Schwab, 1980).
Consistent results are lacking in this literature, and this may be due to the fact that different
researchers are defining and operationalizing ST differently. Perhaps under such circumstances
it would be wise to hold off on further substantive research on ST until it can be determined
whether the concept and its operationalizations represent what they are assumed to represent.
The main goal of the current research was to experimentally investigate the effects of
varying levels of the intensity of different ST cues and the novelty, or knowledge, of stereotypes
on participant reactions. The inconsistent results in the literature may be, in part, because prior
studies have been conducted within specific levels of these factors, making general conclusions
elusive. The current research was the first to manipulate both intensity and novelty in the same
study. By contrasting results of these various forms of ST manipulation with: (1) a more typical
stereotype priming manipulation and (2) a control prime, it was hoped that more light could be
shed on the question of whether ST as commonly discussed is a useful concept, and/or perhaps a

STEREOTYPE THREAT BOUNDARIES 7
special case of a more general phenomenon. The results of the manipulations were addressed in
a somewhat unique fashion. Without examining how participants actually “feel” following a ST
manipulation, constructing appropriate self-report reaction measures becomes a challenge for
researchers. Therefore, qualitative interviews were used to assess participant reactions which
were then used as a basis for selecting the outcome measures. In addition to measuring
perceptions of ST (PoST), several other dependent variables were measured. These variables
included test anxiety, test motivation, working memory capacity (WMC), and decision-making
ability.
The current study was not a typical construct validity study where the construct is a given
and measures are in doubt. Here, the question being addressed was whether the conceptual and
operational definitions of the construct popularly known as Stereotype Threat are as distinct from
previously defined constructs and if any boundaries of the phenomenon exist. One could argue
that if the definitions were not distinct from similar constructs, the construct validity of purported
self-reports and manipulations of ST is a moot point and such measures should not be used in
future research.
Conceptual and Operational Definitions of Stereotype Threat
Construct validity assesses the degree of agreement between a theoretical construct and
its operational definition (Cook & Campbell, 1976). Both conceptual and operational definitions
are important when assessing validity, and, unfortunately, there is a general lack of agreement
among ST researchers on both counts (e.g., Nyugen & Ryan, 2008).
Conceptual Definitions of ST
Stereotype threat was originally defined as “being at risk of confirming, as self-
characteristic, a negative stereotype about one’s group” (Steele & Aronson, 1995; p. 797). That

STEREOTYPE THREAT BOUNDARIES 8
is, when a person encounters a situation where a stereotype about his/her group becomes
obvious, this person becomes concerned about conclusions others will draw based on this
stereotype and his or her performance. Researchers have concluded that their performance
decreased due to this concern (Steele & Aronson, 1995).
Over the years, however, the conceptualization of ST has varied from general feelings of
apprehension (Aronson & Inzlicht, 2004) to a concrete fear of being judged and treated poorly
(Steele, Spencer, & Aronson, 2002) to concerns and anxiety over confirming the negative
stereotype (Kray, Thompson, & Galinsky, 2001; see Table 1). Interestingly, very few
researchers even use the word “threat” in their conceptual definition of ST (e.g., Johns, Inzlicht,
& Schmader, 2008), and when they do, their definitions of “threat” vary. For example, Ployhart
et al. (2003) define threat as a fear of confirming a negative stereotype whereas Croizet,
Dutrevis, and Desert (2002) define threat as a negative evaluation of one’s self integrity. This is
interesting because the Merriam-Webster Dictionary (2013) defines the word threat as “an
expression of intention to inflict evil, injury, or damage,” which differs drastically from how ST
researchers have defined it. The variety of ways in which researchers have conceptually defined
and characterized ST has created many doubts about the integrity of this theoretical construct
(e.g., Delgado & Preito, 2008).
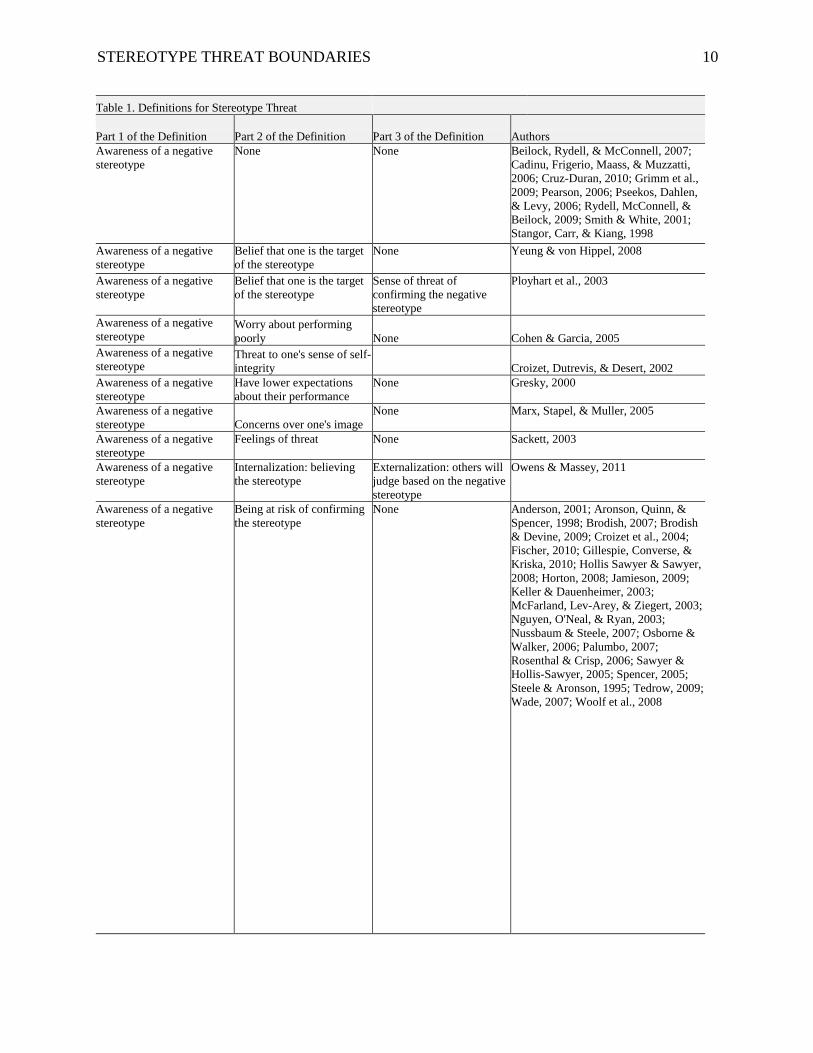
The various conceptual definitions of ST are categorized in Table 1 and they all appear to
have from one to three components. Column 1 shows the only factor that all definitions have in
common: there needs to be an awareness of the stereotype by the participant in order for ST cues
to affect performance (Brown, 2007; Cohen & Garcia, 2005; Doan, 2008). Beyond that, there
seem to be several other themes, as depicted in Columns 2 and 3, which seem to represent
“deeper” and more specific reactions than mere awareness. While they vary widely, the three

STEREOTYPE THREAT BOUNDARIES 9
most general reactions are: (a) that one is actually the target of the negative stereotype (Yeung &
von Hippel, 2008), (b) that one’s own performance will confirm the negative stereotype
(Ployhart et al., 2003), and (c) a general emotional reaction (Johns, Inzlict, & Schmader, 2008;
Josephs et al., 2003).
Once again, the inconsistency in how researchers define ST raises questions about not
only the validity of the measures used in each study, but also the meaning of ST itself. What is
it: (a) a feeling of anxiety, (b) a feeling of threat, (c) a fear of being judged, (d) a lack of
motivation, or (e) something else? What exactly do researchers mean when they use the word
“threat”? And more importantly how do the participants define that word when asked if they feel
“threatened” in certain situations? The point here is that without consistency in the conceptual
definition, how can researchers possibly know what they are measuring and manipulating with
any acceptable degree of precision? The answer is that they cannot do so.
STEREOTYPE THREAT BOUNDARIES 10
Table 1. Definitions for Stereotype Threat
Part 1 of the Definition Part 2 of the Definition Part 3 of the Definition Authors
Awareness of a negative
stereotype
None None Beilock, Rydell, & McConnell, 2007;
Cadinu, Frigerio, Maass, & Muzzatti,
2006; Cruz-Duran, 2010; Grimm et al.,
2009; Pearson, 2006; Pseekos, Dahlen,
& Levy, 2006; Rydell, McConnell, &
Beilock, 2009; Smith & White, 2001;
Stangor, Carr, & Kiang, 1998
Awareness of a negative
stereotype
Belief that one is the target
of the stereotype
None Yeung & von Hippel, 2008
Awareness of a negative
stereotype
Belief that one is the target
of the stereotype
Sense of threat of
confirming the negative
stereotype
Ployhart et al., 2003
Awareness of a negative
stereotype Worry about performing
poorly None Cohen & Garcia, 2005
Awareness of a negative
stereotype Threat to one's sense of self-
integrity Croizet, Dutrevis, & Desert, 2002
Awareness of a negative
stereotype
Have lower expectations
about their performance
None Gresky, 2000
Awareness of a negative
stereotype Concerns over one's image
None Marx, Stapel, & Muller, 2005
Awareness of a negative
stereotype
Feelings of threat None Sackett, 2003
Awareness of a negative
stereotype
Internalization: believing
the stereotype
Externalization: others will
judge based on the negative
stereotype
Owens & Massey, 2011
Awareness of a negative
stereotype
Being at risk of confirming
the stereotype
None Anderson, 2001; Aronson, Quinn, &
Spencer, 1998; Brodish, 2007; Brodish
& Devine, 2009; Croizet et al., 2004;
Fischer, 2010; Gillespie, Converse, &
Kriska, 2010; Hollis Sawyer & Sawyer,
2008; Horton, 2008; Jamieson, 2009;
Keller & Dauenheimer, 2003;
McFarland, Lev-Arey, & Ziegert, 2003;
Nguyen, O'Neal, & Ryan, 2003;
Nussbaum & Steele, 2007; Osborne &
Walker, 2006; Palumbo, 2007;
Rosenthal & Crisp, 2006; Sawyer &
Hollis-Sawyer, 2005; Spencer, 2005;
Steele & Aronson, 1995; Tedrow, 2009;
Wade, 2007; Woolf et al., 2008

STEREOTYPE THREAT BOUNDARIES 11
Table 1.
Part 1 of the Definition Part 2 of the Definition Part 3 of the Definition Authors
Awareness of a negative
stereotype
Being at risk of confirming
the stereotype
Feelings of apprehensions Aronson & Inzlicht, 2004; Davies et al.,
2001; Harrison et al., 2006
Awareness of a negative
stereotype
Being at risk of confirming
the stereotype
Negative feelings, such as
fear and anxiety
Bailey, 2004; Forbes, 2009; Kirnan et
al., 2009; Lawrence & Charbonneau,
2009; Leyens et al., 2000; Marx &
Stapel, 2006a; Mayer & Hanges, 2003;
McCracken, 2009; McKay et al., 2002;
Ryan, 2001; Salinas, 1998
Awareness of a negative
stereotype
Being at risk of confirming
the stereotype
Pressure, concern, and
worry over confirming the
stereotype
Brown, 2007; Chung et al., 2009;
Danaher & Crandall, 2008; Delisle et
al., 2009; Johns, Schmader, & Martens,
2005; Lawrence & Crocker, 2009;
Logel et al., 2009; Marx & Stapel,
2006b; Schimel et al., 2004; Schmader
& John, 2003; Schmader, 2010;
Schmader, John, & Forbes, 2008; Seibt
& Forster, 2004; Smith, 2002; Smith,
2004; Smith, Sansone, & White, 2007;
Stone, 2002; Stricker & Ward, 2008;
Thompson & Dinnel, 2007
Awareness of a negative
stereotype
Being at risk of confirming
the stereotype
Fear of confirming the
stereotype
Gonzales, Blanton, & Williams, 2002
Awareness of a negative
stereotype
Being at risk of confirming
the stereotype
Worry over maintaining
status
Josephs et al., 2003
Awareness of a negative
stereotype
Feelings of evaluative threat
(concerns over being judged
stereotypically by others)
None Brown & Day, 2006; Brown & Josephs,
1999; Brown & Pinel, 2003; Carr &
Steele, 2009; Cullen, Hardison, &
Sackett, 2004; Cullen, Waters, &
Sackett, 2006; Doan, 2008; Elizaga &
Markman, 2008; Nguyen & Ryan,
2008; Noruma, 2004; O'Brien &
Crandall, 2003; Shapiro & Neuberg,
2007; Spencer et al., 1999; Steele &
Davies, 2003; Wasserberg, 2010; Wout
et al., 2009
Awareness of a negative
stereotype
Feelings of evaluative threat
(concerns over being judged
stereotypically by others)
Worried about being judged Inzlicht & Ben-Zeev, 2003
Awareness of a negative
stereotype
Feelings of evaluative threat
(concerns over being judged
stereotypically by others)
Fear over being judged Johns, Inzlicht, & Schmader, 2008
Because of the various definitions in previous literature, settling on an appropriate
conceptual definition of ST at the outset of the current study was problematic. In order to avoid
making the same, possibly erroneous, assumptions that previous researchers have made
regarding how a typical ST manipulation affects participants’ feelings, the current study took an
open minded approach. Awareness seems a necessary component of any meaningful ST
concept, therefore awareness was the only component initially used in the current study. Further

STEREOTYPE THREAT BOUNDARIES 12
elaboration had to wait until the qualitative interview data was collected, which provided
evidence for what participants were actually feeling (e.g., threatened, frustrated, anxious) when
they underwent an ST manipulation. The current study also focused on the word “threat” and
how participants perceived and defined this word. If participants perceived and defined the word
“threat” as anxiety or a fear of being judged by others, it is important for researchers to know.
This qualitative process is notable because no previous study has collected such information
while also manipulating ST intensity and novelty, and without doing so, how can we really know
that participants are “threatened” by these situations? It is exactly these types of inferential leaps
that the present study tried to avoid, and, instead, hoped to provide an evidential basis for making
more accurate inferences in the future.
Operational Definitions of ST
There has also been inconsistency in how ST has been operationally defined (see Table
2). There are three main ways that researchers have manipulated ST: blatantly explicit cue
activation, moderately explicit cue activation, and subtle (or implicit) cue activation. Blatantly
explicit ST activation is a condition including a message directly to the test takers that involves a
subgroup’s relative ability to perform on a test (Nyugen & Ryan, 2008). For example, a
researcher examining ST and ethnicity or gender may state that Caucasians tend to outperform
African-Americans on a particular intelligence test or that males tend to outperform females on a
particular mathematics test (e.g., Aronson et al., 1999). An obvious problem is that a blatant ST
cue is not likely to occur in a real-world situation (Sackett et al., 2001). However, the focus here
was more on internal than external validity, so in order to ensure that participants were aware of
the stereotype a blatant cue activation condition was used.

STEREOTYPE THREAT BOUNDARIES 13
Researchers have also manipulated ST using moderately explicit cue activation. Here, a
message of subgroup differences in test performance ability is conveyed directly to the test
takers, but the direction of the differences is left open for the test takers’ interpretation (e.g.,
Brown & Pinel, 2003). For example, a moderately explicit ST cue activation might consist of a
statement that Caucasians and African-Americans generally perform differently on standardized
cognitive ability tests, or that there are gender differences on specific mathematics tests (e.g.,
Rosenthal & Crisp, 2006). This approach also lacks realism.
A third and final type of cue activation is implicit or subtle cue activation. Subtle cue
activation does not involve any direct mention of subgroup differences and instead manipulates
the context of tests, test takers’ subgroup membership, or the test taking experience. Because
certain negative stereotypes, such as females and mathematics or African-Americans and
intelligence tests, are relatively widespread (Devine, 1989), the negative stereotype may become
salient due to more subtle, automatic mechanisms (e.g., Anderson, 2001; Dinella, 2004; Martin,
2004). For example, a researcher may simply make an inquiry about the participant’s gender
prior to the test, and, by so doing, automatically activate the stereotype of gender, which could
affect performance regardless of the actual content of the test (Pelligrini, 2005). Implicit cues
have also been manipulated by telling participants that their scores will be evaluated by another
person (Jamieson, 2010), by stressing the evaluative nature of the test (Martin, 2004; Ployhart et
al., 2003), or by saying that the test is diagnostic of the test takers’ abilities.

STEREOTYPE THREAT BOUNDARIES 14
Table 2. Stereotype Threat Operational Definitions and Activating Cues
Note. Table modified from Nguyen and Ryan (2008).
Cue Classification Operational Definition Activating Cue
Blatant The message involving a stereotype
about a subgroup's inferiority in
cognitive ability and/or ability
performance is explicitly conveyed to
test takers prior to their taking a
cognitive ability test. The group-based
negative stereotype becomes salient to
test takers via a conscious mechanism.
Emphasizing the target subgroup's
inferiority on tests (or the comparison
subgroup's superiority). For example,
stating that Whites tend to perform
better than Blacks/Hispanics or that men
tend to score higher than women.
(Example Studies: Aronson et al.
(1999); Cadinu et al. (2003))
Priming targets' group-based inferiority.
For example, administering a stereotype
threat questionnaire before testing or
giving information favoring males
before tests.
(Example Studies: Bailey (2004);
Seagal (2001))
Strategy: Give a handout with
information favoring women; State that
a math test is free of gender bias; State
that Blacks perform better than Whites;
Educate subjects about the stereotype
threat phenomenon.
Moderately Explicit The message of subgroup differences
in cognitive ability and/or ability
performance is conveyed directly to
test takers in test directions or via the
test-taking context, but the direction of
these group differences are left open
for test takers' interpretation. The
group-based negative stereotype may
become salient to test takers via a
conscious mechanism.
Race/gender performance differences in
general ability tests. For example,
stating that generally men and women
perform different on standardized math
tests.
(Example Studies: Brown & Pinel
(2003); Edwards (2004); Rosenthal &
Crisp (2006))
Race/gender performance differences on
the specific test. For example, stating
that taking a specific math test produces
gender differences, testing minorities'
math ability on a White-normed or
biased test, stating that certain groups of
people perform better than others on
math exams
(Example Studies: Keller &
Dauenheimer (2003); Pelligrini (2005);
Tagler (2003))

STEREOTYPE THREAT BOUNDARIES 15
Table 2.
Cue Classification Operational Definition Activating Cue
Indirect and Subtle The message of subgroup differences
in cognitive ability is not directly
conveyed; instead, the context of the
tests, test takers' subgroup
membership, or test taking experience
is manipulated. The group-based
negative stereotype may become
salient to test takers via an automatic
and/or subconscious mechanism.
Race/gender priming. For example,
making a race/gender inquiry prior to
tests or race/gender priming by other
means (e.g., a pretest questionnaire, a
pretest task, a testing environment cue).
(Example Studies: Anderson (2001);
Dinella (2004); Oswald & Harvey
(2000-2001); Schmader & Johns (2003);
Spicer (1999); Steele & Aronson
(1995))
Emphasizing test diagnosticity purpose.
For example, labeling the test as a
diagnostic test or stressing the
evaluative nature of the test.
(Example Studies: Martin (2004); Marx
& Stapel (2006); Ployhart et al. (2003);
Prather (2005))
Strategy: Describe a test as a problem-
solving task (no race inquiry before
task); State that test performance will
not be assessed; Show television
commercials with women in
astereotypical roles (e.g., engineers).
To help summarize the research evidence, Nguyen and Ryan (2008) conducted a meta-
analysis to estimate the average effects of the various manipulations on performance. Results
indicated that moderately explicit cue activation may be most detrimental to performance, due to
the ambiguity of the situation. That is, when the direction of the negative stereotype is left open
for the test takers to interpret, they may spend more time engaging in detrimental off-task
thinking such as trying to figure out how the message should be interpreted. In contrast, in a
blatant condition, it would be possible for the test takers to try to prove the test wrong because
they know the direction. And in an implicit condition, the negative stereotype may fail to
activate at all. This finding extends the results from Walton and Cohen’s (2003) meta-analysis,
which indicated that explicit ST cues had larger effects on performance than did implicit.

STEREOTYPE THREAT BOUNDARIES 16
What Has Been Manipulated, Actually?
Unfortunately, a large majority of the studies included in the meta-analyses did not use
manipulation checks to assess what effect the cues actually had, nor did they directly ask
participants if they felt threatened by the manipulation in any way. A manipulation check is
essential when priming participants as it allows the researcher to ensure that the prime was
activated and/or that the participants were aware of the testing instructions. Without verifying
the reasons, that is, the mediating variables, that explain why a ST manipulation is related to test
scores, we can have no confidence that the phenomenon as described has even occurred.
What if participants feel, for example, threatened, anxious, and frustrated (i.e., all 3) by
the stereotype? Can we reasonably conclude that the testing effects are due to the construct of
ST as it has been defined? Or what if participants in a ST condition report anxiety, but no
feelings of threat? It has also been suggested that ST may have effects via limitations in
cognitive resources (Schmader, 2010). But are such limits really the result of negative or
threatening feelings, or a consequence of participants simply being distracted and confused by
the message? These and other questions remained unanswered.
The Novelty of Manipulated Stereotypes
The specific stereotypes that have been utilized in previous studies create another concern
regarding the integrity of the ST construct in that they are very well known to the general public
(Brown, 2007). So when participants receive the ST manipulation, they may already be well
aware of the negative stereotype and the supposed link to performance. Does the manipulated
information about the test create a “heightened” awareness of the already-known stereotype?
Would the effect still occur if a novel stereotype was primed (i.e., one of which the person had no

STEREOTYPE THREAT BOUNDARIES 17
previous awareness), or is it something about particular stereotypes and contexts that moderates
the effect?
Summary and Preview of the Current Study
The time had come to assess the meaning and measurement of the ST construct more
deliberately and precisely. The shifting definitions (see Table 1), questionable “threatening”
nature of manipulated primes, and inconsistent results, all argued for such a comprehensive
effort before more time and effort is expended on substantive efforts involving the idea and
measurement of ST.
Although indirect evidence regarding the moderating effects of different cue intensities
can be gleaned from the meta-analyses, no individual study has directly compared cue intensities
experimentally. As noted earlier, both explicit and implicit ST manipulations were utilized in the
proposed study, along with a generic stereotype priming manipulation which will be discussed
shortly. Further, so as to examine any differences between well-known and novel stereotypes, a
new stereotype was created. It seemed very likely that cue intensity would interact with the
novelty of the stereotype, and, although the nature of that interaction was unknown, the current
study was the first to examine it.
A Review of the Stereotype Threat Literature
Performance Effects
Much evidence exists in support of the detrimental effects that ST cues have on test
performance. For example, significant differences between ST conditions and control conditions
have been found across different settings and cultures, including women and mathematics
(Inzlicht & Ben-Zeev, 2000; Marx & Roman, 2002; Schmader, 2002), Latino women and spatial
skills and mathematics (Gonzalez, Blanton, & Williams, 2002), African-Americans and

STEREOTYPE THREAT BOUNDARIES 18
intelligence (Aronson, Fried, & Good, 2002; Steele & Aronson, 1995), women and career
choices (Davies, Spencer, Quinn, & Gerhardstein, 2002), Caucasian and Asian men in
mathematics (Aronson, Lustina, Good, Keough, Steele, & Brown, 1999), Caucasian and African-
American men in sports (Stone, 2002; Stone, Lynch, Sjomeling, & Darley, 1999), elderly
individuals and short-term memory (Hess, Auman, Colcombe, & Rahhal, 2003), child care and
homosexual men (Bosson, Haymovitz, & Pinel, 2004), and male cannabis users and cognitive
deficits (Looby & Earleywine, 2010).
Mediators of the ST-Performance Relationship
The authors of these studies all conclude that (1) ST is a real phenomenon and (2) ST was
the main reason for decreased performance scores. However, none of these studies directly asked
participants what they were feeling before, during, and after the ST cue. Even in Steele and
Aronson’s (1995) seminal article, the researchers did not directly assess that the manipulation
was actually threatening to the participants. They used a well-known standardized cognitive
ability test and found that the ST cue led to significantly lower test scores for African American
participants. Participants were asked to indicate their thoughts on their competency, personal
worth, occurrence of distracting thoughts, perceived difficulty of the test, and perceived
performance on the test. Based on these self-report measures the authors concluded that the
participant’s attention was focused on the “threat” instead of on the task at hand, thus increasing
stress and interfering with performance on the test (Steele & Aronson, 1995).
But they never asked participants if they actually felt threatened by the primes. The
explanation for the effects of the ST cue was based purely on inference. Participants were not
even directly asked if they felt anxious, apprehensive, afraid, or worried – all emotions used in
the conceptual definitions of ST. In fact, to date no researcher has ever asked participants if they

STEREOTYPE THREAT BOUNDARIES 19
actually felt all of these emotions. Instead, it appears that the effects of ST cues on hypothesized
mediating variables have been assumed to have occurred because the results with performance
have been consistent with the hypotheses. That is, researchers may not be asking participates
how they feel because their quantitative hypotheses are being supported.
ST Manipulation Checks
Researchers have manipulated ST using different types of cue activation, but different
manipulations may engage different constructs (Shapiro & Neuberg, 2007). Therefore, it is
exceptionally important to use a manipulation check to ensure that the prime is engaging the
correct construct. Unfortunately, much of the previous ST research has failed to use
manipulation checks to verify results. In fact, just over 80% of the articles reviewed by the
present author did not use a manipulation check (see Table 3). One ST researcher even
commented on this limitation: “…as with most prior stereotype threat studies, the present results
are not accompanied by any direct mediating evidence…or even a manipulation check to verify
that stereotype-related concerns were primed in African-American participants…” (Brown &
Day, 2006, p. 983). Many of the authors apparently assume that because they manipulated the
type of ST information given to participants and found significant differences between the
groups, ST caused those differences to occur, therefore, a manipulation check was not needed
(Bailey, 2004).
Some of the ST studies did perform manipulations checks (e.g., Steele & Aronson, 1995).
These checks often consisted of explicitly asking participants about their perception of the
stereotype (e.g., “To what extent do you think the male researcher thought gender stereotypes
could reduce performance on the test?” Johns et al., 2005 or “I worry that my ability to perform
well on math tests is affected by my gender,” Marx et al., 2005) or how they interpreted the

STEREOTYPE THREAT BOUNDARIES 20
instructions given to them prior to testing (e.g., “What was the purpose of the test you just took?”
Brown & Joseph, 1999; Noruma, 2004; Palumbo, 2007; Steele & Aronson, 1995; see Table 3).
Other researchers have used word completion measures as a manipulation check where each
incomplete word can be either related to stereotypes or unrelated to stereotypes (Bailey, 2004;
Brown & Joseph, 1999; Cohen & Garcia, 2005; Pearson, 2006; Steele & Aronson, 1995; Stone,
2002; see Table 3). But none of these studies ascertained whether any threat, per se, was
perceived. Furthermore, after comparing studies that used a manipulation check with those that
did not, there were still inconsistencies in how ST activation was associated with decreased
performance.
Self-report Measures of Perceived ST
A number of researchers have used self-reports of ST as measures in their own right, that
is, beyond the role of a mere manipulation check (see Table 3). Generally, these studies were
non-experimental in nature and operationally defined ST not as a manipulated cue, but as a self-
report of the level of ST perceived to be present. When researchers have moved away from the
manipulation of ST and attempted to measure the perceived level of ST with self-reports, the
conceptual problems with ST emerge. When they try to put the idea of ST into words, it has
proven very difficult to create questions that are distinct in content and meaning from those of
other concepts (see Table 3).
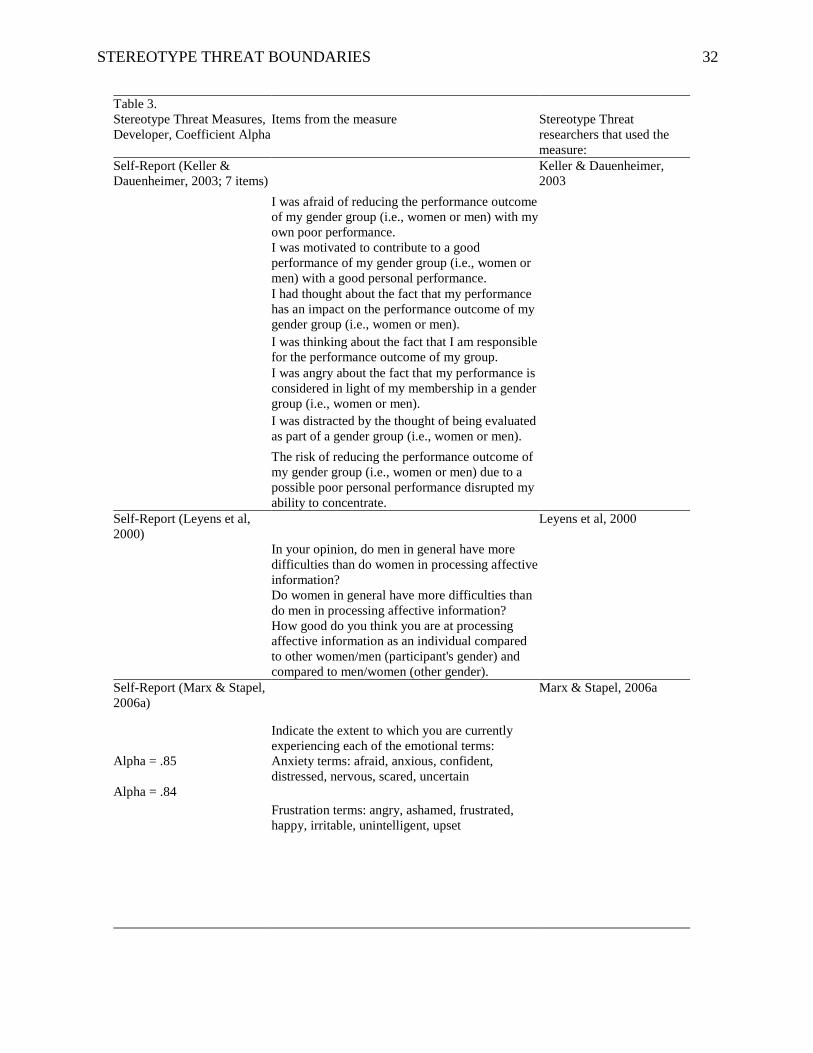
Many different types of items have been found on ST self-report measures. In fact,
Ployhart, Ziegert, and McFarland (2003) found that some items on ST measures referred to ST as
specific to a particular test, whereas other items referred to ST as a more generalized concept.
After much scrutiny, the present author noticed four main topics emerge from the measures that
ST researchers have used in their studies: (1) self-worth, (2) stereotype existence, (3) cognitive
STEREOTYPE THREAT BOUNDARIES 21
interference, and (4) judgment from others. An example item that represents self-worth from the
Academic Self Worth scale (Lawrence & Cocker, 2009; see Table 3) is “I would feel worthless if
I did poorly on a course test.” An example item that represents stereotype existence from the
Academic Stereotype Threat Inventory (Pseeko et al., 2006) is “It is commonly believed that
boys have an easier time with math than girls.” An example item that represents cognitive
interference is “I thought about how poorly I was doing,” from Sarason et al.’s (1986) Cognitive
Interference Questionnaire. Finally, an example item that represents judgment from others is “If
I do poorly on this test, people will look down on me,” from the Evaluation Apprehension Scale
(Spencer et al., 1999).
There were also several studies that used unusual scales to measure ST (such as the Cross
Racial Identity Scale by Vandiver et al, 2002). One might consider this scale unusual because it
seems to be measuring racial attitudes (e.g., “I hate white people.”) and not perceptions of
stereotypes or feelings of worry or apprehension.

STEREOTYPE THREAT BOUNDARIES 22
Table 3. Items and Coefficient Alphas from ST Manipulation Checks and Self-report Measures
Measure, Developer,
Coefficient Alpha
Items from the measure Citations:
Academic Self Worth
(Lawrence & Crocker, 2009;
Alpha = .84)
I would feel like a loser if I were to receive a poor
grade in class.
Lawrence & Charbonneau,
2009; Lawrence & Crocker,
2009
I would feel worthless if I did poorly on a course
test.
I would feel I was no good at all if I were to
receive a poor grade on a paper.
I would feel terrific about myself if I answered a
question in class correctly.
I would feel like a winner if I did well on a course
test.
Academic Stereotype Threat
Inventory (Pseeko et al,
2006)
Pseeko et al, 2006
Alpha = .98 Items for the Stereotype Factor:
It is commonly believed that boys have an easier
time with math than girls.
Men usually do better on math tests than women.
I have heard that women have a harder time with
math than men.
Many people believe that math is easier for boys
than for girls.
It is commonly believed that female students
perform worse on math tests than male students.
Men have an easier time in math than women.
Men earn better grades in math classes than
women.
Many people believe that the math portion of
standardized tests is more difficult for women
than for me.
Women usually get lower grades in math classes
than men.
The majority of women find math more difficult
than men.
Most people believe that men find math easier
than women.
I have heard that male students perform better on
math tests than female students.

STEREOTYPE THREAT BOUNDARIES 23
Table 3.
Stereotype Threat Measures,
Developer, Coefficient Alpha
Items from the measure
Stereotype Threat
researchers that used the
measure:
Academic Stereotype Threat
Inventory
Cont…
Women get lower scores on standardized math
tests than men.
I have heard that male students have an advantage
over female students on math problems.
I have heard that men have an easier time with
math questions on standardized test than women.
I have heard that female students have a
disadvantage from male students on math
problems.
Men are better at math than women.
The majority of girls struggle with math more
than boys.
In general, women have a harder time
understanding math concepts than men.
Most men have an easier time with math than
women.
Female students have to work harder in math to
do as well as male students.
Teachers expect that female students will do
worse in math classes than male students.
Teachers expect boys to get better grades than
girls in math classes.
Alpha = .97 Items for the Mathematics Factor:
Math comes easy to me.
I like math more than most of my friends.
I enjoy learning about math concepts.
I am good at math.
I usually do well on math tests.
I get good grades in math classes.
I understand math fairly well.
I am able to understand most math problems.
I have taken math classes that I enjoyed.
I do better than most of my peers in math.
Math can be interesting.
Math is a difficult subject for me.
I would consider taking a math elective.
I have always hated math.
I struggled with math in high school.
I would like to learn more about math.
I would prefer to not have to work math
problems.
Math problems are really challenging for me.

STEREOTYPE THREAT BOUNDARIES 24
Table 3.
Stereotype Threat Measures,
Developer, Coefficient Alpha
Items from the measure
Stereotype Threat
researchers that used the
measure:
Alpha = .79 Items for the Equality Factor:
Men and women have similar results on math
sections of standardized tests.
Men and women usually get similar scores on
standardized math tests.
Male and female students have to work equally
hard to do well in math.
Men and women usually find math equally
difficult.
Cognitive Interference
Questionnaire (Sarason et al,
1986; Alpha = .93)
Bailey, 2004; Gonzales et
al, 2002; Steele & Aronson,
1995
I thought about how poorly I was doing.
I thought about what the experimenter would
think of me.
I thought about how I should work more
carefully.
I thought about how much time I had left.
I thought about the difficulty of the problems.
I thought about my level of ability.
I thought about the purpose of the experiment.
I thought about how I would feel if I were told
how I performed.
I thought about how often I got confused.
I thought about other activities (i.e., work).
I thought about members of my family.
I thought about friends.
I thought about something that made me feel
guilty.
I thought about personal worries.
I thought about something that made me feel
angry.
I thought about something that made me feel
tense.
I thought about something that happened earlier
today.
I thought about something that happened in the
recent past (last few days, but not today).
I thought about something that happened in the
distant past.
I thought about something that might happen in
the future.
Cross Racial Identity Scale
(CRIS; Vandiver et al, 2002;
Alpha = .82 to .89)
Johnson, 2008
As an African-American life in America is good
for me.
I think of myself primarily as an American, and
seldom as a member of a racial group.

STEREOTYPE THREAT BOUNDARIES 25
Table 3.
Stereotype Threat Measures,
Developer, Coefficient Alpha
Items from the measure
Stereotype Threat
researchers that used the
measure:
Cross Racial Identity Scale
Cont…
Too many Blacks "glamorize" the drug trade and
fail to see opportunities that don't involve crime.
I go through periods when I am down on myself
because I am Black.
As a multiculturalist, I am connected to many
groups (Hispanics, Asian-Americans, Whites,
Jews, gays & lesbians, etc.).
I have a strong feeling of hatred and disdain for
all White people.
I see and think about things from an Afrocentric
perspective.
When I walk into a room, I always take note of
the racial make-up of the people around me.
I am not so much a member of a racial group, as I
am an American.
I sometimes struggle with negative feelings about
being Black.
My relationship with God plays an important role
in my life.
Blacks place more emphasis on having a good
time than on hard work.
I believe that only those Black people who accept
an Afrocentric perspective can truly solve the
race problem in America.
I hate the White community and all that it
represents.
When I have a chance to make a new friend,
issues of race and ethnicity seldom play a role in
who that person might be.
I believe it is important to have both a Black
identity and a multicultural perspective, which is
inclusive of everyone (e.g., Asians, Latinos, gays
& lesbians, Jews, Whites, etc.).
When I look in the mirror at my black image,
sometimes I do not feel good about what I see.
If I had to put a label on my identity, it would be
"American," and not African-American.
When I read the newspaper or a magazine, I
always look for articles and stories that deal with
race and ethnic issues.
Many African-Americans are too lazy to see
opportunities that are right in front of them.
As far as I am concerned, affirmative action will
be needed for a long time.
Black people cannot truly be free until our daily
lives are guided by Afrocentric values and
principles.

STEREOTYPE THREAT BOUNDARIES 26
Table 3.
Stereotype Threat Measures,
Developer, Coefficient Alpha
Items from the measure
Stereotype Threat
researchers that used the
measure:
Cross Racial Identity Scale
Cont…
I embrace my own Black identity, but I also
respect and celebrate the cultural identities of
other groups (e.g., Native Americans, Whites,
Latinos, Jews, Asian-Americans, gays & lesbians,
etc.).
Privately, I sometimes have negative feelings
about being Black.
If I had to put myself into categories, first I would
say that I am an American, and second I am a
member of a racial group.
My feelings and thoughts about God are very
important to me.
African-Americans are too quick to turn to crime
to solve their problems.
When I have a chance to decorate a room, I tend
to select pictures, posters, and works of art that
express strong racial-cultural themes.
I hate White people.
I respect the ideas that other Black people hold,
but believe that the best way to solve our
problems is to think Afrocentraically.
When I vote in an election, the first thing I think
about is the candidate's record on racial and
cultural issues.
I believe it is important to have both a Black
identity and a multicultural perspective, because
this connects me to other groups (e.g., Latinos,
Asian-Americans, Whites, Jews, gays & lesbians,
etc.).
I have developed an identity that stresses my
experiences as an American more than my
experiences as a member of a racial group.
During a typical week in my life, I think about
racial and cultural issues many, many times.
Blacks place too much importance on racial
protest and not enough on hard work and
education.
Black people will never be free until we embrace
an Afrocentric perspective.
I sometimes have negative feelings about being
Black.
As a multiculturalist, it is important for me to be
connected with individuals from all cultural
backgrounds (e.g., Latinos, gays & lesbians,
Jews, Native Americans, Asian-Americans, etc.).

STEREOTYPE THREAT BOUNDARIES 27
Table 3.
Stereotype Threat Measures,
Developer, Coefficient Alpha
Items from the measure
Stereotype Threat
researchers that used the
measure:
Evaluation Apprehension
Scale (Spencer et al., 1999;
Alpha = .82)
Grimm et al, 2009; Inzlicht
& Ben-Zeev, 2003; O'Brien
& Crandall, 2003
If I do poorly on this test, people will look down
on me.
People will think I have less ability if I do not do
well on this test.
If I don't do well on this test, others may question
my ability.
People will look down on me if I do not perform
well on this test.
I feel self-confident.
Fennema-Sherman
Mathematics Attitude Scales
(FSMAS, Mulhern & Rae,
1998; Alpha = .85; 108 items
total)
Mathematics is for men; arithmetic is for women.
Delisle et al., 2009 (Used 9
items from “Mathematics as
a male group” subscale)
Implicit Association Test
(IAT; Greenwald, McGhee,
& Schwartz, 1998)
Example Math Items: addition algebra,
calculating, calculus, computation
Example Language Items: adjectives, crosswords,
English, grammar, letters
Forbes, 2009 (used a
modified version); Kiefer,
2005 (used a modified
version)
Intellectual Engagement
Inventory (Major &
Schmader, 1998)
Nussbaum & Steele, 2007
Alpha = .81 Discounting Scale
I feel that standardized achievement tests are fair
tests of my abilities.
In general, I feel that standardized achievement
tests are a good measure of my intelligence.
Most intelligence tests do not really measure what
they are supposed to.
I feel that standardized achievement tests are
definitely biased against me.
Alpha = .66 Devaluing Scale
Being good at academics is an important part of
who I am.
Doing well on intellectual tasks is very important
to me.
It usually doesn't matter to me one way or the
other how I do in school.

STEREOTYPE THREAT BOUNDARIES 28
Table 3.
Stereotype Threat Measures,
Developer, Coefficient Alpha
Items from the measure
Stereotype Threat
researchers that used the
measure:
Alpha = .62 Disengagement Scale
I really don't care what tests say about my
intelligence
No intelligence test will ever change my opinion
of how intelligent I am.
How I do intellectually has little relation to who I
really am.
Interview Questions (Doan,
2008) Doan, 2008
Can you tell me how you experienced this event?
Can you tell me where this happened? What
grade? School? State?
Did this event ever occur in other situations?
Can you tell me why you indicated YES or NO
on question #1 on the survey?
Have there been any other experiences where this
type of incidence happened? Can you tell me
about these?
What type of stereotype, or groups "people like
you" does this signify to you? Women and math?
General intelligence?
Have these experiences always occurred in math?
Have you felt this in other areas, academic or not?
Is math central to your career or major?
Do you like math?
How did you feel about your performance in that
class?
Were you happy with your grade?
Based on (previously related experience) how did
these experiences affect you?
Do you remember specific feelings or emotions?
Did you have different feelings at different times?
How do you feel about it now?
Interview Questions (Cruz-
Duran, 2010) Cruz-Duran, 2010
What is your math self-efficacy?
How interested are you in math?
What are you expectations in math classes?
What are your beliefs in math stereotypes?
Interview Questions (Horton,
2008) Horton, 2008
What are some stereotypes of seniors?
What does it mean to age successfully?
What are your attitudes toward physical activity?

STEREOTYPE THREAT BOUNDARIES 29
Table 3.
Stereotype Threat Measures,
Developer, Coefficient Alpha
Items from the measure
Stereotype Threat
researchers that used the
measure:
Interview Questions (Woolf
et al, 2008) Woolf et al, 2008
What characteristics do "good" clinical students
have?
How do you react to "bad" clinical students?
What is your perception of the "typical" Asian
clinical medical student?
What characteristics do "good" clinical teachers
have?
*Lexical Task/Word
Fragment Test (Bailey, 2004;
24 items total)
Bailey, 2004
_ARD (Hard)
DU_ _ (Dumb)
*Lexical Task/Word
Fragment Test (Steele &
Aronson, 1995)
Brown & Joseph, 1999;
Cohen & Garcia, 2005;
Pearson, 2006; Steele &
Aronson, 1995; Stone, 2002
_ACE (Race)
LA_ _ (Lazy)
_ _ ACK (Black)
_ _ OR (Poor)
CL_S_ (Class)
BR_ _ _ _ _ (Brother)
_ _ _TE (White)
MI_ _ _ _ _ _ (Minority)
WEL_ _ _ _ (Welfare)
CO_ _ _ (Color)
TO_ _ _ (Token)
Math Identification (Forbes,
2009; Alpha = .75) Forbes, 2009
Being good at math is an important part of who I
am.
It usually doesn't matter to me one way or the
other how I do in math classes.
Doing well on math tasks is very important to me.
I care a great deal about performing well on tests
of my mathematic ability.
I always feel good about myself when I do well
on a standardized math test.
Math Identification
(Lawrence & Crocker, 2009;
Alpha = .83)
Having strong math ability is important to my
self-image.
Lawrence & Charbonneau,
2009; Lawrence & Crocker
It is important to me that other think I am high in
math ability.
It is important to my self-concept to score very
well on the moth portions of standardized test.

STEREOTYPE THREAT BOUNDARIES 30
Table 3.
Stereotype Threat Measures,
Developer, Coefficient Alpha
Items from the measure
Stereotype Threat
researchers that used the
measure:
Off-Task Thoughts Scales
(Kanfer & Ackerman, 1989) Nguyen et al, 2003
Alpha = .68 Off-Task Attention Scale
I daydreamed while doing the task.
I let my mind wander while doing the task
Alpha = .85 Attention to Performance Evaluation Scale
I thought about how I was doing compared to
others.
I thought about how others have done on this
task.
I wondered about how my performance compared
with others.
Self-Report (Schmader &
Johns, 2003, Alpha = .90) Brown, 2007; Schmader &
Johns, 2003
*I am concerned that the researcher will judge
(African-Americans/European Americans), as a
whole, based on my performance on this test.
*The researcher will think that (African-
Americans/European Americans), as a whole,
have less intellectual ability if I did not do well on
this test.
I believe the researcher will be able to provide
feedback that will help me on future tests.
*Self-Report (Brown &
Joseph, 1999) Brown & Joseph, 1999
What was the purpose of the test you just took?
Self-Report (Cohen &
Garcia, 2005) Cohen & Garcia, 2005
How much do you think your intellectual abilities
are being evaluated in the study?
How much do you think your general abilities are
being evaluated in the study?
Self-Report (Chung et al,
2009; Alpha = .80) Chung et al, 2009
In testing situations, I worry that people will draw
conclusions about my ethnic group based on my
performance.
I often think about issues concerning ethnicity.
I often feel that people's evaluations of my
behavior are based on the ethnic group to which I
belong.
In testing situations, I worry that people will draw
conclusions about me based on what they think
about my ethnic group.

STEREOTYPE THREAT BOUNDARIES 31
Table 3.
Stereotype Threat Measures,
Developer, Coefficient Alpha
Items from the measure
Stereotype Threat
researchers that used the
measure:
Self-Report (Doan, 2008) Doan, 2008
Has a (teacher/professor/fellow student) ever said
to you that people like you are not good in
mathematics?
Is there a stereotype that people who are like you
are not good at mathematics?
Have you ever felt that your performance has
been affected because you are associated with a
group of people who are known to be bad at
mathematics?
Self-Report (Gonzales et al.,
2002; 10 items)
I believe that my test performance will confirm
negative racial stereotypes about my racial group.
Gonzales et al., 2002
Self-Report (Hollis Sawyer
& Sawyer, 2008; Alpha =
.84)
Hollis Sawyer & Sawyer,
2008
People of my race/ethnicity do significantly better
on intelligence tests.
I think others believe that my race/ethnicity
determines how well I do on intelligence tests.
I actually have an advantage on intelligence tests
due to my race/ethnicity.
I am at a disadvantage on intelligence tests due to
my race/ethnicity.
*Self-Report (Jamieson,
2009) Jamieson, 2009
To what extent are there gender differences in
performance on this task?
Who do you believe performs better on this task?
Self-Report (Johns et al,
2005) Johns et al, 2005
Rate your perceptions of whether gender
stereotypes contributed to any anxiety you
experience while taking this test.
*To what extend do you think the male researcher
thought gender stereotypes could reduce
performance on the test?
*What is your perception of how the researcher
expects men and women to perform relative to
one another?
STEREOTYPE THREAT BOUNDARIES 32
Table 3.
Stereotype Threat Measures,
Developer, Coefficient Alpha
Items from the measure
Stereotype Threat
researchers that used the
measure:
Self-Report (Keller &
Dauenheimer, 2003; 7 items) Keller & Dauenheimer,
2003
I was afraid of reducing the performance outcome
of my gender group (i.e., women or men) with my
own poor performance.
I was motivated to contribute to a good
performance of my gender group (i.e., women or
men) with a good personal performance.
I had thought about the fact that my performance
has an impact on the performance outcome of my
gender group (i.e., women or men).
I was thinking about the fact that I am responsible
for the performance outcome of my group.
I was angry about the fact that my performance is
considered in light of my membership in a gender
group (i.e., women or men).
I was distracted by the thought of being evaluated
as part of a gender group (i.e., women or men).
The risk of reducing the performance outcome of
my gender group (i.e., women or men) due to a
possible poor personal performance disrupted my
ability to concentrate.
Self-Report (Leyens et al,
2000) Leyens et al, 2000
In your opinion, do men in general have more
difficulties than do women in processing affective
information?
Do women in general have more difficulties than
do men in processing affective information?
How good do you think you are at processing
affective information as an individual compared
to other women/men (participant's gender) and
compared to men/women (other gender).
Self-Report (Marx & Stapel,
2006a) Marx & Stapel, 2006a
Indicate the extent to which you are currently
experiencing each of the emotional terms:
Alpha = .85 Anxiety terms: afraid, anxious, confident,
distressed, nervous, scared, uncertain
Alpha = .84 Frustration terms: angry, ashamed, frustrated,
happy, irritable, unintelligent, upset

STEREOTYPE THREAT BOUNDARIES 33
Table 3.
Stereotype Threat Measures,
Developer, Coefficient Alpha
Items from the measure
Stereotype Threat
researchers that used the
measure:
*Self-Report (Marx et al;
2005 Alpha = .74 - .76) Marx et al, 2005; Marx &
Stapel, 2006b
I worry that my ability to perform well on math
tests is affected by my gender.
I worry that if I perform poorly on this test, the
experimenter will attribute my poor performance
to my gender
I worry that, because I know the negative
stereotype about women and math, my anxiety
about confirming that stereotype will negatively
influence how I perform on math tests.
I worry that if I perform poorly on this test, the
experimenter will attribute my poor performance
to my gender.
I worry that, because I know the negative
stereotype about women and math, my anxiety
about confirming that stereotype will negatively
influence how I perform on math tests.
*Self-Report (Nomura, 2004) Noruma, 2004
What was the purpose of the test you just took?
(A) It was to determine my personal strengths and
weaknesses in verbal ability and intelligence
(STC)
(B) It was to examine different methods for
solving problems (NSTC)
( C) It was a standardized test that can be used
when applying for scholarships and job (CX)
(D) It will be used to evaluate my instructors
(Distractor)
Self-Report (Palumbo, 2007) Palumbo, 2007
I believe that the test I just completed was
designed to measure my general intelligence.
I believe that the test I just completed was
designed to measure my knowledge of a
particular task.
Self-Report (Ployhart et al,
2003) Ployhart et al, 2003;
Palumbo, 2007
Alpha = .81 Test Specific Threat Items:
The test may have been easier for people of my
race.
The experimenter expected me to do poorly on
the test because of my race.
Tests, like the one that I just took, have been used
to discriminate against people from my race.
During the test, I wanted to show that people of
my race could perform well on it.

STEREOTYPE THREAT BOUNDARIES 34
Table 3.
Stereotype Threat Measures,
Developer, Coefficient Alpha
Items from the measure
Stereotype Threat
researchers that used the
measure:
Self-Report (Ployhart et al,
2003) cont.
A negative opinion exists about how people from
my race perform on this type of test.
Alpha = .71
Generalized Threat Items:
I never worry that people will draw conclusions
about my intelligence based on my race.
Some people feel that I have less intelligence
because of my race.
Self-Report (Sawyer &
Hollis Sawyer, 2005; Alpha
= .84)
Sawyer & Hollis Sawyer,
2005
People of my race/ethnicity do significantly better
on intelligence tests.
I actually have an advantage on intelligence tests
due to my race/ethnicity.
I am at a disadvantage on intelligence tests due to
my race/ethnicity.
Self-Report (Schimel et al,
2004) Schimel et al, 2004
Rate how well you expect to do.
Rate how threatening you perceive the task to be.
Self-Report (Smith et al,
2007) Smith et al, 2007
Recall the main point of the article and anything
you may have been told about our own lab
research on the topic.
Identify what your instructions had been for the
task (from a list of possibilities).
Self-Report (Steele &
Aronson, 1995; 18 items) Palumbo, 2007; Steele &
Aronson, 1995
I feel confident about my abilities.
I feel self-conscious.
I feel as smart as others.
*The purpose of this experiment was to:
(A) provide a genuine test of my abilities in order
to examine personal factors involved in verbal
ability
(B) provide a challenging test to examine factors
involved in solving verbal problems
( C) present you with unfamiliar verbal problems
to measure verbal learning
Self-Report (Tedrow, 2009) Tedrow, 2009
Do you agree that a race-based stereotype exists
in computer science?
Do you agree that a gender-based stereotype
exists in computer science?

STEREOTYPE THREAT BOUNDARIES 35
Table 3.
Stereotype Threat Measures,
Developer, Coefficient Alpha
Items from the measure
Stereotype Threat
researchers that used the
measure:
Self-Report (Wout et al,
2009) Wout et al, 2009
How well do you expect to perform on this test?
Self-Worth Protection Scale
(Thompson & Dinnel, 2003) Thompson & Dinnel, 2007
Alpha = .82 Ability Doubts Subscale (6 items)
I lack confidence in my mathematical ability.
Alpha = .78
Importance of Ability Subscale (6 items)
Doing well in mathematics allows me to preserve
a sense of self-worth.
Alpha = .86
Avoidance Orientation Scale (6 items)
I avoid mathematical challenges that might results
in failure.
Stereotype Awareness
(McKown & Weinstein,
2003)
Wasserberg, 2010
On planet Stereo, there are two groups of people,
the Greens and the Blues. In a school on planet
Stereo, the green teachers need to choose a
student to compete in a Reading test competition
against other schools. Greens think Blues are not
smart. Will the Green teachers pick a Green
student or a Blue student for the Reading test
competition?
The Green teachers will choose a ____________
student because ______________.
Describe any ways in which Planet Stereo is like
the real world:
No Stereotype Threat
Measure Used:
Browdish & Devine, 2009; Brown & Day, 2006;
Brown & Pinel, 2003; Croizet et al, 2004; Croizet
et al, 2002; Cullen et al, 2006; Elizaga &
Markman, 2008; Gillespie et al, 2010; Gresky,
2000; Harrison et al, 2006; Johns et al, 2008;
Josephs et al, 2003; Rosenthal & Crisp, 2006;
Rydell et al, 2009; Seibt & Forster, 2004; Smith,
2002; Smith et al, 2007; Stangor et al, 1998;
Stumpf & Stanley, 1998; Samson, 2010; Trudeau,
2010
Note. * indicates that these questions were used as manipulation checks.

STEREOTYPE THREAT BOUNDARIES 36
The wide diversity in forms of items used to assess ST provides further evidence that
different researchers are defining and measuring ST differently (Ployhart, Ziegert, & McFarland,
2003). Schwab (1980) strongly warns researchers against conducting substantive research
without establishing construct validity first, and unfortunately, many ST researchers assert that
this is exactly what has been happening (e.g., Horton, 2008). In fact, the situation is even worse
than that described by Schwab (1980) because the construct itself, not just its measures, would
appear to be in question. A more holistic and comprehensive approach is needed. Cook and
Campbell noted that construct “validity is what experimental psychologists are concerned with
when they worry about ‘confounding’” (1979, p. 59). Indeed, there are several existing variables
that seem to be conceptually confounded with the supposed variable of ST. Therefore, it could
be that there are boundaries or limitations to the potential effects of ST.
Qualitative ST Research
Although much experimental research has been conducted examining the effects of ST
cues, very few qualitative studies have been conducted regarding this phenomenon. In fact, only
a few studies, all unpublished doctoral dissertations, have reported any type of qualitative
information from participants in ST conditions (e.g., Doan, 2008).
In 2006, Pearson conducted the first in-depth qualitative study on African-Americans and
ST in both a predominately African-American college and a predominately Caucasian college.
Through interviews, the author found that students in the African-American college felt
significantly more self-protected and buffered against stereotypes than did students in the
Caucasian college. He argued that these feelings occurred because there was less of an emphasis
placed on race in the African-American college. Expanding upon Pearson’s (2006) study, Cruz-
Duran (2010) interviewed female students and found that females who endorsed the gender-math

STEREOTYPE THREAT BOUNDARIES 37
stereotype also expressed significantly greater concern in the possibility of failing a standardized
mathematics test. Using African-American elementary students, Wasserberg (2010) used
qualitative interviews to assess the thoughts and feelings that students experienced after taking a
standardized test. The students communicated feeling significantly more stress and anxiety and
also expressed a concern with what other students and teachers would think of their results on the
test.
After interviewing senior citizens about the effects of ST on several types of performance
(e.g., recall, reaction time, etc.), Horton (2008) concluded that more qualitative exploration is
needed and stated that “While the [ST] theory does offer appealing and relatively simple
solutions to important social issues, adoption of stereotype threat as an answer to complex social
problems may be premature, in spite of what the literature in this area suggests” (Horton, 2008,
p. 1).
Doan (2008) found that females assigned to the ST condition also expressed significantly
greater frustration, nervousness, and a lack of motivation to complete the test. But across all of
these qualitative studies, none of the participants assigned to a ST condition reported any
feelings of threat per se. Doan (2008) concluded that ST is a complex, multifactorial concept
that needs further qualitative exploration. The present study intended to do just that.
Multidimensional Models of ST
Similar to the qualitative research gap, few studies, in fact only two, Shapiro and
Neuberg (2007) and Owens and Massey (2011), have proposed multi-dimensional frameworks of
ST. Shapiro and Neuberg theorized that there are six main types of threat: self-concept threat,
own-reputation out-group threat, own-reputation in-group threat, group-concept threat, group-

STEREOTYPE THREAT BOUNDARIES 38
reputation out-group threat, and group-reputation in-group threat (see Table 4). The authors,
however, did not test their framework.
Table 4.
Shapiro & Neuberg’s (2007) Six Qualitatively Distinct Stereotype Threats
Target of the Threat
Source of the Threat Self Group
Self *Self-Concept Threat:
Fear that my behavior will confirm, in
my own mind, that the negative
stereotypes held of my group are true
of me
*Group-Concept Threat:
Fear that my behavior will confirm, in
my own mind, that the negative
stereotypes held of my group are true
of my group
Out-group Members *Own-Reputation Threat (Out-
Group):
Fear that my behavior will confirm, in
the minds of out-group members, that
the negative stereotypes held of my
group are true of me, and I will
therefore be judged or treated badly by
out-group members
Group-Reputation Threat (Out-
Group):
Fear that my behavior will confirm, in
the minds of out-group members, that
the negative stereotypes held of my
group are true of my group and my
group will therefore be judged or
treated badly by out-group members
In-group Members *Own-Reputation Threat (In-Group):
Fear that my behavior will confirm, in
the minds of in-group members, that
the negative stereotypes held of my
group are true of me and I will
therefore be judged or treated badly by
in-group members
Group-Reputation Threat (In-Group):
Fear that my behavior will confirm, in
the minds of in-group members, that
the negative stereotypes held of my
group are true of my group and my
group will therefore be judged or
treated badly by in-group members
Note. * indicates that the construct will be assessed in the present study.
In contrast, Owens and Massey attempted to study ST using structural equation modeling
(SEM) with self-reports of two so-called “constructs” of ST. Internalization referred to the
individual’s own beliefs in stereotypes, whereas externalization referred to the individual’s
perception of out-group members beliefs in stereotypes. They assessed the relationships among
internalization and externalization and three outcome variables: (1) academic effort, (2)
academic performance burden, and (3) academic performance. Academic effort referred to hours
spent studying and self-reported effort (e.g., how hard do you try in your classes?), academic
performance burden referred to an individual’s concern about how he or she will be judged by
out-group members in the classroom and on exams, and academic performance referred to grade
point average (GPA). After examination of the model, the authors concluded that the

STEREOTYPE THREAT BOUNDARIES 39
internalization and externalization mechanisms do not appear to be theoretically distinct concepts
(Owens & Massey, 2011).
Interestingly, if one compares Shapiro and Neuberg (2007) to Owens and Massey (2011),
very little overlap can be seen in their approaches. So, the authors of the only two papers
suggesting a subdimensional structure for ST created completely different conceptual definitions,
once again underscoring the extent of the confusion in this literature.
Specific Relationships of Interest and Hypotheses
The hypotheses offered in the following sections reflect the belief of the author that, as
documented thus far, ST cue manipulations and perceptions of ST (PoST) may not be distinct
from other similar types of primes or constructs. These hypotheses are therefore contrary to
what many advocates of ST would predict, but are necessary at this point in time. Before
rationalizing the hypotheses, it is important to first discuss the difference between ST cues and
PoST. The distinction between these two variables is a key component to each hypothesis.
ST Cues and Perceptions of ST
Two supposed ST variables were of interest in the current study: (1) the type of
experimental ST cue manipulation, and (2) the degree of self-reported PoST. The distinction
between these two variables is important. In the current study, ST cues were manipulated and
PoST were gathered via self-report from all participants. Each variable is discussed in greater
detail next and previous research regarding these two variables is outlined in the following
sections.
The experimental manipulation referred to here as a ST cue is similar conceptually to
other stereotype primes and may, in fact, represent nothing but one special case of the more
general manipulation. Because blatant ST cues are very different from subtle ST cues, but ST

STEREOTYPE THREAT BOUNDARIES 40
cues are similar to stereotype primes, the current study proposed to manipulate these three types
of cues in order to directly assess whether the so-called ST cues really produce different effects
than do stereotype primes.
The self-reported perception of ST (PoST) variable can be thought of in at least two
ways. First, in a theoretical sense, the PoST would be considered to be a mediating variable,
transmitting the effects of the ST manipulation to test performance. Simply put, participants are
primed to the stereotype, have some type of negative reaction to it, and, as a result, perform less
well than they would have otherwise. For the current study, a variety of previously published
self-report PoST scales and theoretical models of the ST process were used to collect qualitative
data in the pilot studies. Participants also had the opportunity to elaborate upon any other
feelings they may have experienced during their time in the laboratory. Based on these data, a
new PoST scale was created for use in the main study. This process will be explained in more
detail in the Method section.
Second, in an experimental sense, the self-reported PoST can be considered to be a
manipulation check for the ST manipulation. That is, if the ST cue truly does create a negative
reaction, or sense of threat, as described by Marx and Stapel (2006), then participants should
consciously perceive and be able to report that reaction. But because most previous researchers
failed to use any type of manipulation check and because there has been inconsistencies with
those that have used one, it is difficult to determine the internal validity of the ST manipulations
(e.g., Wasserberg, 2010). More specifically, it is difficult to know if the ST cue really primed
ST. Therefore, a major contribution of the current study was to compare the various conditions
and assess the validity of the ST measures by testing specific hypotheses and examining
goodness of fit indices, variability, and correlations among key variables. Furthermore, in order

STEREOTYPE THREAT BOUNDARIES 41
to assess if the ST cue really did prime PoST, the current study directly compared ST cues and
stereotype priming and assessed how participants felt in each condition. In addition to comparing
types of manipulations, the current study also examined the novelty of the stereotype.
Novelty of the Stereotype
Some of the strongest effects of the ST cues have involved extremely well-known
stereotypes with very deep and long-term emotional connections for some participants, which
raise the question as to whether the nature of the effects of the various priming manipulations
could be moderated by the extent of previous exposure to the stereotype. The author knows of
only two studies that have examined the novelty of a stereotype on participant’s performance and
in both cases both novel and familiar cues had the same negative effect on performance scores
(Campbell & Collaer, 2009; Martiny, Roth, Jelenec, Steffens, & Croizet, 2011). Based on their
findings, Martiny et al. (2011) assert that it is possible to prime a stereotype that has not been
stored in memory as long as the individual is a target of the stereotype. In line with social
identity theory, if an individual identifies with the stereotype and incorporates it into their self-
concept, a negative stereotype cue, whether known or unknown, will decrease performance
(Martiny et al., 2011). To further investigate this possibility, familiarity of the stereotype (novel
x well-known) was manipulated, creating a 3 (type of prime) x 2 (novelty of stereotype) factorial
design. A control group was also used. Participants in the control group were given a neutral
cue.
The novel stereotype used in the current study was that of right or left handedness and
decision making ability. Specifically, the manipulation was to prime participants that left handed
or ambidextrous participants would perform better than right handed participants on a decision
making test. Even though left handed individuals make up only 13% of the population

STEREOTYPE THREAT BOUNDARIES 42
(McManus, 2002), it is a trait that an individual can identify with and it is known by a very
young age. One concern with this stereotype was how left handed participants feel about
handedness stereotypes and about being left handed in general. McManus (2002) conducted a
survey asking over 500 individuals the effects of being left handed. He found that 58% of his
participants considered themselves to be more intelligent than average, and 48% considered
themselves to be more creative than average. Seventy-one percent of participants also reported
some difficulties at school and 39% reported being discouraged by teachers or parents from
using their left hand. McManus (2002) concludes that left handed individuals may feel mildly
disadvantaged, but the inconvenience today is very minimal compared to fifty years ago.
The current study hypothesized that no significant differences would exist between
participants who were given the novel ST cues or stereotype prime and participants who were
given the established, or well-known, ST cues or stereotype prime on scores across all dependent
measures. Significant differences were expected among these conditions and the control group.
Given the lack of clarity in the research, only an exploratory hypothesis regarding the novelty
and cue manipulations’ interaction was offered.
Hypothesis 1a (H1a): There would be no significant main effect of novelty of
stereotype across all dependent variables.
Hypothesis 1b (H1b): The interaction between novelty of stereotype and type of
cue would be explored, but no specific form of interaction was predicted.
Stereotype Threat vs. Stereotype Priming Manipulations
A key question repeatedly proposed in this paper is: Do ST cues and stereotype primes
affect performance differently, and if so, how? One common concern is that a ST situation can
result from simply priming a negative stereotypic trait even if the specific situation in these

STEREOTYPE THREAT BOUNDARIES 43
instances is not considered (Ambady, Paik, Steele, Owen-Smith, & Mitchell, 2004; Dijksterhuis
& Bargh, 2001). For example, previous research has demonstrated that when participants are
primed with stereotypic traits, such as when young people are primed with elderly consistent
words (e.g., Florida, Bingo) they behave in a stereotype consistent manner (e.g., walking more
slowly to the elevator; Bargh, Chen, & Burrows, 1996). This priming effect has been found for
many other social groups, such as supermodels, professors, soccer players, administrative
assistants, and politicians (Dijksterhuis & van Knippenberg, 1998; Dijksterhuis & van
Knippenberg, 2000; Dijksterhuis et al., 1998).
In fact, Sackett, Hardison, and Cullen (2004) have raised concerns that the authors of
some studies have mischaracterized priming effects as being the result of ST, which would be
misleading for teachers, researchers, test users, and students. Could it be that the negative effects
on performance assumed to be caused by ST cues are in fact, the result of stereotype priming?
Indeed, Sackett et al. (2004) raised the possibility that stereotype priming and ST are the same
phenomenon. If that were to be true, it might change the way researchers assess the relationship
between stereotypes and performance.
Others believe that ST is more than just the effect of priming, and an individual’s poor
test performance is due to conscious threat-based concerns that are tied to the particular situation,
whereas stereotype priming is not (Marx, Brown, & Steele, 1999; Marx & Stapel, 2006; Wheeler
& Petty, 2001). Marx and Stapel (2006) and Wheeler and Petty (2001) explained that when
stereotype priming is used, performance is not relevant to the group stereotype and all
participants might demonstrate similar performance effects because the information was
neutrally obtained. But with ST cues, performance is relevant to the individual and a conscious
link between his or her social self (a sense of “we-ness”) and performance on the test is made

STEREOTYPE THREAT BOUNDARIES 44
(Marx & Stapel, 2006). A neutral prime would not activate their social self, so individuals
would not feel threatened. Performance might be affected by such a neutral prime, but not due to
a perception of “threat.”
Marx and Stapel (2006) further explained that only individuals for whom the stereotype
exists can fall victim to ST effects and concluded that “stereotype priming can affect anyone,
whereas stereotype threat, by definition, only occurs for those people who are targeted by the
relevant stereotype” (p. 244). For example, males will not usually feel threatened by taking a
mathematics test because there is not a stereotype that males perform poorly on math tests. It is
possible, however, for Caucasian males to feel threatened while taking a mathematics test in the
presence of Asian males because the stereotype that Asians are superior in mathematics to
Caucasians does exist (Aronson et al., 1999). It is because of this stereotype that individuals
supposedly feel pressured to perform well or be labeled negatively by others.
Based on this research, it has been suggested that in order for the ST cue to negatively
affect performance and created “threatening” feelings: (1) participants must be aware of the cue,
(2) the cue must be negative, and (3) the cue must relate to specific behaviors (Marx & Stapel,
2006; Wheeler & Petty, 2001). In contrast, stereotype priming might affect participants’
performance: (1) even if they are not aware of the prime, (2) in positive, negative, or neutral
situations, and (3) in specific or general situations (see Table 6).
Table 6.
Distinctions Between Stereotype Threat and Stereotype Priming Manipulations
Type of Situation
Direction of Prime General Situation Specific Situation
Positive Stereotype Priming Stereotype Priming
Negative Stereotype Priming Stereotype Threat
Neutral Stereotype Priming Stereotype Priming

STEREOTYPE THREAT BOUNDARIES 45
In contrast to Marx and Stapel’s (2006) claims, the only negative feelings participants
reported were that of apprehension and anxiety, which some researchers may argue is test
anxiety and not ST (e.g., Delgado & Prieto, 2008) . So, is it possible that a ST cue could create
threatened or negative feelings for one person, but just serve as a prime for another person, and
yet still affect each person’s behavior in the same manner? This question has yet to be answered.
Even though Marx and Stapel (2006) reported that ST cues were significantly related to “threat-
based” concerns such as a worry over one’s ability to perform well, they never actually asked
participants if they felt threatened by the cue. Further, even the stereotype-primed participants in
their study expressed a concern over performance, and this effect approached significance (p =
.06). In fact, the means of “threat-based” concerns for ST and primed female participants on a 7-
point Likert scale were very similar (M = 3.03; s = .58; and M = 2.87; s = .56, respectively).
If the ST cues do not prime ST and create “threat-based” concerns, then proposing any
theoretical mediating relationships such as depicted in Figure 1 is pointless. Because the
qualitative data collected to date has not found any indication of “threatening” feelings, that are
clearly distinct from general test anxiety (e.g., Doan, 2008), the current study hypothesized that
there would be no significant differences between the ST cue conditions and the priming
conditions on self-report PoST. It was further hypothesized that there would be a significant
difference between the experimental groups and the control group on PoST. It was also
hypothesized that individuals targeted by the stereotype would report a significantly greater
perception of threat than non-targeted individuals across all experimental groups. It was not
expect that the PoST for targeted participants would significantly differ between experimental
groups.

STEREOTYPE THREAT BOUNDARIES 46
Hypothesis 2a (H2a): There would be no significant differences between
participants in the ST conditions and participants in the priming conditions on
PoST. But there would be a significant difference between these two
experimental groups and the control condition on PoST, such that participants in
the experimental groups would report a greater perception of threat.
Hypothesis 2b (H2b): Individuals targeted by the stereotype (right handed or low
income individuals) would report significantly greater PoST than individuals not
targeted by the stereotype across all experimental groups.
Figure 1. Relationships of Interest.
Based on the argument made by Marx and Staple (2006), one might conclude that with a
small change in the situation a new concept and phenomenon, stereotype threat, emerges. This is
one possibility. But the inconsistencies in the research do not make a convincing case for this
viewpoint, and instead suggest overlapping, even if not totally redundant, conceptualizations. A
second, more parsimonious, possibility is that stereotype primes with certain characteristics can
produce heightened, possibly threatening, perceptions that interfere with performance.
Therefore, the current study hypothesized that there would be a main effect of type of cue
on performance. Specifically, there would be no significant differences across experimental

STEREOTYPE THREAT BOUNDARIES 47
conditions, but all of the experimental conditions would significantly differ from the control
condition. It was further hypothesized that individuals that are targets of the stereotype would
perform significantly worse on measures of performance than non-targeted individuals.
Hypothesis 3a (H3a): There would be significant mean differences across the
conditions on measures of task performance, such that participants in the ST
conditions and the stereotype priming conditions would score significantly lower
on task performance measures than participants in the control condition, but the
experimental conditions would not significantly differ from each other.
Hypothesis 3b (H3b): Individuals targeted by the stereotype (right handed or low
income individuals) would perform significantly worse on measures of task
performance than individuals not targeted by the stereotype across all
experimental groups.
Effects of ST Cues and Stereotype Primes on Working Memory Capacity
Similar to the research regarding ST and task performance described in the previous
section, Schmader (2010) proposed that ST negatively affected task performance because ST
cues interfered with working memory capacity (WMC; Schmader, 2010). Schmader and Johns
(2003) conceptually defined WMC as “type of memory that is used to focus attention on
temporarily activated information of interest while inhibiting other information that is irrelevant
to the task at hand” (p. 441). Schmader (2010) argued that negative effects that a ST cue had on
participants’ performance was in part due to the increased cognitive load of the stereotyped
participant. She asserted that the participant’s attention was not properly focused and it decreased
working memory due to the dual monitoring of the ST and the current task (Schmader, 2010).
Unfortunately, the author never tested this specific hypothesis.

STEREOTYPE THREAT BOUNDARIES 48
Similar to Schmader’s (2010) hypothesis, Mangels et al. (2012) asserted that emotional
processing interfered with WMC for targets of ST. That is, targeted individuals attempted to
regulate their negative emotions, such as anxiety or fear, which resulted in fewer resources
available for the task. Mangels et al (2012) further argued that if a target of ST can effectively
control negative emotions, learning and performance may not be as negatively affected.
Recently, Weger, Hooper, Meier, and Hopthrow (2012) hypothesized and found support for the
idea of mindfulness reducing the negative effects that a ST cue has on WMC. The authors
argued that mindfulness, a state in which an individual focuses on the present in an unbiased
manner, reduced negative thoughts. Although this is an interesting area of research, and to date,
the only study that has examined mindfulness and ST, more evidence is needed on what exactly
participants are feeling when they are targeted by a ST cue versus a stereotype prime.
Therefore, based on Schmader and Johns’ (2003) findings and Mangels et al.’s (2012)
findings that a ST cue will negatively affect WMC, the current study offered its next hypotheses.
The experimental groups were not expected to significantly differ from each other on WMC.
Furthermore, based on Jamieson and Harkins’ (2012) assumption that a negative stereotype
prime would negatively affect WMC, the current study also did not expect any significant
differences between experimental groups on WMC. However, because stereotype priming is
unconscious it may have less of an effect on WMC than will a ST cue (Jamieson, 2009), but a
significant difference between the types of cues was not expected. It was further hypothesized
that targeted individuals would perform significantly worse on WMC than non-targeted
individuals.
Hypothesis 4a (H4a): There would be significant mean differences across the
conditions on WMC, such that participants in the ST and priming conditions

STEREOTYPE THREAT BOUNDARIES 49
would score significantly worse than participants in the control conditions. It was
further expected that participants in the ST conditions would score lower on
WMC that participants in the priming conditions, but those differences were not
expected to be significant.
Hypothesis 4b (H4b): Individuals targeted by the stereotype (right handed or low
income individuals) would perform significantly worse on WMC than individuals
not targeted by the stereotype across all experimental groups.
Effects of ST Cues and Stereotype Primes on Test Anxiety
ST and anxiety. Test anxiety has been traditionally defined as over-arousal including
feelings of worry, dread, tension, as well as self-depreciating thoughts during testing situations
(Zeidner, 1998). Previous research has shown that test anxiety correlates with test scores (Masi,
2000; Wicherts & Zand Scholten, 2010). Specifically, correlations of -.23 (Hembree, 1988) and
-.33 (Ackerman & Heggestad, 1997) have been reported between cognitive ability scores and test
anxiety scores. The explanations offered for the relationship between anxiety and performance
(Eysenck & Calvo, 1992; Spielberger & Vagg, 1995) are strikingly similar to the ST process
explained by Schmader (2010), again reinforcing the conceptual redundancy in the ST idea.
Could it be that what is assessed with self-reports of ST is test anxiety? If so, then what
is considered to be a ST cue causes test anxiety, but nothing more. If no real “threat” is
perceived, are we really sure there is anything there beyond anxiety? Ideally, these questions
would have been posed and answered long ago.
Although research examining the relationship between test anxiety and ST cues has been
abundant (e.g., Steele & Aronson, 1995; Steele, Spencer, & Aronson, 2002), there has been no
clear evidence demonstrating the process by which ST cues affect test anxiety, if at all. The
STEREOTYPE THREAT BOUNDARIES 50
majority of this research concluded that the ST cue creates test anxiety, which in turn lowers test
performance (Harrison, Stevens, Monty, & Coakley, 2006; Steele, Spencer, & Aronson, 2002).
Only one study to date tried to clarify the distinction between how ST cues and test anxiety
affects performance by using an Aptitude-Treatment-Interaction (ATI) design, which helps to
determine whether the effects of a manipulated variable are moderated by a measured aptitude
(Delgado & Prieto, 2008). Assessing females in a mathematics testing situation, the authors
found that the ST cue has some effect on math scores but only in interaction with anxiety, and
concluded that the effects of ST cues are non-uniform and that construct validity of the
manipulation is doubtful. They further urged researchers to “…abandon this [ST] paradigm and
focus instead on variables such as anxiety…” (Delgado & Prieto, 2008, p. 639).
In an ironic turnabout, several researchers have actually argued that one way to eradicate
the negative effects caused by a ST cue is to reduce test anxiety (Cohen, Garcia, Apfel, &
Master, 2006; Grimm, et al., 2009). The idea of reducing test anxiety to increase performance
can be explained by the classic Yerkes-Dodson arousal function, where an optimal level of
arousal is necessary for superior performance (Grimm, et al., 2009). However, because there has
been confusion in the ST literature about direction of causality (e.g., Delgado & Prieto, 2008),
more research is needed to determine the difference between the two concepts.
Stereotype priming and anxiety. In contrast with the literature on ST, very few studies
have examined the relationship between stereotype priming and test anxiety, but what does exist
parallels that with ST. Specifically, Wade (2007) found that male and female participants
reported experiencing more anxiety after a negative stereotype prime than after a positive prime.
Although it is still unclear how and why ST and stereotype priming cues affect test
anxiety, based on the previous research conducted by Steele and his colleagues (2002) and Wade

STEREOTYPE THREAT BOUNDARIES 51
(2007), the fifth hypothesis was that participants across all ST cue conditions and the stereotype
prime conditions would report significantly more test anxiety than participants in the control
condition. Furthermore, targeted individuals would report significantly more test anxiety than
non-targeted individuals.
Hypothesis 5a (H5a): There would be significant mean differences across the
conditions on test anxiety, such that participants in the ST conditions and the
stereotype priming conditions would report significantly more test anxiety than
participants in the control condition, but the experimental groups would not
significantly differ from each other.
Hypothesis 5b (H5b): Individuals targeted by the stereotype (right handed or low
income individuals) would report significantly more test anxiety than individuals
not targeted by the stereotype across all experimental groups.
Effects of ST Cues and Stereotype Primes on Motivational Variables
As with task anxiety, ST cues and motivation have been closely examined in recent years
(e.g., Jamieson, 2009). Motivation has had a surplus of definitions in the past, but, in general, it
has been defined in terms of intensity and direction of behavior (Campbell & Pritchard, 1976).
The current study used Naylor, Pritchard, and Ilgen’s (1980) definition: “Motivation is defined
as the process of allocating personal resources in the form of time and energy to various acts in
such a way that the anticipated affect resulting from these acts is maximized” (pg. 159).
Specifically, Naylor, Pritchard, and Ilgen proposed a popular resource allocation model that
conceptualizes motivation as the amount of one’s total resources (including time and effort)
directed toward achieving one’s goals at any one point in time.

STEREOTYPE THREAT BOUNDARIES 52
On a consistent basis, measures of motivation have positively correlated with test
performance (Cole & Oserlind, 2005; Karmos & Karmos, 1984; O’Neil, Sugrue, & Baker, 1996;
Wolf & Smith, 1995), but previous research examining motivation as a mediator between ST
cues and performance has been inconsistent and inconclusive. Some participants have
experienced increases in motivation and performance (e.g., Ployhart, Ziegert, & McFarland,
2003), whereas others experienced decreases (e.g., Croizet, Dutrevis, & Desert, 2002; Jamieson,
2009). Harder (1999) and Aronson et al. (1999) explicitly examined motivation as a mediator
variable, but neither found significant effects. The same was true of Bailey (2004), who
concluded that the measures of motivation, the small sample sizes, and the lack of integrated
models to explain these relationships may contribute to the inconsistent findings.
The current study hoped to address these shortcomings by taking a closer look at how ST
manipulations and stereotype primes affected participants’ motivational force and effort.
Motivational force consists of an individual’s expectations and valence toward a task (Vroom,
1964). Expectancy is one’s perceived probability of a successful outcome if a certain course of
action is taken (Eccles & Wigfield, 2002; Wigfield & Eccles, 2000), whereas valence is one’s
anticipated satisfaction, or value, of obtaining an outcome (Naylor & Ilgen, 1984). Several
studies have found that participants’ expectations about successful completion of a task were
negatively affected by a ST cue (Cohen & Garcia, 2005; Keller & Dauenheimer, 2003; Seibt &
Forster, 2004; Smith, 2004; Stangor, Carr, & Kiang, 1998). Unfortunately, to date, no study has
examined how ST cues might affect valence.
However, some research does exist regarding how negative or positive primes affect task
valence (e.g., Wittenbrink, Judd, & Park, 1997). Using only Caucasian participants,
Wittenbrink, Judd, and Park (1997) presented either masked “negative” or “positive” primes to

STEREOTYPE THREAT BOUNDARIES 53
them (the word Black or the word White, respectively). That is, the primes were presented to the
participants outside of their conscious awareness by masking the word Black or White with a
series of random letters. The authors found that the Caucasian participants given the Black
primes reported a negative effect on their valence toward a task; whereas White primes
positively affected their valence (Wittenbrink et al., 1997). Unfortunately, no manipulation
check was given to participants.
It was hypothesized that significant difference among the experimental groups and
control group would occur with participants in the experimental groups reporting lower
expectancy and less valence toward the task. Furthermore, targeted individuals would report
significantly lower expectancy and less valence toward the task than non-targeted individuals.
Hypothesis 6a (H6a): There would be significant mean differences across the
conditions on expectancy toward the task, such that participants in the ST and
priming conditions would report significantly lower expectations for success than
participants in the control condition, but the experimental groups would not differ
significantly from each other.
Hypothesis 6b (H6b): There would be significant mean differences across the
conditions on valence toward the task, such that participants in the ST and
priming conditions would report significantly less valence toward the task than
participants in the control condition, but the experimental groups would not differ
significantly from each other.
Hypothesis 6c (H6c): Individuals targeted by the stereotype (right handed or low
income individuals) would report significantly lower expectations for success
than individuals not targeted by the stereotype across all experimental groups.

STEREOTYPE THREAT BOUNDARIES 54
Hypothesis 6d (H6d): Individuals targeted by the stereotype (right handed or low
income individuals) would report significantly less valence toward the task than
individuals not targeted by the stereotype across all experimental groups.
Effort, conceptually defined by Campbell and Pritchard (1976) as direction, intensity, and
persistence will also be closely examined. Direction is defined as the actual behavioral sequence
of the person’s intended actions or having a plan of action; intensity is defined as the amplitude
of the person’s intended actions; and persistence is defined as the duration or time commitment
of the persons’ intended actions (see Campbell & Pritchard, 1976; Kanfer, 1991). Previous
research has demonstrated that ST cues had a negative effect on direction of behavior during a
task (e.g., Carr & Steele, 2009), but one study that examined the effects of stereotype priming on
direction found no such effect (Jamieson, 2009). In contrast to Jamieson’s finding, Wade (2007)
observed that a prime did affect the direction of a participant’s behavior in a way that was
consistent with the stereotype. That is, negative primes negatively affected the direction taken
by the participant such that primed participants were not consistent in their previously stated
intended actions and tried more strategies for test completion than participants in the control
group. In line with Wade’s (2007) research, the present study hypothesized that direction of
behavior would be negatively affected by the different manipulations and that targeted
individuals would be more negatively affected than non-targeted individuals.
Hypothesis 7a (H7a): There would be significant mean differences between
participant scores on direction of behavior in the ST conditions and in the priming
and control conditions, such that participants in the ST and priming conditions
would attempt significantly fewer strategies on the task than participants in the
STEREOTYPE THREAT BOUNDARIES 55
control condition, but the experimental conditions would not significantly differ
from each other.
Hypothesis 7b (H7b): Individuals targeted by the stereotype (right handed or low
income individuals) would attempt significantly fewer strategies on the task than
individuals not targeted by the stereotype across all experimental groups.
Research examining intensity and ST cues has observed that targets of a ST cue exerted a
higher intensity toward the task than did control participants because they were trying too hard
(Jamieson, 2009; Harrison, Stevens, Monty, & Coakley, 2006; Thoman, White, Yamawaki, &
Koishi, 2008). In contrast, Jamieson and Harkins (2012) demonstrated that participants in a
priming condition did not demonstrate as much intensity as participants in other conditions. Due
to the lack of literature regarding priming and intensity, the current study hypothesized that there
would be no significant mean differences between cue types on intensity, but there would be a
significant difference between the experimental groups and the control group and between
targeted and non-targeted individuals.
Hypothesis 8a (H8a): There would be significant mean differences between
participant scores on intensity in the ST conditions and in the priming and control
conditions, such that participants in the ST and priming conditions would report
significantly greater intensity toward the task than participants in the control
condition, but the experimental conditions would not significantly differ from
each other.
Hypothesis 8b (H8b): Individuals targeted by the stereotype (right handed or low
income individuals) would report significantly greater intensity toward the task
than individuals not targeted by the stereotype across all experimental groups.

STEREOTYPE THREAT BOUNDARIES 56
The final motivational variable of interest, persistence, has been examined previously and
targets of ST and stereotype priming conditions displayed more persistence on a task than did
participants in a control condition (Hansen & Wanke, 2007; Nussbaum & Steele, 2007).
Hypothesis 9a (H9a): There would be significant mean differences between
participant scores on persistence in the ST conditions and in the priming and
control conditions, such that participants in the ST and priming conditions would
report significantly greater persistence toward the task than participants in the
control condition, but the experimental conditions would not significantly differ
from each other.
Hypothesis 9b (H9b): Individuals targeted by the stereotype (right handed or low
income individuals) would report significantly greater persistence toward the task
than individuals not targeted by the stereotype across all experimental groups.
Perceptions of Stereotype Threat vs. Test Anxiety
As mentioned previously, there were two ST variables of interest in this study: the ST cue
manipulation and self-reported PoST. How PoST differs from other self-reported variables was
a key focus. Two variables that have received much attention are that of test anxiety and test
motivation (which will be discussed in the next section). Unfortunately, research examining the
relationship between self-reported perceived ST and self-reported test anxiety has been mixed
(e.g., Jensen, 1998).
These inconsistencies may be due to the measures used to assess these variables. Every
study reviewed by the present author examining the relationship between PoST and anxiety used
self-reports of anxiety, except two that used physiological measures (Croizet, et al., 2004;

STEREOTYPE THREAT BOUNDARIES 57
Josephs, et al., 2003). Many of the former studies used well-established measures of anxiety
such as the State-Trait Anxiety Inventory (STAI) by Spielberger, et al. (1983; Pseeko, et al,
2006; Thompson & Dinnel, 2007). The STAI asks participants to indicate, on a 4-point scale,
how anxious, comfortable, jittery, worried, at ease, nervous, relaxed, calm, etc., they feel.
Coefficient alpha for this measure has ranged from .79 to .96. Several other studies used self-
report scales similar to the STAI (e.g., Anderson, 2001; Carr & Steele, 2009; Grimm, et al.,
2009; Inzlicht & Ben-Zeev, 2003; Johns, et al., 2008).
Another example of a well-established measure of state test anxiety that has been used is
Morris, Davis, and Hutching’s (1981) Revised Worry Emotionality Scale (e.g., Keller &
Daunhiemer, 2003; Brodish & Devine, 2009) which asks participants to indicate on a 7-point
scale how they felt during the test. Items consist of “I felt that I did not do as well on this exam
as I thought I could” and “I felt my heart beating fast.” Coefficient alpha has ranged from .85 to
.87. Several other studies used self-report scales similar to this scale (e.g., Chung, et al., 2009;
Jamieson, 2009; Ployhart, et al., 2003).
One could argue that these questions (e.g., “I felt that I did not do as well on this exam as
I thought I could”) are too similar to the questions that researchers have used to assess perceived
ST (e.g., “I thought about my ability level.” See Table 3). These similarities are problematic,
and, unfortunately, many studies appear to combine the concept of ST with that of test anxiety
and use the terms interchangeably (e.g., Hollis Sawyer & Sawyer, 2008), further muddying the
distinction.
One component identified in qualitative research on PoST, and claimed to be unique to
ST (Steele et al., 2002), is a concern about what others will think of the individual if he or she
performs poorly on the test. But this is also a factor in many test anxiety scales. For example,

STEREOTYPE THREAT BOUNDARIES 58
the Friedman and Bendas-Jacob (1997) scale of test anxiety has three sub-dimensions: (1)
Cognitive Obstruction (e.g., “In a test, I feel like my head is empty, as if I have forgotten all I
have learned.”); (2) Physical Tenseness (e.g., “I am very tense before a test, even if I am well
prepared.”); and (3) Social Derogation (e.g., “If I fail a test, I am afraid I shall be rated as stupid
by my friends.”). Because there is so much overlap between some measures of anxiety and
perceived ST, it is difficult for researchers to conclude how each variable individually affects
performance.
In fact, many researchers argue that these inconsistencies in the literature exist because
ST is a form of test anxiety (Jensen, 1998) and that “the paradigm of stereotype threat is ideal to
study what happens when test anxiety affects test performance over and above the effects of the
targeted ability” (Wicherts & Zand Scholten, 2010, p. 173). How can we say the supposed
mediator is even distinct from the outcome variable (let alone being a mediator) if we are
measuring both perceived ST and test anxiety with the same questions? In other words, if
researchers have, in essence, assumed they are similar constructs and are using identical
measures, then it is very hard to say what and how much we really know. In an attempt to answer
this question, the current study examined the correlation between test anxiety and the PoST
measure developed based on the qualitative pilot study. The current study hypothesized that a
significant positive correlation would exist between these two measures. If this hypothesis is
supported, it would provide some evidence and a starting point for the idea that self-reported ST
was not uniquely different from test anxiety.
Hypothesis 10 (H10): A significantly positive relationship would be found
between the PoST measure and the test anxiety measure.

STEREOTYPE THREAT BOUNDARIES 59
Perceptions of Stereotype Threat vs. Test Motivation
Just as there is confusion expressed in the literature concerning how PoST differs from
test anxiety (e.g., Jensen, 1998), there is also confusion as to the distinction between PoST and
test motivation (Whaley, 1998). In fact, Whaley (1998) suggested that PoST is actually just an
indirect reflection of participants’ test taking motivation, and thus not a unique phenomenon. If
Whaley is correct, then it makes sense that ST manipulations could both hurt or help
performance, all depending upon whether the cue motivates or demotivates the person to
perform.
The measures used to assess motivation are also problematic, not only because they
consisted of only one to five self-report questions developed specifically for the studies, but also
because there was overlap between measures of motivation and perceived ST (e.g., Schimel et
al., 2004). For example, Schimel and colleagues (2004) asked in their measure of PoST to
indicate how hard participants will try on the task and how well participants expect to do, both of
which are items that can be found on measures of motivation. Most measures of motivation also
ask participants to rate how motivated they felt during the task or test or how much effort they
expended (e.g., Carr & Steele, 2009; Grimm, et al., 2009; Kiefer, 2005; Seibt & Forster, 2004;
Steele & Aronson, 1995).
The relationship between PoST and each motivational variable discussed previously was
assessed in the current study. Unfortunately, to date, no research has directly examined the
correlations between PoST and expectancy, valence, direction of behavior, intensity, or
persistence. Based on the previously cited research regarding how ST manipulations have
positively or negatively affected each of these motivational variables, the current study
hypothesized that for targets of the stereotype, a significantly negative correlation would exist

STEREOTYPE THREAT BOUNDARIES 60
between PoST and expectancy (e.g., Cohen & Garcia, 2005), valence (Wittenbrink, Judd, &
Park, 1997), and direction of behavior (Carr & Steele, 2009). These relationships were expected
to be negative because participants given the ST and priming cues were expected to report
greater PoST and fewer expectations for success, less valence, and fewer strategies attempted;
thus resulting in a negative correlation. In contrast, a significantly positive relationship between
PoST and intensity (Harrison et al., 2006) and persistence (Hansen & Wanke, 2007) toward the
task was expected. These relationships were expected to be positive because participants given
the ST and priming cues were expected to report greater intensity and persistence on the task and
greater PoST. If these hypotheses were supported, it would provide some evidence for the idea
that PoST was not uniquely different from test motivation.
Hypothesis 11a (H11a): A significantly negative relationship would be found
between the PoST measure and expectancy.
Hypothesis 11b (H11B): A significantly negative relationship would be found
between the PoST measure and valence.
Hypothesis 11c (H11c): A significantly negative relationship would be found
between the PoST measure and direction of behavior measures
Hypothesis 11d (H11d): A significantly positive relationship would be found
between the PoST measure and intensity.
Hypothesis 11e (H11e): A significantly positive relationship would be found
between the PoST measure and persistence measures.
The results of the studies mentioned in these last sections seem to suggest the supposed
ST cue manipulation may affect test anxiety, motivation, and/or PoST. But there is still
uncertainty as to how much (if any) each variable is affected by the ST cue. In other words, we

STEREOTYPE THREAT BOUNDARIES 61
are still unsure as to what the ST cue is really affecting. How is it affecting anxiety and
motivation? Is it actually some type of “threatening” feeling? Or perhaps it is simply confusion
that is leading to wasted resources. In order to answer these questions, the current study planned
to examine if these outcome variables were all affected similarly by the ST cues and stereotype
primes.
Qualitative Research
A final component of this research project was the collection of qualitative data regarding
participant reactions to the various manipulations. Interviews with participants in a pilot study
were used in an attempt to pin down more precisely what they were experiencing. Participant
reactions were used to make a final decision regarding the measures to be used in the main study.
Summary
Several researchers have argued and provided some evidence for the notion that ST is an
extension of other variables and not a construct that should exist on its own (e.g., Bennett &
Gaines, 2010; Delgado & Prieto, 2008; Wade, 2007; Whaley, 1998). If this is indeed correct,
then further substantive research on ST would be unwise and researchers would perhaps be well-
served by focusing their attention on other possible explanations for the performance differences
observed on various types of tests. The goal of the proposed study was to provide evidence
regarding ST and similar constructs and therefore be in a position to make clear
recommendations to future researchers. Bits and pieces of evidence do exist in some earlier
papers, but no one study has directly confronted the issue with this purpose in mind.
In the current study, reactions of various types were taken from participants in each cell
of the factorial design. This enabled not only a test of main effect and interactive mean
differences, but also a cross-condition examination of the correlational relationships existing

STEREOTYPE THREAT BOUNDARIES 62
between different outcomes. In general, if the ST cue does indeed create a “stereotype threat”
distinct from that created by a simple prime, then mean differences on various outcomes would
be expected. Most important would be a difference on the self-reported PoST measure, the
absence of which would seem to present a fatal flaw for the internal/construct validity of the ST
manipulation. Additional evidence was gleaned from the correlations amongst the outcome
measures. If ST is a unique phenomenon, results with the self-report PoST measure would not
simply mimic results obtained with measures of test anxiety or test motivation.
Method
Participants and Design
Using G*Power 3.1.5 (Erdfelder, Faul, & Buchner, 1996) to determine N with power of
.80, a small effect size of .25, and p = .01, a minimum of 280 participants were needed. A total
of 333 participants were recruited from multiple undergraduate business courses as well as the
Psychology subject pool at a Midwestern university. The participants received extra credit for
participation in the study. Participants were randomly assigned to a treatment condition and
tested in small groups. The study utilized a 3 (Blatant ST Cue vs. Implicit ST Cue vs. Stereotype
Prime) x 2 (Novel Stereotype vs. Well-Known Stereotype) factorial design along with a seventh
control condition.
Methodology for Testing the Construct Validity of the ST Measures: Hypotheses
The validity of the ST measures was assessed in three ways: (1) by testing each
hypothesis, (2) by examining goodness of fit indices and correlations with CFA analyses, and (3)
by conducting seven regression analyses. First, each of the hypotheses were tested and
examined. A majority of the hypotheses (H2-H9) predicted that only significant differences
would be found between the experimental groups and the control group and between targeted

STEREOTYPE THREAT BOUNDARIES 63
and non-targeted individuals. For each hypothesis, an exploration of any significant interactions
among the variables was examined, although no significant interactions were expected between
novelty of the stereotype and stereotype cue. Specific contrasts between conditions, especially
between each experimental condition and the control condition were also assessed at this time.
Methodology for Testing the Construct Validity of the ST Measures: CFA Analyses
The construct validity of the various PoST measures were also examined by assessing
goodness of fit indices and correlations calculated from CFA analyses across the four traits and
three response formats (see Figure 2 and 3). The purpose of these analyses was to help
determine if the measures were consistent with the ST theory (as described by Steele & Aronson,
1995) and help answer the question of just what exactly was induced by ST manipulations. The
response formats included a self-report Likert scale (SRLS), a self-report open-ended
questionnaire (SROE), and an interview (I). These three response formats were used to gather
data on all dependent variables, but the main dependent variables of interest were: PoST, test
anxiety, and test motivation. Participants across all seven conditions were given these dependent
measures (the details of the procedure will be discussed shortly).

STEREOTYPE THREAT BOUNDARIES 64
Figure 2. CFA design. Note: SRLS = Self-Report Likert Scale and Int = Interview
Ratings.
Figure 3. CFA design. Note: SRLS = Self-Report Likert Scale and SROE = Self-Report
Open-Ended Ratings.

STEREOTYPE THREAT BOUNDARIES 65
The correlations within the experimental groups were expected to be positive, such that
as PoST increases, so would test anxiety and test motivation. Evidence for convergent and
discriminant validity of the PoST measures was also examined
Methodology for Testing the Construct Validity of the ST Measures: Regression Analyses
In order to fully understand how (and if) PoST were distinct from measures of similar
traits, regression analyses were also used because it allowed for an examination of unique
variances. That is, in order to determine if additional variance was being accounted for when test
anxiety or test motivation was entered into the equation of the self-reported PoST and
performance, regression analyses were conducted for each experimental group and for stereotype
targets and non-targets with task performance as the dependent variable.
If additional variance was accounted for in one experimental group, but not in another
group, it would indicate that the type of cue or novelty of the stereotype interacted in such a way
to effect task performance differently. Furthermore, if additional variance was accounted for
when anxiety and/or motivation was added across all seven groups, it would indicate that ST was
accounting for unique variance in the dependent variable.
Procedure
Pilot study. Before primary data collection began, two pilot studies were conducted.
The main contribution of the pilot studies was to collect qualitative data through interviews and
open ended questions. Both pilot studies had seven conditions (Novel Blatant ST Cue vs. Well-
Known Blatant ST Cue vs. Novel Implicit ST Cue vs. Well-Known Implicit ST Cue vs. Novel
Stereotype Priming vs. Well-Known Stereotype Priming vs. Control). The first pilot study
involved interviews and contained 10 participants in each group for a total of 70 interview

STEREOTYPE THREAT BOUNDARIES 66
participants. Half of the participants were interviewed before testing and the remaining half were
interviewed after testing.
The second pilot study involved open-ended questionnaires where the participants were
asked to elaborate upon their feelings. Participants were run in small groups ranging from five to
twenty-three. The number of participants in each condition varied (see Table 7) for a total of 138
participants in this pilot study. Seventy-eight participants were asked to complete the open-
ended questionnaires before testing and 60 participants were asked to complete the
questionnaires after testing. By questioning the participants in this manner, the present
researcher hoped to obtain reactions regarding how a participant felt before and after testing. By
asking questions prior to testing, the research was able to determine what negative emotions, if
any, may have affected test performance. By asking open-ended questions after testing the
researcher hoped to not only avoid the possibility of the questions influencing participants’
feeling about the upcoming test but also to compare feelings before and after testing.
Table 7. Number of Participants Per Cell for Pilot Studies and Main Study
Pilot Study 1: Interviews Cue Type Novelty N
Blatant ST Well Known 10
Novel 10
Implicit ST Well Known 10
Novel 10
Stereotype Prime Well Known 10
Novel 10
Control Control 10
Total 70
Pilot Study 2: Open-Ended
Responses
Blatant ST Well Known 24
Novel 10
Implicit ST Well Known 30
Novel 11
Stereotype Prime Well Known 10
Novel 15
Control Control 38
Total 138

STEREOTYPE THREAT BOUNDARIES 67
The purpose of these pilot studies was to gather strong qualitative evidence for how the
participants reacted to the ST manipulations and stereotype primes. By gathering this type of
qualitative data, the present researcher hoped to obtain a better understanding of what, exactly, a
participant was feeling after given different types of cues. Also, items were added to the PoST
measure for the main study if they were expressed by participants during the pilot study and were
not already included on the self-report measures (these items will be discussed in greater detail
later). A secondary purpose of the pilot studies was to assess the validity of the novel stereotype.
Because the stereotype created for this study (that right-handed people perform poorly on
decision making tasks) was new and not universally known, the pilot study helped determine if
the cues and primes had the desired effect on participants’ performance.
Participants in the novel ST awareness groups received test instructions with the blatant
(explicitly informing the participants of the stereotype) or implicit (placement of the
demographic questionnaire) ST cues. Participants in the stereotype priming condition received a
scrambled sentence task to unconsciously prime the stereotype. The procedure for the pilot
study was identical to that of the primary study and is described in detail below. The entire
process for the pilot studies took approximately one and a half to two hours. The only difference
between the procedure for the pilot studies and the procedure for the main study was that pilot
studies’ participants were either interviewed or asked to complete the open ended questionnaires
before or after testing.
Main study. After the pilot studies were complete and data was analyzed, participants
were randomly assigned to one of the seven conditions. For the main study, there were a total of
333 participants, with each condition having between 40 and 61 participants (see Table 10). All
efforts were taken to keep the ratios of the experimental groups approximately equal, and the

STEREOTYPE THREAT BOUNDARIES 68
researcher kept record of how many participants were in each condition throughout data
collection. One hundred fifty-three participants were given the PoST, test anxiety, and
motivational measure prior to the WMC and decision-making tests and 180 participants were
given these measures after the WMC and decision-making tests. All participants were informed
that the purpose of the study was to gather performance data and reactions to those performance
measures. All participants were asked to fill out an informed consent form prior to starting the
experiment.
Participants in the Well-Known Blatant ST Cue condition were given the following
information after the informed consent form was signed: “Today you are going to complete three
different tests. We will also be asking you several different types of questions on your reactions
to these tests. The first test that you will be asked to complete is a scrambled sentence test. The
second test that you will be asked to complete is a working memory capacity test. The third test
that you will complete is a decision-making test. We must note that pervious research has shown
us that some people do not perform as well as others on this particular decision-making test.
Specifically, students from lower income families do not perform as well as students from higher
income families (Croizet & Claire, 1998).” By using a blatant ST cue it was expected that ST
would be activated within participants from lower income families.
Participants in the Novel Blatant ST Cue condition were given the following information:
“Today you are going to complete three different tests. We will also be asking you several
different types of questions on your reactions to these tests. The first test that you will be asked
to complete is a scrambled sentence test. The second test that you will be asked to complete is a
working memory capacity test. The third test that you will complete is a decision-making test.
We must note that previous research has shown us that some people do not perform as well as

STEREOTYPE THREAT BOUNDARIES 69
others on this particular decision-making test. Specifically, participants who consider
themselves predominately right-handed do not perform as well as participants who are
predominately left-handed or ambidextrous.” By using a blatant ST cue, it was expected that ST
would be activated within right-handed participants.
Participants in the both the Novel and Well-Known Implicit ST Cue conditions were
given the following information after the informed consent form was signed: “Today you are
going to complete three different tests. We will also be asking you several different types of
questions on your reactions to these tests. The first test that you will complete is a scrambled
sentence test. The second test that you will complete is a working memory capacity test. The
third test that you will complete is a decision-making test.” After receiving these instructions,
the participants were given the demographic questionnaire first (with those in the Novel
condition being asked their handedness and those in the Well-Known condition being asked
about their family income). Only these conditions received the demographic questionnaire first.
This was the same procedure used by Steele and Aronson (1995). According to the way ST
theory has been described previously (Steele & Aronson, 1995), the demographic questionnaire
implicitly primed the stereotype that predominately right-handed participants would perform
more poorly than predominately left-handed or ambidextrous participants for the novel
stereotype group and it implicitly primed the stereotype that students from lower income families
would perform more poorly than students from higher income families in the well-known
stereotype group.
Participants in the stereotype priming conditions were given the following information:
“Today you are going to complete three different tests. We will also be asking you several
different types of questions on your reactions to these tests. The first test that you will complete

STEREOTYPE THREAT BOUNDARIES 70
is a scrambled sentence test. The second test that you will complete is a working memory
capacity test. The third test that you will complete is a decision-making test.” After receiving
these instructions, the participants were given the scrambled sentence task. This measure
implicitly primed the stereotype that predominately right-handed participants would perform
more poorly than predominately left-handed or ambidextrous participants for the novel
stereotype group and it implicitly primed the stereotype that students from lower income families
would perform more poorly than students from higher income families in the well-known
stereotype group.
Finally, participants in the control condition were given the following instructions after
the informed consent form was signed: “Today you are going to complete three different tests.
We will also be asking you several different types of questions on your reactions to these tests.
The first test that you will be asked to complete is a scrambled sentence test. The second test
that you will be asked to complete is a working memory capacity test. The third test that you
will complete is a decision-making test.”
Participants completed the scrambled sentence task after the instructions (or after the
demographic questionnaire for participants in the Implicit ST Cue conditions). Approximately
half of the participants in each condition were asked to complete the self-report stereotype threat,
test anxiety, and motivational measures before the WMC test and decision-making test. The
remaining participants in each condition were asked to complete these measures after the WMC
test and decision-making test. The purpose for this was twofold: (1) Counter-balancing these
measures would reduce common source variance (Podsakoff et al., 2003), and (2) to assess the
possibility that completion of these measures before testing did not increase or decrease anxiety
or motivation.

STEREOTYPE THREAT BOUNDARIES 71
Next, for the WMC assessment, participants were asked to complete the Reading Span
Task (RSPAN; Daneman & Carpenter, 1980) followed by the decision-making test which
consisted of an in-basket managerial type task (Bergeron, Block, & Echtenkamp, 2006). The in-
basket task consisted of an instruction packet and a materials packet. It was administered to each
participant individually. Participants had 30 minutes to complete the task.
For the decision-making task, participants were asked to assume the role of a Human
Resources (HR) manager and respond to a series of memos. The participants were told that they
have just been promoted to a managerial position because the predecessor had suddenly resigned.
The participant was asked to sort through the materials found on the old manager’s desk.
Participants encountered two packets of materials. The first packet provided a set of instructions
and seven informational memos (e.g., guidelines for promotions, staff performance ratings, etc.).
The second packet consisted of 14 action memos that included issues of selecting a research
firm, hiring a compensation manager, permitting a job training course, sexual harassment, and
maternity leave. The set memos were considered complex because they are interrelated and the
contents of one memo can influence the participant’s responses to other memos. For example,
within two complex memos sets, participants received a memo from the current compensation
manager stating he was transferring to another department. A second memo indicated a
replacement was needed for the compensation manager. A third memo was a complaint from a
female employee over sexual harassment behaviors by a male employee (Michael). A fourth
memo (from Michael) requested information about a compensation training course and requested
approval from the new manager (the participant). A fifth memo (also from Michael) requested a
signature on a leave of absence form to attend the compensation training course. A sixth memo

STEREOTYPE THREAT BOUNDARIES 72
was a resignation letter from an employee (Michelle) who was engaged to be married and was
moving to a distant city.
In making a decision about (1) who to nominate as a replacement compensation manager
and (2) whether to allow Michael’s leave of absence, participants had to take into account the
information from each of the memos and consider any relevant information in the set of
informational memos. Specifically, one of the informational memos contained an EEOC policy
statement about sexual harassment (immediate investigation would occur for any employee
accused), another contained regulations for leaves of absences (one regulation states that no one
under investigation can take leave), another memo contained performance ratings (among 17
employees, Michelle, Michael, and May have top ratings, respectively), and another memo
contained guidelines for promotions (one regulation states that employees must have outstanding
performance ratings and exemplary moral conduct). Thus, the correct decision for a participant
to make would be to (1) nominate May as a candidate for compensation manager and (2) deny
Michael’s leave of absence due to the sexual harassment investigation. Participants were asked
to respond to each memo in writing, indicating a decision or plan of action (Bergeron, Block, &
Echtenkamp, 2006).
After completion of the task, the participants were asked to complete a brief group
identification measure, demographic questionnaire, and manipulation check measure.
Participants were debriefed and thanked for their participation. The entire process will took
approximately one hour (see Figure 4).

STEREOTYPE THREAT BOUNDARIES 73
Figure 4. Flowchart of the order of questionnaires for each experimental group.
Measures
Manipulation checks. First, in order to ensure that stereotype awareness was
manipulated in participants in the ST conditions, two open-ended questions were asked of all
participants after testing: “What was the purpose of the test you just took?” (Brown & Joseph,

STEREOTYPE THREAT BOUNDARIES 74
1999; Noruma, 2004) and “What do you think the purpose of this experiment is?” (Palumbo,
2007; Steele & Aronson, 1995). Second, in order to ensure that participants in the blatant ST cue
conditions were aware of the cue, participants were also asked “Did you notice that the testing
instructions mentioned that right handed (or low income family) participants would performance
worse on these tests than left handed (or high income family) participants?” Participants in the
stereotype priming conditions were also asked, “Did you notice in the scrambled sentence task
that ever word being left out was related to handedness (or income)?” Across all conditions,
participants were also asked if they experienced any confusion as to the directions given or what
was expected of them.
Scrambled sentence tasks. These tasks are based on the scrambled sentence test used in
Srull and Wyer (1979) and Bargh, Chen, and Burrows (1996) to prime participants. Research
has consistently demonstrated that participants respond to subconscious cues (e.g., Bargh, Chen,
& Burrows, 1996); therefore, a scrambled sentence task in the present study was constructed to
prime the participants with the stereotype that predominately right-handed individuals perform
more poorly on a decision-making task than predominately left-handed or ambidextrous
participants or that individuals from lower income families will perform more poorly on a
decision-making task than individuals from higher income families. A third, neutral scrambled
sentence task was also constructed for participants in the ST and control conditions. For each of
30 items, participants were asked to use the five words listed to construct a grammatically correct
four-word sentence as quickly as possible. The five word items were presented in random order.
For example, participants were asked to construct a grammatically correct four word sentence
from the string of the following five words: “was hesitant he quite rightness,” where the correct
answer was, “he was quite hesitant.” The critical priming stimuli were centered on decision

STEREOTYPE THREAT BOUNDARIES 75
making and handedness and were based on the scrambled sentence task for decisional
commitment created by Choma (2009; see Appendix A for the novel stereotype prime, Appendix
B for the existing stereotype prime, and Appendix C for the neutral prime).
Stereotype threat (PoST) measures. In order to determine what exactly ST is, and if it
even exists as described in the previous literature, several measures from past research were used
in the current study to examine ST. The first questionnaire that was used was a modified version
of the Evaluation Apprehension Scale (Spencer et al., 1999). This scale has been used in
previous ST research (e.g., Grimm et al., 2009; Inzlicht & Ben-Zeev, 2003; O’Brien & Crandall,
2003). Participants were asked to report the extent to which they agree to each question on a 7-
point Likert-type scale ranging from 1 (completely disagree) to 7 (completely agree). This scale
consisted of four items: “If I do poorly on this test, people will look down on me;” “People will
think I have less ability if I do not do well on this test;” “If I don’t do well on this test, others
may question my ability;” and “I feel self-confident.” The last item was reverse coded. The
internal consistency for this scale was reported as .82 (Spencer et al., 1999).
The second questionnaire that was used was the Academic Self-Worth Scale developed
by Lawrence and Crocker (2009). The same 7-point Likert-type scale was used to answer the
following four items: “I would feel like a loser if I were to perform poorly on this test,” “I would
feel worthless if I performed poorly on this test,” “I would feel terrific about myself if I did well
on this test,” and “I would feel like a winner if I performed well on this test.” The last two items
were reverse coded. The internal consistency for this scale was reported as .84 (Lawrence &
Crocker, 2009).
Four additional self-report questions were asked to further assess ST. The same 7-point
Likert-type scale described above was also used for these items. The four additional items were:

STEREOTYPE THREAT BOUNDARIES 76
“I believe that my performance on this test will confirm a negative stereotype about my group”
(modified from Gonzales et al., 2002); “I believe that a negative stereotype about my group will
contribute to my poor performance on this test” (modified from Johns et al., 2005); “I expect to
do well on this test,” (reverse coded) and “I feel threatened by the upcoming test” (modified
from Schimel et al., 2004). Thus, there was a total 13 self-report Likert-type scale questions
given to participants in the two pilot studies (see Appendix D). In order to obtain additional
information to assess the construct validity of ST, a similar open-ended questionnaire was also
given to participants in one of the pilot studies. The participants were asked to elaborate upon
their previous answers (see Appendix E). For participants in the first pilot study, individual
interviews were conducted. The interview questions were modified from Doan (2008), Cruz-
Duran (2010), Horton (2008), and Woolf et al. (2008). Additional follow up questions for
clarification were asked if needed (see Appendix F).
Finally, based on results from the pilot studies, additional questions were added to the
final PoST measure for the main study. Specifically, participants in the pilot studies reported
also feeling embarrassed, disappointed, pressured, insecure, indifferent, and frustrated.
Therefore, these emotions were also added to the measure using the same 7-point Likert-type
scale described above for a total of 18 questions on this measure (see Appendix D).
Test anxiety. A modified version of the Test Anxiety Inventory (TAI; Spielberger et al.,
1983) was used in the current study. The various forms of Spielberger’s anxiety inventories have
been used in multiple ST studies (e.g., Anderson, 2001; Pseekos et al., 2006; Schmader & Johns,
2003; Thompson & Dinnel, 2007). The TAI is a 20 item self-report measure that was designed
to measure individual differences related to test anxiety. In order to reduce the amount of time
that the participant will be in the laboratory, ten items were selected from this measure to be used

STEREOTYPE THREAT BOUNDARIES 77
in the current study. Using the definition of test anxiety cited previously, the current researcher
and a graduate student selected questions that best fit that definition (see Appendix G).
Participants were asked to report the extent to which they agree to each question on a 7-point
Likert-type scale ranging from 1 (completely disagree) to 7 (completely agree). The internal
consistency for the full scale has ranged from .83 to .96 (Spielberger et al., 1983). As with the
ST measure, the participants in the pilot studies were asked to elaborate upon their previous
answers in an open-response format (see Appendix H) or through interviews (see Appendix I).
Working memory capacity. The current study used the Reading Span Task (RSPAN;
Daneman & Carpenter, 1980). The RSPAN is a measure of verbal working memory capacity
that requires participants to judge whether sentences make sense while simultaneously holding
information in short term memory. Participants saw a sentence and immediately after each
sentence, a question mark and a capitalized letter followed (e.g., “Andy was stopped by the
policeman because he crossed the yellow heaven.? R”). Participants were asked to read each
sentence out loud and judge whether the sentence made sense by saying “yes” or “no”, as
indicated by the question mark. After the participant said “yes” or “no” to each sentence, they
were asked to immediately read the capitalized letter that followed the sentence out loud. After a
variable number of sentences and letters, the participant was asked to write down on their answer
sheet all of the capitalized letters that they saw in that set, in the same order that they saw them.
There were a total of five sets of questions with each set consisting of one to six sentences and
letters that needed to be recalled by the participant. Although the RSPAN is a popular WMC test
in the memory literature (Bailey, 2012), it has never been used to assess WMC in the ST
literature. The internal consistency for this scale was reported as .87 (Bailey, 2012).

STEREOTYPE THREAT BOUNDARIES 78
Motivational force: Expectancy and valence. The expectancy and valence variables
were assessed in the most neutral way possible in order to control for any possible outside factors
that could influence the relationship, such as ability level or previous experience with the task.
The current study used expectancy and valence measures used by Hollenbeck, Williams, and
Klein (1989) and Tubbs (1993). Expectancy was measured as the subjective probability (0-1) of
successfully completing the decision-making test within the allotted time period (“How likely is
it that you could complete the decision-making test within the allotted time period if you tried
your hardest?”). Valence was measured as the anticipated satisfaction associated with
completing the test (“How satisfied would you be if you completed the decision-making test
within the allotted time period?” and “How attractive would it be to complete the decision-
making test within the allotted time period?”). The valence items were measured on a 7-point
Likert-type scale (1 = very dissatisfied to 7 = very satisfied; see Appendix J).
Additionally, the participants in the pilot studies were asked to elaborate upon their
previous answers in an open-response format (see Appendix K) or through interviews (see
Appendix L).
Effort: Direction, intensity, and persistence. First, direction was measured using two
items modified from Gonzales, Blanton, and Williams (2002): “I plan on directing all my
attention toward the upcoming test,” and “I plan on using a strategy to complete the test
successfully.” These items were measured on a 7-point Likert-type scale (1 = completely
disagree to 7 = completely; see Appendix M). Additionally, the pilot study participants were
asked to elaborate upon their previous answers in an open-response format (see Appendix N) or
through interviews (see Appendix O).

STEREOTYPE THREAT BOUNDARIES 79
Second, intensity was measured using a modified version of the Harrison et al.’s (2006)
Effort Exerted Scale. This scale consisted of five items measured on a 7-point Likert-type scale
(1 = completely disagree to 7 = completely agree). The internal consistency for this scale was
reported as .86 (Harrison et al., 2006). The five items were as follows: “I plan to put forth a lot
of effort on the test,” “I plan to try very hard to complete the test successfully,” “I am going to
try to do my very best on the test,” “I am going to work hard to finish the test on time,” and “I
want to do as well as I can on the test” (see Appendix P). Additionally, the pilot study
participants were asked to elaborate upon their previous answers in an open-response format (see
Appendix Q) or through interviews (see Appendix R).
Finally, persistence was measured using a modified version of the effort regulation
subscale of the Motivation Strategies for Learning Questionnaire (MSLQ; Pintrich, Smith,
Garcia, & McKeachie, 1993). The internal consistency of this scale was reported as .69 by
Pintrich et al. (1993). This subscale consisted of four items which were modified for the
purposes of the current study (“I will feel so lazy or bored while I am working on these tasks that
I will quit before I finish what I planned to do,” “I plan to work hard to do well on these tasks
even if I didn’t like what it is,” “If the task is too difficult, I will either give up or only do the
easy parts of the task,” and “Even though if this task is dull and uninteresting, I will manage to
keep working until I am finished”). These items were measured on a 7-point Likert-type scale (1
= not at true for me to 7 = very true of me; see Appendix S). Additionally, the pilot study
participants were asked to elaborate upon their previous answers in an open-response format (see
Appendix T) or through interviews (see Appendix U).

STEREOTYPE THREAT BOUNDARIES 80
Task performance. Task performance was measured in terms of both quantity and
quality (Bergeron, Block, & Echtenkamp, 2006). Two raters coded all tasks and an average of
these scores was used. Inter-rater reliability was assessed with Cohen’s Kappa before averaging
scores (κ = .85). In terms of quality, one score (ranging from 1 to 20) was given for the total
number of simple and complex action memos to which the participant responded to with the
correct connections and rationale stated. In terms of quantity, the number of correct responses
the participants provides ranged from 0 to 5, with 5 being the maximum number of correct
responses (Bergeron, Block, & Echtenkamp, 2006).
Handedness questionnaire. The Edinburge Handedness Inventory was used to assess if
a participant was predominately right- or left-handed (Oldfield, 1971). This 10-item inventory
included questions regarding writing, drawing, throwing, using scissors, using a toothbrush,
using a knife, using a spoon, using a broom, striking a match, and opening a box. The alpha has
been reported to be .93 by Williams (1991; see Appendix V).
Demographic questionnaire. Finally, a brief demographic questionnaire was given to
each participant. The demographic questionnaire included questions regarding the participant’s
age, gender, race, and handedness or family income level. Based on recommendations by
Spenser and Castano (2007), family income was broken down into six categories and was used
as a continuous variable (see Appendix W).
Results
All analyses were conducted using SPSS-21 and LISREL 8.72. Because several t-tests
and factorial ANOVAs were used to assess the hypotheses, alpha levels for most analyses were
set at p = .01. Specifically, for analyses examining order effects or testing the null hypotheses
that no significant differences would be found between experimental groups, alpha was set at

STEREOTYPE THREAT BOUNDARIES 81
either p = .10 or p = .05 in order to limit the chances committing a Type II error. In all other
cases, alpha was set at p = .01 in order to decrease the chances of committing a Type I error.
Pilot Study: Qualitative Data
In order to determine how the participants reacted to the ST manipulations and stereotype
primes, interviews were conducted. The open-ended and interview data were coded by two
independent coders. Coders were blind to condition. Inter-rater reliability was assessed by
calculating Cohen’s (1968) kappa. For all variables, inter-rater reliability ranged from κ = .80 to
κ = .98. For items with a discrepancy between raters, the two raters explained why they coded
each variable and an agreement between the two raters was then made. This was the process
used for all discrepancies between the raters. The interview data was closely examined to
identify any trends in how participants reacted to the stereotype manipulations. Order effects
were also examined to determine if differences existed between participant responses for those
given the PoST, test anxiety, and motivational questionnaires before or after testing. No order
effects for the qualitative data were found and will therefore not be discussed further.
In an attempt to better understand the effects of ST cues, the following section describes
the findings from the qualitative data and offers some general comments on how ST cues and
stereotype primes may affect performance. First, participant answers were entered into “Word It
Out,” an online program that generates word clouds. A word cloud is a way to visually represent
qualitative data. The importance of each word or phrase is shown with font size, with larger
words occurring more frequently in the qualitative data than smaller words. Separate word
clouds were created for targets and non-targets of the stereotype in each experimental group for
the interview and open-ended data separately; however, because there were no differences in the
word clouds, the data were combined in an attempt to be more concise (see Figure 5).

STEREOTYPE THREAT BOUNDARIES 82
As can be seen in the Figure, there are some similarities between targets and non-targets.
For example, both targets and non-targets across all experimental groups expressed a strong
dismissiveness of the test results (e.g., replying to questions with “This is just a test”). By
visually examining the word clouds, differences were also seen. For example, targets given the
blatant ST cue expressed more confidence, nervousness, and a greater fear of failure than non-
targets. Targets given the implicit ST cue also expressed more nervousness, anxiety, and a
greater fear of failure than non-targets, whereas non-targets expressed more confidence and
relief. Finally, non-targets given a stereotype prime expressed more confidence, whereas targets
of the stereotype expressed more stress and anxiety.

STEREOTYPE THREAT BOUNDARIES 83
Figure 5. Word clouds for each experimental group.
Next, the combined qualitative data from the interviews and open-ended questionnaires
were coded into number of positive thoughts vs. number of negative thoughts. Targeted
participants across all experimental groups expressed more negative thoughts than targeted

STEREOTYPE THREAT BOUNDARIES 84
participants (191 vs. 131, respectively), but there was still a large majority of the non-targeted
participants that expressed at least one negative thought (see Table 8). Therefore, further
examination of the data was needed.
Table 8. Number of Negative Thoughts Expressed by Targets and Non-Targets of the Stereotype
Targets of
the
Stereotype
Non-
Targets of
the
Stereotype
Number
of
Negative
Thoughts
Frequency % Number
of
Negative
Thoughts
Frequency %
0 24 13% 0 20 16%
1 35 18% 1 25 20%
2 27 15% 2 23 19%
3 24 13% 3 13 9%
4 29 16% 4 7 5%
5 20 10% 5 14 10%
6 18 9% 6 14 10%
7 6 3% 7 7 5%
8 5 2% 8 5 4%
9+ 3 1% 9+ 3 2%
Total 191 131
After additional coding of the qualitative data between two coders, five general themes
emerged from the data: (1) concerns regarding poor ability or skills (i.e., “I am not good at
making decisions.”); (2) expression of negative emotions (i.e., “I am anxious or nervous. I am
afraid I will fail.”); (3) expressions of unimportance or dismissiveness of the tests (i.e., “This is
just a test and doesn’t count for a grade.”); (4) expression of neutral emotions (i.e., “I don’t care
about this test. I am here because I have to be.”); and (5) expression of positive emotions (i.e., “I
feel confident. I like to accomplish my goals.”). Frequency tables for targets and non-targets in
each experimental group were calculated in order to assess the frequency with which a
participant expressed each type of emotion (see Table 9).

STEREOTYPE THREAT BOUNDARIES 85
Table 9. Frequency Table and Z Test on the Differences in Proportions for Targets and Non-Targets in Each Experimental Group
Int.
Freq.
% Open
Freq.
% Total
%
Int.
Freq
% Open
Freq.
%
Total
%
Z Test
Int.
Z Test
Open Z Test
Blatant
Group
Targets
Blatant
Group
Non-
Targets
PoST
Meas.
Express
poor
ability
1 2% 22 10% 8% 1 2% 3 2% 2% N/A 0.50 3.10**
Express
negative
emotions
12 21% 33 15% 16% 9 19% 3 2% 5% 0.10 0.60 0.32
Express
unimport.
2 3% 48 22% 18% 0 0% 5 3% 2% N/A 1.00 0.90
Express
neutrality
7 13% 103 46% 40% 11 23% 80 40% 36% 0.50 1.40 0.60
Express
positive
emotions
34 61% 16 7% 18% 27 56% 108 53% 55% 0.40 3.40** 4.50**
Test
Anx.
Meas.
Express
poor
ability
6 8% 4 2% 4% 1 2% 0 0% 1% N/A N/A N/A
Express
negative
emotions
33 46% 30 18% 27% 17 27% 2 1% 10% 1.30 0.60 1.50
Express
unimport.
7 10% 32 20% 17% 7 11% 2 1% 4% 0.10 0.70 1.00
Express
neutrality
0 0% 84 52% 35% 0 0% 91 66% 45% N/A 1.90 1.30
Express
positive
emotions
26 36% 13 8% 17% 37 60% 43 32% 40% 1.90 2.20* 2.50*
Mot.
Meas.
Express
poor
ability
0 0% 2 1% 1% 0 0% 0 0% 0% N/A N/A N/A
Express
negative
emotions
10 9% 46 24% 18% 6 9% 4 2% 3% 1.00 1.00 1.20
Express
unimport.
0 0% 12 6% 4% 0 0% 0 0% 0% N/A N/A N/A
Express
neutrality
4 4% 72 38% 25% 1 2% 84 35% 28% N/A 0.40 0.40
Express
positive
emotions
100 87% 58 31% 52% 59 89% 155 63% 69% 0.40 4.20** 3.30**
Implicit
Group
Targets
Implicit
Group
Non-
Targets
PoST
Meas.
Express
poor
ability
8 10% 23 8% 9% 0 0% 2 1% 1% N/A 0.40 3.50**
Express
negative
emotions
34 43% 59 21% 25% 10 20% 11 4% 7% 1.30 1.30 1.80

STEREOTYPE THREAT BOUNDARIES 86
Table 9 Cont.
Int.
Freq.
% Open
Freq.
% Total
%
Int.
Freq
% Open
Freq.
% Total
%
Z Test
Int.
Z Test
Open
Z Test
Express
unimport.
0 0% 71 25% 20% 0 0% 11 4% 4% N/A 1.60 1.30
Express
neutrality
5 6% 102 36% 30% 7 14% 104 42% 36% 0.40 0.90 0.09
Express
positive
emotions
32 41% 27 10% 16% 33 66% 123 49% 52% 2.00* 3.70** 4.80**
Test
Anx.
Meas.
Express
poor
ability
12 10% 1 1% 4% 0 0% 0 0% 0% N/A N/A N/A
Express
negative
emotions
43 40% 52 25% 30% 12 21% 6 3% 7% 1.20 1.20 2.00*
Express
unimport.
8 7% 53 26% 20% 13 22% 9 5% 8% 0.90 1.40 1.30
Express
neutrality
4 3% 91 44% 30% 3 5% 134 65% 52% 0.10 3.10** 3.30**
Express
positive
emotions
41 40% 8 4% 16% 30 52% 56 27% 33% 1.00 1.40 2.10*
Mot.
Meas.
Express
poor
ability
3 2% 2 1% 1% 0 0% 0 0% 0% N/A N/A N/A
Express
negative
emotions
13 9% 26 12% 11% 3 3% 3 1% 1% 0.30 0.60 0.80
Express
unimport.
11 7% 16 8% 8% 12 13% 5 2% 4% 0.50 0.50 0.50
Express
neutrality
9 6% 69 33% 22% 10 11% 139 41% 35% 0.40 1.10 2.00*
Express
positive
emotions
115 76% 96 46% 58% 66 73% 187 56% 60% 0.40 1.60 0.40
Prime
Group
Targets
Prime Group
Non-Targets
PoST
Meas.
Express
poor
ability
9 9% 18 13% 11% 1 3% 3 2% 2% N/A 0.60 0.60
Express
negative
emotions
33 32% 20 14% 22% 8 22% 2 1% 5% 0.60 0.50 1.20
Express
unimport.
4 4% 37 27% 17% 0 0% 6 4% 3% N/A 1.20 0.90
Express
neutrality
12 11% 18 13% 12% 9 24% 60 38% 35% 0.80 2.00* 2.30*
Express
positive
emotions
46 44% 45 33% 38% 19 51% 89 55% 55% 0.50 2.40* 2.40*

STEREOTYPE THREAT BOUNDARIES 87
Table 9 Cont.
Int.
Freq.
% Open
Freq.
% Total
%
Int.
Freq
% Open
Freq.
% Total
%
Z Test
Int.
Z Test
Open Z Test
Test
Anx.
Meas.
Express
poor
ability
7 5% 1 1% 3% 1 2% 0 0% 1% N/A N/A N/A
Express
negative
emotions
26 20% 20 17% 18% 10 23% 5 4% 9% 0.20 0.70 0.80
Express
unimport.
1 1% 31 26% 13% 3 7% 6 5% 4% N/A 1.10 0.80
Express
neutrality
4 3% 24 20% 12% 1 2% 54 41% 32% N/A 1.80 2.00*
Express
positive
emotions
93 71% 43 36% 54% 29 66% 64 50% 54% 0.50 1.80 0.00
Mot.
Meas.
Express
poor
ability
1 1% 1 1% 1% 0 0% 0 0% 0% N/A N/A N/A
Express
negative
emotions
30 16% 10 8% 11% 2 3% 1 1% 1% 0.50 N/A 0.50
Express
unimport.
5 3% 4 2% 3% 3 4% 1 1% 2% 0.10 N/A 0.10
Express
neutrality
41 21% 23 17% 20% 12 18% 40 20% 20% 0.20 0.30 0.00
Express
positive
emotions
113 59% 99 72% 65% 50 75% 151 78% 77% 2.00* 1.10 2.70*
Control
PoST
Meas.
Express
poor
ability
0 0% 40 8% 6%
Express
negative
emotions
17 21% 40 8% 10%
Express
unimport.
2 3% 84 17% 15%
Express
neutrality
11 14% 171 35% 32%
Express
positive
emotions
50 62% 160 32% 37%
Test
Anx.
Meas.
Express
poor
ability
3 4% 3 1% 1%
Express
negative
emotions
22 27% 42 11% 14%
Express
unimport.
3 4% 39 10% 9%
Express
neutrality
3 4% 181 48% 40%

STEREOTYPE THREAT BOUNDARIES 88
Table 9 Cont.
Int.
Freq.
% Open
Freq.
% Total %
Express
positive
emotions
49 61% 114 30% 36%
Mot.
Meas.
Express poor
ability
0 0% 0 0% 0%
Express
negative
emotions
17 14% 49 10% 11%
Express
unimport.
9 7% 32 6% 6%
Express
neutrality
12 10% 128 26% 23%
Express
positive
emotions
83 69% 286 58% 60%
Note. * indicates significance at p < .05 and ** indicates significance at p < .01.
Table 9 was created by first coding the participant responses into at least one of the five
categories. After finding acceptable Cohen’s kappas (ranging from κ = .80 to κ = .98), the
frequency and percentage of each type of response was calculated for the interview and open-
ended data. Again, for items with a discrepancy between raters, the two raters explained why
they coded each variable and an agreement between the two raters was then made. Next, in
order to simplify the data and closely examine the differences between targets of ST and non-
targets for each item and for the scale, the total percentage was calculated (Table 9 only includes
the percentages for each scale). First, it should be noted that for all measures across all groups,
except in three instances (responses on the motivational measures for targets and non-targets
given a stereotype prime and responses for non-targets given a stereotype prime on the PoST),
interviewed participants reported more positive emotions than participant responses on the open-
ended questionnaire. In fact, there are a more significant differences found between targets and
non-targets given the open-ended questionnaires than between interviewed targets and non-
targets. Because the questions between these two response formats for all measures were almost

STEREOTYPE THREAT BOUNDARIES 89
identical, it is speculated that these differences exist due to the nature of the response format.
That is, interviewed participants may have responded more positively because they were being
interviewed by the researcher and did not want to be viewed negatively in any way; whereas,
participants responding on the open-ended questionnaire could be more open and honest.
Additional differences among the groups were also found. Specifically, targeted
participants in the blatant ST condition (those from low income families and those that were
right-handed) expressed a greater number of negative emotions and unimportance of the task;
whereas non-targeted participants (those from high income families and those that were left-
handed or ambidextrous) expressed more positive emotions (see Table 9). For example, when
asked if she felt threatened by the test, one right handed participant responded that she felt “a
little threatened because I was not sure if I had the ability to finish so I feel like I failed.” When
asked the same question, a left-handed participant responded that she “did not feel threatened
because I believe I have excellent decision making skills.” Similarly, when asked if a participant
believed in a negative stereotype, one individual responded, “No and yes. The instructions said
that people from low income families would do badly and I am not from that group, so I feel
better about my results.”
A similar result was found for test anxiety and motivation. One ambidextrous participant
commented that he did not feel anxious about the test because he felt “calm and confident that I
will know what to do.” This same participant expressed how unimportant the task was, stating
that “there is no need to worry because this is just a test and doesn’t count for a grade.”
Similarly, one participant from a high income family expressed that she felt highly motivated
because she “feels like this test will be a great challenge and I like challenges.” In contrast, one
participant that was a target of ST (from a low income family) stated that he was “afraid and

STEREOTYPE THREAT BOUNDARIES 90
worried I will fail because it seems too hard. This is very stressful.” A right handed participant
indicated that she was not motivated to try on the decision making test because she was “not
interested and it seems boring.”
Targeted participants given an implicit ST cue also expressed more negative and less
positive emotions across all measures than non-targeted participants (see Table 9). One
participant from a high income family expressed that he did not feel threatened because “I
understand how to make decisions and this type of test just isn’t threatening to me.” Similarly, a
left handed participant stated that she did not belief in negative stereotypes because “they just
don’t exist. You need to be happy with your group. I am and so stereotypes don’t matter to me.”
In contrast, a participant from a low income family stated that she felt “disappointed with myself
and I feel like I have let everyone, including myself down. I’m embarrassed.” She also
explained that she felt “very tense because I feel like I am being critically judged based on this
test and I am being evaluated solely by my performance on making a decision.” She further
stated that she felt so nervous she forgot facts that she knew because “I drew a blank and then I
got frustrated and it just made it worse.”
For participants given a stereotype prime, targeted individual expressed more negative
emotions than non-targeted individuals across all measures (see Table 9). Non-targeted
individuals expressed more neutral emotions on the test anxiety measure than did targeted
individuals. Interestingly, both groups expressed a high percentage of positive emotions on the
test anxiety measure. When asked why she was not nervous, one right-handed participant said
“My answers would be different if it was a test for my career field. I would be very nervous then.
But this is just for fun, so I’m approaching it with a happy attitude.” In contrast, when asked
why he was nervous, one left-handed participant stated that he “prefer to not know his results

STEREOTYPE THREAT BOUNDARIES 91
because I will just compare myself to others and that’s not healthy.” As with the other
conditions, non-targeted individuals expressed more positive emotions on the PoST and
motivational measures than targeted individuals. One right handed participant expressed “lots of
anxiety and stress” regarding the upcoming decision-making test. When asked why, he replied
that “I want to feel accomplished, but I often get stressed and anxious with exams so I know it
will happen again.” Another right handed participant explained that she did not feel threatened
by the test at all, but she did feel “anxious to see how I will perform,” whereas a left-handed
participant explained that he did not feel threated by the test because he felt “very confident in
my abilities to perform well.”
In order to quantify the percentages of positive and negative responses, Z tests were
computed on the difference in the proportions between targets and non-targets (see Table 9).
Unfortunately, because some groups contained one or no participants, Z tests could not be
calculated for those groups. There were, however, several significant results. First regarding the
PoST measure, there were significant differences in the proportions between the targets and non-
targets in the Blatant ST, Implicit ST, and Stereotype Prime groups for expressing positive
emotions (Z = 4.50, Z = 4.80, and Z = 2.40, respectively) with non-targets expressing more
positive emotions than targets. There were also significant differences in the proportions
between the targets and non-targets in the Blatant and Implicit ST groups for expressing
concerns with poor ability (Z = 3.10 and Z = 3.50, respectively) with targets expressing more
concern than non-targets. Finally, there was a significant difference in the Stereotype Prime
group regarding expression of neutral emotions (Z = 2.30) with non-targets expressing more
neutral emotions than targets.

STEREOTYPE THREAT BOUNDARIES 92
Next, regarding the test anxiety measure, a significant difference in the proportions was
found in the Blatant and Implicit ST groups for expression of positive emotions (Z = 2.50 and Z
= 2.10, respectively) with non-targets expressing more positive emotions than targets. There was
also a significant difference found in the Implicit ST and Stereotype Prime groups for expression
of neutral emotions (Z = 3.30 and Z = 2.00, respectively) with non-targets expressing more
neutral emotions than targets. Finally, regarding the motivational measures, there were
significant differences in the proportions between the targets and non-targets in the Blatant ST
and Stereotype Primes groups (Z = 3.30 and Z = 2.70, respectively) with non-targets expressing
more positive emotions than targets. There was a significant difference in the Implicit ST group
for expression of neutral emotions (Z = 2.00) with non-targets expressing more neutral emotions
than targets.
Last, there was some variability in the control group. Most participants expressed
positive or neutral emotions, but there were still a few that expressed negative emotions or
concerns over poor performance (see Table 9). For example, one participant expressed that she
“feels anxious and afraid I might fail, but I don’t at all feel threatened because it is just a test, it
can’t hurt me.” A majority of the control participant expressed neutral emotions on the test
anxiety measures, for example, one participant stated that he was not nervous because “I really
don’t care about this that much.” Finally, most participants in this condition expressed positive
emotions surrounding their motivation. One participant stated that he “just wants to do well
because it feels good to achieve something.”
In order to better understand the types of negative emotions that were being expressed by
participants, one last examination of the open-ended qualitative data was performed. All
participants had been asked to note any additional emotions they had experienced at the end of

STEREOTYPE THREAT BOUNDARIES 93
each measure. Two coders (κ = .95) examined the negative emotions expressed by participants
for this item and found that the emotions of nervousness, disappointment, and embarrassment
were expressed more often by targeted individuals than by non-targeted individuals.
Specifically, of the 108 targeted individuals, 20 participants used the word “disappointed” to
express how they felt, eight used the word “embarrassed”, and 66 used either the word “nervous”
or “anxious” to describe how they felt. Of the 100 non-targeted individuals, only two
participants expressed disappointment, one participant expressed embarrassment, and 19
expressed nervousness or anxiety.
Again, in order to quantify the percentages of responses on these three specific emotions,
Z tests were computed on the difference in the proportions between targets and non-targets. All
three tests resulted in a significant difference. Specifically, there was a significant difference in
the proportions between targets and non-targets on disappointment (Z = 3.90), embarrassment (Z
= 2.20), and anxiety/nervousness (Z = 6.20) with non-targets expressing significantly less of
these emotions than targets.
Pilot Study: Quantitative Data
After the qualitative data were analyzed, the quantitative data from both pilot studies was
also examined. In order to simplify the analyses, average scores were created for the PoST, test
anxiety, valence, intensity, persistence, and Group identification variables. These scores were
calculated by averaging each scale’s items. Using only the data from participants that were
interviewed, order effects were examined first for participants given the PoST, test anxiety, and
motivational measures before versus after the WMC and decision-making tests. Using
independent samples t-tests (α = .10), no significant differences on PoST, test anxiety, the five
motivational measures, WMC, and decision-making were found between participants who

STEREOTYPE THREAT BOUNDARIES 94
completed the ST, anxiety, and motivational materials before versus after testing. The data from
participants who completed the open-ended questionnaires were also examined in this manner
and no significant differences were found.
Next, the data from the interviewed participants was examined in order to assess the
validity of the novel stereotype. Using WMC as the dependent variable and α = .01, a 2(novel
vs. well-known stereotype) x 3(blatant ST cue vs. implicit ST cue vs. stereotype prime) factorial
ANOVA was calculated. Although no significant effects were found, the main effect for cue
type was approaching significance, F(6, 63) = 5.48, p > .01, η2 = .07. No significant effects were
found for either decision making quantity, F(6, 63) = 0.021, p > .01, η2 = .02, or quality, F(6, 63)
= 0.08, p > .01, η2 = .01.
Next, the data from participants who completed the open-ended questionnaire was
examined. Using WMC as the dependent variable and α = .01, a 2(novel vs. well-known
stereotype) x 3(blatant ST cue vs. implicit ST cue vs. stereotype prime) factorial ANOVA was
calculated. A significant main effect for novelty was found, F(6, 131) = 18.72, p < .01, η2 = .13.
Specifically, participants given a novel cue scored significantly higher on WMC (M = 3.42, s =
1.50) than did participants given a well-known cue (M = 2.08, s = 1.06), t(98) = -5.20, p < .01, d
= 1.03. No significant effects were found for either decision making quantity, F(6, 131) = 0.67,
p > .01, η2 = .03, or quality, F(6, 131) = 0.82, p > .01, η
2 = .04. Although no effects were found
for task performance in either pilot study data, there were significant effects for WMC. Because
there were significant effects for one of the dependent variables and because the qualitative data
demonstrates differences between targets and non-targets, the novelty of the stereotype was
validated and the main study was conducted.

STEREOTYPE THREAT BOUNDARIES 95
Main Analyses: CFA
In order to assess not only the unidimensionality of the scales, but also the potential
overlap among ST, test anxiety, and motivation, three confirmatory factor analyses (CFAs) were
computed using a correlated methods approach. Because different types of data were collected
for the interview, open-ended questionnaire, and main portions of the current study, three
separate CFAs had to be calculated. First, using only data collected from the interviews, CFAs
were performed across all experimental conditions on the Likert-scale ratings and the coded
interview ratings. The covariance matrices were computed for the ratings using the maximum
likelihood estimation as executed by LISREL 8.72. A one-factor, three-factor (ST, Test Anxiety,
and Motivation), and six-factor (ST Likert scores, ST Interview scores, Test Anxiety Likert
scores, Test Anxiety Interview scores, Motivation Likert scores, and Motivation Interview
scores) model was computed across all experimental conditions. The overall goodness of fit
indices (e.g., SRMR, RMSEA, CFI) were examined to assess each fit class (absolute, parsimony,
and comparative). The absolute fit indices (χ2, GFI) determine how well the proposed model fits
the data. The parsimony fit index (PNFI) determines how parsimonious, or simple, the model is.
The more complex the model is, the lower the fit index will be. Finally, the comparative fit
index (NFI) determines the discrepancy between the data and hypothesized model. As shown in
Table 10, the three-factor approach provided the best fit to the data (χ2
[df = 431] = 11.99,
RMSEA = .04, RMR = .02, GFI = .99, PNFI = .64, NFI = .69). That is, allowing the presence of
only three factors instead of one or six resulted in a significant improvement in model fit (Δχ2 =
180.15, Δdf = 379; Δχ2 = 37.85, Δdf = 203, respectively).
Next, a one-factor, three-factor, and six-factor CFA was performed across all
experimental conditions on the Likert-scale ratings and the coded open-ended ratings. The

STEREOTYPE THREAT BOUNDARIES 96
covariance matrices were computed for the ratings using maximum likelihood estimation. As
shown in Table 10, the three-factor approach provided the best fit to the data (χ2
[df = 558] =
937.97, RMSEA = .10, RMR = .38, GFI = .87, PNFI = .29, NFI = .31). That is, allowing the
presence of only three factors instead of one or six resulted in a significant improvement in
model fit (Δχ2 = 608.29, Δdf = 856; Δχ
2 = 378.98, Δdf = 304, respectively).
Finally, using only the Likert-scale data from the main study, a one-factor and three-
factor CFA was performed across all experimental conditions. The covariance matrices were
computed for the ratings using maximum likelihood estimation. As shown in Table 10, the three-
factor approach provided the best fit to the data (χ2 [df = 776] = 5332.27, RMSEA = .13, RMR =
.12, GFI = .57, PNFI = .82, NFI = .87). Allowing the presence of three factors instead of only
one factor resulted in a significant improvement in model fit (Δχ2 = 4014.80, Δdf = 3).

STEREOTYPE THREAT BOUNDARIES 97
Table 10. Confirmatory Factor Analyses Fit Statistics for Interview, Open-Ended, and Likert
Scale Data
Pilot Study 1: Interview and Likert-Scale Data
1-Factor 3-Factor 6-Factor Δ (1 vs. 3) Δ (3 vs. 6)
χ2 192.14 11.99 49.84 180.15 37.85
df 255 431 634 379 203
RMSEA 0.060 0.049 0.099
RMR 0.020 0.019 0.019
GFI 0.97 0.99 0.98
PNFI 0.65 0.64 0.72
NFI 0.67 0.69 0.74
Pilot Study 2: Open-Ended and Likert-Scale Data
χ2 1546.26 937.97 1316.95 608.29 378.98
df 1414 558 862 856 304
RMSEA 0.135 0.101 0.155
RMR 0.866 0.380 0.990
GFI 0.62 0.87 0.81
PNFI 0.58 0.29 0.82
NFI 0.75 0.31 0.85
Main Study: Likert-Scale Data
χ2 9347.07 5332.27 N/A 4014.80 N/A
df 779 776 3
RMSEA 0.240 0.130
RMR 0.180 0.120
GFI 0.30 0.57
PNFI 0.82 0.78
NFI 0.77 0.87
Note. Δ = Change in Chi-square and degrees of freedom (df)
In order to further assess the validity of the PoST measure, correlations were calculated
between the items on Likert-scale format of PoST, test anxiety, and motivation and the coded
interview items (see Table 11). Correlations were also calculated between the Likert-scale items
and the coded open-ended items for these three scales (see Table 12). Finally, using only the
Likert-scale data from the main study, correlations among the new ST items were calculated (see
Table 13).

STEREOTYPE THREAT BOUNDARIES 98

STEREOTYPE THREAT BOUNDARIES 99

STEREOTYPE THREAT BOUNDARIES 100

STEREOTYPE THREAT BOUNDARIES 101

STEREOTYPE THREAT BOUNDARIES 102

STEREOTYPE THREAT BOUNDARIES 103

STEREOTYPE THREAT BOUNDARIES 104
Table 13. Correlations Among New ST Items and Performance
Embarrassed Disappointed Pressured Insecure Indifferent Frustrated WMC Quality Quantity
Embarrassed 1
Disappointed .79** 1
Pressured .70** .65** 1
Insecure .55** .73** .58** 1
Indifferent .35** .34** .30** .41** 1
Frustrated .57** .57** .47** .49** .38** 1
WMC -.15** -.17** -.14** -.13* -.09 -.09 1
Quality -.10 -.09 -.05 -.12* -.22** -.13* .28** 1
Quantity -.15** -.14* -.09 -.17** -.22** -.19** .30** .87** 1
Note. * indicates significance at p < .05 and ** indicates significance at p < .01 level.
Main Analyses: Descriptive Statistics
The frequencies and correlations among the demographic variables and the number of
participants (N), means, and standard deviations (SD) across all experimental groups and within
each experimental group and for targets and non-targets for each variable of interest can be
found in Tables 14a and 14b, respectively. The mean age of the participants was M = 22.91.

STEREOTYPE THREAT BOUNDARIES 105
Table 14a. Table Frequencies and Correlations Among Demographic Variables
Frequencies
Gender
Male 139
Female 194
Ethnicity
African
American
43
Asian 29
Caucasian 229
Latino
/Hispanic
16
Native
American
1
Other 15
Income
Less than 25K 32
25-40K 37
40-60K 40
60-75K 22
75-100K 23
Greater than
100K
35
Handedness
Right 127
Ambidextrous/
Left
62
Correlations
Age Gender Ethnicity Income Handedness
Age 1
Gender -.04 1
Ethnicity -.19** -.05 1
Income -.24** .02 .14 1
Handedness -.04 -.01 .04 -.10 1
Note. ** indicates significance at p < .01level

STEREOTYPE THREAT BOUNDARIES 106
Table14b. Means, Standard Deviations, and N’s Across and Within Experimental Groups
Across Experimental
Groups
Targets
Non-Targets
N Mean SD N Mean SD N Mean SD
PoST 333 2.61 .97 218 2.70 .97 115 2.50 .94
Test Anxiety 333 2.21 1.36 218 2.31 1.41 115 2.03 1.22
Expectancy 333 76.24 24.81 218 75.88 24.44 115 77.44 25.14
Valence 333 5.35 1.27 218 5.37 1.26 115 5.32 1.26
Direction 333 4.84 1.83 218 4.81 1.86 115 4.88 1.82
Intensity 333 5.68 1.30 218 5.69 1.28 115 5.61 1.36
Persistence 333 5.51 1.18 218 5.52 1.15 115 5.43 1.24
Working Memory 333 3.22 1.38 218 3.09 1.46 115 3.45 1.18
Decision Making
Quality 333 7.86 4.57
218
6.99 4.29
115
9.49 4.73
Decision Making
Quantity 333 2.18 1.26
218
1.96 1.22
115
2.60 1.27
Well Known Blatant
ST Cue Group
PoST 61 2.59 .96 35 2.72 .99 26 2.43 .92
Test Anxiety 61 2.19 1.34 35 2.41 1.45 26 1.92 1.14
Expectancy 61 73.87 23.45 35 76.77 17.92 26 69.96 29.25
Valence 61 5.16 1.13 35 5.27 1.03 26 5.02 1.26
Direction 61 4.70 1.71 35 4.97 1.60 26 4.35 1.81
Intensity 61 5.45 1.32 35 5.50 1.18 26 5.39 1.51
Persistence 61 5.23 1.25 35 5.19 1.27 26 5.28 1.24
Working Memory 61 2.85 1.45 35 2.80 1.53 26 2.92 1.35
Decision Making
Quality 61 8.02 4.82
35
7.26 4.51
26
9.04 5.11
Decision Making
Quantity 61 2.15 1.25
35
2.00 1.26
26
2.35 1.23
Novel Blatant ST Cue
Group
PoST 44 2.54 .99 31 2.65 .97 13 2.27 1.01
Test Anxiety 44 2.15 1.30 31 2.17 1.29 13 2.09 1.39
Expectancy 44 73.01 26.95 31 70.86 27.67 13 78.15 25.45
Valence 44 5.65 1.25 31 5.73 1.11 13 5.46 1.57
Direction 44 4.77 1.95 31 4.71 2.04 13 4.92 1.80
Intensity 44 5.99 1.04 31 5.99 1.09 13 5.99 .93
Persistence 44 5.70 .92 31 5.65 .97 13 5.83 .79
Working Memory 44 3.05 1.31 31 2.87 1.43 13 3.46 .88
Decision Making
Quality 44 7.32 4.31
31
6.29 3.89
13
9.77
4.40
Decision Making
Quantity 44 1.95 1.14
31
1.74 1.13
13
2.46
1.05

STEREOTYPE THREAT BOUNDARIES 107
Table 14b Continued.
Targets
Non-Targets
Well Known Implicit
ST Cue Group N Mean SD N Mean SD N Mean SD
PoST 40 3.09 1.00 24 3.24 .99 16 2.87 1.00
Test Anxiety 40 2.60 1.50 24 2.85 1.57 16 2.12 1.35
Expectancy 40 83.04 16.79 24 81.17 13.79 16 85.84 20.69
Valence 40 5.35 1.19 24 5.33 1.29 16 5.38 1.09
Direction 40 4.78 1.58 24 4.75 1.70 16 4.81 1.42
Intensity 40 5.30 1.19 24 5.39 1.21 16 5.16 1.18
Persistence 40 5.54 1.02 24 5.37 .97 16 5.81 1.07
Working Memory 40 2.00 1.11 24 1.38 .71 16 2.94 .93
Decision Making
Quality 40 8.48 4.06
24
6.54
3.01
16
11.38
3.74
Decision Making
Quantity 40 2.10 1.11
24
1.58
.88
16
2.88
.96
Novel Implicit ST Cue
Group
PoST 53 2.57 1.06 37 2.73 1.04 16 2.21 1.03
Test Anxiety 53 2.20 1.54 37 2.35 1.63 16 1.93 1.30
Expectancy 53 76.49 26.82 37 71.89 29.38 16 87.13 15.80
Valence 53 5.08 1.42 37 4.93 1.34 16 5.41 1.58
Direction 53 4.43 2.10 37 4.38 2.09 16 4.56 2.19
Intensity 53 5.52 1.64 37 5.38 1.67 16 5.85 1.57
Persistence 53 5.60 1.26 37 5.69 1.24 16 5.41 1.32
Working Memory 53 3.60 1.35 37 3.61 1.39 16 3.81 1.28
Decision Making
Quality 53 6.51 4.20
37
5.70
3.80
16
8.38
4.62
Decision Making
Quantity 53 2.09 1.24
37
1.86
1.08
16
2.63
1.46
Well Known
Stereotype Prime
Group
PoST 44 2.47 .92 22 2.52 .95 22 2.41 .90
Test Anxiety 44 2.14 1.42 22 2.35 1.64 22 1.93 1.18
Expectancy 44 77.61 26.25 22 79.77 23.53 22 75.46 29.11
Valence 44 5.78 1.07 22 5.98 1.04 22 5.59 1.09
Direction 44 5.34 1.70 22 4.91 2.07 22 5.77 1.11
Intensity 44 6.23 1.00 22 6.33 .98 22 6.14 1.05
Persistence 44 5.78 1.22 22 5.97 1.06 22 5.60 1.36
Working Memory 44 3.73 .99 22 3.55 1.06 22 3.91 .92
Decision Making
Quality 44 7.55 4.10
22
6.32
3.56
22
8.77
4.31
Decision Making
Quantity 44 2.14 1.23
22
1.77
1.15
22
2.50
1.23

STEREOTYPE THREAT BOUNDARIES 108
Table 14b Continued. Targets Non-Targets
Novel Stereotype
Prime Group N Mean SD N Mean SD N Mean SD
PoST 47 2.38 .81 30 2.42 .83 17 2.33 .77
Test Anxiety 47 1.91 .88 30 1.92 .88 17 1.89 .89
Expectancy 47 71.38 28.43 30 72.57 29.51 17 69.29 27.18
Valence 47 5.04 1.49 30 4.92 1.55 17 5.27 1.38
Direction 47 5.23 1.63 30 5.23 1.38 17 5.24 2.05
Intensity 47 5.51 1.19 30 5.70 1.02 17 5.17 1.41
Persistence 47 5.38 1.15 30 5.54 1.05 17 5.10 1.29
Working Memory 47 3.79 1.41 30 3.87 1.47 17 3.65 1.37
Decision Making
Quality 47 8.30 4.69
30
7.40
3.86
17
9.88
5.67
Decision Making
Quantity 47 2.38 1.39
30
2.10
1.16
17
2.88
1.65
Control Group
PoST 44 2.70 .93
Test Anxiety 44 2.33 1.42
Expectancy 44 80.09 21.75
Valence 44 5.55 1.12
Direction 44 4.84 1.83
Intensity 44 5.83 1.32
Persistence 44 5.43 1.26
Working Memory 44 3.41 1.11
Decision Making
Quality 44 9.09 5.35
Decision Making
Quantity 44 2.43 1.43
Next, univariate outliers were assessed using z scores above 3.5 or below -3.5, and
multivariate outliers were assessed using Mahalanobis’ Distance in SPSS. Assumptions for each
analysis were also assessed. No outliers or violations of the assumptions were found. After an
assessment of outliers, internal consistencies of the scales were calculated. For the 18-item
Perceptions of Stereotype Threat Measure, Cronbach’s alpha was .89. For the 10-item Test
Anxiety Measure, Cronbach’s alpha was .95. For the two-item Valence Measure, Cronbach’s
alpha was .70 and for the five-item Motivational Intensity Measure, Cronbach’s alpha was .94.
Finally, for the four-item Motivational Persistence Measure, Cronbach’s alpha was .75. An item
analysis was also conducted and indicated that if any one item was removed from a scale, the
STEREOTYPE THREAT BOUNDARIES 109
alpha would decrease. This provided initial support for the reliability of the scales. Finally, in
order to simplify the analysis, average scores were created for each measure. These scores were
calculated by averaging the items on each scale; thus, creating an average PoST score, test
anxiety score, valence score, intensity score, persistence score, and group identification score.
These average scores were used to test the hypotheses.
Prior to testing each hypothesis, order effects were also examined for participants given
the PoST, test anxiety, and motivational measures before versus after the WMC and decision-
making tests. Using independent samples t-tests (α = .10), mean differences on PoST, test
anxiety, the five motivational measures, WMC, and decision-making were calculated between
participants given the 7 measures before versus after testing. Only one significant difference was
found for motivational persistence. Specifically, participants given the persistence measure
before testing reported significantly greater persistence than participants given the measure after
testing, t(331) = 2.80; p < .10; d = .31 (M = 5.70; M = 5.35, respectively). After further
examination, it was found that for participants given this measure before versus after testing,
there were no significant differences between targets of ST and non-targets of ST on
motivational persistence. Therefore, the responses for participants given the measures before and
after testing were collapsed and will not be discussed further.
Main Analyses: Hypotheses Tests
As stated earlier, the hypotheses offered in this paper reflected the belief of the author
that, as documented thus far, ST cue manipulations and PoST may not be distinct from other
similar types of primes or constructs. The hypotheses are contrary to what many advocates of
ST would predict, but were necessary at this point in time. Because several of the hypotheses
predicted the null, an alpha of .05 or .10 was used in order to protect against Type II errors. For

STEREOTYPE THREAT BOUNDARIES 110
hypotheses that suggested significant differences between groups, an alpha of .01 was used to
protect against Type I errors.
First, in order to test the first two hypotheses (H1a and H1b) that there will be no
significant main effect for novelty of stereotype across all dependent variables and the
interaction between novelty and cue type will be examined, a 2(novel vs. well-known stereotype)
x 3(blatant vs. implicit vs. stereotype prime) factorial ANOVA for each dependent measure was
calculated (α = .05). There was partial support for these two hypotheses. Specifically, there was
a significant main effect for novelty of stereotype for WMC, F(1, 326) = 16.71, p < .05, η2 = .05.
Post-hoc analyses revealed that participants given a novel stereotype scored significantly higher
on WMC than participants given a well-known stereotype (M = 3.49, s = 1.38; M = 2.88, s =
1.39, respectively), t(287) = -3.74, p < .05, d = .44. This was the only variable with a significant
main effect for novelty.
For H1b, there was a significant interaction between novelty and cue type for four
variables: WMC (F(2, 326) = 10.41, p < .05, η2
= .06), valence (F(2, 326) = 5.94, p < .05, η2 =
.04), intensity (F(2, 326) = 6.29, p < .05, η2 = .04), and persistence (F(2, 326) = 3.37, p < .05, η
2
= .02. Separate post hoc analyses were calculated for these variables. For WMC, a significant
difference was found between participants given a well-known implicit ST cue and those given a
novel implicit ST cue (t(144) = 4.09, p < .05, d = 1.29, such that participants given the novel
implicit ST cue performed significantly better on the WMC measure than participants given a
well-known implicit ST cue (M = 3.60, s = 1.35, M = 2.00, s = 1.11, respectively). For valence,
a significant difference was found between participants given a well-known blatant ST cue and
those given a novel blatant ST cue (t(144) = -3.40, p < .05, d = -2.79), such that participants
given a novel blatant ST cue reported significantly higher valence than those given a well-known

STEREOTYPE THREAT BOUNDARIES 111
blatant ST cue (M = 5.65, s = .19; M = 5.16, s = .16, respectively). For intensity, a significant
difference was found between participants given a well-known blatant ST cue and those given a
novel blatant ST cue (t(144) = -3.44, p < .05, d = -3.07), such that participants given a novel
blatant ST cue reported significantly higher intensity than those given a well-known blatant ST
cue (M = 5.99, s = .19; M = 5.45, s = .16, respectively). Finally, for persistence a significant
difference was found between participants given a well-known blatant ST cue and those given a
novel blatant ST cue (t(144) = -2.58, p < .05, d = -.42), such that participants given a novel
blatant ST cue reported significantly greater persistence toward the task than those given a well-
known blatant ST cue (M = 5.70, s = .91; M = 5.23, s = 1.25, respectively).
Next, in order to test the next hypothesis (H2a) that there will be no significant
differences between participants in the ST conditions and participants in the priming conditions
on feelings of threat (α = .10), but a significant difference between the experimental and control
group (α = .01), a 2(novel vs. well-known stereotype) x 3(blatant vs. implicit vs. stereotype
prime) factorial ANOVA for PoST was calculated. There was no support for this hypothesis,
such that no significant differences were detected between the experimental groups or between
the experimental groups and control group, either (F(6, 326) = 1.38, p > .10 and .01, η2 = .04).
In order to test the second half of hypothesis two (H2b), that individuals targeted by the
stereotype (right handed or low income individuals) will report significantly greater PoST than
individuals not targeted by the stereotype across all experimental groups, two 2(novel vs. well-
known stereotype) x 3(blatant vs. implicit vs. stereotype prime) x 2(right handed (or low income)
vs. left handed (or high income)) factorial ANOVAs for PoST was calculated (α = .01). No
support was found for either handedness, F(8, 189) = 1.07, p > .01, η2 = .05, or income, F(23,
165) = 1.28, p > .01, η2 = .15.

STEREOTYPE THREAT BOUNDARIES 112
Next, in order to test the third hypothesis (H3a) that there will be significant mean
differences across the conditions on measures of task performance, a 2(novel vs. well-known
stereotype) x 3(blatant vs. implicit vs. stereotype prime) factorial ANOVAs for decision making
quality and decision making quantity were calculated (α = .01). There was no support for this
hypothesis for both decision making quality, F(6, 326) = 1.67, p > .01, η2 = .03, and quantity,
F(6, 326) = 0.81, p > .01, η2= .02.
In order to test the second half of hypothesis three (H3b), that individuals targeted by the
stereotype (right handed or low income individuals) will perform significantly worse on task
performance than individuals not targeted by the stereotype across all experimental groups,
2(novel vs. well-known stereotype) x 3(blatant vs. implicit vs. stereotype prime) x 2(right handed
(or low income) vs. left handed (or high income)) factorial ANOVAs for was calculated for
decision making quality and quantity (α = .01). There was partial support for this hypothesis.
Handedness was examined first and no significant effects were found for quantity, F(8, 189) =
2.14, p > .01, η2 = .08, but a significant handedness main effect was found for quality, F(1, 189)
= 7.07, p < .01, η2 = .04. Post hoc analyses revealed that left handed and ambidextrous
participants (M = 9.32, s = .58) scored significantly higher than right handed participants (M =
6.48, s = .96), t(187) = -3.31, p < .01, d = 3.58. There were no other significant main effects or
interactions for this dependent variable.
Similarly, no significant effects were found for income on decision making quantity,
F(23, 165) = 1.74, p > .01, η2 = .19, but there was an income main effect found for quality, F(23,
165) = 4.15, p < .01, η2 = .11. Specifically, the post hoc analyses revealed that there was a
significant mean difference found between participants reporting a family income of less than 25
thousand (M = 6.81, s = 4.31) and those reporting an income greater than 100 thousand (M =

STEREOTYPE THREAT BOUNDARIES 113
10.71, s = 4.17), t(65) = -3.77, p < .01, d = .92. There was also a significant mean difference
found between participants reporting a family income of 25-40 thousand (M = 6.59, s = 3.21) and
those reporting an income greater than 100 thousand, t(70) = -4.71, p < .01, d = 1.11. Last, a
significant mean difference was also found between participants reporting a family income of
40-60 thousand (M = 6.59, s = 3.21) and those reporting an income between 75-100 thousand (M
= 9.74, s = 4.85), t(58) = -3.02, p < .01, d = .77. There were no other significant main effects or
interactions for this dependent variable.
Next, in order to test the fourth hypothesis (H4a) that there will be significant mean
differences across the conditions on WMC performance, a 2(novel vs. well-known stereotype) x
3(blatant vs. implicit vs. stereotype prime) factorial ANOVA was calculated (α = .01).
Significant differences were found, however, not in the hypothesized directions. First, as
mentioned in the first hypothesis, a significant main effect for novelty was found as was a
significant interaction between novelty and cue type. A significant main effect of cue type was
also found, F(2, 326) = 14.98, p < .01, η2 = .08. Specifically, the post hoc analyses demonstrated
that participants given a stereotype prime scored significantly higher on WMC (M = 3.76, s =
1.22) than did participants given a blatant ST cue (M = 2.93, s = 1.39), t(194) = -4.38, p < .01, d
= .63. There was also a significant mean difference on WMC scores between participants given
a stereotype prime (M = 3.76, s = 1.22) and those given an implicit ST cue (M = 2.91, s = 1.48),
t(182) = -4.21, p < .01, d = .63.
In order to test the second half of hypothesis four (H4b), that individuals targeted by the
stereotype (right handed or low income individuals) will perform significantly worse on WMC
performance than individuals not targeted by the stereotype across all experimental groups,
2(novel vs. well-known stereotype) x 3(blatant vs. implicit vs. stereotype prime) x 2(right handed

STEREOTYPE THREAT BOUNDARIES 114
(or low income) vs. left handed (or high income)) factorial ANOVAs for was calculated (α =
.01). There was partial support for this hypothesis. Handedness was examined first and no
significant effects were found for WMC, F(8, 189) = 1.46, p > .01, η2
= .06. Next, income was
examined and a significant main effect for cue type was found, F(2, 165) = 17.33, p < .01, η2 =
.17. Specifically, post hoc analyses revealed that there was a significant mean difference found
between participants reporting a family income of less than 25 thousand (M = 2.53, s = 1.39) and
those reporting an income greater than 100 thousand (M = 3.37, s = 1.19), t(65) = -2.66, p < .01,
d = .65. This was the only significant mean difference found.
Next, in order to test the fifth hypothesis (H5a) that there will be significant mean
differences between the control group and experimental groups on test anxiety (α = .01), but no
significant differences among experimental groups (α = .10), a 2(novel vs. well-known
stereotype) x 3(blatant vs. implicit vs. stereotype prime) factorial ANOVA was calculated. No
support was found for this hypothesis, F(6, 326) = 1.01, p > .01 and .10, η2 = .02. In order to test
the second half of hypothesis five (H5b), that individuals targeted by the stereotype (right handed
or low income individuals) will report significantly more test anxiety than individuals not
targeted by the stereotype across all experimental groups, 2(novel vs. well-known stereotype) x
3(blatant vs. implicit vs. stereotype prime) x 2(right handed (or low income) vs. left handed (or
high income)) factorial ANOVAs for were calculated (α = .01). No support was found for this
hypothesis for either handedness, F(8, 180) = 0.48, p > .01, η2 = .02, or income, F(23, 165) =
0.92, p > .01, η2 = .11.
For hypotheses 6a and 6b that there will be significant mean differences between the
control group and experimental groups on expectancy and valence toward the task (α= .01), but
no significant differences among experimental groups (α = .10), two 2(novel vs. well-known

STEREOTYPE THREAT BOUNDARIES 115
stereotype) x 3(blatant vs. implicit vs. stereotype prime) factorial ANOVAs were calculated. No
support was found for expectancy, F(6, 326) = 1.22, p > .01 and .10, η2 = .02, but a significant
novelty by cue type interaction for valence was found, F(2, 326) = 5.94, p < .10, η2 = .04. The
post hoc analyses demonstrated that participants given a well-known stereotype prime reported
significantly higher valence toward the task (M = 5.78, s = 1.07) than did participants given a
novel stereotype prime (M = 5.04, s = 1.49), t(89) = 2.71, p < .10, d = .57.
Next, in order to test the hypotheses 6c and 6d, that individuals targeted by the
stereotype (right handed or low income individuals) will report significantly lower expectations
for success and significantly less valence toward the task than individuals not targeted by the
stereotype across all experimental groups, 2(novel vs. well-known stereotype) x 3(blatant vs.
implicit vs. stereotype prime) x 2(right handed (or low income) vs. left handed (or high income))
factorial ANOVAs for were calculated for each dependent variable (α = .01). Regarding
expectancy, no support was found for this hypothesis for either handedness, F(8, 180) = 1.19, p >
.01, η2 = .05, or income, F(23, 165) = 1.58, p > .01, η
2 = .18. Regarding valence, again, no
support was found for handedness, F(8, 180) = 1.38, p > .01, η2 = .06, or income, F(23, 165) =
1.80, p > .01, η2 = .20.
For hypothesis 7a, that there will be significant mean differences between the
experimental conditions and control condition on direction of behavior (α = .01), but not among
the three experimental conditions (α = .10), a 2(novel vs. well-known stereotype) x 3(blatant vs.
implicit vs. stereotype prime) factorial ANOVA was calculated. No support was found for this
hypothesis, F(6, 326) = 1.47, p > .01 and .10, η2 = .03. In order to test the second half of
hypothesis seven (H7b), that individuals targeted by the stereotype (right handed or low income
individuals) will attempt significantly fewer strategies on the task than individuals not targeted

STEREOTYPE THREAT BOUNDARIES 116
by the stereotype across all experimental groups, 2(novel vs. well-known stereotype) x 3(blatant
vs. implicit vs. stereotype prime) x 2(right handed (or low income) vs. left handed (or high
income)) factorial ANOVAs for were calculated (α = .01). There were no significant effects for
handedness, F(8, 180) = 0.27, p > .01, η2 = .01, or for income, F(23, 165) = 1.29, p > .01, η
2 =
.15.
Next, in order to test hypothesis 8a, that there will be significant mean differences
between the three experimental conditions and the control condition on intensity (α = .01), but
not among the three experimental conditions (α = .10), a 2(novel vs. well-known stereotype) x
3(blatant vs. implicit vs. stereotype prime) factorial ANOVA was calculated. A significant
interaction between prime type and novelty was found, F(2, 326) = 6.29, p < .10, η2 = .04.
Specifically, post hoc analyses revealed that participants given a well-known stereotype prime
reported significantly higher intensity toward the task (M = 6.23, s = 1.00) than did participants
given a novel stereotype prime (M = 5.51, s = 1.19), t(89) = 3.14, p < .10, d = .66. There was
also a significant mean difference between those given a well-known blatant ST cue and those
given a stereotype prime, such that participants given the well-known blatant ST cue reported
significantly less intensity toward the task (M = 5.45, s = 1.32) than did participants given a well-
known stereotype prime (M = 6.23, s = 1.00), t(103) = 3.28, p < .10, d = .67. Furthermore, a
significant mean difference also existed between those given a well-known implicit ST cue and
those given a stereotype prime, such that participants given the well-known implicit ST cue
reported significantly less intensity toward the task (M = 5.30, s = 1.19) than did participants
given a well-known stereotype prime (M = 6.23, s = 1.00), t(82) = 3.90, p < .10, d = .85. Finally,
participants given a novel implicit ST cue reported significantly less intensity toward the task (M

STEREOTYPE THREAT BOUNDARIES 117
= 5.52, s = 1.64) than did participants given a well-known stereotype prime (M = 6.23, s = 1.00),
t(98) = 3.09, p < .10, d = .52.
In order to test the second half of hypothesis eight (H8b), that individuals targeted by the
stereotype (right handed or low income individuals) will report significantly greater intensity
toward the task than individuals not targeted by the stereotype across all experimental groups,
2(novel vs. well-known stereotype) x 3(blatant vs. implicit vs. stereotype prime) x 2(right handed
(or low income) vs. left handed (or high income)) factorial ANOVAs for were calculated (α =
.01). There were no significant effects for handedness, F(8, 180) = 1.63, p > .01, η2 = .07, or for
income level, F(23, 165) = 1.77, p > .01, η2 = .19.
For hypothesis 9a, that there will be significant mean differences between the three
experimental groups and the control condition on persistence (α = .01), but no significant
difference will be found among the three experimental groups (α = .10), a 2(novel vs. well-
known stereotype) x 3(blatant vs. implicit vs. stereotype prime) factorial ANOVA was
calculated. There was no support found for this hypothesis, F(6, 329) = 1.37, p > .01 and .10, η2
= .03. For the second half of hypothesis nine (H9b), that individuals targeted by the stereotype
(right handed or low income individuals) will report significantly greater persistence toward the
task than individuals not targeted by the stereotype across all experimental groups, 2(novel vs.
well-known stereotype) x 3(blatant vs. implicit vs. stereotype prime) x 2(right handed (or low
income) vs. left handed (or high income)) factorial ANOVAs for were calculated (α = .01). No
significant effects were found for handedness, F(8, 180) = 1.52, p > .01, η2
= .06, or for income,
F(23, 165) = 1.38, p > .01, η2 = .16.
Last, in order to test the hypotheses 10-11e, Pearson correlations among PoST, test
anxiety, expectancy, valence, direction of behavior, intensity, and persistence were calculated

STEREOTYPE THREAT BOUNDARIES 118
(see Table 15). A significantly positive relationship was found between PoST and test anxiety, r
= .61, demonstrating support for hypothesis 10. Significantly negative relationships were found
between PoST and direction of behavior (r = -.12), intensity (r = -.12), and persistence (r = -.26),
thus demonstrating support for hypotheses 11c-e. No significant relationships were found
between PoST and expectancy or valence.
Table 15. Correlations Among Perceptions of Threat, Test Anxiety, and Motivational
Variables
PoST Test
Anxiety
Expect-
ancy
Valence Direct-
ion
Inten-
sity
Persist-
ence
WMC Quality Quant
-ity
PoST 1
Test
Anxiety
.61** 1
Expectancy -.07 -.16** 1
Valence .04 .04 .30** 1
Direction -.12* -.07 .14* .32** 1
Intensity -.12* -.03 .14* .36** .57** 1
Persistence -.26** -.23** .15** .24** .40** .59** 1
WMC -.14* -.12* -.02 -.04 .05 .05 .06 1
Quality -.20** -.22** .19** .10 .09 .18** .23** .28** 1
Quantity -.23** -.26** .20** .07 .08 .16** .16** .30** .87** 1
Note. * indicates significance at p < .05 level and ** indicates significance at p < .01level
In order to further understand these relationships, additional 2(novel vs. well-known
stereotype) x 3(blatant vs. implicit vs. stereotype prime) x 2(high group identification vs. low
group identification) factorial ANOVA were calculated (α = .01) for PoST, test anxiety, the
motivational variables, WMC, and decision-making quantity and quality. Only one main effect
of group identification was found for WMC, F(16, 272) = 2.12, p < .01, η2
= .10. Specifically,
post hoc analyses revealed that individuals scoring high in group identification (M = 3.70, s =
1.29) performed significantly better on the WMC test than did individuals scoring low in group
identification (M = 2.98, s = 1.42), t(287) = 4.06, p < .01, d = .53.
Finally, in an attempt to better understand what, exactly, participants are feeling when
given a ST cue, additional 2(novel vs. well-known stereotype) x 3(blatant vs. implicit vs.
stereotype prime) factorial ANOVAs were calculated (α = .01) for each individual item of the

STEREOTYPE THREAT BOUNDARIES 119
PoST measure. Only significant relationships are discussed. A significant main effect for prime
type was found for question thirteen (“I will feel embarrassed if I perform poorly on the test.”),
F(2, 326) = 7.92, p < .01, η2 = .05. Specifically, participants given the implicit ST cue expressed
more embarrassment (M = 2.91, s = 1.69) than did participants given the blatant ST cue (M =
2.24, s = 1.48), t(196) = -2.98, p < .01, d = .42, or the stereotype prime (M = 2.18, s = 1.41),
t(182) = 3.19, p < .01, d = .47. A significant main effect was also found for question fourteen (“I
will feel disappointed if I perform poorly on the test.”), F(2, 326) = 18.43, p < .01, η2
= .05.
Again, participants given the implicit ST cue expressed more disappointment (M = 2.97, s =
1.67) than did participants given the blatant ST cue (M = 2.30, s = 1.43), t(196) = 3.05, p < .01, d
= .43, or the stereotype prime (M = 2.23, s = 1.26), t(182) = 3.38, p < .01, d = .50. Finally, a
significant main effect was found for question eighteen (“I will feel frustrated if I perform poorly
on the test.”), F(2, 326) = 6.08, p < .01, η2
= .04. Participants given the implicit ST cue
expressed more frustration (M = 3.31, s = 1.57) than did participants given the stereotype prime
(M = 2.62, s = 1.41), t(182) = 3.16, p < .01, d = .46.
Main Analyses: Regression Analyses
Regression analyses were also conducted in order to determine if additional, unique
variance was being accounted for when test anxiety or test motivation was entered into the
equation of the self-reported PoST and performance. To address this question, regression
analyses were conducted across the experimental groups and within each experimental group
with WMC, decision-making quality, and decision-making quantity as the dependent variables.
Regression analyses were also conducted for both targets of the stereotype and non-targets of the
stereotype. The regression statistics as well as the partial correlations can be found in Table 16.

STEREOTYPE THREAT BOUNDARIES 120
First, a linear regression analysis was conducted across all experimental groups for each
of the dependent variables. Using WMC as the dependent variable first, PoST, test anxiety, and
the motivational variables were entered into the equation. The weighted combination of the
predictor variables explain only 3% of the variance in WMC, r2 = .03; p = .28. The squared
semipartial correlations were examined next for each predictor. These values indicate the
percentage of variance each predictor uniquely explains. For WMC, PoST only accounts
uniquely for about .64% of the variance, test anxiety uniquely accounts for .34%, expectancy and
valence each accounts uniquely for .16%, direction uniquely accounts for .49%, intensity for
.04%, and persistence uniquely accounts for 0% of the variance (see Table 16).
Next, using decision making quality as the dependent variable, the seven predictor
variables were entered into the equation and they accounted for approximately 11% of the
variance in decision making quality, r2 = .11; p < .01. For this dependent variable, PoST only
accounts uniquely for about .36% of the variance, test anxiety for .81% of the unique variance,
expectancy for 1.4% of the unique variance, valence accounts uniquely for .01%, direction for
.04% of the unique variance, intensity for .16%, and persistence uniquely accounts for 1% of the
variance (see Table 16).
Using decision making quantity as the dependent variable, the seven predictor variables
were entered into the equation and together they accounted for approximately 11% of the
variance in decision making quantity, r2 = .11; p < .01. For this dependent variable, PoST only
accounts uniquely for about .64% of the variance, test anxiety for 1.69% of the unique variance,
expectancy for 2.25% of the unique variance, valence accounts uniquely for .01%, direction for
0% of the unique variance, intensity for .81%, and persistence uniquely accounts for 0% of the
variance (see Table 16).

STEREOTYPE THREAT BOUNDARIES 121
Next, in order to examine more closely the variability within groups, linear regression
analyses were conducted within each experimental group and also for targets and non-targets of
the stereotype. In an attempt to be more parsimonious, only significant relationships will be
discussed. For the Blatant ST Cue Condition, approximately 14% of the variance in WMC was
accounted for by the combined predictor variables r2 = .14. Only PoST, however, accounted for
a significant amount of unique variance (5.8%). Test anxiety accounted for a significant amount
of unique variance in both decision-making quantity and quality (4.4% in both variables) for the
Implicit ST group and in the Stereotype Prime group, expectancy accounted for a significant
amount of the unique variance in both of these dependent variables (6.3% for both, see Table
16).
Because there is variance being accounted for within each model but in most cases none
of the individual predictors are significant, an overlap in the predictor variables may be the
cause. Therefore, variance inflation factors (VIF) were calculated in order to assess
multicollinearity. The VIF measures how “inflated” the variance of the coefficient is, compared
to what it would be if the variable were uncorrelated with any other variable in the model
(Belsley, Kuh, & Welsch, 1980). Most researchers suggest that a VIF greater than five indicates
multicollinearity (Belsley, et al., 1980). As can be seen in Table 16, none of the VIF values in
the current study are greater than five. However, there are other informal signs that might
indicate multicollinearity, including a significant overall F test for fit but a lack of a significant t
statistic for the individual coefficients (Belsley, et al., 1980). Again, as can be seen in Table 16,
a majority of the F tests for decision-making quality and quantity are significant, but most of the
individual t tests are not. These results suggest an overlap among the predictor variables for
these two dependent variables.

STEREOTYPE THREAT BOUNDARIES 122
Table 16. Regression Analyses
Across all conditions: Dependent Variable: Working Memory
Capacity
Independent Variable r² B SE β t
P-
Value
Partial
r2
VIF
F(7, 325) = 1.24, p = .28 0.03
Constant 3.68 0.55 6.72 0.00
PoST -0.14 0.10 -0.09 -1.35 0.18 0.006 1.65
Test Anxiety -0.07 0.07 -0.07 -0.99 0.32 0.004 1.67
Expectancy -0.01 0.00 -0.04 -0.63 0.53 0.002 1.14
Valence -0.05 0.07 -0.05 -0.73 0.46 0.002 1.28
Direction 0.06 0.05 0.08 1.27 0.21 0.005 1.53
Intensity 0.03 0.08 0.03 0.39 0.70 0.000 2.01
Persistence 0.00 0.08 0.00 0.03 0.98 0.000 1.68
Dependent Variable: Decision Making Quality
Independent Variable r² B SE β t
P-
Value
Partial
r2 VIF
F(7, 325) = 5.69, p = .00 0.11
Constant 3.55 1.74 2.05 0.04
PoST -0.34 0.32 -0.07 -1.06 0.29 0.004 1.65
Test Anxiety -0.43 0.23 -0.13 -1.88 0.06 0.008 1.67
Expectancy 0.02 0.01 0.13 2.28 0.02 0.014 1.14
Valence 0.04 0.21 0.01 0.17 0.86 0.000 1.28
Direction 0.07 0.14 0.03 0.46 0.64 0.000 1.53
Intensity 0.19 0.25 0.05 0.76 0.45 0.002 2.01
Persistence 0.50 0.26 0.13 1.89 0.06 0.010 1.68
Dependent Variable: Decision Making Quantity
Independent Variable r² B SE β t
P-
Value
Partial
r2 VIF
F(7, 325) = 6.07, p = .00 0.11
Constant 1.67 0.48 3.50 0.00
PoST -0.13 0.09 -0.10 -1.52 0.13 0.006 1.65
Test Anxiety -0.15 0.06 -0.17 -2.44 0.02 0.017 1.67
Expectancy 0.01 0.01 0.15 2.68 0.00 0.023 1.14
Valence -0.01 0.06 -0.01 -0.23 0.82 0.000 1.28
Direction 0.00 0.04 0.00 -0.04 0.97 0.000 1.53
Intensity 0.12 0.07 0.12 1.71 0.09 0.008 2.01
Persistence 0.01 0.07 0.01 0.05 0.96 0.000 1.68

STEREOTYPE THREAT BOUNDARIES 123
Table 16 Cont.
Blatant ST Cue Condition Dependent Variable: Working Memory
Capacity
Independent Variable r² B SE β t
P-
Value
Partial
r2 VIF
F(7, 104) = 1.71, p = .12 0.14
Constant 3.04 0.99 3.07 0.00
PoST -0.42 0.17 -0.29 -2.54 0.01 0.058 1.47
Test Anxiety 0.13 0.12 0.12 1.07 0.29 0.010 1.46
Expectancy -0.01 0.01 -0.14 -1.44 0.15 0.012 1.10
Valence 0.09 0.12 0.07 0.71 0.48 0.005 1.22
Direction 0.15 0.08 0.20 1.89 0.06 0.032 1.51
Intensity 0.00 0.14 0.00 0.03 0.98 0.000 1.95
Persistence 0.02 0.15 0.01 0.10 0.92 0.000 1.59
Dependent Variable: Decision Making Quality
Independent
Variable r² B SE β t
P-
Value
Partial
r2 VIF
F(7, 104) = 2.07, p = .05 0.13
Constant 6.01 3.29 1.82 0.07
PoST -1.17 0.55 -0.25 -2.13 0.04 0.040 1.47
Test Anxiety -0.19 0.41 -0.05 -0.47 0.64 0.003 1.46
Expectancy 0.01 0.02 0.07 0.75 0.46 0.005 1.10
Valence 0.21 0.40 0.05 0.52 0.61 0.003 1.22
Direction 0.05 0.26 0.02 0.19 0.85 0.000 1.51
Intensity -0.08 0.46 -0.02 -0.17 0.86 0.000 1.95
Persistence 0.60 0.48 0.15 1.24 0.22 0.014 1.59
Dependent Variable: Decision Making Quantity
Independent Variable r² B SE β t
P-
Value
Partial
r2 VIF
F(7, 104) = 2.72, p = .06 0.11
Constant 2.99 0.87 3.44 0.00
PoST -0.35 0.15 -0.28 -2.41 0.02 0.053 1.47
Test Anxiety -0.07 0.11 -0.08 -0.68 0.50 0.005 1.46
Expectancy 0.00 0.01 0.05 0.51 0.61 0.000 1.10
Valence 0.01 0.11 0.01 0.05 0.96 0.000 1.22
Direction 0.00 0.07 0.01 0.05 0.96 0.000 1.51
Intensity 0.03 0.12 0.03 0.26 0.80 0.000 1.95
Persistence -0.05 0.13 -0.05 -0.39 0.70 0.000 1.59

STEREOTYPE THREAT BOUNDARIES 124
Table 16 Cont.
Implicit ST Cue Condition Dependent Variable: Working Memory
Capacity
Independent Variable r² B SE β t
P-
Value
Partial
r2 VIF
F(7, 92) = 0.61, p = .75 0.05
Constant 3.52 1.13 3.12 0.00
PoST -0.06 0.21 -0.04 -0.28 0.78 0.001 2.06
Test Anxiety -0.12 0.16 -0.13 -0.78 0.44 0.006 2.29
Expectancy 0.01 0.01 0.09 0.78 0.44 0.006 1.24
Valence -0.08 0.15 -0.07 -0.56 0.58 0.004 1.62
Direction -0.07 0.10 -0.09 -0.74 0.47 0.006 1.65
Intensity 0.02 0.15 0.02 0.16 0.88 0.000 2.00
Persistence 0.00 0.17 0.00 0.02 0.99 0.000 1.58
Dependent Variable: Decision Making Quality
Independent Variable r² B SE β t
P-
Value
Partial
r2 VIF
F(7, 92) = 2.32, p = .03 0.16
Constant 4.52 3.05 1.48 0.14
PoST 0.17 0.57 0.04 0.30 0.76 0.001 2.06
Test Anxiety -0.91 0.42 -0.32 -2.15 0.03 0.044 2.29
Expectancy 0.03 0.02 0.16 1.43 0.16 0.020 1.24
Valence 0.27 0.40 0.09 0.69 0.49 0.005 1.62
Direction 0.06 0.27 0.03 0.22 0.82 0.000 1.65
Intensity 0.07 0.41 0.03 0.18 0.86 0.000 2.00
Persistence 0.02 0.46 0.01 0.04 0.97 0.000 1.58
Dependent Variable: Decision Making Quantity
Independent Variable r² B SE β t
P-
Value
Partial
r2 VIF
F(7, 92) = 3.66, p = .00 0.19
Constant 1.24 0.83 1.49 0.14
PoST 0.01 0.16 0.01 0.04 0.97 0.000 2.06
Test Anxiety -0.25 0.12 -0.33 -2.19 0.03 0.044 2.29
Expectancy 0.01 0.01 0.18 1.65 0.10 0.027 1.24
Valence 0.04 0.11 0.04 0.33 0.75 0.001 1.62
Direction -0.03 0.07 -0.04 -0.33 0.74 0.001 1.65
Intensity 0.11 0.11 0.14 1.00 0.32 0.010 2.00
Persistence 0.01 0.13 0.01 0.05 0.96 0.000 1.58

STEREOTYPE THREAT BOUNDARIES 125
Table 16 Cont.
Prime Condition Dependent Variable: Working Memory
Capacity
Independent Variable r² B SE β t
P-
Value
Partial
r2 VIF
F(7, 90) = 0.97, p = .46 0.07
Constant 4.52 0.92 4.93 0.00
PoST 0.24 0.19 0.17 1.26 0.21 0.017 1.58
Test Anxiety -0.14 0.15 -0.13 -0.93 0.35 0.008 1.79
Expectancy 0.00 0.01 0.05 0.40 0.69 0.002 1.41
Valence -0.21 0.11 -0.23 -1.87 0.06 0.040 1.36
Direction 0.02 0.09 0.03 0.27 0.79 0.001 1.95
Intensity -0.08 0.18 -0.07 -0.43 0.67 0.003 3.02
Persistence -0.04 0.16 0.04 0.25 0.80 0.001 2.12
Dependent Variable: Decision Making Quality
Independent Variable r² B SE β t
P-
Value
Partial
r2 VIF
F(7, 90) = 2.00, p = .06 0.12
Constant 2.84 3.21 0.88 0.38
PoST -0.03 0.67 -0.01 -0.03 0.97 0.000 1.58
Test Anxiety 0.01 0.51 0.00 0.02 0.98 0.000 1.79
Expectancy 0.05 0.02 0.30 2.42 0.02 0.063 1.41
Valence -0.36 0.39 -0.11 -0.93 0.36 0.010 1.36
Direction 0.22 0.30 0.08 0.74 0.46 0.006 1.95
Intensity -0.04 0.62 -0.01 -0.06 0.95 0.000 3.02
Persistence 0.47 0.55 0.13 0.85 0.40 0.008 2.12
Dependent Variable: Decision Making Quantity
Independent Variable r² B SE β t
P-
Value
Partial
r2 VIF
F(7, 90) = 3.17, p = .06 0.07
Constant 1.08 0.95 1.13 0.26
PoST -0.04 0.20 -0.03 -0.22 0.83 0.000 1.58
Test Anxiety -0.03 0.15 -0.03 -0.21 0.83 0.000 1.79
Expectancy 0.02 0.01 0.30 2.49 0.02 0.063 1.41
Valence -0.13 0.12 -0.13 -1.10 0.27 0.012 1.36
Direction 0.10 0.09 0.12 1.07 0.29 0.012 1.95
Intensity 0.09 0.18 0.08 0.48 0.63 0.003 3.02
Persistence -0.01 0.16 -0.01 -0.06 0.95 0.000 2.12

STEREOTYPE THREAT BOUNDARIES 126
Table 16 Cont.
Control Condition Dependent Variable: Working Memory
Capacity
Independent Variable r² B SE β t
P-
Value
Partial
r2 VIF
F(7, 43) = 1.29, p = .28 0.17
Constant 1.00 1.53 0.66 0.52
PoST 0.44 0.25 0.37 1.77 0.09 0.073 1.87
Test Anxiety -0.12 0.14 -0.15 -0.81 0.42 0.014 1.44
Expectancy 0.00 0.01 -0.04 -0.27 0.79 0.002 1.03
Valence -0.08 0.16 -0.08 -0.50 0.62 0.006 1.15
Direction -0.06 0.09 -0.10 -0.63 0.53 0.010 1.22
Intensity 0.19 0.20 0.23 0.95 0.35 0.023 2.49
Persistence 0.23 0.23 0.26 0.98 0.33 0.023 3.09
Dependent Variable: Decision Making Quality
Independent Variable r² B SE β t
P-
Value
Partial
r2 VIF
F(7, 43) = 2.19, p = .05 0.29
Constant -6.91 6.80 -1.02 0.32
PoST 1.66 1.12 0.29 1.49 0.15 0.044 1.87
Test Anxiety -0.76 0.64 -0.20 -1.19 0.24 0.029 1.44
Expectancy -0.01 0.04 -0.06 -0.41 0.68 0.004 1.03
Valence 0.04 0.72 0.01 0.05 0.96 0.000 1.15
Direction -0.02 0.40 -0.01 -0.04 0.97 0.000 1.22
Intensity 0.23 0.91 0.06 0.27 0.81 0.002 2.49
Persistence 1.39 1.04 0.56 1.31 0.13 0.002 3.09
Dependent Variable: Decision Making Quantity
Independent Variable r² B SE β t
P-
Value
Partial
r2 VIF
F(7, 43) = 1.18, p = .34 0.05
Constant 0.01 1.95 0.00 0.99
PoST 0.26 0.32 0.17 0.80 0.43 0.014 1.87
Test Anxiety -0.27 0.18 -0.26 -1.47 0.15 0.048 1.44
Expectancy 0.00 0.01 0.02 0.11 0.91 0.000 1.03
Valence 0.04 0.21 0.03 0.21 0.84 0.001 1.15
Direction -0.10 0.12 -0.14 -0.86 0.40 0.017 1.22
Intensity 0.18 0.26 0.17 0.69 0.49 0.010 2.49
Persistence 0.27 0.30 0.23 0.90 0.37 0.017 3.09

STEREOTYPE THREAT BOUNDARIES 127
Table 16 Cont.
Targets of the Stereotype Dependent Variable: Working Memory
Capacity
Independent Variable r² B SE β t
P-
Value
Partial
r2 VIF
F(7, 217) = 0.88, p = .52 0.04
Constant 3.50 0.74 4.75 0.00
PoST -0.09 0.13 -0.06 -0.69 0.49 0.003 1.63
Test Anxiety -0.08 0.09 -0.08 -0.86 0.39 0.004 1.65
Expectancy 0.00 0.00 -0.06 -0.82 0.41 0.004 1.15
Valence -0.07 0.09 -0.06 -0.78 0.43 0.003 1.26
Direction 0.10 0.06 0.12 1.61 0.11 0.012 1.41
Intensity -0.09 0.11 -0.08 -0.83 0.41 0.004 1.93
Persistence 0.13 0.11 -0.10 1.12 0.26 0.006 1.69
Dependent Variable: Decision Making Quality
Independent Variable r² B SE β t
P-
Value
Partial
r2 VIF
F(7, 217) = 4.06, p = .00 0.1
Constant 3.40 2.09 1.62 0.11
PoST -0.17 0.37 -0.04 -0.47 0.64 0.001 1.63
Test Anxiety -0.44 0.26 -0.14 -1.70 0.09 0.012 1.65
Expectancy 0.02 0.01 0.11 1.62 0.11 0.012 1.15
Valence -0.05 0.25 -0.01 -0.19 0.85 0.000 1.26
Direction -0.03 0.17 0.02 0.21 0.84 0.000 1.41
Intensity -0.10 0.30 -0.03 -0.54 0.83 0.000 1.93
Persistence 0.77 0.32 0.21 0.42 0.72 0.000 1.69
Dependent Variable: Decision Making Quantity
Independent Variable r² B SE β t
P-
Value
Partial
r2 VIF
F(7, 217) = 3.63, p = .00 0.06
Constant 1.75 0.60 2.94 0.00
PoST -0.07 0.11 -0.05 -0.62 0.52 0.002 1.63
Test Anxiety -0.18 0.07 -0.21 -2.43 0.02 0.026 1.65
Expectancy 0.01 0.00 0.12 1.66 0.10 0.012 1.15
Valence -0.02 0.07 -0.02 -0.22 0.83 0.000 1.26
Direction -0.02 0.05 -0.03 -0.35 0.73 0.000 1.41
Intensity 0.06 0.09 0.07 0.72 0.48 0.003 1.93
Persistence 0.03 0.09 0.03 0.34 0.73 0.000 1.69

STEREOTYPE THREAT BOUNDARIES 128
Table 16 Cont.
Non-Targets of the Stereotype Dependent Variable: Working Memory
Capacity
Independent Variable r² B SE β t
P-
Value
Partial
r2 VIF
F(7, 136) = 0.96, p = .46 0.05
Constant 3.37 0.74 4.59 0.00
PoST -0.08 0.15 -0.06 -0.51 0.61 0.002 1.88
Test Anxiety -0.05 0.11 -0.05 -0.42 0.67 0.002 1.82
Expectancy 0.00 0.00 0.01 0.09 0.93 0.000 1.11
Valence -0.02 0.09 -0.02 -0.17 0.87 0.000 1.29
Direction 0.00 0.06 0.00 0.44 0.97 0.001 1.68
Intensity 0.22 0.10 0.26 0.21 0.35 0.006 2.16
Persistence -0.16 0.11 -0.17 -1.46 0.15 0.017 1.79
Dependent Variable: Decision Making Quality
Independent Variable r² B SE β t
P-
Value
Partial
r2 VIF
F(7, 136) = 3.58, p = .00 0.16
Constant 0.29 2.78 0.10 0.92
PoST 0.00 0.56 0.00 0.00 0.99 0.000 1.88
Test Anxiety -0.26 0.43 -0.07 -0.60 0.55 0.003 1.82
Expectancy 0.02 0.02 0.11 1.30 0.20 0.012 1.11
Valence 0.16 0.34 0.04 0.46 0.65 0.002 1.29
Direction 0.05 0.23 0.02 0.22 0.82 0.001 1.68
Intensity 0.84 0.38 0.24 1.22 0.13 0.003 2.16
Persistence 0.43 0.41 0.11 1.05 0.30 0.009 1.79
Dependent Variable: Decision Making Quantity
Independent Variable r² B SE β t
P-
Value
Partial
r2 VIF
F(7, 136) = 3.60, p = .00 0.16
Constant 0.99 0.74 1.32 0.18
PoST -0.10 0.15 -0.08 -0.68 0.50 0.004 1.88
Test Anxiety -0.08 0.11 -0.08 -0.72 0.47 0.004 1.82
Expectancy 0.01 0.01 0.18 2.11 0.04 0.029 1.11
Valence -0.01 0.09 -0.01 -0.13 0.89 0.000 1.29
Direction -0.03 0.04 -0.05 0.56 0.56 0.003 1.68
Intensity 0.28 0.10 0.30 2.06 0.04 0.040 2.16
Persistence -0.01 0.11 -0.01 -0.77 0.95 0.000 1.79

STEREOTYPE THREAT BOUNDARIES 129
Discussion
The main goal of the current research was to experimentally investigate the effects of
different types of ST cues, stereotype primes, and the novelty of stereotypes on participant
reactions and performance. This was the first attempt to manipulate both cue intensity and
novelty in an effort to answer the question of whether ST as commonly discussed is a useful
concept, and/or perhaps a special case of a more general, stereotype prime, phenomenon. The
results of the current study suggest that there are boundaries to the stereotype threat phenomenon
and that it should not only be defined as feelings of “threat” and fear of confirming a stereotype,
but also as feelings of embarrassment, disappointment, and frustration with test performance.
Furthermore, these items should be included on future measures of PoST. Perhaps instead of
“threat”, this phenomenon, in certain situations, should be referred to as “Stereotype
Awareness.” The following sections reveal how the results of the current study support this
conclusion.
Qualitative Results
Because the current study was not a typical construct validity study where the construct is
given and measures are in doubt, the qualitative interviews and open-ended questionnaires had to
be included in the procedure in order to assess participant reactions and understand what
participants were feeling when given different types of cues. These interviews and open-ended
questionnaires reflect an attempt to more accurately define ST and differentiate this phenomenon
from similar constructs.
The interviews and open-ended questionnaires revealed that targets of the stereotype
expressed more negative emotions than non-targets of the stereotype across all experimental
groups. These negative emotions included feelings of nervousness, anxiety, fear of failure,

STEREOTYPE THREAT BOUNDARIES 130
stress, frustration, disappointment, and embarrassment. But not a single participant indicated, on
his or her own, a concern over confirming a negative stereotype. In fact, when asked if this was
a concern, only 1 of the 208 pilot study participants indicated that the stereotype could affect her
performance if she thought about it too much. Every other participant, whether a target or a non-
target, indicated that it was not a concern. Most participants expressed a disbelief in stereotypes
because they are “ an individual and not part of a group” and that it is “my performance and my
responsibility to do well.” This could, however, be due to the type of stereotypes used in the
current study. Perhaps with other stereotypes, there would have been a much greater concern
expressed by participants.
Based on these qualitative results, the original definition of ST, “being at risk of
confirming, as self-characteristic, a negative stereotype about one’s group” (Steele & Aronson,
1995; p. 797) seems to have boundaries. That is, this definition does not apply in every situation
where a stereotype exists. Clearly, in the current study, this was not a concern that was
expressed by these participants; therefore, the theory offered by Steele and Aronson (1995) that a
participant’s performance would decrease due to this specific kind of concern is not supported
here and raises many questions regarding the boundaries of ST.
A similar definition of ST that also was not supported by the current research is that
regarding a feeling of threat (e.g., Brown & Day, 2006). Participant responses were first
compared to the Merriam-Webster Dictionary’s (2013) definition of threat as “an expression of
intention to inflict evil, injury, or damage” and not a single participant’s response resembled this
definition. However, when responses were compared to the definition of evaluative threat, or
concerns over being judged by others (e.g., Johns, Inzlicht, & Schmader, 2008), a slightly more
promising pattern emerged. Twelve participants that were targets of the stereotype indicated a

STEREOTYPE THREAT BOUNDARIES 131
concern over being judged by others. Specifically, these participants expressed that others might
think that they are “simple” or “bad at making decisions.” However, the majority of the
participants that were targets of the stereotype indicated no concern over what others would
think. These individuals expressed that other people “don’t know me” or that it was “just a test.”
Other targeted individuals asserted that it was not a true measure of decision making skills, so
there would be no need to have this concern.
It would appear that no previously used definition of ST very closely fit the qualitative
data gathered in the current study. The only definitions that were similar were those that
included feelings of apprehension (e.g., Harrison et al., 2006) and feelings of fear and anxiety
(e.g., Bailey, 2004); however, even those definitions of ST also included a concern over
confirming the negative stereotype. In the current study, all of the targeted participants
expressed one of the following four negative emotions: (1) nervousness/anxiety, (2)
disappointment, (3) frustration, and/or (4) embarrassment. Based on these qualitative results, it
seems that, at least in the current study, the manipulation of ST did not produce a situation
perceived to be a threat per se. These qualitative data support the idea of “Stereotype
Awareness” but not necessarily “Stereotype Threat”. Therefore, it may be beneficial to think of
the threat created by a ST cue on a continuum with very severe threat at one end and no threat, or
just awareness of the stereotype, at the other end.
Testing the Construct Validity of the ST Measures: CFA Analyses
The purpose of the CFA analyses was to determine if the measures were consistent with
ST theory (as described by Steele & Aronson, 1995) and to help answer the question of just what
exactly was induced by the ST manipulations. A three-factor model, with ST, test anxiety, and
motivation, fit the data best. Specifically, the Likert-scale, open-ended, and interview questions

STEREOTYPE THREAT BOUNDARIES 132
for each construct all loaded onto the same factor. Because the three different types of measures
loaded onto the appropriate factors and did not cross-load onto a different factor, an argument for
convergent and discriminant validity can be made.
The correlations among the items also provided evidence of validity. In general, the
correlations across traits on the same measures (e.g., between the PoST self-report Likert scale
items and the test anxiety self-report Likert scale items) did not exceed the correlations within
the same trait on different measures (e.g., between PoST self-report Likert scale items and PoST
self-report open-ended items). This pattern of correlations suggests that the traits are distinct
from one another and provided some evidence of discriminant validity, that is, that the
perception of threat measure is distinct from the anxiety or motivation measure (see Tables 11
and 12). In addition, the responses across all PoST formats were similar, but still distinct from
the anxiety and motivation measures. This pattern of correlations provides evidence for
convergent, as well as discriminant, validity. Although many of the correlations between the
PoST measures and the test anxiety measures were significant, the patterns of correlations were
distinctly different from one another (see Tables 11 and 12). Based on these preliminary CFA
analyses, there is some evidence that PoST is unique from test anxiety and motivation measures.
There was, however, evidence of some poor items on the PoST measure. Specifically,
reverse coded Likert-items seven (I would feel terrific about myself if I did well on this test),
eight (I would feel like a winner if I performed well on this test), and eleven (I expect to do well
on this test) did not correlate well with most of the other Likert-scale or open-ended questions.
Open-ended items seven (Would you feel worthless if you performed poorly on this test?), eight
(Would you feel terrific about your decision-making abilities if you did well on this test?), nine
(Would you feel like a winner if you performed well on this test?), ten (Do you believe that this

STEREOTYPE THREAT BOUNDARIES 133
negative stereotype about your group might contribute to any poor performance on this decision
making test?), eleven (Do you expect to do well on this test?), and twelve (Do you feel
threatened by the upcoming decision-making test?) did not correlate well with most of the
Likert-scale or other open-ended items. A similar result was found between the Likert-scale
items and the interview items.
This result may have occurred because most participants expressed dismissiveness
toward the test and indicated that it was “just a study” and “not a real test for a class”. However,
it may also be that these items were not properly measuring what participants were feeling when
given a ST manipulation. When asked if they would feel worthless, terrific, or like a winner,
participants explained that “a test would not make one feel worthless or terrific” and a test is “not
a competition, so what would I win?”. Although item eleven did not correlate well with most of
the items on the PoST measure, it did significantly correlate with motivational expectancy,
which seems accurate based on the content of the question.
Lastly, and as mentioned earlier, participants explicitly stated that they had not concerned
themselves with confirming negative stereotypes (item ten) and did not perceive the test as
threatening (item 12). Because these two items correlated strongly with one another and the
correlations among the added Likert-items regarding embarrassment, disappointment, pressure,
insecurity, indifference, and frustration were also strong, this new measure of PoST may suggest
a more accurate reflection of what happens after a ST manipulation is given. Unfortunately,
because these items were not added until later, it was not possible to include these additional
questions in the CFA analyses. They were, however, included in the hypotheses testing and the
regression analyses.

STEREOTYPE THREAT BOUNDARIES 134
Testing the Construct Validity of the ST Measures: Regressions
The purpose of the regression analyses was to understand how (and if) PoST are distinct
from measures of similar traits. Unfortunately, very little of the variance in the dependent
variables was explained by the individual predictor variables. The overall variance accounted
for ranged from 3% to 29%, but the variance accounted for by each individual predictor was
minimal, suggesting that a large percentage of the variance among the predictor variables was
overlapping. Interestingly, though, the variance being accounted for differed from one
experimental group to the next, thus suggesting that the type of cue influenced each dependent
variable differently.
In the blatant ST group, PoST accounted for more of the variance across all three
dependent variables, almost 6% in WMC, 4% in decision-making quality, and 5% in decision-
making quantity. The percentage of variance that PoST accounted for in the other two
experimental groups was much smaller (.09% for WMC, .09% for quality, and 0% for quantity
for the implicit group, and 1.6% in WMC, 0% in quality, and .04% in quantity for the prime
group). This could be explained by the nature of cue. The manipulation checks conducted
demonstrated that the cues and prime had the intended effect. That is, participants were aware of
the ST cues and were not aware of the stereotype prime. But of the three types of cues, the
blatant cue is the most obvious and directly specifies to the participant the stereotyped group.
Participants given this type of cue may have been more aware of their emotions or this cue may
have resulted in stronger feelings of threat; hence more variance was explained in the dependent
variables for this group.
After examining the means of each individual item on the PoST measure, however,
another explanation might be that participants in this condition had a stronger awareness of the

STEREOTYPE THREAT BOUNDARIES 135
stereotype and tried to prove the stereotype wrong (Nguyen & Ryan, 2008). This would also
explain why the means for two of the items (“I expect to do well on this test” and “I am
indifferent toward this test”) in the blatant ST group (M = 3.17 and M = 2.50, respectively) were
higher than the means for the implicit (M = 2.70 and M = 2.40, respectively) and stereotype
prime (M = 2.98 and M = 2.30, respectively). Although not significantly different, Cohen’s d
suggested small to medium effect sizes. The effect sizes for these two items between the blatant
and implicit group was d = .29 and d = .07, respectively, and between the blatant and prime
group was d = .12 and d = .15, respectively. Based on these results, one might conclude that
participants given the blatant cue were more aware of the obvious stereotype and tried to prove
the test wrong by stating that they expected to perform well. This explanation supports Nguyen
and Ryan (2008) assertion that participants given a blatant cue experience stereotype reactance.
In the implicit ST group, test anxiety accounted for the most unique variance in decision-
making (4% in both quality and quantity). Again, this could be explained by the nature of the
cue. The implicit cue is more ambiguous and the stereotype is not directly stated. This may
have resulted in an increase in anxiety because participants were unsure how the stereotype
would affect their performance. In fact, after a closer examination of the item means across the
experimental groups, it was found that the means for each test anxiety item for the implicit ST
group were greater than the means of the other groups (see Table 17). These results might also
suggest that less direct cues of ST, such as an implicit cue, may not create an obvious, strong
awareness of the stereotype or strong feelings regarding ST. That is, more blatant, obvious cues
would create a stronger awareness of the threat and a stronger desire to prove the stereotype
incorrect. Again, although the manipulation checks suggested that the participants in the implicit
ST condition were aware of the stereotype, they may have not been entirely sure in which

STEREOTYPE THREAT BOUNDARIES 136
direction the stereotype would affect performance. Again, this explanation supports the assertion
made by Nguyen and Ryan (2008).
Table 17. Test Anxiety Item Means, Standard Deviation, and Effect Sizes of Interest
Item
Blatant
Implicit
Prime
Effect Size Between
Blatant and Implicit
Effect Size
Between
Implicit and
Prime
Mean SD Mean SD Mean SD d d
1 2.20 1.54 2.54 1.76 2.14 1.60 .21 .24
2 2.19 1.58 2.54 1.90 2.16 1.60 .20 .22
3 2.39 1.78 2.57 1.82 2.16 1.60 .10 .24
4 2.07 1.86 2.65 1.79 2.43 1.70 .32 .13
5 2.50 1.65 2.52 1.83 2.34 1.60 .01 .10
6 2.33 1.32 2.55 1.90 2.20 1.50 .13 .20
7 1.70 1.28 2.01 1.67 1.40 1.01 .21 .44
8 1.79 1.23 2.29 1.73 1.64 1.19 .33 .44
9 1.70 1.68 1.85 1.38 1.56 1.10 .10 .23
10 2.15 1.60 2.26 1.67 2.16 1.66 .07 .06
In the priming group, expectancy and valence accounted for more of the variance across
all three dependent variables (expectancy accounted for 16% in WMC, 6% in quality, and 6% in
quantity and valence accounted for 4% in WMC, 1% in quality, and 1% in quantity).
Interestingly, for the ST conditions very little of the variance in the dependent variables was
accounted for by any of the motivational variables, thus, suggesting that motivation may not play
as large of a role in the ST relationships as was once thought (see Table 16). But it does play a
bigger role in stereotype priming. Again, examination of the two item means revealed greater
valence for participants in the priming group (M = 5.64 and M = 5.16, for items one and two
respectively) than in the blatant (M = 5.60 and M = 5.11, respectively) and implicit (M = 5.40
and M = 4.99, respectively) groups. The effect sizes for these two items between the blatant and
prime group was d = .03 and d = .03, respectively, and between the implicit and prime group was
d = .16 and d = .11, respectively. It may still be that as an individual places more value on a task,

STEREOTYPE THREAT BOUNDARIES 137
the prime does not trigger as many negative emotions as it would if an individual did not value
the task (Chapman, Sargent-Cox, Horswill, & Anstey, 2014).
However, because these effect sizes are rather small, another explanation is offered.
Expectancy theory states that an individual will take action when the expected reward of the
behavior is valued (Vroom, 1964). The theory focuses on choice and the cognitive process an
individual undergoes to make that choice. Based on the assertions of this theory, and the fact
that participants in the priming condition scored significantly higher than participant in the ST
groups on WMC, the author speculates that participants given a stereotype prime had more
cognitive resources available to them to process the value they placed on participating in a
voluntary study. In fact, another, specific investigation of the qualitative data suggested that this
may be the case. Twenty-five participants in the priming condition stated that they were
motivated to perform well because “this study is for research” or “it is for science”, whereas only
four participants in the blatant group, three participants in the implicit group, and five
participants in the control group made such remarks. Z-tests examining the differences in
proportions between the groups revealed a significant difference between the priming condition
and the blatant (Z = 5.30, p < .01), implicit (Z = 5.40, p < .01), and control (Z = 4.70, p < .01)
groups. The value that participants in the priming group placed on research may explain why
expectancy and valence accounted for most of the unique variance in the dependent variables.
Although a large majority of the variance was unaccounted for, these analyses
demonstrated that each predictor variable was accounting for some unique variance within the
various groups. Thus, one could conclude that this is at least some evidence that is consistent
with the idea that they are distinct constructs. However, not much of the variance was accounted
for by each individual predictor, therefore, it is difficult to conclude the true uniqueness of the

STEREOTYPE THREAT BOUNDARIES 138
variables. Examination of the hypotheses tests provided a better assessment of exactly how the
ST manipulation was affecting performance and how PoST differed from test anxiety and
motivation.
Testing the Construct Validity of the ST Measures: Hypotheses Tests
Hypothesis 1a examined main effects of novelty of stereotype across all dependent
variables. A main effect of novelty was found for only one dependent variable: WMC.
Participants given a novel stereotype scored higher on WMC than participants given a well-
known stereotype. Further examination of this effect revealed that individuals in the well-known
stereotype group scored higher on group identification (M = 3.70, s = 1.29) than did individuals
in the novel stereotype group (M = 2.98, s = 1.42). Although this difference was not significant
(p > .01), it may explain why participants given the novel stereotype scored significantly higher
on WMC than participants given the well-known stereotype. According to Martiny et al. (2011),
highly identified group members had fewer cognitive resources for working on a task and it led
to a decrease in WMC performance. In fact, Martiny and her colleagues found similar results
when they manipulated the novelty of the stereotype and concluded that highly identified
individuals focused more on their self-concept and social identity, which drained cognitive
resources.
High group identification, however, may not always have negative consequences. For
example, the significant cue by novelty interaction, which demonstrated that participants given a
well-known prime reported significantly greater valence than participants given a novel prime,
can also be explained by identification with the group. Specifically, participants given the well-
known prime also reported significantly greater group identification (M = 3.69, s = .75) than
participants given the novel prime (M = 3.22, s = 1.02), t(89) = 2.47, p < .01. In this case, the

STEREOTYPE THREAT BOUNDARIES 139
participants given the well-known prime identified more with the group than participants given
the novel prime and this stronger identification may have influenced how much they valued the
task. In fact, the correlations support this assertion. The correlation between group
identification and valence for the well-known prime group is r = .32 (p < .05) and the
correlations is r = .13 (p > .05) for the novel prime group. In order to more closely examine the
difference between the two independent correlations, Fisher’s r-to-z formula was used and the
difference, although not significant, had an effect size of d = .20 (z = 0.93, p > .05).
A significant interaction was also found between novelty and cue type with participants
in the novel blatant ST condition scoring higher on valence, intensity, and persistence than did
participants in the well-known blatant ST condition. This interaction, however, cannot be
explained by group identification and social identity theory. Participants in the well-known
blatant ST condition reported their group identification (M = 3.42, s = .87) to be very similar to
that of the participants in the novel blatant ST condition (M = 3.34, s = 1.07). The theory of
stereotype reactance might be a better explanation (Nguyen & Ryan, 2008). This theory posits
that when a participant is given a blatant ST cue, it might limit their perceived freedom and
ability to perform; therefore, ironically invoking behaviors that are not consistent with the
stereotype (Nguyen & Ryan, 2008). Because past research has demonstrated that individuals
were more sensitive to stereotypes regarding handedness (Grimshaw, 2013), it may be that
individuals in this study’s novel condition reacted more strongly to the blatant stereotype than
did individuals in the well-known condition.
Typically, these two theories have been used to explain the differences between targets of
a ST cue and non-targets of the cue. In the current study, however, the majority of the
hypotheses examining targets and non-targets were not supported. Only on tests of hypotheses

STEREOTYPE THREAT BOUNDARIES 140
3b and 4b examining decision-making quality and WMC, respectively, were significant
differences between the groups found. And group identification and reactance theory cannot
explain the significant differences on tests of hypothesis 3b because both right handed and left
handed groups identified with their group almost exactly (M = 3.20 and M = 3.21, respectively)
and there was no interaction of cue type. Nor can group identification or reactance theory explain
the significant differences between low versus high family income in decision-making quality.
In fact, participants with a high family income identified more strongly with the group than did
those with a lower family income (M = 4.35 and M = 3.06, respectively). Although there was a
significant main effect of cue type found for WMC, the participants given the stereotype prime
outperformed participants given the blatant or implicit ST cues on WMC, thus providing no
support for the theory of stereotype reactance.
The differences here may be better explained by cognitive dissonance theory (Harrison et
al., 2006). This theory explains that dissonance, or psychological tension, is likely to occur when
an individual experiences two inconsistent cognitions. Because cognitive dissonance is an
uncomfortable experience, an individual becomes motivated to reduce or eliminate it. In order to
eliminate the dissonance, one might change his or her cognitions to be consistent with one
another. In the current study, both targets and non-targets demonstrated high intensity and
persistence toward the task. It could be that the targets of the stereotype may have felt that the
effort they put forth on the task was inconsistent with how the stereotype predicted they should
perform. Therefore, the targets may have come to the conclusion that they had tried and failed.
In fact, a fear of failure was expressed often by participants in the pilot studies. In order to
remedy this negative feeling between their effort and their performance, they may have reduced
their identification with the group. That is, they tried and failed, but it does not matter because it
STEREOTYPE THREAT BOUNDARIES 141
is unimportant to them. In fact, this sequence of events is consistent with the order in which the
data were collected. The group identification questionnaire was always given to the participant
after completion of the motivational measures and the performance measures, therefore, it would
make sense that the participants could reflect upon their performance and determine that the task
was unimportant to them before completing the group identification measure.
Cognitive dissonance theory explains not only the significant differences found on tests
of hypotheses three and four, but also the lack of significant differences between targets and non-
targets for expectancy, valence, direction, intensity, and persistence. That is, targets scored
significantly lower on decision-making quality and WMC (hypothesis 3b and 4b, respectively)
because they were trying to remedy negative feelings between their effort and their performance.
There were no significant differences in motivation because both targets and non-targets were
trying their best. However, when the targets thought that their best would still result in poor
performance, they stated that the task was unimportant to them. This theory would also explain
the significant order effect found for persistence.
Furthermore, cognitive dissonance theory may explain why participants given a
stereotype prime scored significantly higher on WMC than did participants give a blatant or
implicit ST cue. That is, because the prime acted outside of awareness, the working memory of
the participants was not negatively affected (Schmader, 2010). However, if given an implicit or
blatant ST cue, participants experienced more negative feelings, which ultimately affected their
WMC.
Interestingly, though, there were no significant differences among groups on the PoST
measure or the test anxiety measure. If targeted participants were experiencing more negative
emotions, there should have been significant differences found on these measures. It could be

STEREOTYPE THREAT BOUNDARIES 142
speculated that there was no evidence of ST or anxiety in the current study because the
environment was not a real-world setting. In fact, many participants commented on their lack of
concern over poor performance because it was “just a study.”
An even more important question might be why were WMC and decision-making quality
affected when PoST, test anxiety, and most motivational variables were not? The correlational
evidence and regression analyses suggest that these variables are distinct from one another, so it
would seem not to be a matter of overlapping or confounding variables. Perhaps it may be that
participants did not fear or experience anxiety over confirming a negative stereotype about their
decision-making abilities. Many participants in the qualitative studies expressed disbelief in
decision-making stereotypes as well as confidence in their decision-making abilities. This would
explain why participants were aware of the ST cue but did not express negative emotions or
anxiety regarding their performance. But what caused the significant differences in these two
dependent variables?
Schmader (2010) offered a variety of explanations for how ST affects performance. One
hypothesis was that if an individual feels that they might be judged, they experience a decrease
in WMC. Clearly, that was not the case in the current study. Another explanation was a
heighted sense of uncertainty about one’s abilities (Schmader, 2010). Again, this was not the
case in the current study. Most participants expressed confidence in their decision-making
abilities. But something was happening when a participant was given a ST cue. Stereotype
threat cues negatively affected WMC more than stereotype primes, so when a participant was
aware of stereotype, it affected them.
By examining each item on the PoST scale, the current study was able to pinpoint exactly
which negative emotions were related to the decrease in WMC and decision-making

STEREOTYPE THREAT BOUNDARIES 143
performance. Specifically, embarrassment, disappointment, and frustration were significant
contributors. These are three emotions that have not been included on measures of PoST in the
past and were only included in the present study due to the qualitative analyses. The results of
the current study suggest that the ST manipulations with these particular stereotypes did not
necessarily create a sense of threat or a fear of confirming the stereotypes, but instead an
awareness of the stereotypes created embarrassing, disappointing, and frustrating feelings with
regards to poor performance.
Implications, Future Research, and Limitations
Three main trends emerged in the current study: (1) a novel stereotype affected
performance similarly to a well-known stereotype, (2) stereotype primes and ST cues were
empirically distinct from one another, and (3) stereotype primes did not decrease WMC as did
ST cues.
Regarding the concept referred to as ST, the current study can conclude that because
participants did not experience threat, but instead strong feelings of embarrassment,
disappointment, and frustration, the current label of the phenomenon, “Stereotype Threat”, had
boundaries and in certain situations, could be referred to instead as “Stereotype Awareness”.
That is, the ST cues clearly are affecting performance, but not in a way that is “threatening” to
the participant in a literal sense. This conclusion is consistent with research that has suggested
that ST cues can sometimes produce positive effects (e.g., Jamieson, 2009) in that a negative
label, such as “Stereotype Threat” does not seem to capture the full range of possible reactions.
The awareness of it, on the other hand, can have either positive or negative effects. Again, it may
be beneficial to think of stereotype threat on a continuum. However, this is just one study and

STEREOTYPE THREAT BOUNDARIES 144
there are still some questions that should be answered before moving forward with this new label
and definition.
The results of the present study would suggest that something was going on in the minds
of individuals given a ST cue and it was not necessarily feelings of threat, as traditionally
defined. Instead, it was negative feelings centering on embarrassment, disappointment, and
frustration with the task. Future research should explore these feelings further and include them
on measures assessing the effects of ST manipulations. It is also clear that these negative
feelings were related to WMC and decision-making quality; therefore, future research should
also assess if these negative feelings influence other types of performance. Based on the results
of the current study, it is unclear as to why decision-making quantity was not influenced by these
emotions. One possible explanation for why quantity was not affected may be because it takes
more cognitive resources to determine why a decision was made (the quality of the decisions)
and less resources to determine what the correct decision should be (the quantity of the
decisions). Therefore, further research should be conducted to determine if this is the case with
decision-making ability. Furthermore, interviewed participants were either not aware of negative
feelings or were not willing to express them during the interview. Consequently, when
researching this phenomenon, an interview format may not yield the most beneficial results.
Finally, there is no study without its limitations and the current study has several that
should be discussed. First and most importantly, are the stereotypes used regarding handedness
and income. These stereotypes may not evoke emotions that are as strong as other stereotypes.
For example, this study does not directly address the issue of racial stereotypes and these in
particular may produce very different reactions than the stereotypes used here.

STEREOTYPE THREAT BOUNDARIES 145
A second limitation is that the findings of the current study can only be generalized to
undergraduate students and laboratory settings. Future research should focus on other
populations, as well as other settings. For example, would the same result be found for managers
applying for a promotion? There is a lot of controversy in the ST literature regarding the
“realness” of ST situations (e.g., Sackett, et al., 2004). In fact, many of the participants in the
pilot studies of the current research stated that they did not experience any negative emotions
because the test was “for a study.” This brings into question the external validity of the current
study. However, the internal validity of the current study is strong. It is clear that the ST
manipulations and stereotype prime affects performance differently. Furthermore, the
participants responding to the open-ended questionnaires did report more negative emotions that
those that were interviewed, indicating that format type does affect a participant’s response
Finally, it is clear that participants were aware of and could report their feelings, whether they be
positive, negative, or neutral. But additional research is needed in other settings to determine if
these affects exist in real-world situations. By including feelings of embarrassment,
disappointment, and frustration, researchers may obtain a better idea of how (and if) ST cues
affect participants similarly across laboratory and real-world settings.
Third, the lack of significant differences between targets and non-targets for PoST, test
anxiety, expectations, valence, direction, intensity, persistence, and decision-making quantity is a
concern. This lack of effects could be due in part to the selection criteria of the study. For
instance, participants volunteered for the study and were not chosen based on identification with
the group. Across all groups, there was no consistent difference on group identification. Perhaps
if participants identified more strongly with the groups of income and handedness more
significant differences would have been found. Selecting participants based on higher levels of

STEREOTYPE THREAT BOUNDARIES 146
group identification have been found to exacerbate ST effects (Forbes, 2009). Future research
should continue to examine this interaction.
Finally, another limitation may be the decision-making task. Although given 30 minutes
to complete the task, approximately 25% of the participants did not complete the task within the
allotted time frame. Although there were no significant differences across groups in regards to
finishing time, participants in the pilot studies indicated that the time limit on the test was
intimidating. Thus, the time limit may have had more of an influence on the participants than
intended by the researcher. Although no significant differences were found on any of the
dependent variables between those who finished the task on time and those who did not, future
research should continue to examine the effects of time limits on participant performance.
In summary, the current study provided some evidence that ST cues are unique from
stereotype primes and PoST measures are distinct from test anxiety and motivational measures.
The present research concluded that ST cues and stereotype primes affect some types of
performance. The most important contribution of the current study, however, was how ST
should be labeled and conceptually defined in the future.

STEREOTYPE THREAT BOUNDARIES 147
Appendix A
Please construct grammatically correct 4-word sentences from the string of 5 words
included in each line as quickly as possible.
1. was hesitant he quite rightness
2. righty fence-sitting just they are
3. they really leftness bright are
4. right decisions poor make they
5. makers decision leftedness they are
6. chilly was righter the wind
7. left-hand turn alarm the off
8. slowly very rightness they decided
9. very quickly walks lefty she
10. undecided rightedness they are completely
11. the he lefty program installed
12. failed he righted to decide
13. unsure they rightness really are
14. left-handedness they really polite were
15. cannot they decide righted fast
16. they leftedness it know just
17. will unresolved remain right-hand it
18. left he very is decisive
19. the walked cat by lefties
20. are still they wavering rightedness
21. very he’s being rightness wishy-washy
22. they so are fickle righties
23. left-side avoidant they not are
24. are they undecided righty quite
25. the she lefters award deserved
26. rather leave would right-sided he
27. flowers the beautiful left smell
28. quite doubtful righter is he
29. for them left-handedness everyone applauded
30. is avoider an he right-side

STEREOTYPE THREAT BOUNDARIES 148
Appendix B
Please construct grammatically correct 4-word sentences from the string of 5 words
included in each line as quickly as possible.
1. was hesitant he quite poorness
2. unfruitfully fence-sitting just they are
3. they really richly bright are
4. bankrupt decisions poor make they
5. makers decision affluently they are
6. chilly was needy the wind
7. loaded turn alarm the off
8. slowly very pauperized they decided
9. very quickly walks substantial she
10. undecided indigently they are completely
11. the he prosperous program installed
12. failed he necessitous to decide
13. unsure they lowness really are
14. opulently they really polite were
15. cannot they decide underprivileged fast
16. they booming it know just
17. will unresolved remain needing it
18. wealth he very is decisive
19. the walked cat by moneyed
20. are still they wavering brokenness
21. very he’s being meagerness wishy-washy
22. they so are fickle beggared
23. richness avoidant they not are
24. are they undecided unprosperously quite
25. the she upscale award deserved
26. rather leave would deprived he
27. flowers the beautiful comfortable smell
28. quite doubtful poverty is he
29. for them well-off everyone applauded
30. is avoider an he empty-handed

STEREOTYPE THREAT BOUNDARIES 149
Appendix C
Please construct grammatically correct 4-word sentences from the string of 5 words
included in each line as quickly as possible.
1. was hesitant he quite behalf
2. price fence-sitting just they are
3. they really extent bright are
4. type decisions poor make they
5. makers decision hire they are
6. chilly was hark the wind
7. warm turn alarm the off
8. slowly very alter they decided
9. very quickly walks hare she
10. undecided chose they are completely
11. the he simper program installed
12. failed he simply to decide
13. unsure they attics really are
14. tree they really polite were
15. cannot they decide desert fast
16. they destiny it know just
17. will unresolved remain design it
18. sky he very is decisive
19. the walked cat by shell
20. are still they wavering repeat
21. very he’s being strive wishy-washy
22. they so are fickle lore
23. floor avoidant they not are
24. are they undecided barn quite
25. the she mingle award deserved
26. rather leave would stereo he
27. flowers the beautiful poster smell
28. quite doubtful hat is he
29. for them grape everyone applauded
30. is avoider an he knits

STEREOTYPE THREAT BOUNDARIES 150
Appendix D
Please rate the extent to which you agree with the following questions:
1. If I do poorly on this test, people will look down on me.
Completely disagree 1 2 3 4 5 6 7 Completely agree
2. People will think I have less ability if I do not do well on this test.
Completely disagree 1 2 3 4 5 6 7 Completely agree
3. If I don’t do well on this test, others may question my ability.
Completely disagree 1 2 3 4 5 6 7 Completely agree
4. I feel self-confident.
Completely disagree 1 2 3 4 5 6 7 Completely agree
5. I would feel like a loser if I were to perform poorly on this test.
Completely disagree 1 2 3 4 5 6 7 Completely agree
6. I would feel worthless if I performed poorly on this test.
Completely disagree 1 2 3 4 5 6 7 Completely agree
7. I would feel terrific about myself if I did well on this test.
Completely disagree 1 2 3 4 5 6 7 Completely agree
8. I would feel like a winner if I performed well on this test.
Completely disagree 1 2 3 4 5 6 7 Completely agree
9. I believe that my performance on this test will confirm a negative stereotype about my
group.
Completely disagree 1 2 3 4 5 6 7 Completely agree
10. I believe that a negative stereotype about my group will contribute to my poor
performance on this test.
Completely disagree 1 2 3 4 5 6 7 Completely agree

STEREOTYPE THREAT BOUNDARIES 151
11. I expect to do well on this test.
Completely disagree 1 2 3 4 5 6 7 Completely agree
12. I feel threatened by the upcoming test.
Completely disagree 1 2 3 4 5 6 7 Completely agree
13. I will feel embarrassed if I perform poorly on the test.
Completely disagree 1 2 3 4 5 6 7 Completely agree
14. I will be disappointed if I perform poorly on the test.
Completely disagree 1 2 3 4 5 6 7 Completely agree
15. I feel pressured to perform well on the test.
Completely disagree 1 2 3 4 5 6 7 Completely agree
16. I feel insecure about my performance on the test.
Completely disagree 1 2 3 4 5 6 7 Completely agree
17. I feel indifferent about the test.
Completely disagree 1 2 3 4 5 6 7 Completely agree
18. I feel frustrated about my performance on the test.
Completely disagree 1 2 3 4 5 6 7 Completely agree
Note. Questions 14-19 were included for the main study only.

STEREOTYPE THREAT BOUNDARIES 152
Appendix E
Please answer the following questions to the best of your ability. Please provide as much
information as possible.
1. If you perform poorly on this test, how do you think others will view you? Why?
________________________________________________________________________
________________________________________________________________________
________________________________________________________________________
2. Do you think people will judge you as having less ability if you do not perform well on
this test? Why or why not?
________________________________________________________________________
________________________________________________________________________
________________________________________________________________________
3. If you don’t do well on this test, do you think others will question your decision-making
ability? Why or why not?
________________________________________________________________________
________________________________________________________________________
________________________________________________________________________
4. Do you think people will look down on you if you do not perform well on this decision
making test? Why or why not?
________________________________________________________________________
________________________________________________________________________
________________________________________________________________________
5. Do you feel self-confident? Why or why not?
________________________________________________________________________
________________________________________________________________________
________________________________________________________________________
6. Would you feel like a loser if you performed poorly on this test? Why or why not?
________________________________________________________________________
________________________________________________________________________
________________________________________________________________________
7. Would you feel worthless if you performed poorly on this test? Why or why not?
________________________________________________________________________
________________________________________________________________________
________________________________________________________________________

STEREOTYPE THREAT BOUNDARIES 153
8. Would you feel terrific about your decision-making abilities if you did well on this test?
Why or why not?
________________________________________________________________________
________________________________________________________________________
________________________________________________________________________
9. Would you feel like a winner if you performed well on this test? Why or why not?
________________________________________________________________________
________________________________________________________________________
________________________________________________________________________
10. Do you believe that this negative stereotype about your group might contribute to any
poor performance on this decision making test? Why or why not?
________________________________________________________________________
________________________________________________________________________
________________________________________________________________________
11. Do you expect to do well on this test? Why or why not?
________________________________________________________________________
________________________________________________________________________
________________________________________________________________________
12. Do you feel threatened by the upcoming decision-making test? Why or why not?
________________________________________________________________________
________________________________________________________________________
________________________________________________________________________
13. What other feelings do you have regarding the upcoming decision-making test? Why or
why not?
________________________________________________________________________
________________________________________________________________________
________________________________________________________________________
14. Are there any other thoughts that you would like to share?
________________________________________________________________________
________________________________________________________________________
________________________________________________________________________

STEREOTYPE THREAT BOUNDARIES 154
Appendix F
Now I’m going to be asking you a couple of follow up question regarding the test you just
completed. Please answer my questions to the best of your ability. Please provide as much
information as possible.
Note to interviewer: Be sure to look over the open-ended questionnaire and highlight any
areas that need to be clarified. 1. How did you feel right before you began the decision making test?
________________________________________________________________________
________________________________________________________________________
________________________________________________________________________
2. How did you feel while you were completing the test?
________________________________________________________________________
________________________________________________________________________
________________________________________________________________________
3. How did you feel when you finished the test?
________________________________________________________________________
________________________________________________________________________
________________________________________________________________________
4. Do you remember any specific feelings or emotions?
________________________________________________________________________
________________________________________________________________________
________________________________________________________________________
5. Did you have different feelings at different times?
________________________________________________________________________
________________________________________________________________________
________________________________________________________________________
6. Have you ever had these feeling before? When?
________________________________________________________________________
________________________________________________________________________
________________________________________________________________________
7. Do you think there was a group of people who may not have performed as well on this
type of test? Why or why not?
________________________________________________________________________
________________________________________________________________________
________________________________________________________________________

STEREOTYPE THREAT BOUNDARIES 155
8. Do you consider yourself a part of that group? Why or why not?
________________________________________________________________________
________________________________________________________________________
________________________________________________________________________
9. Do you belief in any decision-making stereotypes?
________________________________________________________________________
________________________________________________________________________
________________________________________________________________________
10. Would you say that you felt threatened at any point in time before, during, or after the
test?
________________________________________________________________________
________________________________________________________________________
________________________________________________________________________
11. Are there any other thoughts that you would like to share?
________________________________________________________________________
________________________________________________________________________
________________________________________________________________________
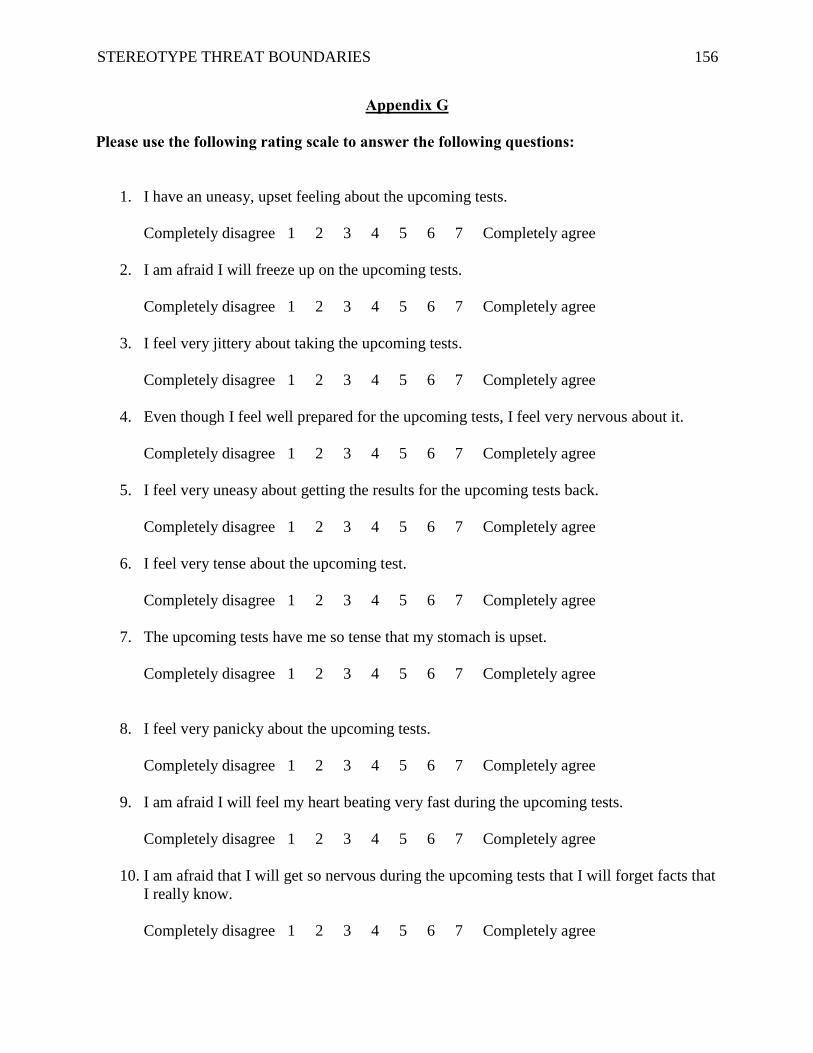
STEREOTYPE THREAT BOUNDARIES 156
Appendix G
Please use the following rating scale to answer the following questions:
1. I have an uneasy, upset feeling about the upcoming tests.
Completely disagree 1 2 3 4 5 6 7 Completely agree
2. I am afraid I will freeze up on the upcoming tests.
Completely disagree 1 2 3 4 5 6 7 Completely agree
3. I feel very jittery about taking the upcoming tests.
Completely disagree 1 2 3 4 5 6 7 Completely agree
4. Even though I feel well prepared for the upcoming tests, I feel very nervous about it.
Completely disagree 1 2 3 4 5 6 7 Completely agree
5. I feel very uneasy about getting the results for the upcoming tests back.
Completely disagree 1 2 3 4 5 6 7 Completely agree
6. I feel very tense about the upcoming test.
Completely disagree 1 2 3 4 5 6 7 Completely agree
7. The upcoming tests have me so tense that my stomach is upset.
Completely disagree 1 2 3 4 5 6 7 Completely agree
8. I feel very panicky about the upcoming tests.
Completely disagree 1 2 3 4 5 6 7 Completely agree
9. I am afraid I will feel my heart beating very fast during the upcoming tests.
Completely disagree 1 2 3 4 5 6 7 Completely agree
10. I am afraid that I will get so nervous during the upcoming tests that I will forget facts that
I really know.
Completely disagree 1 2 3 4 5 6 7 Completely agree
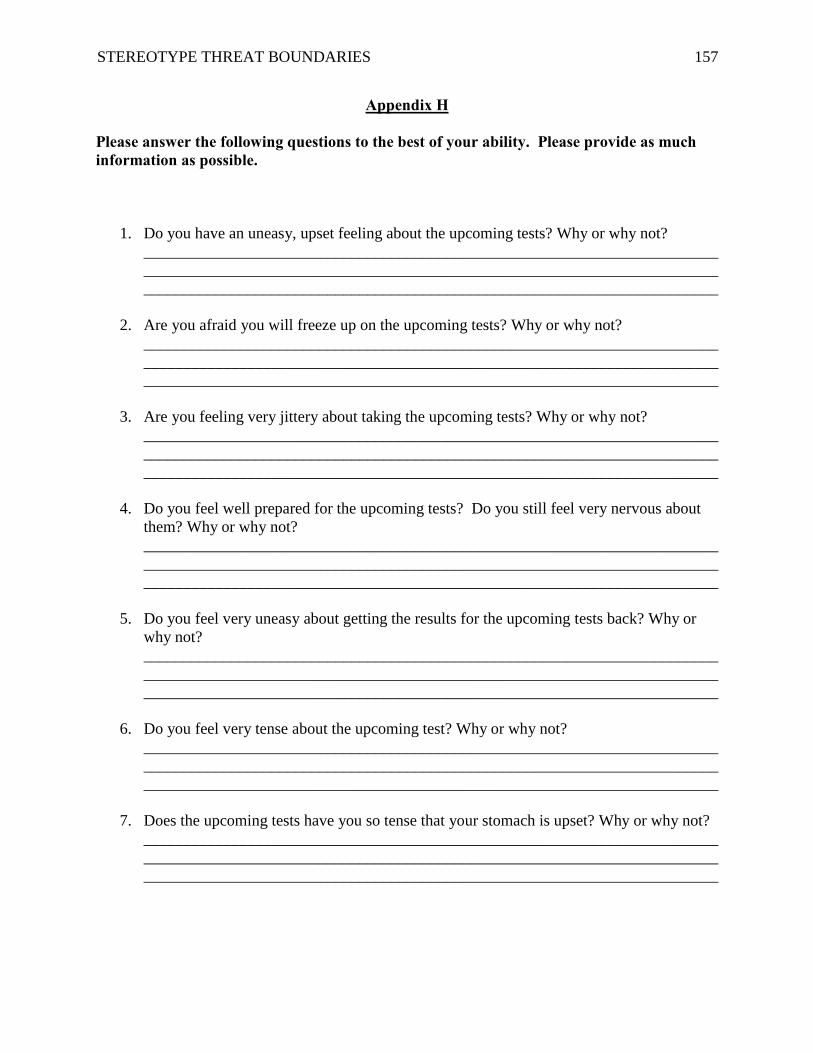
STEREOTYPE THREAT BOUNDARIES 157
Appendix H
Please answer the following questions to the best of your ability. Please provide as much
information as possible.
1. Do you have an uneasy, upset feeling about the upcoming tests? Why or why not?
________________________________________________________________________
________________________________________________________________________
________________________________________________________________________
2. Are you afraid you will freeze up on the upcoming tests? Why or why not?
________________________________________________________________________
________________________________________________________________________
________________________________________________________________________
3. Are you feeling very jittery about taking the upcoming tests? Why or why not?
________________________________________________________________________
________________________________________________________________________
________________________________________________________________________
4. Do you feel well prepared for the upcoming tests? Do you still feel very nervous about
them? Why or why not?
________________________________________________________________________
________________________________________________________________________
________________________________________________________________________
5. Do you feel very uneasy about getting the results for the upcoming tests back? Why or
why not?
________________________________________________________________________
________________________________________________________________________
________________________________________________________________________
6. Do you feel very tense about the upcoming test? Why or why not?
________________________________________________________________________
________________________________________________________________________
________________________________________________________________________
7. Does the upcoming tests have you so tense that your stomach is upset? Why or why not?
________________________________________________________________________
________________________________________________________________________
________________________________________________________________________

STEREOTYPE THREAT BOUNDARIES 158
8. Do you feel very panicky about the upcoming tests? Why or why not?
________________________________________________________________________
________________________________________________________________________
________________________________________________________________________
9. Are you afraid that you will feel your heart beating very fast during the upcoming tests?
Why or why not?
________________________________________________________________________
________________________________________________________________________
________________________________________________________________________
10. Are you afraid that you will get so nervous during the upcoming tests that you will forget
facts that you really know? Why or why not?
________________________________________________________________________
________________________________________________________________________
________________________________________________________________________
11. Are there any other thoughts that you would like to share?
________________________________________________________________________
________________________________________________________________________
________________________________________________________________________

STEREOTYPE THREAT BOUNDARIES 159
Appendix I
Now I’m going to be asking you a couple of follow up question regarding the test you just
completed. Please answer my questions to the best of your ability. Please provide as much
information as possible.
Note to interviewer: Be sure to look over the open-ended questionnaire and highlight any
areas that need to be clarified.
1. Did you have an uneasy, upset feeling about the test? If yes, why do you think that is?
________________________________________________________________________
________________________________________________________________________
________________________________________________________________________
2. Did you freeze up on the test? If yes, why?
________________________________________________________________________
________________________________________________________________________
________________________________________________________________________
3. Did you feel very jittery during the test? If yes, why?
________________________________________________________________________
________________________________________________________________________
________________________________________________________________________
4. Did you feel well prepared while you were completing the test? If no, why not?
________________________________________________________________________
________________________________________________________________________
________________________________________________________________________
5. Did you feel very uneasy about getting the results for the back after you finished the test?
If yes, why?
________________________________________________________________________
________________________________________________________________________
________________________________________________________________________
6. Did you feel very tense while taking the test? If yes, why?
________________________________________________________________________
________________________________________________________________________
________________________________________________________________________
7. Did you feel defeated while taking the test? After the test? If yes, why?
________________________________________________________________________
________________________________________________________________________
________________________________________________________________________

STEREOTYPE THREAT BOUNDARIES 160
8. Did you worry a great deal during tests? If yes, why?
________________________________________________________________________
________________________________________________________________________
________________________________________________________________________
9. Are you still worried about your performance on the test? If yes, why?
________________________________________________________________________
________________________________________________________________________
________________________________________________________________________
10. Are there any other thoughts that you would like to share?
________________________________________________________________________
________________________________________________________________________
________________________________________________________________________

STEREOTYPE THREAT BOUNDARIES 161
Appendix J
Please use the following rating scale to answer the following questions:
1. How likely is it that you could complete the decision-making test within the allotted time
period if you tried your hardest? Give a percentage on a scale of 0% (not likely) to 100%
(completely likely).
2. How satisfied would you be if you completed the decision-making test within the allotted
time period?
Very dissatisfied 1 2 3 4 5 6 7 Very satisfied
3. How attractive would it be to complete the decision-making test within the allotted time
period?
Very unattractive 1 2 3 4 5 6 7 Very attractive

STEREOTYPE THREAT BOUNDARIES 162
Appendix K
Please answer the following questions to the best of your ability. Please provide as much
information as possible.
1. How likely is it that you could complete the decision-making test within the allotted time
period if you tried your hardest? Why do you feel that way?
_______________________________________________________________________
_______________________________________________________________________
_______________________________________________________________________
2. How satisfied would you be if you completed the decision-making test within the allotted
time period? Why do you find this satisfying/unsatisfying?
_______________________________________________________________________
_______________________________________________________________________
_______________________________________________________________________
3. How attractive would it be to complete the decision-making test within the allotted time
period? Why do you find this attractive/unattractive?
_______________________________________________________________________
_______________________________________________________________________
_______________________________________________________________________
4. Are there any other thoughts that you would like to share?
________________________________________________________________________
________________________________________________________________________
________________________________________________________________________

STEREOTYPE THREAT BOUNDARIES 163
Appendix L
Now I’m going to be asking you a couple of follow up question regarding the test you just
completed. Please answer my questions to the best of your ability. Please provide as much
information as possible.
Note to interviewer: Be sure to look over the open-ended questionnaire and highlight any
areas that need to be clarified.
1. Did you meet your expectations for the task? Why did you or why did you not?
_______________________________________________________________________
_______________________________________________________________________
_______________________________________________________________________
2. Are you as satisfied with your performance as you thought you would be? Why or why
not?
_______________________________________________________________________
_______________________________________________________________________
_______________________________________________________________________
3. Did you find that completing (or not completing) the test was as attractive as you thought
it would be? Why or why not?
_______________________________________________________________________
_______________________________________________________________________
_______________________________________________________________________
4. Are there any other thoughts that you would like to share?
________________________________________________________________________
________________________________________________________________________
________________________________________________________________________

STEREOTYPE THREAT BOUNDARIES 164
Appendix M
Please use the following rating scale to answer the following questions:
1. I plan on directing all my attention toward the upcoming test.
Completely disagree 1 2 3 4 5 6 7 Completely agree
2. I plan on using a strategy to complete the test successfully.
Completely disagree 1 2 3 4 5 6 7 Completely agree

STEREOTYPE THREAT BOUNDARIES 165
Appendix N
Please answer the following questions to the best of your ability. Please provide as much
information as possible.
1. Do you plan to direct all your attention toward the upcoming test? Why or why not?
________________________________________________________________________
________________________________________________________________________
________________________________________________________________________
2. Do you plan to use a strategy to successfully complete the test? Why or why not? If yes,
what is your strategy?
________________________________________________________________________
________________________________________________________________________
________________________________________________________________________
3. Are there any other thoughts that you would like to share?
________________________________________________________________________
________________________________________________________________________
________________________________________________________________________

STEREOTYPE THREAT BOUNDARIES 166
Appendix O
Now I’m going to be asking you a couple of follow up question regarding the test you just
completed. Please answer my questions to the best of your ability. Please provide as much
information as possible.
Note to interviewer: Be sure to look over the open-ended questionnaire and highlight any
areas that need to be clarified.
1. Did you direct all your attention toward the test? Why or why not?
________________________________________________________________________
________________________________________________________________________
________________________________________________________________________
2. Was this difficult to do? Why or why not?
________________________________________________________________________
________________________________________________________________________
________________________________________________________________________
3. Did you use a strategy to successfully complete the test? Why or why not? If yes, what
strategy did you use?
________________________________________________________________________
________________________________________________________________________
________________________________________________________________________
4. Did you use multiple strategies? If so, what other strategies did you use and why?
________________________________________________________________________
________________________________________________________________________
________________________________________________________________________
5. Are there any other thoughts that you would like to share?
________________________________________________________________________
________________________________________________________________________
________________________________________________________________________

STEREOTYPE THREAT BOUNDARIES 167
Appendix P
Please use the following rating scale to answer the following questions:
1. I plan to put forth a lot of effort on the test.
Completely disagree 1 2 3 4 5 6 7 Completely agree
2. I plan to try very hard to complete the test successfully.
Completely disagree 1 2 3 4 5 6 7 Completely agree
3. I am going to try to do my very best on the test.
Completely disagree 1 2 3 4 5 6 7 Completely agree
4. I am going to work hard to finish the test on time.
Completely disagree 1 2 3 4 5 6 7 Completely agree
5. I want to do as well as I can on the test.
Completely disagree 1 2 3 4 5 6 7 Completely agree

STEREOTYPE THREAT BOUNDARIES 168
Appendix Q
Please answer the following questions to the best of your ability. Please provide as much
information as possible.
1. Do you plan to put forth a lot of effort on the test? Why or why not?
________________________________________________________________________
________________________________________________________________________
________________________________________________________________________
2. Do you plan to try very hard to complete the test successfully? Why or why not?
________________________________________________________________________
________________________________________________________________________
________________________________________________________________________
3. Do you plan to try to do your very best on the test? Why or why not?
________________________________________________________________________
________________________________________________________________________
________________________________________________________________________
4. Will you work hard to finish the test on time? Why or why not?
________________________________________________________________________
________________________________________________________________________
________________________________________________________________________
5. Do you want to do as well as you can on the test? Why or why not?
________________________________________________________________________
________________________________________________________________________
________________________________________________________________________
6. Are there any other thoughts that you would like to share?
________________________________________________________________________
________________________________________________________________________
________________________________________________________________________

STEREOTYPE THREAT BOUNDARIES 169
Appendix R
Now I’m going to be asking you a couple of follow up question regarding the test you just
completed. Please answer my questions to the best of your ability. Please provide as much
information as possible.
Note to interviewer: Be sure to look over the open-ended questionnaire and highlight any
areas that need to be clarified.
1. Did you put forth a lot of effort on the test? Why or why not?
________________________________________________________________________
________________________________________________________________________
________________________________________________________________________
2. Did you try very hard to complete the test successfully? Why or why not?
________________________________________________________________________
________________________________________________________________________
________________________________________________________________________
3. Did you try to do your very best on the test? Why or why not?
________________________________________________________________________
________________________________________________________________________
________________________________________________________________________
4. Did you work hard to finish the test on time? Why or why not?
________________________________________________________________________
________________________________________________________________________
________________________________________________________________________
5. Did you do as well as you could on the test? Why or why not?
________________________________________________________________________
________________________________________________________________________
________________________________________________________________________
6. Are there any other thoughts that you would like to share?
________________________________________________________________________
________________________________________________________________________
________________________________________________________________________

STEREOTYPE THREAT BOUNDARIES 170
Appendix S
Please use the following rating scale to answer the following questions:
1. I expect to feel lazy or bored when I work on these tasks and that I will quit before I
finish what I planned to do.
Completely disagree 1 2 3 4 5 6 7 Completely agree
2. I plan to work hard to do well on these tasks even if I don’t like what it is.
Completely disagree 1 2 3 4 5 6 7 Completely agree
3. If the task is difficult, I will either give up or only do the easy parts of the task.
Completely disagree 1 2 3 4 5 6 7 Completely agree
4. Even if the task is dull and uninteresting, I will manage to keep working until I finish.
Completely disagree 1 2 3 4 5 6 7 Completely agree

STEREOTYPE THREAT BOUNDARIES 171
Appendix T
Please answer the following questions to the best of your ability. Please provide as much
information as possible.
1. Do you expect to feel lazy or bored on the upcoming decision-making test? Do you
think you will quit before you finish what you planned to do? Why or why not?
_____________________________________________________________________
_____________________________________________________________________
_____________________________________________________________________
2. Do you work hard to do well on tasks even if you don’t like what it is? Why or why
not?
_____________________________________________________________________
_____________________________________________________________________
_____________________________________________________________________
3. When the task is difficult, do you either give up or only do the easy parts of the task?
Why or why not?
_____________________________________________________________________
_____________________________________________________________________
_____________________________________________________________________
4. When you think a task is dull and uninteresting, do you manage to keep working until
you are finish? Why or why not?
_____________________________________________________________________
_____________________________________________________________________
_____________________________________________________________________
5. Are there any other thoughts that you would like to share?
_____________________________________________________________________
_____________________________________________________________________
_____________________________________________________________________

STEREOTYPE THREAT BOUNDARIES 172
Appendix U
Now I’m going to be asking you a couple of follow up question regarding the test you just
completed. Please answer my questions to the best of your ability. Please provide as much
information as possible.
Note to interviewer: Be sure to look over the open-ended questionnaire and highlight any
areas that need to be clarified.
1. Did you feel lazy or bored during decision-making test? Did you quit before you
finished what you planned to do? Why or why not?
_____________________________________________________________________
_____________________________________________________________________
_____________________________________________________________________
2. Did you work hard to do well on the test even if it wasn’t something that you liked?
Why or why not?
_____________________________________________________________________
_____________________________________________________________________
_____________________________________________________________________
3. Was the test difficult? If so, did you either give up or only do the easy parts of the
test? Why or why not?
_____________________________________________________________________
_____________________________________________________________________
_____________________________________________________________________
4. Did you think the test was dull and uninteresting? Did you manage to keep working
until you were finish? Why or why not?
_____________________________________________________________________
_____________________________________________________________________
_____________________________________________________________________
5. Are there any other thoughts that you would like to share?
_____________________________________________________________________
_____________________________________________________________________
_____________________________________________________________________

STEREOTYPE THREAT BOUNDARIES 173
Appendix V
Edinburgh Handedness Inventory1
Your Initials:
Please indicate with a check () your preference in using your left or right hand in the following
tasks.
Where the preference is so strong you would never use the other hand, unless absolutely forced
to, put two checks ().
If you are indifferent, put one check in each column ( | ).
Some of the activities require both hands. In these cases, the part of the task or object for which
hand preference is wanted is indicated in parentheses.
Task / Object Left Hand Right Hand
1. Writing
2. Drawing
3. Throwing
4. Scissors
5. Toothbrush
6. Knife (without fork)
7. Spoon
8. Broom (upper hand)
9. Striking a Match (match)
10. Opening a Box (lid)
Total checks: LH = RH =
Cumulative Total CT = LH + RH =
Difference D = RH – LH =
Result R = (D / CT) × 100 =
Interpretation:
(Left Handed: R < -40)
(Ambidextrous: -40 ≤ R ≤ +40)
(Right Handed: R > +40)

STEREOTYPE THREAT BOUNDARIES 174
Appendix W
Please answer each question.
1. What is your age? _______________
2. What is your gender? _________Male __________Female
3. What is your race?
a. African-American ____
b. Asian ____
c. Caucasian ____
d. Latino/Hispanic____
e. Native American ____
f. Other ______________
4. What is your family household income?
a. Less than $20,000
b. $20,000 - $40,000
c. $40,000-$60,000
d. $60,000 – $75,000
e. $75,000-$100,000
f. $100,000 and above
(*Note. This question will be included for participants in the given the Well-Known
Stereotype).

STEREOTYPE THREAT BOUNDARIES 175
References
Ackerman, P. L. & Heggestad, E. D. (1997). Intelligence, personality, and interests: Evidence for
overlapping traits. Psychological Bulletin, 121, 219-245. doi: 10.1037/0033-
2909.121.2.219
Ambady, N., Paik, S. K., Steele, J., Owen-Smith, A., & Mitchell, J. P. (2004). Deflecting
negative self-relevant stereotype activation: The effects of individuation. Journal of
Experimental Social Psychology, 40, 401 – 408. doi: 10.1016/j.jesp.2003.08.003
Anderson, R. D. (2001). Stereotype threat: The effects of gender identification on standardized
test performance. Unpublished doctoral dissertation, James Madison University.
Aronson, J., Fried, C. B., & Good, C. (2002). Reducing the effects of stereotype threat on
African-American college students by shaping theories of intelligence. Journal of
Experimental and Social Psychology, 38, 113-125. doi: 10.1006/jesp.2001.1491
Aronson, J. & Inzlicht, M. (2004). The ups and downs of attributional ambiguity: Stereotype
vulnerability and the academic self-knowledge of African-American college students.
Psychological Science, 15, 829-836. doi: 10.1111/j.0956-7976.2004.00763.x
Aronson, J., Lustina, M. J., Good, C., Keough, K., Steele, C. M., & Brown, J. (1999). When
White men can’t do math: Necessary and sufficient factors in stereotype threat. Journal
of Experimental Social Psychology, 35, 29 – 46. doi: 10.1006/jesp.1998.1371
Aronson, J., Quinn, D. M., & Spencer, S. J. (1998). Stereotype threat and the academic
underperformance of minorities and women. In Prejudice: The target’s perspective,
Swim, J. K. (Ed.); Stangor, C. (Ed.); pp. 83-103. San Diego, CA: Academic Press.

STEREOTYPE THREAT BOUNDARIES 176
Ashcraft, M. H. (2002). Math anxiety: Personal, educational, and cognitive consequences.
Current Directions in Psychological Science, 11, 181-185. doi: 10.1111/1467-
8721.00196
Bailey, A. A. (2004). Effects of stereotype threat on females in math and science fields: An
investigation of possible mediators and moderators of the threat-performance
relationship. Unpublished doctoral dissertation. Georgia Institute of Technology.
Baron, R. M. & Kenny, D. A. (1986). The moderator-mediator variable distinction in social
psychological research: Conceptual, strategic, and statistical considerations. Journal of
Personality and Social Psychology, 51, 1173-1182. doi: 10.1037/0022-3514.51.6.1173
Beilock, S. L., Rydell, R. J., & McConnell, A. R. (2007). Stereotype threat and working
memory: Mechanisms, alleviation, and spillover. Journal of Experimental Psychology:
General, 136, 256-276. doi: 10.1037/0096-3445.136.2.256
Belsley, D. A., Kuh, E., & Welsch, R. E. (1980). Regression Diagnostics: Identifying Influential
Data and Sources of Collinearity. New York: John Wiley and Sons.
Bergeron, D. M., Block, C. J., & Echtenkamp, B. A. (2006). Disabling the able: Stereotype threat
and women’s work performance. Human Performance, 19, 133-158. doi:
10.1207/s15327043hup1902_3
Bargh, J. A., Chen, M., & Burrows, L. (1996). Automaticity of social behavior: Direct effects of
trait construct and stereotype activation on action. Journal of Personality and Social
Psychology, 71, 230 – 244. doi: 10.1037/0022-3514.71.2.230
Bennett, T. & Gaines, J. (2010). Believing what you hear: The impact of aging stereotypes upon
the old. Educational Gerontology, 36, 435-445. doi: 10.1080/03601270903212336

STEREOTYPE THREAT BOUNDARIES 177
Ben-Zeev, T., Fein, S., & Inzlicht, M. (2005). Arousal and stereotype threat. Journal of
Experimental Social Psychology, 41, 174-181. doi: 10.1016/j.jesp.2003.11.007
Bosson, J. K., Haymovitx, E. L., & Pinel, E. C. (2004). When saying and doing diverge: The
effects of stereotype threat on self-reported versus non-verbal anxiety. Journal of
Experimental Social Psychology, 40, 247 – 255. doi: 10.1016/S0022-1031(03)00099-4
Brodish, A. B. (2007). Stereotype threat and achievement goals: An integrative approach.
Unpublished doctoral dissertation, University of Wisconsin – Madison.
Brodish, A. B. & Devine, P. G. (2009). The role of performance-avoidance goals and worry in
mediating the relationship between stereotype threat and performance. Journal of
Experimental Social Psychology, 45, 180-185. doi: 10.1016/j.jesp.2008.08.005
Brown, R. W. (2007). Exception to the rule: Can test administrators prevent stereotype threat?
Unpublished doctoral dissertation, University of Florida.
Brown, T. A. (2006). Confirmatory Factor Analysis for Applied Research. The Guilford Press:
New York.
Brown, R. P. & Day, E. A. (2006). The difference isn’t black and white: Stereotype threat and
the race gap on Raven’s Advanced Progressive Matrices. Journal of Applied Psychology,
91, 979-985. doi: 10.1037/0021-9010.91.4.979
Brown, R.P., & Josephs, R.A. (1999). A burden of proof: Stereotype relevance and
gender differences in math performance. Journal of Personality and Social Psychology,
76, 246-257. doi: 10.1037/0022-3514.76.2.246
Brown, R. P., & Pinel, E. C. (2003). Stigma on my mind: Individual differences in the
experience of stereotype threat. Journal of Experimental Social Psychology, 39, 626 –
633. doi: 10.1016/S0022-1031(03)00039-8

STEREOTYPE THREAT BOUNDARIES 178
Cadinu, M., Maass, A., Frigerio, S., Impagliazzo, L., & Latinotti, S. (2003). Stereotype threat:
The effect of expectancy on performance. European Journal of Social Psychology, 33,
267 – 285. doi: 10.1002/ejsp.145.
Campbell, S. M. & Collaer, M. L. (2009). Stereotype threat and gender differences in
performance on a novel visuospatial task. Psychology of Women Quarterly, 33, 437-444.
doi: 10.1111/j.1471-6402.2009.01521.x
Campbell, D. T. & Fiske, D. W. (1959). Convergent and discriminant validation by the
multitrait-multimethod matrix. Psychological Bulletin, 56, 81-105.
Campbell, J. P. & Pritchard, R. D. (1976). Motivation theory in industrial and organizational
psychology. In M. D. Dunnette (Ed.), Handbook of industrial and organizational
psychology (pp.84-95). Chicago: Rand McNally
Carr, P. B. & Steele, C. M. (2009). Stereotype threat and inflexible perseverance in problem
solving. Journal of Experimental Social Psychology, 45, 853-859. doi:
10.1016/j.jesp.2009.03.003
Chapman, L., Sargent-Cox, K., Horswill, M. S., & Anstey, K. J. (2014). The impact of age
stereotypes on older adults’ hazard perception performance and driving confidence.
Journal of Applied Gerontology, 33, 514-530. doi:
http://dx.doi.org.ezproxy.umsl.edu/10.1177/0733464813517505
Choma, B. L. (2009). Why are people liberal? A motivated social cognition perspective.
Unpublished doctoral dissertation, Brock University.

STEREOTYPE THREAT BOUNDARIES 179
Chung, B. G., Ehrhart, M. G., Ehrhart, K. H., Hattrup, K., & Solamon, J. (2009). Stereotype
threat, state anxiety, and specific self-efficacy as predictors of promotion exam
performance. Group and Organization Management, 35, 77-107. doi:
10.1177/1059601109354839
Cohen, J. (1968). "Weighted kappa: Nominal scale agreement with provision for scaled
disagreement or partial credit". Psychological Bulletin 70, 213–220. doi:
10.1037/h0026256
Cohen, G. L. & Garcia, J. (2005). I am us: Negative stereotypes as collective threats. Journal of
Personality and Social Psychology, 89, 566-582. doi: 10.1037/0022-3514.89.4.566
Cohen, G. L., Garcia, J., Apfel, N., & Master, A. (2006). Reducing the racial achievement gap: A
social-psychological intervention. Science, 313, 1307-1310.
Cole, J. S., Bergin, D. A., & Whittaker, T. A. (2008). Predicting student achievement for low
stakes tests with effort and task value. Contemporary Educational Psychology, 33, 609-
624. doi: 10.1016/j.cedpsych.2007.10.002
Cole, J. S. & Osterlind, S. J. (2005, April). Effects of test consequence with college students.
Montreal: Paper presented at the American Educational Research Association.
Cook, T. D. & Campbell, D. T. (1976). The design and conduct of quasi-experiments and true
experiments in field settings. In M. D. Dunnette (ed.), Handbook of Industrial and
Organizational Psychology. Chicago, IL: Rand McNally, 223-326.
Croizet, J. C., & Claire, T. V. (1998). Extending the concept of stereotype threat to social class:
The intellectual underperformance of students from low socioeconomic backgrounds.
Personality and Social Psychology Bulletin, 24, 588 – 594. doi:
10.1177/0146167298246003

STEREOTYPE THREAT BOUNDARIES 180
Croizet, J. C., Despres, G., Gauzins, M. E., Huguet, P., Leyens, J. P., & Meot, A. (2004).
Stereotype threat undermines intellectual performance by triggering a disruptive mental
load. Personality and Social Psychology Bulletin, 30, 721-731. doi:
10.1177/0146167204263961
Croizet, J. C., Dutrevis, M., & Desert, M. (2002). Why do students holding non-prestigious high
school degrees underachieve at the university? Swiss Journal of Psychology, 61, 167-175.
doi: 10.1024//1421-0185.61.3.167
Cronbach, L. J. & Snow, R. E. (1977) Aptitudes and instructional methods: A handbook for
research on interactions. New York: Irvington.
Cross, T. (2010). College graduation rates: Where black students do the best and where they fare
poorly compared to their white peers. The Journal of Blacks in Higher Education, 67.
Retrieved on September 26, 2011, from: http://www.jbhe.com/features/65_gradrates.html
Cruz-Duran, E. (2010). Stereotype threat in mathematics: Female high school students in all-girl
and coeducation schools. Unpublished doctoral dissertation. St. John’s University.
Cullen, M. J., Hardison, C. M., & Sackett, P. R. (2004). Using SAT-grade and ability-job
performance relationships to test predictions derived from stereotype threat theory.
Journal of Applied Psychology, 89, 220-230. doi: 1037/0021-9010.89.2.220
Cullen, M. J., Waters, S. D., & Sackett, P. R. (2006). Testing stereotype threat theory predictions
for math-identified and non-math-identified students by gender. Human Performance, 19,
421-440. doi: 10.1207/s15327043hup1904_6
Danaher, K., & Crandell, C. S. (2008). Stereotype threat in applied settings, reexamined.
Journal of Applied Social Psychology, 38, 1639 – 1655. doi: 10.1111/j.1559-
1816.2008.00362.x

STEREOTYPE THREAT BOUNDARIES 181
Daneman, M. & Carpenter, P. A. (1980). Individual differences in working memory and reading.
Journal of Verbal Learning and Verbal Behavior, 19, 450-466. doi: 10.1019/S0022-
5371(80)90312-6
Davies, P. G., Spencer, S. J., Quinn, D. M., & Gerhardstein, R. (2002). Consuming images: How
television commercials that elicit stereotype threat can restrain women academically and
professionally. Personality and Social Psychology Bulletin, 28, 1615-1628. doi:
10.1177/014616702237644
Delgado, A. R. & Prieto, G. (2008). Stereotype threat as validity threat: The anxiety-sex-threat
interaction. Intelligence, 36, 635-640. doi: 10.1016/j.intell.2008.01.008
Delisle, M. N., Guay, F., Senecal, C., & Larose, S. (2009). Predicting stereotype endorsement
and academic motivation in women in science programs: A longitudinal model.
Learning and Individual Differences, 19, 468-475. doi: 10.1016/j.lindif.2009.04.002
Derakshan, N. & Eysenck, M. W. (1998). Working memory capacity in high trait-anxious and
repressor groups. Cognition and Emotion, 12, 697-713. doi: 10.1080/026999398379501
Dijksterhuis, A., & Bargh, J. A. (2001). The perception-behavior expressway: Automatic effects
of social perception on social behavior. Advances in Experimental Social Psychology,
33, 1 – 40.
Dijksterhuis, A., & van Knippenberg, A. (1998). The relation between perception and behavior,
or how to win a game of Trivial Pursuit. Journal of Personality and Social Psychology,
74, 865-877. doi: 10.1037/0022-3514.74.4.865
Dijksterhuis, A., & van Kinppenberg, A. (2000). Behavioral indecision: Effects of self-focus on
automatic behavior. Social Cognition, 18, 55-74. doi: 10.1521/soco.2000.18.1.55

STEREOTYPE THREAT BOUNDARIES 182
Dijksterhuis, A., Postmes, R., Stapel, T., Koomen, D., Knippenberg, W., van Scheepers, D.
(1998). Seeing one thing and doing another: Contrast effects in automatic behavior.
Journal of Personality and Social Psychology, 75, 862-871. doi: 10.1037/0022-
3514.75.4.862
Dinella, L. M. (2004). A developmental perspective on stereotype threat and high school
mathematics. Unpublished doctoral dissertation, Arizona State University.
Doan, L. A. (2008). A qualitative investigation of stereotype threat activation and mediation.
Unpublished doctoral dissertation. Arizona State University.
Dweck, C. S. & Elliot, E. S. (1983). Achievement motivation. In P. H. Mussen (Gen Ed.) & E.
M. Hetherington (Eds.), Handbook of child psychology: Vol. IV. Social and personality
development (pp. 643-691). New York: Wiley.
Eccles, J. S. & Wigfield, A. (2002). Motivational beliefs, values, and goals. Annual Review of
Psychology, 53, 109-132. doi: 10.1146/annurev.psych.53.100901.135153
Edwards, B. D. (2004). An examination of factors contributing to a reduction in race-based
subgroup difference on a constructed response paper-and-pencil test of achievement.
Unpublished doctoral dissertation, Texas A&M University.
Elizaga, R. A. & Markman, K. D. (2008). Peers and performance: How in-group and out-group
comparisons moderate stereotype threat effects. Current Psychology: A Journal for
Diverse Perspectives on Diverse Psychological Issues, 27, 290-300. doi:
10.1007/s12144-008-9041-y
Engle, R. W. (2002). Working memory capacity as executive attention. Current Direction in
Psychological Science, 11, 19-23. doi: 10.1111/1467-8721.00160

STEREOTYPE THREAT BOUNDARIES 183
Erdfelder, E., Faul, F., & Buchner, A. (1996). GPOWER: A general power analysis program.
Behavior Research Methods, Instruments, & Computers, 28, 1-11.
Eysenck, M. W. & Calvo, M. G. (1992). Anxiety and performance: The processing efficiency
theory. Cognition and Emotion, 6, 409-434. doi: 10.1080/02699939208409696
Forbes, C. E. (2009). Lessons learned from a clockwork orange: How retraining implicit
attitudes and stereotypes affects motivation and performance under stereotype threat.
Unpublished doctoral dissertation, University of Arizona.
Friedman, I. A. & Bendas-Jacob, O. (1997). Measuring perceived test anxiety in adolescents: A
self-report scale. Educational and Psychological Measurement, 57, 1035-1046. doi:
10.1177/001316449705700612
Frost, M. U. (2010). A stereotype threat intervention that examines causal attributions, self-
efficacy, and perceived faculty support. Unpublished doctoral dissertation, University of
Rhode Island.
Gillespie, J. Z., Converse, P. D., & Kriska, S. D. (2010). Applying recommendations from the
literature on stereotype threat: Two field studies. Journal of Business and Psychology, 25,
493-504. doi: 10.1007/s10869-010-9178-1
Gonzales, P. M., Blanton, H., & Williams, K. J. (2002). The effects of stereotype threat and
double-minority status on the test performance of Latino women. Personality and Social
Psychology Bulletin, 28, 659-670. doi: 10.1177/1046167202288010
Greenstein, J. E. & Kassel, J. D. (2009). The effects of smoking and smoking abstinence on
verbal and visuospatial working memory capacity. Experimental and Clinical
Psychopharmacology, 17, 78-90. doi: 10.1037/a0015699

STEREOTYPE THREAT BOUNDARIES 184
Greenwald, A. G., McGhee, D. E., & Schwartz, J. L. (1998). Measuring individual differences in
implicit cognition: The implicit association test. Journal of Personality and Social
Psychology, 74, 1464-1480. doi: 10.1037/0022-3514.74.6.14.64
Gresky, D. P. (2000). That was hard! Examining the effects of test instructions and content on
women’s mathematics performance under stereotype threat. Unpublished doctoral
dissertation, Texas Christian University.
Grimm, L. R., Markman, A. B., Maddox, W. T., & Baldwin, G. C. (2009). Stereotype threat
reinterpreted as regulatory mismatch. Journal of Personality and Social Psychology, 96,
288-304. doi: 10.1037/a0013463
Hansen, J. & Wanke, M. (2009). Think of capable others and you can make it! Self-efficacy
mediates the effect of stereotype activation on behavior. Social Cognition, 27, 76-88.
doi:10.1521/soco.2009.27.1.76
Harder, J. A. (1999). The effects of private versus public evaluation on stereotype threat for
women in mathematics. Unpublished doctoral dissertation, Colgate University.
Harrison, L. A., Stevens, C. M., Monty, A. N., & Coakley, C. A. (2006). The consequences of
stereotype threat on the academic performance of white and non-white lower income
college students. Social Psychology of Education, 9, 341-357. doi: 10.1007/s11218-005-
5456-6
Hembree, R. (1988). Correlates, causes, effects, and treatment of test anxiety. Review of
Educational Research, 58, 47-77. doi: 10.2307/1170348
Hess, T. M., Auman, C., Colcombe, S. J., & Rahhal, T. A. (2003). The impact of stereotype
threat on age differences in memory performance. J. Gerontol. Series B-
Psychol.Sci.Soc.Sci., 58, 3-11.

STEREOTYPE THREAT BOUNDARIES 185
Hollenbeck, J. R., Williams, C. R., & Klein, H. J. (1989). An empirical examination of the
antecedents of commitment to difficult goals. Journal of Applied Psychology, 74, 18-23.
Hollis-Sawyer, L. A. & Sawyer, T. P. (2008). Potential stereotype threat and face validity effects
on cognitive-based test performance in the classroom. Educational Psychology, 28, 291-
304. doi: 10.1080/01443410701532313
Horton, S. M. (2008). Aging stereotypes: Effects on the performance and health of seniors.
Unpublished doctoral dissertation. Queen’s University, Canada.
Inzlicht, M., & Ben-Zeev, T. (2000). A threatening intellectual environment: Why
women are susceptible to experience problem-solving deficits in the presence of men.
Psychological Science, 11, 365-371. doi: 10.1111/1467-9280.00272
Jamieson, J. P. (2009). The role of motivation in blatant stereotype threat, subtle stereotype
threat, and stereotype priming. Unpublished doctoral dissertation. Northeastern
University.
Jamieson, J. P. (2010). Evaluation is necessary to produce stereotype threat performance effects.
Social Influence, 5, 75-86. doi: 10.1080/15534510903512409
Jamieson, J. P. & Harkins, S. G. (2012). Distinguishing between the effects of stereotype
priming and stereotype threat on math performance. Group Processes & Intergroup
Relations, 15, 291-304. doi: 10.1177/1368430211417833
Jensen, A. R. (1998). The g factor. Westport, CT: Praeger.
Johns, M., Inzlicht, M., & Schmader, T. (2008). Stereotype threat and executive resource
depletion: Examining the influence of emotion regulation. Journal of Experimental
Psychology, 137, 691 – 705. doi: 10.1037/a0013834

STEREOTYPE THREAT BOUNDARIES 186
Johns, M., Schmader, T., & Martens, A. (2005). Knowing is half the battle: Teaching stereotype
threat as a means of improving women’s math performance. Psychological Science, 16,
175 – 179. doi: 10.1111/j.0956-7976.2005.00799.x
Johnson, R. N. (2009). The psychology of racism: How internalized racism, academic self-
concept, and campus racial climate impact the academic experiences and achievement of
African-American undergraduates. Unpublished doctoral dissertation, University of
California-Los Angeles.
Josephs, R. A., Newman, M. L., Brown, R. P., & Beer, J. M. (2003). Status, testosterone, and
human intellectual performance: Stereotype threat as status concern. Psychological
Science, 14, 158-163.
Kane, M. J., Conway, A. R. A., Hambrick, D. Z., & Engle, R. W. (2007). Variation in working
memory as variation in executive attention and control. In A. R. A. Conway, C. Jarrold,
M. J. Kane, A. Miyake, & J. N. Towse (Eds.), Variation in working memory (pp. 21-48).
Oxford, England: Oxford University Press.
Kane, M. J., & Engle, R. W. (2003). Working-memory capacity and the control of attention: The
contributions of goal neglect, response competition, and task set to Stroop interference.
Journal of Experimental Psychology: General, 132, 47-70. doi: 10.1037/0096-
3445.132.1.47
Kanfer, R. (1991). It’s a goal, goal, goal setting world. PsycCRITIQUES, 36, 847-848. doi:
10.1037/030241
Kanfer, R. & Ackerman, P. L. (1989). Motivation and cognitive abilities: An
integrative/aptitude-treatment interaction approach to skill acquisition. Journal of Applied
Psychology Monograph, 74, 657-690. doi: 10.1037/0021-9010.74.4.657

STEREOTYPE THREAT BOUNDARIES 187
Karmos, A. H. & Karmos, J. S. (1984). Attitudes toward standardized achievement tests and
their relation to achievement test performance. Measurement and Evaluation in
Counseling and Development, 17, 56-66.
Keller, J., & Dauenheimer, D. (2003). Stereotype threat in the classroom: Dejection mediates the
disrupting threat effects on women’s math performance. Personality and Social
Psychology Bulletin, 29, 371 – 381. doi: 10.1177/0146167202250218
Kiefer, A. K. (2005). The effects of stereotypes on performance attributions: How gender-math
stereotypes lead women to internalize failure. Unpublished doctoral dissertation,
University of Michigan.
Kirnan, J. P., Alfieri, J. A., Bragger, J. D., & Harris, R. S. (2009). An investigation of stereotype
threat in employment tests. Journal of Applied Social Psychology, 39, 359 – 388. doi:
10.1111/j.1559-1816.2008.00442.x
Klein, K. & Boals, A. (2001). The relationship of life event stress and working memory capacity.
Applied Cognitive Psychology, 15, 565-579. doi: 10.1002/acp.727
Kray, L. J., Thompson, L., & Galinsky, A. D. (2001). Battle of the sexes: Gender stereotype
confirmation and reactance in negotiations. Journal of Personality and Social
Psychology, 80, 942 – 958. doi: 10.1037/0022-3514.80.6.942
Lawrence, J. S. & Charbonneau, J. (2009). The link between basing self-worth on academics and
student performance depends on group identification and academic setting. Learning and
Individual Differences, 19, 615-620. doi: 10.1016/j.lindif.2009.08.005
Lawrence, J. S. & Crocker, J. (2009). Academic contingencies of self-worth impair positively-
and negatively-stereotyped students’ performance in performance-goal settings. Journal
of Research in Personality, 43, 868-874. doi: 10.1016/j.jrp.2009.05.002

STEREOTYPE THREAT BOUNDARIES 188
Lawrence, J. S., Marks, B. T., & Jackson, J. S. (2010). Group identification predicts black
students’ underperformance on moderately-difficult tests. Motivation and Emotion, 34,
105-109. doi: 10.1007/s11031-010-9159-8
Leyens, J. P., Desert, M., Croizet, J. C., & Darcis, C. (2000). Stereotype threat: Are lower status
and history of stigmatization preconditions of stereotype threat? Personality and Social
Psychology Bulletin, 26, 1189-1199. doi: 10.1177/0146167200262002
Logel, C., Walton, G. M., Spencer, S. J., Iserman, E. C., von Hippel, W., & Bell, A. E. (2009).
Interacting with sexist men triggers social identity threat among female engineers.
Journal of Personality and Social Psychology, 96, 1089-1103. doi: 10.1037/a0015703
Looby, A. & Earleywine, M. (2010). Gender moderates the impact of stereotype threat on
cognitive function in cannabis users. Addictive Behaviors, 35, 834-839. doi:
10.1016/j.addbeh.2010.04.004
Major, B. & Schmader, T. (1998). Coping with stigma through psychological disengagement. In
Prejudice: The Target’s Perspective. Swim, J. K. & Stangor, C. (Eds); San Diego, CA,
US: Academic Press. Pp. 219-241.
Mangels, J. A., Good, C., Whiteman, R. C., Maniscalco, B., & Dweck, C. S. (2012). Emotion
blocks the path to learning under stereotype threat. SCAN, 7, 230-241. doi:
10.1093/scan/nsq100
Martens, A., Johns, M., Greenberg, J., & Schimel, J. (2006). Combating stereotype threat: The
effect of self-affirmation on women’s intellectual performance. Journal of Experimental
Social Psychology, 42, 236-243. doi: 10.1016/j.jesp.2005.04.010
Martin, D. E. (2004). Stereotype threat, cognitive aptitude measures, and social identity.
Unpublished doctoral dissertation, Howard University.
STEREOTYPE THREAT BOUNDARIES 189
Martiny, S. E., Roth, J., Jelenec, P., Steffens, M. C., & Croizet, J. C. (2011). When a new group
identity does harm on the spot: Stereotype threat in newly created groups. European
Journal of Social Psychology, 42, 65-71. doi: 10.1002/ejsp.840
Marx, D. M., & Roman, S. (2002). Female role models: Protecting women’s math test
performance. Personality and Social Psychology Bulletin, 28, 1183-1193. doi:
10.1177/01461672022812004
Marx, D. M., & Stapel, D. A. (2006a). Distinguishing stereotype threat from priming effects: On
the role of the social self and threat-based concerns. Journal of Personality and Social
Psychology, 91, 243 – 254. doi: 10.1037/0022-3514.91.2.243
Marx, D. M., & Stapel, D. A. (2006b). It’s all in the timing: Measuring emotional reactions to
stereotype threat before and after taking a test. European Journal of Social Psychology,
36, 687-698. doi: 10.1002/ejsp.310
Marx, D. M., Stapel, D. A., & Muller, D. (2005). We can do it: The interplay of construal
orientation and social comparisons under threat. Journal of Personality and Social
Psychology, 88, 432-446. doi: 10.1037/0022-3514.88.3.432
Masi, D. L. (2000). Investigating the determinants of cognitive ability test performance: Is ‘e(i)’
more than meets the eye? Unpublished doctoral dissertation, University of Connecticut.
Mayer, D. M., & Hanges, P. J. (2003). Understanding the stereotype threat effect with “culture-
free” tests: An examination of its mediators and measurement. Human Performance, 16,
207-230. doi: 10.1207/S15327043HUP1603_3
McCracken, C. (2009). Stereotype threat in text comprehension. Unpublished doctoral
dissertation, Indiana University of Pennsylvania.

STEREOTYPE THREAT BOUNDARIES 190
McDonald, M. (2004, August 16). A few good women: Tech firms want more female computer
whizzes. U.S. News & World Report.
McFarland, L. A., Lev-Arey, D. M., & Ziegert, J. C. (2003). An examination of stereotype threat
in a motivational context. Human Performance, 16, 181-205. doi:
10.1207/S15327043HUP1603_2
McGee, E. O. & Martin, D. B. (2011). “You would not believe what I have to go through to
prove my intellectual value!” Stereotype management among academically successful
black mathematics and engineering students. American Educational Research Journal,
48, 1347-1389. doi: 10.3102/0002831211423972
McKay, P. F., Doverspike, D., Bowen-Hilton, D., & Martin, Q. D. (2002). Stereotype threat
effects on the raven advanced progressive matrices scores of African-Americans. Journal
of Applied Social Psychology, 32, 767-787. doi: 10.1111/j.1559-1816.2002.tb00241.x
McKown, C. K. & Weinstein, R. S. (2003). The development and consequences of stereotype
consciousness in middle childhood. Child Development, 74, 498-515. doi: 10.111/1467-
8624.7402012
McManus, C. (2002). Right hand, left hand. London, Great Britain, Clays Ltd.
Meloun, J. M. (2005). Computer anxiety: A possible threat to the predictive validity of
computerized tests. Unpublished doctoral dissertation, University of Akron.
Milner, H. R. & Hoy, A. W. (2003). A case study of African American teacher’s self-efficacy,
stereotype threat, and persistence. Teaching and Teacher Education, 19, 263-276. doi:
10.1016/S0742-051X(02)000099-9

STEREOTYPE THREAT BOUNDARIES 191
Morris, L. W., Davis, M. A., & Hutchings, C. H. (1981). Cognitive and emotional components of
anxiety: Literature review and a revised worry-emotionality scale. Journal of Educational
Psychology, 73, 541-555. doi: 10.1037/0022-0663.73.4.541
Muldrow, A. M. (2008). Achievement motivation in African-American college students.
Unpublished doctoral dissertation, Old Dominion University.
Mulhern, F. & Rae, G. (1998). Development of a shortened form of the Fennema-Sherman
Mathematics Attitudes Scales. Educational and Psychological Measurement, 58, 295-
306. doi: 10.1177-0013164498058002012
Murphy, M. C., Steele, C. M., & Gross, J. J. (2007). Signaling threat: How situational cues affect
women in math, science, and engineering settings. Psychological Science, 18, 879-885.
doi: 10.1111/j.1467-9280.2007.01995.x
Naylor, J. C., Pritchard, R. D., & Ilgen, D. R. (1980). A theory of behavior in organizations. New
York: Academic Press.
Nguyen, H. D., O’Neal, A., & Ryan, A. M. (2003). Relating test-taking attitudes and skills and
stereotype threat effects to the racial gap in cognitive ability test performance. Human
Performance, 16, 261-293. doi: 10.1207/S15327043HUP1603_5
Nguyen, H. D., & Ryan, A. M. (2008). Does stereotype threat affect test performance of
minorities and women? A meta-analysis of experimental evidence. Journal of Applied
Psychology, 93, 1314 – 1334. doi: 10.1037/a0012702
Nomura, J. M. (2004). Stereotype threat theory as an explanation for the depressed
performance on cognitive ability measures by African-Americans. Unpublished doctoral
dissertation, University of Oklahoma.

STEREOTYPE THREAT BOUNDARIES 192
Nussbaum, A. D. & Steele, C. M. (2007). Situational disengagement and persistence in the face
of adversity. Journal of Experimental Social Psychology, 43, 127-134. doi:
10.1016/j.jesp.2005.12.007
O’Brien, L. T. & Crandall, C. S. (2003). Stereotype threat and arousal: Effects on women’s math
performance. Personality and Social Psychology Bulletin, 29, 782-789. doi:
10.1177/0146167203029006010
Oldfield, R. C. (1971). The assessment and analysis of handedness: The Edinburgh inventory.
Neuropsychololgia, 9, 97-113.
O’Neil, H. F., Sugrue, B., & Baker, E. L. (1996). Effects of motivational interventions on the
National Assessment of Educational Progress Mathematics performance. Educational
Assessment, 3, 135-157.
Osborne, J. W. & Walker, C. (2006). Stereotype threat, identification with academics, and
withdrawal from school: Why the most successful students of colour might be most likely
to withdraw. Educational Psychology, 26, 563-577. doi: 10.1080/01443410500342518
Oswald, D. L., & Harvey, R. D. (2000-2001). Hostile environments, stereotype threat, and math
performance among undergraduate women. Current Psychology: Developmental,
Learning, Personality, Social, 19, 338 – 356. doi: 10.1007/s12144-000-1-25-5
Owens, J. & Massey, D. S. (2011). Stereotype threat and college academic performance: A latent
variables approach. Social Science Research, 40, 150-166. doi:
10.1016/j.ssresearch.2010.09.010
Palumbo, M. V. (2007). Cognitive ability, job knowledge, and stereotype threat: When does
adverse impact result? Unpublished doctoral dissertation, Wright State University.

STEREOTYPE THREAT BOUNDARIES 193
Pearson, B. E. (2006). The effects of stereotype threat on the standardized test scores of black
college students. Unpublished doctoral dissertation. Morgan State University.
Pelligrini, A. V. (2005). The impact of stereotype threat on intelligence testing in Hispanic
females. Unpublished doctoral dissertation, Carlos Albizu University.
Pintrich, P. R., Smith, D.A., Garcia, T., & McKeachie, W. J. (1993). Reliability and predictive
validity of the Motivated Strategies for Learning Questionnaire (MSLQ). Educational
and Psychological Measurement, 53, 801-813. doi: 10.1177/0013164493053003024
Ployhart, R. E., Ziegert, J. C., & McFarland, L. A. (2003). Understanding racial difference on
cognitive ability tests in selection research. Human Performance, 16, 231 – 259. doi:
10.1207/S15327043HUP1603_4
Podsakoff, P. M., MacKenzie, S. B., Lee, J. Y., & Podsakoff, N. P. (2003). Common method
biases in behavioral research: A critical review of the literature and recommended
remedies. Journal of Applied Psychology, 88, 879-903. doi: 10.1037/0021-9010.88.5.879
Prather, H. M. (2005). Controlling the threat of stereotypes: The effectiveness of mental control
strategies in increasing female math ability test performance. Unpublished doctoral
dissertation, George Washington University.
Preacher, K. J. & Hayes, A. F. (2004). SPSS and SAS procedures for estimating indirect effects
in simple mediation models. Behavior Research Methods, Instrumental Computers, 36,
717-731. doi: 10.3758/BF03206553
Pseekso, A. C., Dahlen, E. R., & Levy, J. J. (2006). Development of the academic stereotype
threat inventory. Measurement and Evaluation in Counseling and Development, 41, 2-13.

STEREOTYPE THREAT BOUNDARIES 194
Reeve, C. L., Heggestad, E. D., & Lievens, F. (2009). Modeling the impact of test anxiety and
test familiarity on the criterion-related validity of cognitive ability tests. Intelligence, 37,
34-41. doi: 10.1019/j.intell.2008.05.003
Rivero-Conil, S. C. (2010). The effects of cognitive busyness on stereotype threat. Unpublished
doctoral dissertation, Carlos Albizu University.
Rosen, V. M., & Engle, R. W. (1998). Working memory capacity and suppression. Journal of
Memory and Language, 39, 418-436. doi: 10.1006/jmla.1998.2590
Rosenthal, H. E. S., & Crisp, R. J. (2006). Reducing stereotype threat by blurring intergroup
boundaries. Journal of Personality and Social Psychology, 32, 501 – 511. doi:
10.1177/0146167205281009
Ryan, A. M. (2001). Explaining the black-white test score gap: The role of test perceptions.
Human Performance, 14, 45-75. doi: 10.1207/S15327043HUP1401_04
Rydell, R. J., McConnell, A. R., & Beilock, S. L. (2009). Multiple social identities and
stereotype threat: Imbalance, accessibility, and working memory. Journal of Personality
and Social Psychology, 96, 949-966. doi: 10.1037/a0014846
Sackett, P. R. (2003). Stereotype threat in applied selection settings: A commentary. Human
Performance, 16, 295-309. doi: 10.1207/S15327043HUP1603_6
Sackett, P. R., Hardison, C. M., & Cullen, M. J. (2004). On interpreting stereotype threat as
accounting for African-American – White differences on cognitive tests. American
Psychologist, 59, 7 – 13. doi: 10.1037/h0087868
Sackett, P. R., Schmitt, N., Ellingson, J. E., & Kabin, M. B. (2001). High-stakes testing in
employment, credentialing, and higher education: Prospects in a post-affirmative-action
world. American Psychologist, 56, 302 – 318. doi: 10.1037/0003-066X.56.4.302

STEREOTYPE THREAT BOUNDARIES 195
Salinas, M. F. (1998). Stereotype threat: The role of effort withdrawal and apprehension on the
intellectual underperformance of Mexican-Americans. Unpublished doctoral dissertation,
University of Texas.
Samson, F. L. (2010). Race and the limits of American meritocracy. Unpublished doctoral
dissertation, Stanford University.
Sarason, I. G., Sarason, B. R., Keefe, D. E., Hayes, B. E., & Shearin, E. N. (1986). Cognitive
interference: Situational determinants and trait like characteristics. Journal of Personality
and Social Psychology, 51, 215-226. doi: 0022-3514/86/$00.75
Sawyer, T. P. & Hollis-Sawyer, L. A. (2005). Predicting stereotype threat, test anxiety, and
cognitive ability test performance: An examination of three models. International
Journal of Testing, 3, 225-246. doi: 10.1207/s15327574ijt0503_3
Schimel, J., Arndt, J., Banko, K. M., & Cook, A. (2004). Not all self-affirmations were created
equal: The cognitive and social benefit of affirming the intrinsic (vs extrinsic) self. Social
Cognition, 22, 75-99. doi: 10.1521/soco.22.1.75.30984
Schmader, T. (2002). Gender identification moderates stereotype threat effects on women’s math
performance. Journal of Experimental Social Psychology, 38, 194 – 201. doi:
10.1006/jesp.2001.1500
Schmader, T. (2010). Stereotype threat deconstructed. Current Directions in Psychological
Science, 19, 14 – 18. doi: 10.1177/0963721409359292
Schmader, T., Forbes, C. E., Zhang, S., & Mendes, W. B. (2009). A meta-cognitive perspective
on cognitive deficits experienced in intellectually threatening environments. Personality
and Social Psychology Bulletin, 35, 584-596. doi: 10.1177/0146167208330450

STEREOTYPE THREAT BOUNDARIES 196
Schmader, T., & Johns, M. (2003). Converging evidence that stereotype threat reduces working
memory capacity. Journal of Personality and Social Psychology, 85, 440 – 452. doi:
10.1037/0022-3514.85.3.440
Schmader, T., Johns, M., & Forbes, C. E. (2008). An integrated process model of stereotype
threat effects on performance. Psychological Review, 115, 336 – 356. doi: 10.1037/0033-
295X.115.2.336
Schwab, D. T. (1980). Construct validity in organizational behavior. Research in Organizational
Behavior, 2, 3-43.
Seagal, J. D. (2001). Identity among members of stigmatized groups: A double-edged sword.
Unpublished doctoral dissertation, University of Texas.
Seibt, B. & Forster, J. (2004). Stereotype threat and performance: How self-stereotypes influence
processing by inducing regulatory foci. Journal of Personality and Social Psychology,
87, 38-56. doi: 10.1037/0022-3514.87.1.38
Shapiro, J. R. & Neuberg, S. L. (2007). From stereotype threat to stereotype threats: Implications
of a multi-threat framework for causes, moderators, mediators, consequences, and
interventions. Personality and Social Psychology Review, 11, 107-130. doi: 10.1177-
1088868306294790
Singh, K., Allen, K. R., Scheckler, R., & Darlingon, L. (2007). Women in computer-related
majors: A critical synthesis of research and theory from 1994-2005. Review of
Educational Research, 77, 500-533. doi: 10.3102/0034654307309919
Smith, J. L. (2002). The stereotyped task engagement process: Understanding females’
motivation for and performance in computer science. Unpublished doctoral dissertation.
University of Utah.

STEREOTYPE THREAT BOUNDARIES 197
Smith, J. L. (2004). Understanding the process of stereotype threat: A review of mediational
variables and new performance goal directions. Educational Psychology Review, 16, 177-
206. doi: 1040-726X/04/0900-0177/0
Smith, J. L., Sansone, C., & White, P. H. (2007). The stereotyped task engagement process: The
role of interest and achievement motivation. Journal of Educational Psychology, 99, 99-
114. doi: 10.1037/0022-0663.99.1.99
Smith, J. L. & White, P. H. (2001). Development of the Group Identification Measure: A tool
for investigating stereotype threat effects. Educational and Psychological Measurement,
61, 1040-1057. doi: 10.1177/0013164012971635
Spencer, S. J. (2005). Stereotype threat and women’s math performance: The possible mediating
factors of test anxiety, test motivation, and self-efficacy. Unpublished doctoral
dissertation, Rutgers, The State University of New Jersey.
Spencer, S. J., Steele, C. M., & Quinn, D. M. (1999). Stereotype threat and women’s math
performance. Journal of Experimental Social Psychology, 35, 4-28. doi:
10.1006/jesp.1998.1373
Spicer, C. V. (1999). Effects of self-stereotyping and stereotype threat on intellectual
performance. Unpublished doctoral dissertation, University of Kentucky.
Spielberger, C., Gorsuch, R., Lushene, R., Vagg, P., & Jacobs, G. (1983). The State-Trait
Anxiety Inventory for Adults. Los Angeles: Consulting Psychologists Press.
Spielberger, C. D. & Vagg, P. R. (1995). Test anxiety: Theory, assessment, and treatment.
Philadelphia, PA, Taylor & Francis.

STEREOTYPE THREAT BOUNDARIES 198
Srull, T. K. & Wyer, R. S. (1979). The role of category accessibility in the interpretation of
information about persons: Some determinants and implications. Journal of Personality
and Social Psychology, 37, 1660-1672. doi: 10.1037/0022-3514.37.10.1660
Stangor, C., Carr, C., & Kiang, L. (1998). Activating stereotypes undermines task performance
expectations. Journal of Personality and Social Psychology, 75, 1191-1197. doi:
10.1037/0022-3514.75.5.1191
Steele, C. M. (1997). A threat in the air: How stereotypes shape intellectual identity and
performance. American Psychologist, 52, 613 – 629. doi: 10.1037/0003-066X.52.6.613
Steele, C. M., & Aronson, J. (1995). Stereotype threat and the intellectual test
performance of African-Americans. Journal of Personality and Social Psychology, 69,
797-811. doi: 10.1037/0022-3514.69.5.797
Steele, C. M., & Aronson, J. (2004). Stereotype threat does not live by Steele and Aronson
(1995) alone. American Psychologist, 59, 47 – 55. doi: 10.1037/0003-066X.59.1.47
Steele, C. M. & Davies, P. G. Stereotype threat and employment testing: A commentary. Human
Performance, 16, 311-326. doi: 10.1207/S15327043HUP1603_7
Steele, C. M., Spencer, S. J., & Aronson, J. (2002). Contending with group image: the
psychology of stereotype and social identity threat. In: Zanna, M. P. (Ed.), Advances in
Experimental Social Psychology. Academic Press, San Diego, CA, pp. 379 – 440.
Stone, J. (2002). Battling doubt by avoiding practice: The effects of stereotype threat on self-
handicapping in white athletes. Personality and Social Psychology Bulletin, 28, 1667-
1678. doi: 10.1177/014616702237648

STEREOTYPE THREAT BOUNDARIES 199
Stone, J., Lynch, C. I., Sjomeling, M., & Darley, J. M. (1999). Stereotype threat effects on Black
and White athletic performance. Journal of Personality and Social Psychology, 77, 1213-
1227. doi: 10.1037/0022-3514.77.6.1213
Stricker, L. J., & Ward, W. C. (2004). Stereotype threat, inquiring about test takers’ ethnicity and
sex, and standardized test performance. Journal of Applied Social Psychology, 34, 665 –
693. doi: 10.1111/j.1559-1816.2004.tb02564.x
Stumpf, H., & Stanley, J. C. (1998). Stability and change in gender-related differences on the
college board advanced placement and achievement tests. Current Directions in
Psychological Science, 7, 192 – 196.
Tagler, M. J. (2003). Stereotype threat: Prevalence and individual differences. Unpublished
doctoral dissertation, Kansas State University.
Tedrow, L. (2009). A model of responses to race-based and gender-based stereotype threat in
computer science. Unpublished doctoral dissertation. Old Dominion University.
Thoman, D. B., White, P. H., Yamawaki, N., & Kioshi, H. (2008). Variations of gender-math
stereotype content affect women’s vulnerability to stereotype threat. Sex Roles, 58, 702-
712. doi: 10.1007/s11199-008-9390-x
Thompson, T. & Dinnel, D. L. (2007). Is self-worth protection best regarded as intentional self-
handicapping behavior or as an outcome of choking under pressure? Educational
Psychology, 27, 509-531. doi: 10.1080/01443410601159910
Trudeau, T. L. (2010). Test anxiety in high achieving students: A mixed-methods study.
Unpublished doctoral dissertation, University of Alberta.

STEREOTYPE THREAT BOUNDARIES 200
Tubbs, M. E. (1993). Commitment as a moderator of the goal-performance relation: A case for
clearer construct definition. Journal of Applied Psychology, 78, 86-97. doi:
10.1037/0021.9010.78.1.86
Tubbs, M. E., Boehne, D. M., & Dahl, J. G. (1993). Expectancy, valence, and motivational force
functions in goal-setting research: An empirical test. Journal of Applied Psychology, 78,
361-373. doi: 10.1037/0021-9010.78.3.361
Tubbs, M. E. & Trusty, M. L. (2001). Direct reports of motivation for task performance levels:
Some construct-related evidence. Journal of Psychology: Interdisciplinary and Applied,
135, 185-204. doi: 10.1080/00223980109603690
Turner, M. L., & Engle, R. W. (1989). Is working memory capacity task dependent? Journal of
Memory and Language, 28, 127 – 154. doi: 10.1016/0749-596X(89)90040-5
Vandiver, B. J., Cross, W. E., Worrell, F. C., & Fhagen-Smith, P. E. (2002). Validating the cross
racial identity scale. Journal of Counseling Psychology, 49, 71-85. doi: 10.1037/0022-
0167.49.1.71
Vroom, V. (1964). Work and motivation. New York: Wiley.
Wade, M. L. (2007). Behavioral assimilation and nested social categories: Exploring gender
stereotype priming and stereotype threat. Unpublished doctoral dissertation, Ohio State
University.
Wagner, D. T., & Petty, R. E. (1995). Flexible correction process in social judgment: The role of
naïve theories in corrections for perceived bias. Journal of Personality and Social
Psychology, 68, 38 – 51. doi: 10.1037/0022-3514.68.1.36
Walton, G. M., & Cohen, G. L. (2003). Stereotype lift. Journal of Experimental Social
Psychology, 39, 456 – 467. doi: 10.1016/S0022-1031(03)00019-2

STEREOTYPE THREAT BOUNDARIES 201
Wasserberg, M. J. (2009). Stereotype threat and the standardized testing experience of African
American children at an urban elementary school. Unpublished doctoral dissertation.
Florida International University.
Watson, J. M., Bunting, M. F., Poole, B. J., & Conway, A. R. A. (2005). Individual differences
in susceptibility to false memory in the Deese-Roediger-McDermott paradigm. Journal
of Experimental Psychology, 31, 76 – 85. doi: 10.1037/0278-7393.31.1.76
Weger, U. W., Hooper, N., Meier, B. P., & Hopthrow, T. (2012). Mindful maths: Reducing the
impact of stereotype threat through a mindfulness exercise. Consciousness and
Cognition, 21, 471-475. doi: 10.1016/j.concog.2011.10.011
Whaley, A. L. (1998). Issues of validity in empirical tests of stereotype threat theory. American
Psychologist, 53, 679-680. doi: 10.1037/0003-066X.53.6.679
Wheeler, S. C. & Petty, R. E. (2001). The effects of stereotype activation on behavior: A review
of possible mechanisms. Psychological Bulletin, 127, 797-826. doi: 10.1037/0033-
2909.127.6.797
Wicherts, J. M. & Zand Scholten, A. (2010). Test anxiety and the validity of cognitive tests: A
confirmatory analysis perspective and some empirical findings. Intelligence, 38, 169-178.
doi: 10.1016/j.intell.2009.09.008
Wigfield, A. & Eccles, J. S. (2000). Expectancy-value theory of achievement motivation.
Contemporary Educational Psychology, 25, 68-81. doi: 10.1006/ceps.1999.1015
Williams, L. J., Ford, L. R., & Nguyen, N. (2007). Basic and advanced measurement for
confirmatory factor analysis. In S. G. Rogelberg (ed.), Handbook of Research Methods
in Industrial and Organizational Psychology, Malden, MA: Blackwell Publishing Ltd.,
366-389.

STEREOTYPE THREAT BOUNDARIES 202
Wine, J. D. (1971). Investigation of an attentional interpretation of test anxiety. Unpublished
doctoral dissertation, University of Waterloo.
Wittenbrink, B., Judd, C. M., & Park, B. (1997). Evidence for racial prejudice at the implicit
level and its relationship with questionnaire measures. Journal of Personality and Social
Psychology, 77, 262-274. doi: 10.1037/0022-3514.72.2.262
Wolf, L. F. & Smith, J. K. (1995). The consequence of consequence: Motivation, anxiety, and
test performance. Applied Measurement in Education, 8, 227-242. doi:
10.1207/s15324818ame0803_3
Woolf, K., Cave, J., Greenhalgh, T., & Dacre, J. (2008). Ethnic stereotypes and the
underachievement of UK medical students from ethnic minorities: Qualitative study.
BMJ: British Medical Journal, 337, 611-617. doi: 10.1136/bmj.a1220
Wout, D. A., Shih, M. J., Jackson, J. S., & Sellers, R. M. (2009). Targets as perceivers: How
people determine when they will be negatively stereotyped. Journal of Personality and
Social Psychology, 96, 349-362. doi: 10.1037/a0023880
Yeung, N. C. J. & von Hippel, C. (2008). Stereotype threat increases the likelihood that female
drivers in a simulator run over jaywalkers. Accident Analysis and Prevention, 40, 667-
674. doi: 10.1016/j.aap.2007.09.003
Zeidner, M. (1998). Test anxiety: The state of the art. New York, NY: Plenum.