on the determinants of fiscal non-compliance: an · pdf filefiscal non-compliance: an...
TRANSCRIPT
ON THE DETERMINANTS OF FISCAL NON-COMPLIANCE: AN EMPIRICAL ANALYSIS OF SPAIN’S REGIONS.
Mar Delgado Téllez, Víctor D. Lledóand Javier J. Pérez
Documentos de Trabajo N.º 1632
2016

ON THE DETERMINANTS OF FISCAL NON-COMPLIANCE: AN EMPIRICAL
ANALYSIS OF SPAIN’S REGIONS

ON THE DETERMINANTS OF FISCAL NON-COMPLIANCE:
AN EMPIRICAL ANALYSIS OF SPAIN’S REGIONS (*)
Mar Delgado-Téllez (**) and Javier J. Pérez (**)
BANCO DE ESPAÑA
Víctor D. Lledó (**)
INTERNATIONAL MONETARY FUND
(*) The views expressed in this paper are those of the authors and do not necessarily represent the views of the Banco deEspaña, the Eurosystem or the IMF. (**) We would like to thank Tamon Asonuma, Era Dabla-Norris, Xavier Debrun, Luc Eyraud, Vitor Gaspar, Sanjeev Gupta, Carlos Mulas-Granados, Jorge Onrubia, Cathy Pattillo, Abdel Senhadji, Andrea Schaechter, Mousse Sow, and participantsat the IMF-FAD Seminar Series and the RIFDE WS on Fiscal Federalism (Santiago de Compostela, November 2016) for helpful comments and discussions. Authors’ e-mail addresses: [email protected]; [email protected]; [email protected]
Documentos de Trabajo. N.º 1632
2016

The Working Paper Series seeks to disseminate original research in economics and fi nance. All papers have been anonymously refereed. By publishing these papers, the Banco de España aims to contribute to economic analysis and, in particular, to knowledge of the Spanish economy and its international environment.
The opinions and analyses in the Working Paper Series are the responsibility of the authors and, therefore, do not necessarily coincide with those of the Banco de España or the Eurosystem.
The Banco de España disseminates its main reports and most of its publications via the Internet at the following website: http://www.bde.es.
Reproduction for educational and non-commercial purposes is permitted provided that the source is acknowledged.
© BANCO DE ESPAÑA, Madrid, 2016
ISSN: 1579-8666 (on line)

Abstract
This paper proposes an empirical framework that distinguishes between voluntary and involuntary
compliance with fiscal deficit targets on the basis of economic, institutional and political factors.
The framework is applied to Spain’s Autonomous Communities (regions) over the period
2002-2015. Fiscal non-compliance among Spain’s regions has proven persistent. It increases
with the size of growth forecasting errors and the extent to which fiscal targets are tightened,
factors not fully under the control of regional governments. Non-compliance also tends to increase
during election years, when vertical fiscal imbalances become accentuated, and market financing
costs subside. Strong fiscal rules have not shown any significant impact on containing fiscal non-
compliance. Reducing fiscal non-compliance in multi-level governance systems such as Spain’s
requires a comprehensive assessment of inter-governmental fiscal arrangements that looks
beyond rules-based frameworks by ensuring enforcement procedures are politically credible.
Keywords: fiscal compliance, rules, fiscal federalism, soft budget constraints.
JEL Classification: H61, H68, H72, H77.
Resumen
Este trabajo propone un marco analítico para analizar el grado de cumplimiento de los
objetivos presupuestarios en marcos descentralizados, considerando factores económicos e
institucionales. Este marco se aplica a las Comunidades Autónomas (CCAA) de España en el
período 2002-2015. En el trabajo se encuentra que la desviación observada del déficit público
autonómico con respecto al objetivo fijado aumenta conforme lo hace la desviación de
la previsión del crecimiento económico y cuanto más exigente es el objetivo fijado. Ambos
factores, no obstante, no se encuentran bajo el control completo de los Gobiernos
autonómicos. Los resultados apuntan a que el grado de cumplimiento tiende a verse afectado
negativamente en los años electorales, cuanto mayor es el desajuste entre ingresos y gastos
propios, o cuando el coste de financiación disminuye. Las reglas fiscales parecen no haber
tenido un impacto significativo en estos patrones. La evidencia presentada indica que la
mejora del grado de cumplimiento con respecto a los objetivos no pasa solo por reforzar el
marco de reglas vigente, sino que depende de un conjunto amplio de factores institucionales,
como el nivel de corresponsabilidad fiscal, el marco de gobernanza de la política fiscal en un
contexto de alta descentralización, o el grado de aplicación de las normas vigentes.
Palabras clave: cumplimiento de objetivos presupuestarios, reglas fiscales, federalismo fiscal,
restricción presupuestaria blanda.
Códigos JEL: H61, H68, H72, H77.
BANCO DE ESPAÑA 7 DOCUMENTO DE TRABAJO N.º 1632
1 Introduction
The process of fiscal consolidation in Europe in the aftermath of the global and Euro sovereign
debt crises has brought to the forefront the challenges of enforcing fiscal discipline in federal or
decentralized countries. The literature on fiscal federalism has attributed this challenge to the
presence of soft budget constraints at the subnational level.1 That is, the inability of subnational
governments (henceforth SNGs) to keep fiscal deficit outcomes within targets set as part of
fiscal consolidation strategies at the general government level. Soft budget constraints have
been shown to originate from the inability of central governments (hereafter CGs) to credibly
commit to not bailing out SNGs and, as such, to constrain SNGs fiscal outcomes
(Vigneault, 2007). Soft budgets have been shown to be driven by political motives, including
re-election, government formation and stability (Sato, 2007). They are aggravated by flawed
intergovernmental fiscal institutions, including large vertical fiscal imbalances, weak fiscal rules,
and limited market discipline (Rodden et al., 2003, Ter-Minassian, 2015). Flawed institutions
act by raising expectations among voters and creditors that CG must be accountable in the
event SNGs are not able to fulfill their spending mandates or debt obligations.2 Soft budget
constraints have been typically assessed by exploring the determinants of fiscal outturns using
fiscal reaction functions.3
A small but growing empirical literature on the implementation of fiscal consolidations
offers a different perspective. Rather than searching for reasons for why fiscal outcomes
cannot be constrained and targets enforced, it questions whether fiscal targets or the forecasts
basing such targets are set appropriately in the first place.4 A number of papers have shown
that official forecasts tend to be optimistic among advanced economies (Auerbach, 1999,
Strauch et al., 2009, Leal et al., 2008; Jonung and Larch, 2006; Frankel and Schreger, 2013).
Optimistic fiscal forecasts have been attributed to difficulties in forecasting downturns and
booms in real time and strategic reasons (Beetsma et al, 2013). Another set of factors are
related to strategic considerations, which have been shown to be salient in the EU among
countries seeking to comply with the Maastricht convergence process (Strauch et al., 2009)
and ex-ante deficit rules under the Stability and Growth Pact (SGP) (Bruck and Stepan, 2006
and Beestma et al., 2009).
This paper contributes to both literatures by seeking to better understand the
determinants of fiscal non-compliance at the subnational level. We define fiscal
non-compliance as events when SNG budget balance outturns are below corresponding
targets. Our focus is to understand whether fiscal non-compliance is the result of soft
budgets or due to technical and institutional factors resulting in unrealistic fiscal targets. An
emerging empirical literature has started to look at the determinants of compliance in
rule-based frameworks (Cordes et al., 2015, and Reuter, 2015). However, this literature has
mostly focused on national policies and has not discussed the institutional and political
considerations behind fiscal non-compliance.
1. See Ter-Minassian (2015) for a recent review of this vast literature.
2. Attempts to address some of the flaws in the context of the European Union (EU), in particular strengthening fiscal rules,
without addressing others (e.g., vertical fiscal imbalances) have shown to be ineffective (Foremny, 2014, Kotia and
Lledó, 2015).
3. See Argimón and Hernandez de Cos (2012) for a review of this empirical literature.
4. Reuter (2015) shows that the introduction of numerical fiscal limits enforced through fiscal rules, even if not complied
with, tilt fiscal policy outturns towards those numerical limits. So, in fact, compliance seems to matter less than whether
the chosen numerical limit was set to an optimal or appropriate level.

BANCO DE ESPAÑA 8 DOCUMENTO DE TRABAJO N.º 1632
This paper proposes a conceptual framework that tries to distinguish the impact of a
soft budget constraint from that of fiscal forecast and target setting on fiscal non-compliance.
Our framework looks at both the capacity and incentives to comply. It distinguishes between
events when SNGs have the capacity but not the incentives to comply with fiscal targets from
events when SNGs have the incentives but not the capacity for fiscal compliance. We define
fiscal non-compliance as voluntary under the former and involuntary under the latter. We argue
that voluntary fiscal non-compliance is triggered by factors conducive to soft budget
constraints, whereas involuntary fiscal non-compliance is the result of factors conducive to
unrealistic or ambitious fiscal targets.
Political economy channels and politics take a front seat in our framework. Our
framework shows that both voluntary and involuntary fiscal non-compliance occurs mainly
through political economy channels that jointly influence CGs’ and SNGs’ decisions to,
respectively, enforce and comply with fiscal targets. Channels conducive to voluntary fiscal
non-compliance act mainly by increasing CGs’ political costs of enforcing and decreasing
SNGs’ costs of non-complying with SNG targets. Channels conducive to involuntary fiscal
non-compliance are those that increase CGs’ political cost of ensuring fiscal targets at the
general government level are met, leading the CG to shift the burden of meeting these targets
to SNGs. Such costs are determined by the impact such decisions have on the electoral,
government formation, and other political objectives government officials and their parties have
at the central and subnational levels, which is ultimately framed by politics and political
institutions at the supranational, national, and regional levels.
We construct an empirical model to test this framework. From among a set of
economic, institutional, and political factors, the model identifies the ones most relevant to an
understanding of voluntary and involuntary fiscal non-compliance. The empirical model is
estimated using data from Spain’s Autonomous Communities. Spain’s Autonomous
Communities (hereafter also referred to as regions, regional governments, or simply RGs)
makes for an interesting case study for a number of reasons. Regional governments have
gained significant political and fiscal autonomy over the last four decades through a process of
decentralization (Hernández de Cos and Pérez, 2013). During this period regional governments
have become accountable for delivering more than ⅔ of social services, most in the health and
education sectors (Lledó, 2015). The Spanish decentralization has been asymmetric with
revenue and expenditure decentralization occurring at different paces depending on the region,
leading to both temporal and cross-sectional variations in both fiscal and political autonomy
indicators. Spain’s regional governments have been subject to nominal budget balance targets
for the last two decades. Their record in meeting these targets, as discussed below, has also
varied significantly. And so has the rule-based framework used to monitor and enforce
compliance with those targets. In addition to fiscal rules, regions have been subject to
market-imposed discipline, given that most regional government’s debt is regularly scrutinized
by rating agencies. In this respect, Spain is one of the major sub-sovereign bond issuer
world-wide, presenting a significant heterogeneity across regions in issuing practices and
amounts (Canuto and Liu, 2013, and Pérez and Prieto, 2015).
The post-crisis period in Spain has been marked by widespread non-compliance.
Regions as a group have missed their target systematically every year since 2010, accounting
for the bulk of the fiscal non-compliance at the general government level and constituting one
of the main risks to Spain’s on-going fiscal consolidation process (AIReF, 2016). Critical to our
analysis, fiscal non-compliance, while widespread, varied significantly across regions both in
terms of frequency and margins.

BANCO DE ESPAÑA 9 DOCUMENTO DE TRABAJO N.º 1632
Existing empirical literature has studied fiscal discipline among Spanish regions by
assessing the determinants of fiscal deficit and public debt outturns (for example, Argimón and
Hernández de Cos, 2012; and Hernández de Cos and Pérez, 2013). This literature has typically
looked at economic, institutional, and political factors affecting the size of fiscal outturns
irrespective of the targets aimed at constraining them. Critical factors promoting fiscal discipline
included greater tax autonomy, higher market-financing costs and credit ratings, and the
electoral calendar, but fiscal rules and other political factors are excluded. Fiscal indiscipline
appears to have a strong inertial component, with the size of regions’ fiscal deficits in one year
largely influenced by the corresponding size in the previous year. A related literature has also
looked at the determinants of CGs’ budgetary deviations (Leal and Perez, 2011). To our
knowledge Leal and López Laborda (2015) and Lago-Peñas et al. (2016) are the only empirical
analyses examining the regional determinants of compliance with fiscal deficit targets among
Spanish regions.
The rest of this paper is organized as follows. The next section proposes a conceptual
framework to identify economic, institutional, and political determinants of fiscal
non-compliance in multi-level governance systems. Section 3 reviews key institutional elements
in Spain’s multi-level governance system, with a focus on how fiscal targets are set, monitored,
and enforced. Informed by the framework and Spain’s institutional features, Section 4
proposes alternative hypotheses, details the empirical methodology to test these hypotheses,
and discusses our empirical results. Section 5 concludes with some policy considerations.
BANCO DE ESPAÑA 10 DOCUMENTO DE TRABAJO N.º 1632
2 Fiscal Non-Compliance in Multi-Level Governments: A Conceptual Framework
2.1 Defining Fiscal Non-Compliance
The proposed framework defines fiscal non-compliance as the outcome when a government is
unable to meet numerical fiscal targets or ceilings. The fiscal target or ceiling could be the
numerical limit of a fiscal rule. A government unable or unwilling to meet a fiscal target or ceiling
is defined as non-compliant.
Fiscal non-compliance can be voluntary or involuntary. Fiscal non-compliance is
voluntary when the non-compliant government has the capacity, but not the incentives to
comply with a fiscal target. Fiscal non-compliance is involuntary when the non-compliant
government has the incentives but not the capacity to comply with a fiscal target. A
government has the capacity to meet the target if it has sufficient fiscal resources or fiscal
instruments to garner the necessary resources to meet the target—hereafter defined as fiscal
capacity. A government has the incentives to meet the target when the costs of non-complying
with the target outweigh the non-compliance benefits.
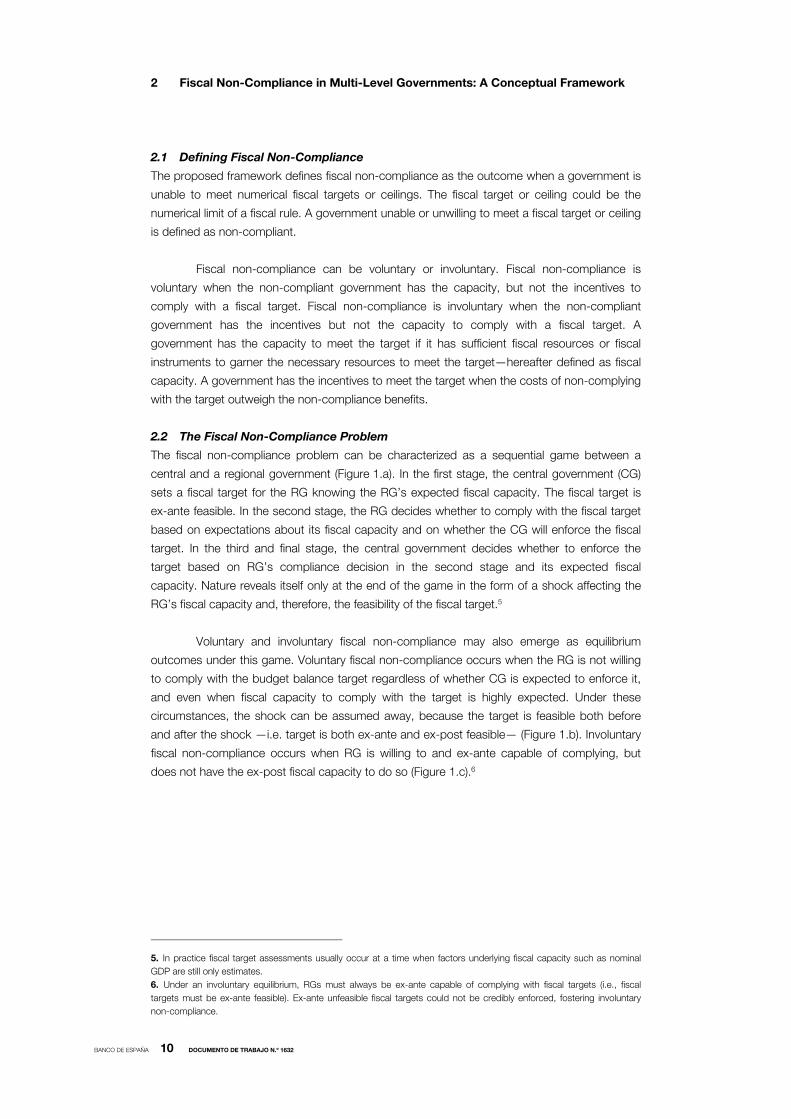
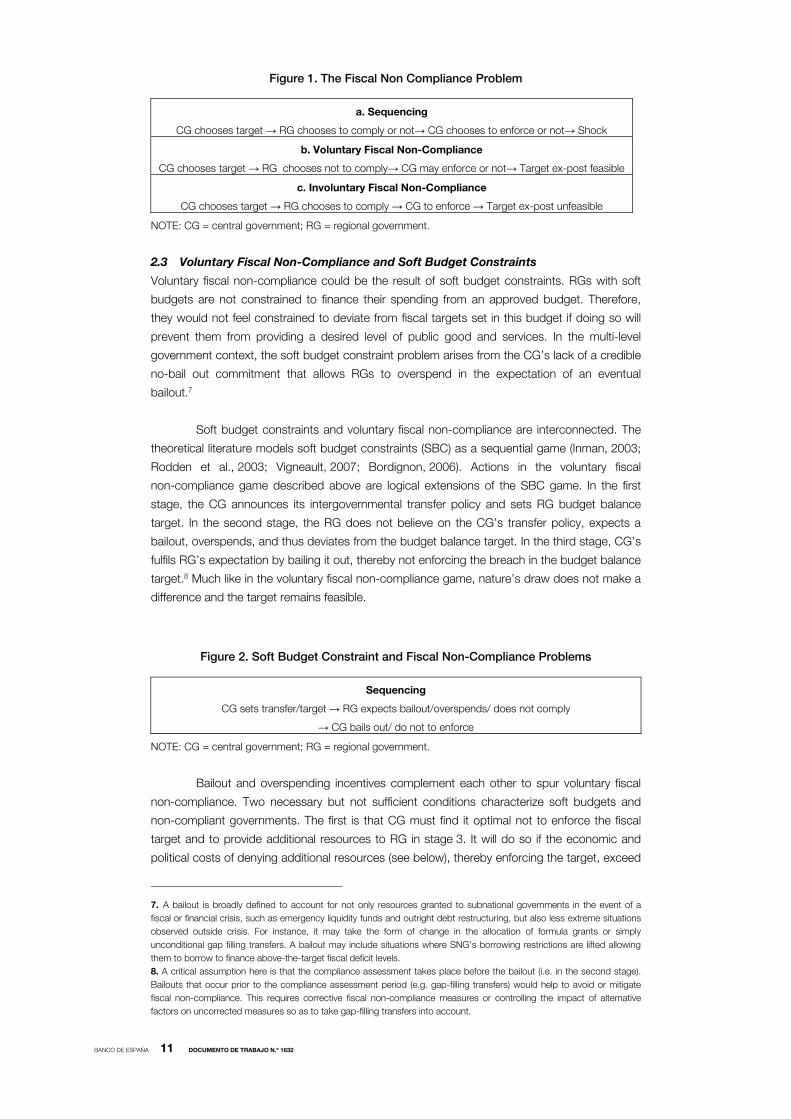
2.2 The Fiscal Non-Compliance Problem
The fiscal non-compliance problem can be characterized as a sequential game between a
central and a regional government (Figure 1.a). In the first stage, the central government (CG)
sets a fiscal target for the RG knowing the RG’s expected fiscal capacity. The fiscal target is
ex-ante feasible. In the second stage, the RG decides whether to comply with the fiscal target
based on expectations about its fiscal capacity and on whether the CG will enforce the fiscal
target. In the third and final stage, the central government decides whether to enforce the
target based on RG’s compliance decision in the second stage and its expected fiscal
capacity. Nature reveals itself only at the end of the game in the form of a shock affecting the
RG’s fiscal capacity and, therefore, the feasibility of the fiscal target.5
Voluntary and involuntary fiscal non-compliance may also emerge as equilibrium
outcomes under this game. Voluntary fiscal non-compliance occurs when the RG is not willing
to comply with the budget balance target regardless of whether CG is expected to enforce it,
and even when fiscal capacity to comply with the target is highly expected. Under these
circumstances, the shock can be assumed away, because the target is feasible both before
and after the shock —i.e. target is both ex-ante and ex-post feasible— (Figure 1.b). Involuntary
fiscal non-compliance occurs when RG is willing to and ex-ante capable of complying, but
does not have the ex-post fiscal capacity to do so (Figure 1.c).6
5. In practice fiscal target assessments usually occur at a time when factors underlying fiscal capacity such as nominal
GDP are still only estimates. 6. Under an involuntary equilibrium, RGs must always be ex-ante capable of complying with fiscal targets (i.e., fiscal
targets must be ex-ante feasible). Ex-ante unfeasible fiscal targets could not be credibly enforced, fostering involuntary
non-compliance.
BANCO DE ESPAÑA 11 DOCUMENTO DE TRABAJO N.º 1632
Figure 1. The Fiscal Non Compliance Problem
a. Sequencing
CG chooses target → RG chooses to comply or not→ CG chooses to enforce or not→ Shock
b. Voluntary Fiscal Non-Compliance
CG chooses target → RG chooses not to comply→ CG may enforce or not→ Target ex-post feasible
c. Involuntary Fiscal Non-Compliance
CG chooses target → RG chooses to comply → CG to enforce → Target ex-post unfeasible
NOTE: CG = central government; RG = regional government.
2.3 Voluntary Fiscal Non-Compliance and Soft Budget Constraints
Voluntary fiscal non-compliance could be the result of soft budget constraints. RGs with soft
budgets are not constrained to finance their spending from an approved budget. Therefore,
they would not feel constrained to deviate from fiscal targets set in this budget if doing so will
prevent them from providing a desired level of public good and services. In the multi-level
government context, the soft budget constraint problem arises from the CG’s lack of a credible
no-bail out commitment that allows RGs to overspend in the expectation of an eventual
bailout.7
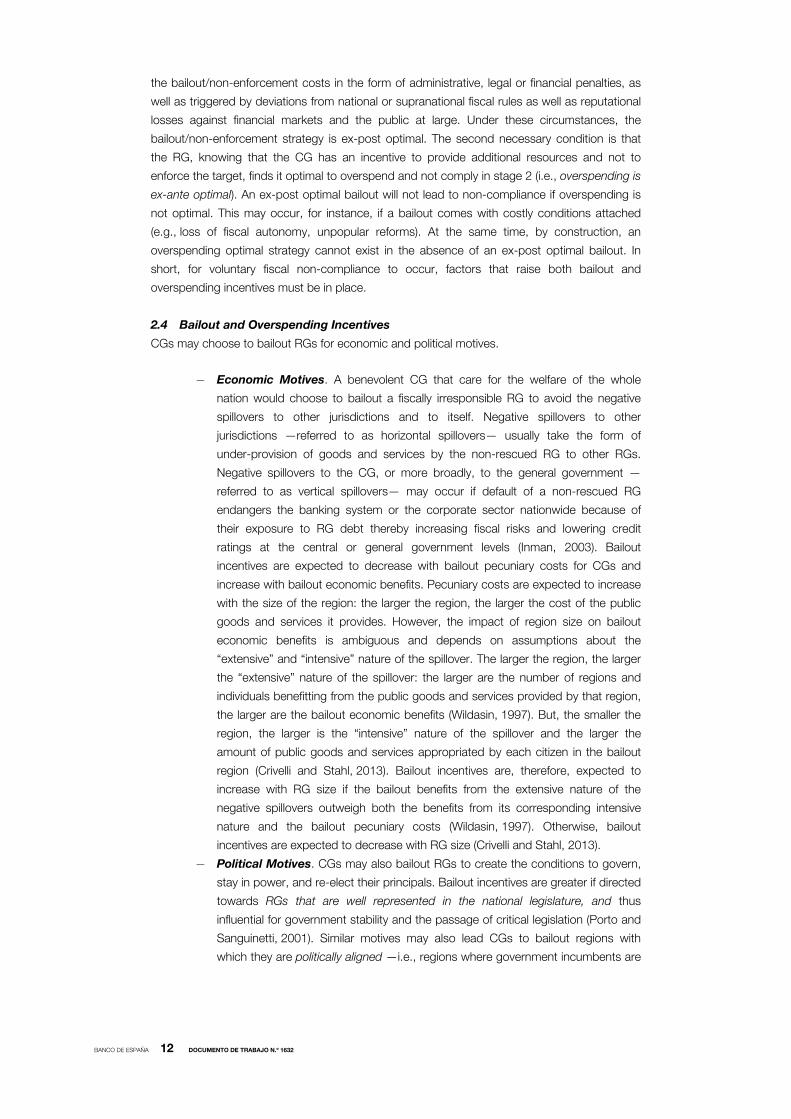
Soft budget constraints and voluntary fiscal non-compliance are interconnected. The
theoretical literature models soft budget constraints (SBC) as a sequential game (Inman, 2003;
Rodden et al., 2003; Vigneault, 2007; Bordignon, 2006). Actions in the voluntary fiscal
non-compliance game described above are logical extensions of the SBC game. In the first
stage, the CG announces its intergovernmental transfer policy and sets RG budget balance
target. In the second stage, the RG does not believe on the CG’s transfer policy, expects a
bailout, overspends, and thus deviates from the budget balance target. In the third stage, CG’s
fulfils RG’s expectation by bailing it out, thereby not enforcing the breach in the budget balance
target.8 Much like in the voluntary fiscal non-compliance game, nature’s draw does not make a
difference and the target remains feasible.
Figure 2. Soft Budget Constraint and Fiscal Non-Compliance Problems
Sequencing
CG sets transfer/target → RG expects bailout/overspends/ does not comply
→ CG bails out/ do not to enforce
NOTE: CG = central government; RG = regional government.
Bailout and overspending incentives complement each other to spur voluntary fiscal
non-compliance. Two necessary but not sufficient conditions characterize soft budgets and
non-compliant governments. The first is that CG must find it optimal not to enforce the fiscal
target and to provide additional resources to RG in stage 3. It will do so if the economic and
political costs of denying additional resources (see below), thereby enforcing the target, exceed
7. A bailout is broadly defined to account for not only resources granted to subnational governments in the event of a
fiscal or financial crisis, such as emergency liquidity funds and outright debt restructuring, but also less extreme situations
observed outside crisis. For instance, it may take the form of change in the allocation of formula grants or simply
unconditional gap filling transfers. A bailout may include situations where SNG’s borrowing restrictions are lifted allowing
them to borrow to finance above-the-target fiscal deficit levels. 8. A critical assumption here is that the compliance assessment takes place before the bailout (i.e. in the second stage).
Bailouts that occur prior to the compliance assessment period (e.g. gap-filling transfers) would help to avoid or mitigate
fiscal non-compliance. This requires corrective fiscal non-compliance measures or controlling the impact of alternative
factors on uncorrected measures so as to take gap-filling transfers into account.
BANCO DE ESPAÑA 12 DOCUMENTO DE TRABAJO N.º 1632
the bailout/non-enforcement costs in the form of administrative, legal or financial penalties, as
well as triggered by deviations from national or supranational fiscal rules as well as reputational
losses against financial markets and the public at large. Under these circumstances, the
bailout/non-enforcement strategy is ex-post optimal. The second necessary condition is that
the RG, knowing that the CG has an incentive to provide additional resources and not to
enforce the target, finds it optimal to overspend and not comply in stage 2 (i.e., overspending is
ex-ante optimal). An ex-post optimal bailout will not lead to non-compliance if overspending is
not optimal. This may occur, for instance, if a bailout comes with costly conditions attached
(e.g., loss of fiscal autonomy, unpopular reforms). At the same time, by construction, an
overspending optimal strategy cannot exist in the absence of an ex-post optimal bailout. In
short, for voluntary fiscal non-compliance to occur, factors that raise both bailout and
overspending incentives must be in place.
2.4 Bailout and Overspending Incentives
CGs may choose to bailout RGs for economic and political motives.
— Economic Motives. A benevolent CG that care for the welfare of the whole
nation would choose to bailout a fiscally irresponsible RG to avoid the negative
spillovers to other jurisdictions and to itself. Negative spillovers to other
jurisdictions —referred to as horizontal spillovers— usually take the form of
under-provision of goods and services by the non-rescued RG to other RGs.
Negative spillovers to the CG, or more broadly, to the general government —
referred to as vertical spillovers— may occur if default of a non-rescued RG
endangers the banking system or the corporate sector nationwide because of
their exposure to RG debt thereby increasing fiscal risks and lowering credit
ratings at the central or general government levels (Inman, 2003). Bailout
incentives are expected to decrease with bailout pecuniary costs for CGs and
increase with bailout economic benefits. Pecuniary costs are expected to increase
with the size of the region: the larger the region, the larger the cost of the public
goods and services it provides. However, the impact of region size on bailout
economic benefits is ambiguous and depends on assumptions about the
“extensive” and “intensive” nature of the spillover. The larger the region, the larger
the “extensive” nature of the spillover: the larger are the number of regions and
individuals benefitting from the public goods and services provided by that region,
the larger are the bailout economic benefits (Wildasin, 1997). But, the smaller the
region, the larger is the “intensive” nature of the spillover and the larger the
amount of public goods and services appropriated by each citizen in the bailout
region (Crivelli and Stahl, 2013). Bailout incentives are, therefore, expected to
increase with RG size if the bailout benefits from the extensive nature of the
negative spillovers outweigh both the benefits from its corresponding intensive
nature and the bailout pecuniary costs (Wildasin, 1997). Otherwise, bailout
incentives are expected to decrease with RG size (Crivelli and Stahl, 2013).
— Political Motives. CGs may also bailout RGs to create the conditions to govern,
stay in power, and re-elect their principals. Bailout incentives are greater if directed
towards RGs that are well represented in the national legislature, and thus
influential for government stability and the passage of critical legislation (Porto and
Sanguinetti, 2001). Similar motives may also lead CGs to bailout regions with
which they are politically aligned —i.e., regions where government incumbents are

BANCO DE ESPAÑA 13 DOCUMENTO DE TRABAJO N.º 1632
from the same party or coalition of CG incumbents (Grossman, 1994).9 The CG
may also offer bailouts to ensure national unity (Leite-Monteiro and Sato, 2003).
As a result, bailout incentives are likely to increase in regions where representation
at the national or subnational level of pro-autonomy parties is larger (Bolton and
Roland, 1997).
Flawed intergovernmental fiscal frameworks increase bailout and overspending
incentives. They do so by raising expectations among voters and creditors that the CG must be
accountable in the event RGs are not able to fulfill their spending mandates or debt obligations
(Von Hagen and Eichengreen, 1996). Mindful of the political costs of not fulfilling those
expectations, CG bailout incentives will likely increase, raising RG bailout expectations and
increasing overspending incentives. Rodden et al. (2003) and Ter-Minassian (2015) list a
number of institutional flaws that can be broadly categorized in: (i) limited fiscal autonomy; (ii)
lack of pre-conditions for market discipline; and (iii) weak administrative controls and fiscal
rules. Limited fiscal autonomy may be result of RGs limited taxing powers, spending discretion
limited by minimum service standards or revenue earmarking, overlapping and unclear revenue
or spending assignment. Insufficient fiscal autonomy is usually reflected in large gaps between
RG’s mandated spending and revenue assignments —large vertical fiscal imbalances. The
capacity of financial markets to discipline RGs is undermined by regulatory incentives and lax
prudential requirements on RG lending, RGs’ access to non-competitive financing sources (CG
on-lending, public and development banks, state-owned enterprises), and lack of transparent
and comprehensive public accounts that blur RGs’ creditworthiness. Administrative controls
such as those guiding RG borrowing are usually not based on clear and objective criteria (e.g.,
ability to service debt). Last, fiscal rules applied to RGs are often poorly designed and weakly
enforced.
Common-pool financing provides incentives for overspending. When most RG
spending is financed out of a common-pool of resources with little or few strings attached,
overspending —and by implication non-compliance— will become an attractive option. This will
be the case because RGs will bear only a fraction of the marginal costs of providing regional
goods and services (Von Hagen, 2005). Common-pool financing is usually provided in the form
of general purpose, open-ended, and equalization transfers or through debt mutualization
schemes. The literature shows that excessive dependency on such transfers to finance
subnational public goods and services exacerbates overspending.10
2.5 Involuntary Fiscal Non-Compliance and Fiscal Stress
Involuntary fiscal non-compliance may become likelier in times of fiscal stress. These are
periods marked by large negative fiscal shocks usually associated with significant economic
downturns and large fiscal adjustment efforts. In combination, both factors have been shown to
undermine RG capacity to meet fiscal targets as follows:
— Shocks and Forecast Errors. Economic shocks commonly trigger fiscal stress,
making ex-ante feasible targets ex-post unfeasible. Shocks could be
9. CG preference for bailing out politically aligned regions could also reflect electoral strategies to target safe electoral
districts, i.e., regions that had previously largely voted for and elected the CG party or governing coalition (Cox and
McCubbins, 1986). Such preferences may not necessarily prevail if CGs follows a swing strategy, whereby CG will attempt
to target regions that have previously voted for CG party or governing coalition by narrow margins (Dixit and
Londregan, 1996). In some cases, such narrow margins may have not been sufficient for CG politically affiliated regional
partners to win the election and form a government. 10. See Ter-Minassian (2015) for a recent review.

BANCO DE ESPAÑA 14 DOCUMENTO DE TRABAJO N.º 1632
region-specific (idiosyncratic shock) or they could affect the whole country
(common-shock). A common-shock can affect regions differently depending of
each region’s economic structure (e.g., a bust in housing prices would affect
regions where pre-shock median property values had been higher) or exposure to
fiscal risks (e.g., size of explicit or implicit contingent liabilities assumed by RGs on
behalf of public enterprises, or regional banks). Large shocks are usually reflected
in large forecast errors.11
— Feasible targets and adjustment plans. In times of fiscal stress, CGs, as
guardians of fiscal sustainability, are under pressure from markets and supranational
institutions to design and implement ambitious but credible fiscal adjustment plans.
Such pressure often leads to ex-ante feasible, but very demanding fiscal targets for
the general government (Beetsma et al., 2009). This is particularly the case for the
so-called Stability and Convergence Programs of Europe’s Stability and Growth
Pact (SGP). In such programs, fiscal targets need to show ex-ante compliance with
SGP fiscal rules. Ambitious but feasible general government targets in decentralized
fiscal frameworks are, in turn, often reflected in ambitious but feasible subnational
fiscal targets, as CGs try to shift part of the fiscal adjustment effort to regions by
“passing down the buck” (Vamalle et al., 2012).12 Involuntary fiscal non-compliance,
as a result, is expected to become likelier as fiscal adjustment to meet a given fiscal
target increases. RG adjustment efforts, on turn, may increase if fiscal targets are not
revised following fiscal non-compliance in a given year, leading to persistent fiscal
non-compliance patterns. Similar arguments explain why CG incentives to enforce
RGs fiscal target also increase in times of fiscal stress. Failure to do so will increase
the likelihood that general government fiscal targets will be breached and that
markets and supranational institutions will hold CG accountable for General
Government fiscal non-compliance.
11. Large forecast errors, as discussed in the introduction, could also be the result of strategic considerations to ensure
ex-ante compliance with fiscal rules. In the context of the recent global financial crisis, they have also reflected larger than
anticipated fiscal multipliers (IMF, 2015). 12. This allows CGs to minimize the political costs of fiscal consolidations by preserving the provision of public goods and
services under their mandate, while avoiding increasing the burden from their own taxes. CGs may also raise subnational
fiscal targets to build buffers for possible non-compliance at different subsectors, RGs included.
BANCO DE ESPAÑA 15 DOCUMENTO DE TRABAJO N.º 1632
3 The Spanish Fiscal Governance Framework
Numerical fiscal targets at the regional level go back more than two decades in Spain. They
have been subject to numerous changes before and after the global financial crisis:
— Budget Consolidation Scenarios and the 2002 Budget Stability Law. Regions
were first subject to budget balance limits in the form of fiscal deficits ceilings as part
of the Budget Consolidation Scenarios (BCS) agreed to with the central government
after 1992. Fiscal deficit ceilings at the regional level came into law four years later
under the 2002 Budget Stability Law (BSL). The 2002 BSL set a single zero-deficit
limit for all regions, i.e., all regions were obliged to post a budget outturn that is
either in balance or in surplus. It also envisaged an adjustment plan with corrective
actions in the event of non-compliance. Throughout this period, fiscal deficit ceilings
for each region were set in percent of national GDP.
— The 2006 Budget Stability Law. The reform of the first BSL approved in 2006
entered in force in 2007, and was implemented as a consequence of an EU-wide
reform of the SGP. The 2006 BSL enabled the CG and RGs to adapt their deficit
and surplus targets to the economy’s cyclical position. Specifically, it allowed the
RGs to run a deficit of 0.75 percent of GDP if economic growth was below a certain
threshold, to which a further 0.25 percent of GDP could be added to finance
increases in productive investment.13 Fiscal deficit ceilings were also set as a
percentage of regional rather than national GDP. The 2006 BSL included a non-bail
out clause. It also introduced monitoring and enforcement mechanisms. If a risk of
non-compliance was detected by the Ministry of Finance, a warning could be made
to the responsible government unit. In the event non-compliance materialized, the
non-compliant government was required to draw up an economic and financial
rebalancing plan over a maximum term of three years. Last, it stipulated that, if a
deviation from targets were to prompt a breach of the Stability and Growth Pact, the
tier of government involved should assume the attendant proportion of the
responsibilities that should arise from the breach. In addition, RGs that fail to meet
the deficit target would require CG authorization to initiate any debt operations.
— The 2012 Budget Stability Law. Regional fiscal targets were subject to further
refinements to comply with EU-wide fiscal governance taking place in the context
of the Six-Pack, Fiscal Compact, and Two-Pack. A constitutional reform approved
in 2011 enshrined the rules-based framework in the Constitution. A new BSL
approved in 2012 introduced structural budget balance, expenditure, and debt
rules at the regional level. The 2012 BSL refined rules-based monitoring and
enforcement mechanisms to prevent, correct, and penalize deviations from fiscal
rules and targets introduced in the 2006 BSL. Monitoring and enforcement were
also reinforced through improvements in the quality, coverage, and frequency of
intra-year regional and local budget figures and the creation in 2013 of Spain’s
independent fiscal council —Autoridad Independiente de Responsabilidad Fiscal
(AIReF). Fiscal deficit limits continued to be measured in percent of regional GDP.
13. Under the second BSL, fiscal targets were set in three stages. In the first stage, a report assessing the cyclical phase
for the following three years was prepared. Taking into account the cycle, in a second stage, fiscal targets for the general
government and subsectors (central, regional, and local governments as well as to the Social Security System) taken
together were set and submitted to Parliament. Once approved by Parliament and subject to the aggregate RG target,
individual fiscal targets for each RG were set by means of bilateral negotiations between the Ministry of Finance and
representatives of each regional government on the Fiscal and Financial Policy Council.
BANCO DE ESPAÑA 16 DOCUMENTO DE TRABAJO N.º 1632
4 Understanding Fiscal Non-Compliance among Spain’s Regions
4.1 Empirical Methodology
Alternative drivers of fiscal non-compliance among Spanish regions are assessed by looking at
non-compliance frequencies and compliance margins. To gather some stylized facts, we start
by examining non-compliance empirical distributions across a number of different potential
determinants of voluntary and involuntary fiscal non-compliance. We then perform an
econometric analysis to identify whether fiscal non-compliance is likely to be voluntary by
looking at the determinants of compliance margins. Our sample includes 16 out of 17 Spanish
regions over the period 2002-2015.14
Non-compliance events are defined as cases of negative deviations between fiscal
outturns and fiscal targets for a given region and year. That is, ∗ 0, where , ∗, i,
and t are fiscal balance outturns, fiscal balance targets, years, and regions, respectively.
Non-compliance events are sourced from the annual compliance report submitted by the
Ministry of Finance (MHAP) to the Economic and Financial Council (CPFF).15 The CPFF
comprises the Minister of Finance and public finance authorities of each region. While MHAP is
the ultimate body in charge of overseeing regional finances, the CPFF plays a formal role in the
approval of regions’ fiscal balance targets.
Non-compliance frequencies are defined in (1) as the ratio of non-compliance cases to
the total number of cases within that particularly group X. Groups are partitioned by quartiles
(q) if measured on the basis of a continuous variable.
∗ 0| 1, …4 (1)
Compliance margins, ∗ ,are measured in percent of regional GDP. Officially,
they were measured as differences between fiscal outturns and targets as a percentage of
national GDP between 2003 and 2007 and as a percentage of regional GDP from 2008 onwards.
To allow compliance margins to be compared over the years and across regions according to a
homogenous metric that at the same time reflects differences in regions’ fiscal capacities, we
have re-estimated official compliance margins in percentage of regional GDP using the latest
nominal GDP series.16 We did that in two steps: first, we uncovered nominal deficit values by
multiplying targets and outturns by the nominal GDP available around the time targets and
outturns were, respectively, set and assessed and second, we divided the difference between
nominal deficit outturns and targets by the latest nominal regional GDP series.
14. Spain has 17 regions (Comunidades Autónomas). Nevertheless, two different center-periphery financial arrangements
are in place. A majority of regions, fifteen, share the Common Regime of regional finances (Comunidades Autónomas de
Régimen Común), with partial devolution of expenditure and revenues, while the remaining two (Navarre and Basque
Country) enjoy a special status referred to as the Foral Regime of regional finances (Régimen Foral) under which they enjoy
almost full spending and revenue autonomy. Within the latter two regions, though, the Basque Country is further
decentralized, with revenue-raising responsibilities distributed to lower government levels (Diputaciones Forales) broadly
resembling the provincial structure within the region. The latter region is therefore excluded from the subsequent
econometric analysis due to the absence of comparable data. 15. Available at www.minhap.gob.es/esES/CDI/SeguimientoLeyEstabilidad/Paginas/InformesCompletosLEP.aspx. Two
annual compliance assessments have been conducted since 2013. Non-compliance events defined based on the second
and final assessment. 16. The regional GDP series used is measured in market prices and in accordance with the new European System of
National and Regional Accounts (ESA 2010).

BANCO DE ESPAÑA 17 DOCUMENTO DE TRABAJO N.º 1632
A dynamic panel regression analysis is used to look at potential determinants of
non-compliance margins. Non-compliance margins are regressed on the same variables
conditioning non-compliance frequencies. Estimates are derived using Arellano-Bond
first-difference General Method of Moments (FD-GMM) estimator in order to allow for possible
inertial patterns in non-compliance as well as endogeneity of dependent variables. Equation 2
below summarizes the specification.
(2)
where and are vectors with factors associated with involuntary and voluntary
non-compliance events (hereby referred to as voluntary and involuntary factors), respectively;
and are, respectively, country and time fixed effects, governs the degree of persistency of
RG fiscal compliance/non-compliance, and and measure the relative contribution of
involuntary and voluntary factors on fiscal compliance/non-compliance.17
Our estimation strategy aims at identifying operative economic, institutional, and
political factors associated with voluntary and involuntary patterns of fiscal non-compliance. In
light of our relatively short cross-sectional dimension, our identification strategy is implemented
in a parsimonious way by individually assessing the impact of a larger set of variables expected
to encourage voluntary fiscal non-compliance on a baseline that controls for lagged fiscal
non-compliance and the more limited number of factors associated with involuntary
compliance patterns. To address the problem of over-fitting and biased estimates in small
cross-section samples stemming from the proliferation of GMM instruments, we use only lags
t-2 and t-3 and combine our instruments into smaller sets by using the collapse option in
Roodman’s xtabond2 package for Stata. The robustness of our results are checked using
two-stage least square (2SLS) estimators.
4.2 Testable Hypotheses
The proposed multi-level governance framework developed in Section 2 can help us understand
fiscal non-compliance among Spain’s regions. It can do so by helping identify to what extent
regional fiscal non-compliance is voluntary. Voluntary fiscal non-compliance can be the result of
bailout or overspending incentives driven by welfare or political motives. The framework can also
look at the role of political, fiscal, and financial market institutions play in shaping such incentives.
Fiscal non-compliance could have also been involuntary because of common or asymmetric
shocks, and because of feasible fiscal targets and adjustment plans were borderline feasible.
Drawing from this framework and empirical analysis referenced in the previous section, Table 1
summarizes some testable hypothesis that are relevant in the Spanish context.
17. The literature suggests that fiscal deficit at the central government level can encourage deficits at the regional
government level (see Molina-Parra and Martínez-López, 2015, for the case of Spain) through so-called copycat or
yardstick effect. Nevertheless, this analysis did not find robust statistically significant evidence to support the hypothesis
that fiscal compliance at the CG level influences fiscal compliance patterns at the subnational level. The results are
excluded from the paper for the sake of simplicity.

BANCO DE ESPAÑA 18 DOCUMENTO DE TRABAJO N.º 1632
Table 1. Fiscal Non-Compliance Testable Hypotheses
4.3 Facts and Factors
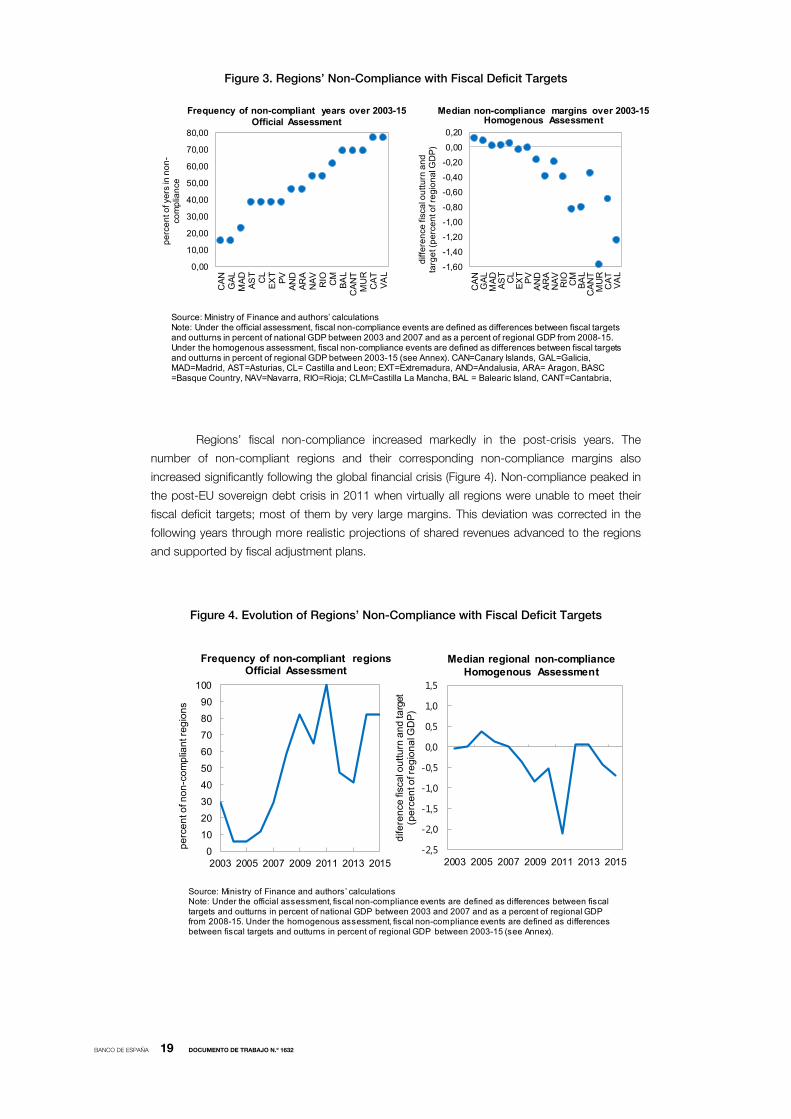
Fiscal non-compliance between 2003-15 varied markedly across regions both in terms of how
frequently regions missed the target and by how much these targets have been missed
(Figure 3). Fiscal non-compliance frequencies appear to be stratified in at least three groups:
(i) broadly compliers; (ii) broadly non-compliers; and (iii) largely non-compliers. The broadly
compliers comprise regions that have stuck to their fiscal targets in at least half of the years
during the analysis periods. This is large and heterogonous group both demographically,
economically, and historically. It includes the Canary Islands, Galicia, Madrid, Asturias, Castilla
and León, Extremadura, Andalucía, Aragón, and the Basque Country. Navarra, Rioja, Castilla la
Mancha, the Balearic Islands, Cantabria, and Murcia are among the broadly non-compliers —
regions missing their targets up to ⅔ of the years. Finally, Valencia and Catalonia have missed
their fiscal targets in three out every four years during this period. Just like the first group,
regions in the last two groups have very distinct attributes. Non-compliance frequencies and
margins appear to be broadly correlated in the sense that more frequent non-compliers tend to
breach their targets by wider margins than less frequent ones.
Channel Variable Non-compliance frequency Compliance MarginI) Voluntary
Spillovers Region size Negative/Positive Positive/Negative
Fiscal Autonomy Tax autonomy Negative PositiveExpenditure discretion Negative Positive
Market discipline Financing cost Negative PositiveAccess to soft financing Positive Negative
Fiscal Rules Fiscal rules strenght Negative Positive
Political Representation Size of paliament representation Positive Negative
Congruence of regional and national coalitions Positive Negative
Elections Election year Positive Negative
Political Autonomy Regional representation of pro-autonomy parties Positive Negative
II) Involuntary
Shocks Common/nationwide positive shocks Negative PositiveRegion-specific positive shocks Negative Positive
Fiscal target adjustment Annual changes in fiscal deficit targets Positive Negative
III) Others
Inertia Compliance of previous years ─ Positive
Note: See Annex for a detailed description of the variables.
Expected sign
BANCO DE ESPAÑA 19 DOCUMENTO DE TRABAJO N.º 1632
Figure 3. Regions’ Non-Compliance with Fiscal Deficit Targets
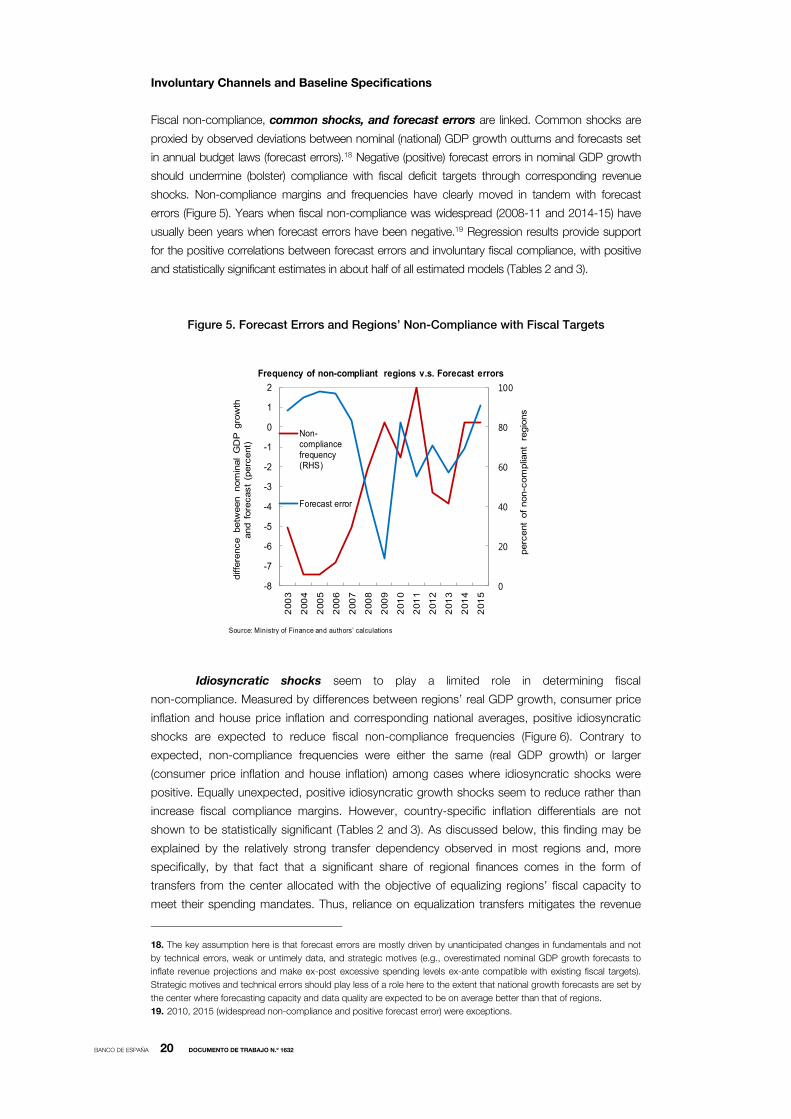
Regions’ fiscal non-compliance increased markedly in the post-crisis years. The
number of non-compliant regions and their corresponding non-compliance margins also
increased significantly following the global financial crisis (Figure 4). Non-compliance peaked in
the post-EU sovereign debt crisis in 2011 when virtually all regions were unable to meet their
fiscal deficit targets; most of them by very large margins. This deviation was corrected in the
following years through more realistic projections of shared revenues advanced to the regions
and supported by fiscal adjustment plans.
Figure 4. Evolution of Regions’ Non-Compliance with Fiscal Deficit Targets
0,00
10,00
20,00
30,00
40,00
50,00
60,00
70,00
80,00
CA
NG
AL
MA
DA
ST
CL
EX
TP
VA
ND
AR
AN
AV
RIO CM
BA
LC
AN
TM
UR
CA
TV
AL
pe
rce
nt o
f ye
rs in
no
n-
com
plia
nce
Frequency of non-compliant years over 2003-15Official Assessment
-1,60
-1,40
-1,20
-1,00
-0,80
-0,60
-0,40
-0,20
0,00
0,20
CA
NG
AL
MA
DA
ST
CL
EX
TP
VA
ND
AR
AN
AV
RIO CM
BA
LC
AN
TM
UR
CA
TV
AL
diff
ere
nce
fisc
al o
utt
urn
an
d
targ
et (
pe
rce
nt o
f re
gio
na
l GD
P)
Median non-compliance margins over 2003-15Homogenous Assessment
Source: Ministry of Finance and authors’ calculationsNote: Under the official assessment, fiscal non-compliance events are defined as differences between fiscal targets and outturns in percent of national GDP between 2003 and 2007 and as a percent of regional GDP from 2008-15. Under the homogenous assessment, fiscal non-compliance events are defined as differences between fiscal targets and outturns in percent of regional GDP between 2003-15 (see Annex). CAN=Canary Islands, GAL=Galicia, MAD=Madrid, AST=Asturias, CL= Castilla and Leon; EXT=Extremadura, AND=Andalusia, ARA= Aragon, BASC =Basque Country, NAV=Navarra, RIO=Rioja; CLM=Castilla La Mancha, BAL = Balearic Island, CANT=Cantabria,
0
10
20
30
40
50
60
70
80
90
100
2003 2005 2007 2009 2011 2013 2015
pe
rce
nt o
f no
n-c
om
plia
nt r
eg
ion
s
Source: Ministry of Finance and authors’ calculationsNote: Under the official assessment, fiscal non-compliance events are defined as differences between fiscal targets and outturns in percent of national GDP between 2003 and 2007 and as a percent of regional GDP from 2008-15. Under the homogenous assessment, fiscal non-compliance events are defined as differences between fiscal targets and outturns in percent of regional GDP between 2003-15 (see Annex).
-2,5
-2,0
-1,5
-1,0
-0,5
0,0
0,5
1,0
1,5
2003 2005 2007 2009 2011 2013 2015
dife
ren
ce fi
sca
l ou
ttu
rn a
nd
targ
et
(pe
rce
nt o
f re
gio
na
l GD
P)
Frequency of non-compliant regions Official Assessment
Median regional non-complianceHomogenous Assessment
BANCO DE ESPAÑA 20 DOCUMENTO DE TRABAJO N.º 1632
Involuntary Channels and Baseline Specifications
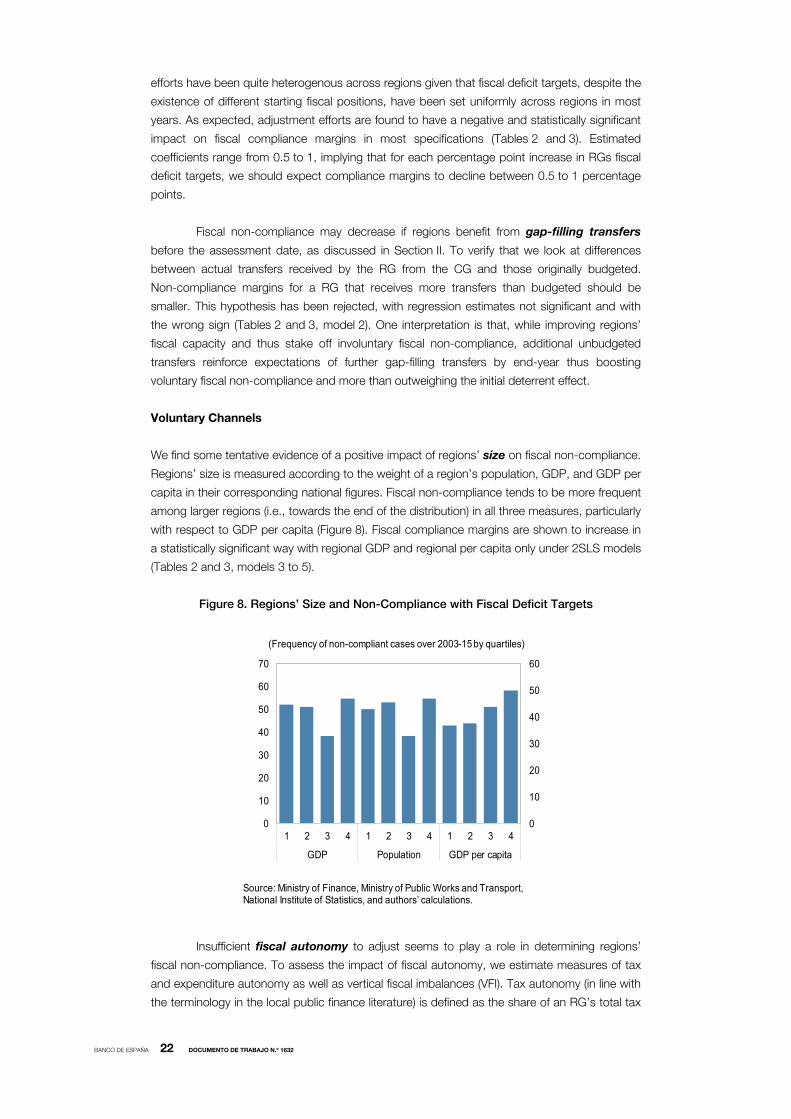
Fiscal non-compliance, common shocks, and forecast errors are linked. Common shocks are
proxied by observed deviations between nominal (national) GDP growth outturns and forecasts set
in annual budget laws (forecast errors).18 Negative (positive) forecast errors in nominal GDP growth
should undermine (bolster) compliance with fiscal deficit targets through corresponding revenue
shocks. Non-compliance margins and frequencies have clearly moved in tandem with forecast
errors (Figure 5). Years when fiscal non-compliance was widespread (2008-11 and 2014-15) have
usually been years when forecast errors have been negative.19 Regression results provide support
for the positive correlations between forecast errors and involuntary fiscal compliance, with positive
and statistically significant estimates in about half of all estimated models (Tables 2 and 3).
Figure 5. Forecast Errors and Regions’ Non-Compliance with Fiscal Targets
Idiosyncratic shocks seem to play a limited role in determining fiscal
non-compliance. Measured by differences between regions’ real GDP growth, consumer price
inflation and house price inflation and corresponding national averages, positive idiosyncratic
shocks are expected to reduce fiscal non-compliance frequencies (Figure 6). Contrary to
expected, non-compliance frequencies were either the same (real GDP growth) or larger
(consumer price inflation and house inflation) among cases where idiosyncratic shocks were
positive. Equally unexpected, positive idiosyncratic growth shocks seem to reduce rather than
increase fiscal compliance margins. However, country-specific inflation differentials are not
shown to be statistically significant (Tables 2 and 3). As discussed below, this finding may be
explained by the relatively strong transfer dependency observed in most regions and, more
specifically, by that fact that a significant share of regional finances comes in the form of
transfers from the center allocated with the objective of equalizing regions’ fiscal capacity to
meet their spending mandates. Thus, reliance on equalization transfers mitigates the revenue
18. The key assumption here is that forecast errors are mostly driven by unanticipated changes in fundamentals and not
by technical errors, weak or untimely data, and strategic motives (e.g., overestimated nominal GDP growth forecasts to
inflate revenue projections and make ex-post excessive spending levels ex-ante compatible with existing fiscal targets).
Strategic motives and technical errors should play less of a role here to the extent that national growth forecasts are set by
the center where forecasting capacity and data quality are expected to be on average better than that of regions.
19. 2010, 2015 (widespread non-compliance and positive forecast error) were exceptions.
Source: Ministry of Finance and authors’ calculations
-8
-7
-6
-5
-4
-3
-2
-1
0
1
2
0
20
40
60
80
100
200
3
200
4
200
5
200
6
200
7
200
8
200
9
201
0
201
1
201
2
201
3
201
4
201
5
diff
ere
nce betw
een nom
inal
GD
P g
row
th
and f
ore
cast
(perc
ent)
perc
ent
of
non-c
om
plia
nt
regio
ns
Non-compliancefrequency(RHS)
Forecast error
Frequency of non-compliant regions v.s. Forecast errors

BANCO DE ESPAÑA 21 DOCUMENTO DE TRABAJO N.º 1632
impact of region-specific shocks, helping regions safeguard their fiscal capacity and, therefore,
to meet their fiscal deficit targets.
Figure 6. Inertia in Regions’ Non-Compliance with Fiscal Targets, 2003–15
Figure 7. Fiscal Non-Compliance and Regions’ Idiosyncratic Exposure to Shocks
Fiscal non-compliance has displayed some inertial patterns. In line with Leal and
Lopez-Laborda (2015) and Lago Peñas et al., (2016), fiscal compliance margins appear to be
positively auto-correlated (Figure 7). As mentioned by Argimón and Hernández de Cos (2012),
this could reflect budget rigidities due to incremental budget processes or multi-year expenditure
commitments. Tables 2 and 3 confirms such inertial patterns under several specifications.
Fiscal non-compliance increases with the required adjustment effort. Adjustment
efforts is measured by differences between the fiscal deficit target in year t and t-1, both in
percentage of regional GDP, a simple proxy of the required nominal adjustment.20 Adjustment
20 Adjustment efforts could also be measured by the difference between fiscal deficit in year t and fiscal outturns in t-1.
Unlike annual changes in fiscal targets, this measure is highly correlated with lagged fiscal compliance margins and for this
reason we have opted to exclude it from our baseline specification. Replacing it with our chosen adjustment effort proxy
deliver qualitatively similar results at the expense of rendering lagged fiscal compliance margins statistically insignificant.
Source: Ministry of Finance and authors’ calculations
Note: Nominal GDP growth forecasts set in the budget law.
-8
-6
-4
-2
0
2
4
-8
-6
-4
-2
0
2
4
-8 -6 -4 -2 0 2 4 6
No
n-c
om
plia
nce
ma
rgin
Lagged non-compliance margin
Source: Ministry of Finance and authors’ calculations
0
10
20
30
40
50
60
0
10
20
30
40
50
60
Real GDP growthabove national
average
Inflation abovenational average
House inflationabove national
average
No Yes
(Frequency of non-compliant cases over 2003-15)
BANCO DE ESPAÑA 22 DOCUMENTO DE TRABAJO N.º 1632
efforts have been quite heterogenous across regions given that fiscal deficit targets, despite the
existence of different starting fiscal positions, have been set uniformly across regions in most
years. As expected, adjustment efforts are found to have a negative and statistically significant
impact on fiscal compliance margins in most specifications (Tables 2 and 3). Estimated
coefficients range from 0.5 to 1, implying that for each percentage point increase in RGs fiscal
deficit targets, we should expect compliance margins to decline between 0.5 to 1 percentage
points.
Fiscal non-compliance may decrease if regions benefit from gap-filling transfers
before the assessment date, as discussed in Section II. To verify that we look at differences
between actual transfers received by the RG from the CG and those originally budgeted.
Non-compliance margins for a RG that receives more transfers than budgeted should be
smaller. This hypothesis has been rejected, with regression estimates not significant and with
the wrong sign (Tables 2 and 3, model 2). One interpretation is that, while improving regions’
fiscal capacity and thus stake off involuntary fiscal non-compliance, additional unbudgeted
transfers reinforce expectations of further gap-filling transfers by end-year thus boosting
voluntary fiscal non-compliance and more than outweighing the initial deterrent effect.
Voluntary Channels
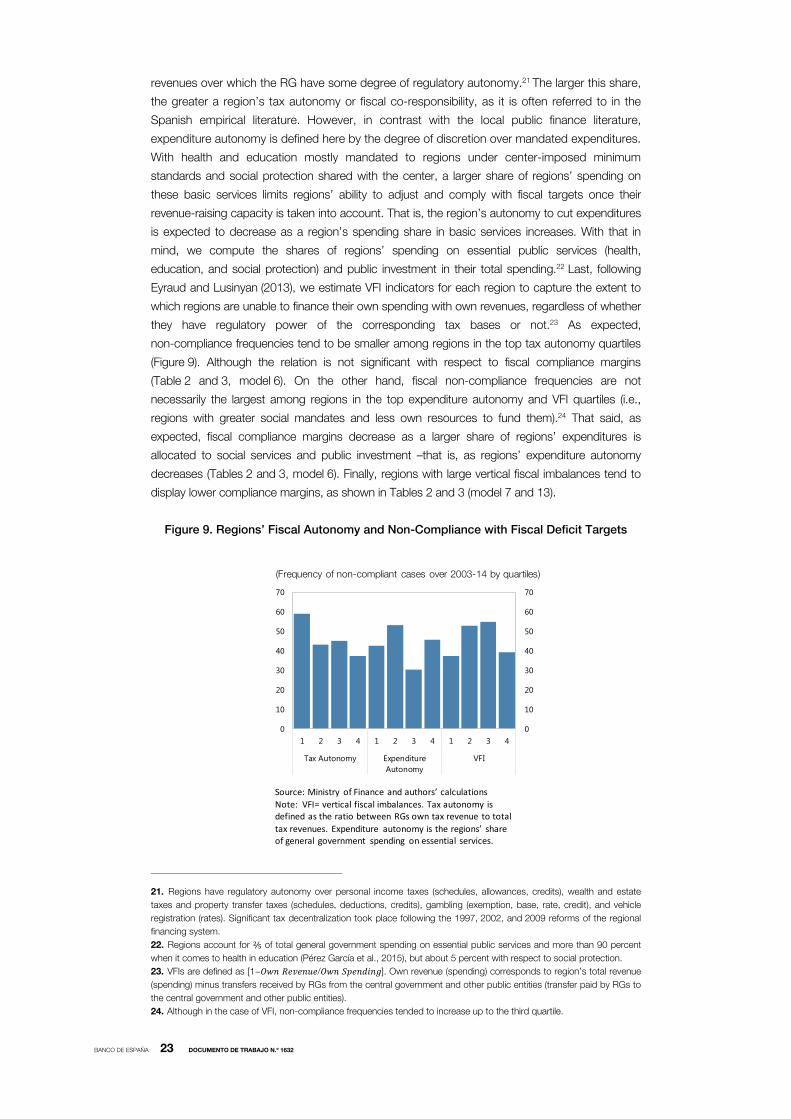
We find some tentative evidence of a positive impact of regions’ size on fiscal non-compliance.
Regions’ size is measured according to the weight of a region’s population, GDP, and GDP per
capita in their corresponding national figures. Fiscal non-compliance tends to be more frequent
among larger regions (i.e., towards the end of the distribution) in all three measures, particularly
with respect to GDP per capita (Figure 8). Fiscal compliance margins are shown to increase in
a statistically significant way with regional GDP and regional per capita only under 2SLS models
(Tables 2 and 3, models 3 to 5).
Figure 8. Regions’ Size and Non-Compliance with Fiscal Deficit Targets
Insufficient fiscal autonomy to adjust seems to play a role in determining regions’
fiscal non-compliance. To assess the impact of fiscal autonomy, we estimate measures of tax
and expenditure autonomy as well as vertical fiscal imbalances (VFI). Tax autonomy (in line with
the terminology in the local public finance literature) is defined as the share of an RG’s total tax
0
10
20
30
40
50
60
0
10
20
30
40
50
60
70
1 2 3 4 1 2 3 4 1 2 3 4
GDP Population GDP per capita
(Frequency of non-compliant cases over 2003-15 by quartiles)
Source: Ministry of Finance, Ministry of Public Works and Transport, National Institute of Statistics, and authors’ calculations.
BANCO DE ESPAÑA 23 DOCUMENTO DE TRABAJO N.º 1632
revenues over which the RG have some degree of regulatory autonomy.21 The larger this share,
the greater a region’s tax autonomy or fiscal co-responsibility, as it is often referred to in the
Spanish empirical literature. However, in contrast with the local public finance literature,
expenditure autonomy is defined here by the degree of discretion over mandated expenditures.
With health and education mostly mandated to regions under center-imposed minimum
standards and social protection shared with the center, a larger share of regions’ spending on
these basic services limits regions’ ability to adjust and comply with fiscal targets once their
revenue-raising capacity is taken into account. That is, the region’s autonomy to cut expenditures
is expected to decrease as a region’s spending share in basic services increases. With that in
mind, we compute the shares of regions’ spending on essential public services (health,
education, and social protection) and public investment in their total spending.22 Last, following
Eyraud and Lusinyan (2013), we estimate VFI indicators for each region to capture the extent to
which regions are unable to finance their own spending with own revenues, regardless of whether
they have regulatory power of the corresponding tax bases or not.23 As expected,
non-compliance frequencies tend to be smaller among regions in the top tax autonomy quartiles
(Figure 9). Although the relation is not significant with respect to fiscal compliance margins
(Table 2 and 3, model 6). On the other hand, fiscal non-compliance frequencies are not
necessarily the largest among regions in the top expenditure autonomy and VFI quartiles (i.e.,
regions with greater social mandates and less own resources to fund them).24 That said, as
expected, fiscal compliance margins decrease as a larger share of regions’ expenditures is
allocated to social services and public investment –that is, as regions’ expenditure autonomy
decreases (Tables 2 and 3, model 6). Finally, regions with large vertical fiscal imbalances tend to
display lower compliance margins, as shown in Tables 2 and 3 (model 7 and 13).
Figure 9. Regions’ Fiscal Autonomy and Non-Compliance with Fiscal Deficit Targets
21. Regions have regulatory autonomy over personal income taxes (schedules, allowances, credits), wealth and estate
taxes and property transfer taxes (schedules, deductions, credits), gambling (exemption, base, rate, credit), and vehicle
registration (rates). Significant tax decentralization took place following the 1997, 2002, and 2009 reforms of the regional
financing system. 22. Regions account for ⅖ of total general government spending on essential public services and more than 90 percent
when it comes to health in education (Pérez García et al., 2015), but about 5 percent with respect to social protection. 23. VFIs are defined as [1− / ]. Own revenue (spending) corresponds to region’s total revenue
(spending) minus transfers received by RGs from the central government and other public entities (transfer paid by RGs to
the central government and other public entities). 24. Although in the case of VFI, non-compliance frequencies tended to increase up to the third quartile.
0
10
20
30
40
50
60
70
0
10
20
30
40
50
60
70
1 2 3 4 1 2 3 4 1 2 3 4
Tax Autonomy ExpenditureAutonomy
VFI
(Frequency of non-compliant cases over 2003-14 by quartiles)
Source: Ministry of Finance and authors’ calculations
Note: VFI= vertical fiscal imbalances. Tax autonomy is defined as the ratio between RGs own tax revenue to total
tax revenues. Expenditure autonomy is the regions’ share of general government spending on essential services.

BANCO DE ESPAÑA 24 DOCUMENTO DE TRABAJO N.º 1632
The impact of stronger rules on fiscal compliance is not clear cut. As described in the
previous section, fiscal rules in Spain have become increasingly stronger over the years. They
are currently among the strictest fiscal rules in Europe, as measured by the European
Commission (EC) fiscal rule strength index. Stronger rules, however, have not always led to
improvements in fiscal compliance, partly due to delays enforcing existing monitoring and
enforcement procedures (Lledó, 2015). Our regression results seem to reinforce this point.
Under our baseline GMM specification, stronger fiscal rules do not show any direct impact on
fiscal compliance margins directly. Instead, they seem to have an indirect impact on
compliance margins by helping reduce inertial patterns (Table 2, models 8 and 9). These results
are reversed under the 2SLS specification, which show fiscal rules having a direct rather than
indirect impact on fiscal compliance margins (Table 3, models 8, 9, and 13).
Financial markets seem to affect fiscal non-compliance through two different
channels. On the one hand, fiscal non-compliance frequencies are larger among regions with
lower (poorer) credit ratings and, to some extent, facing larger market-financing costs,
which seems to provide some support to the idea that financial markets undermine fiscal
compliance by raising the financing costs of regions that are not perceived as creditworthy
(Figure 10).25 On the other, fiscal non-compliance becomes less prevalent among regions
where reliance on market-issued securities vis-à-vis softer bank loans is greater. This
finding indicates that greater market exposure helps to deter fiscal non-compliance because
regions internalize the impact fiscal non-compliance would have on credit ratings and
market-financing costs. Our regression analysis of fiscal non-compliance corroborates the latter
channel: increases in the financing costs faced by regions in the previous year leads tends to
increase rather than reduce compliance margins in the following year (Tables 2 and 3,
model 10). That said, greater reliance on market securities has no statistically or economically
significant impact on compliance margins (Tables 2 and 3, model 10).
Figure 10. Financial Markets and Regions’ Non-Compliance with Fiscal Targets
25. Although one cannot rule out the possibility of reverse causality with fiscal non-compliance leading to poorer credit
ratings, higher risk premiums, and costlier market financing.
0
10
20
30
40
50
60
70
80
1 2 3 4 1 2 3 4 1 2 3 4
Region Ratings 1/ Security to LoansRatio 2/
Implicit InterestRates 3/
(Frequency of non-compliant cases over 2003-15 by quartiles)
Source: Ministry of Finance and authors' calculations1/ regional government's credit ratings.2/ ratio of region's public debt in government securities to banking loans, percent.3/ region's interest payments in percent of end-of-year region public debt stock.
BANCO DE ESPAÑA 25 DOCUMENTO DE TRABAJO N.º 1632
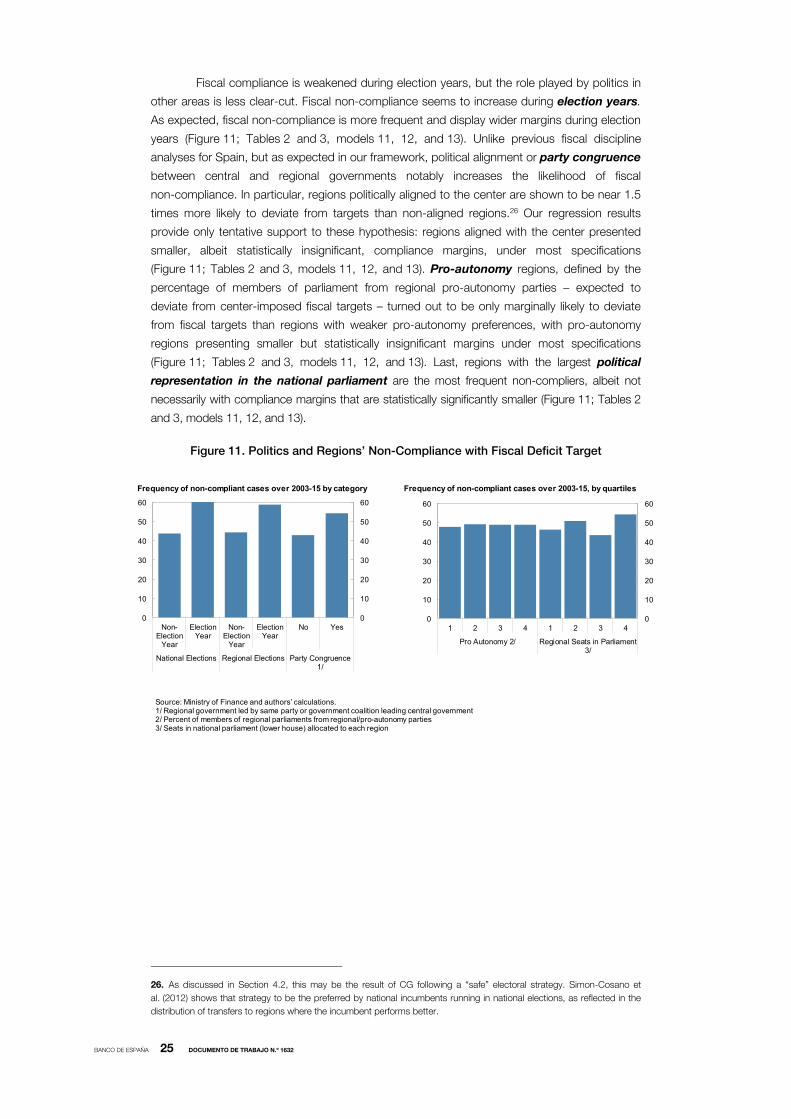
Fiscal compliance is weakened during election years, but the role played by politics in
other areas is less clear-cut. Fiscal non-compliance seems to increase during election years.
As expected, fiscal non-compliance is more frequent and display wider margins during election
years (Figure 11; Tables 2 and 3, models 11, 12, and 13). Unlike previous fiscal discipline
analyses for Spain, but as expected in our framework, political alignment or party congruence
between central and regional governments notably increases the likelihood of fiscal
non-compliance. In particular, regions politically aligned to the center are shown to be near 1.5
times more likely to deviate from targets than non-aligned regions.26 Our regression results
provide only tentative support to these hypothesis: regions aligned with the center presented
smaller, albeit statistically insignificant, compliance margins, under most specifications
(Figure 11; Tables 2 and 3, models 11, 12, and 13). Pro-autonomy regions, defined by the
percentage of members of parliament from regional pro-autonomy parties – expected to
deviate from center-imposed fiscal targets – turned out to be only marginally likely to deviate
from fiscal targets than regions with weaker pro-autonomy preferences, with pro-autonomy
regions presenting smaller but statistically insignificant margins under most specifications
(Figure 11; Tables 2 and 3, models 11, 12, and 13). Last, regions with the largest political
representation in the national parliament are the most frequent non-compliers, albeit not
necessarily with compliance margins that are statistically significantly smaller (Figure 11; Tables 2
and 3, models 11, 12, and 13).
Figure 11. Politics and Regions’ Non-Compliance with Fiscal Deficit Target
26. As discussed in Section 4.2, this may be the result of CG following a “safe” electoral strategy. Simon-Cosano et
al. (2012) shows that strategy to be the preferred by national incumbents running in national elections, as reflected in the
distribution of transfers to regions where the incumbent performs better.
Frequency of non-compliant cases over 2003-15, by quartilesFrequency of non-compliant cases over 2003-15 by category
Source: Ministry of Finance and authors’ calculations.1/ Regional government led by same party or government coalition leading central government2/ Percent of members of regional parliaments from regional/pro-autonomy parties3/ Seats in national parliament (lower house) allocated to each region
0
10
20
30
40
50
60
0
10
20
30
40
50
60
Non-Election
Year
ElectionYear
Non-Election
Year
ElectionYear
No Yes
National Elections Regional Elections Party Congruence1/
0
10
20
30
40
50
60
0
10
20
30
40
50
60
1 2 3 4 1 2 3 4
Pro Autonomy 2/ Regional Seats in Parliament3/

BANCO DE ESPAÑA 26 DOCUMENTO DE TRABAJO N.º 1632
Table 2. First-Difference GMM Estimates of Fiscal Compliance Margins
(1) (2) (3) (4) (5) (6) (7) (8) (9) (10) (11) (12) (13)Lagged non-compliance margin 0.74* 1.09** 0.76* 0.83* 0.76 0.70*** 0.37 0.91** 2.42*** 0.31* 0.73* 0.49 0.24Growth forecast errors 0.09* 0.04 0.09 0.10* 0.10* 0.12*** 0.04 0.09 0.06 0.05 0.09 0.12*** 0.04Region-National growth differential -2.09* -2.67* -2.16* -2.13 -2.00 -0.73 -0.60 -2.32* -1.82* -0.36 -2.17* -1.19 0.24Region-National inflation differential -0.36 -2.08 -0.39 -1.10 -1.28 -1.27 -2.41** -1.23 -1.68 -2.83* 0.86 -1.29 -1.19Fiscal Target Adjustment -0.80** -1.13** -0.81** -0.94** -0.85* -0.35 -0.82*** -1.02** -0.99*** -0.51*** -0.68* -0.52 -0.49Execution minus budgetary transfers (in regional GDP) -0.48Region weight in national population 3.86Region weight in national GDP 7.12Region weight in national percapita GDP 0.36Tax autonomy 0.03Social spending share in regional government spending -0.33**Investment share in total regional spending -0.24***Vertical fiscal imbalances -0.15*** -0.13**Fiscal Rule Index 0.05 0.02 0.01Fiscal Rule Index X Lagged non-compliance margin -0.06**Region RatingsLagged Annual in Change Region Ratings -0.09Lagged Annual Change in Implicit interest rates 1.03*** 0.19Ratio of security to loans 0.00National election dummy -0.60***Regional election dummy -0.36* -0.50*Party congruence dummy -0.18 0.40 -0.41***Pro-autonomy party share -0.03 0.02Regions' seats in national parliament -0.31 -0.86Number of observations 176 160 176 176 176 160 160 160 160 145 176 176 144Number of regions 16 16 16 16 16 16 16 16 16 15 16 16 16Number of instruments 16 15 16 16 16 15 15 15 15 15 17 17 14Hansen 0.60 0.80 0.44 0.87 0.66 0.28 0.37 0.82 0.65 0.14 0.68 0.15 0.05m1 0.12 0.11 0.13 0.15 0.23 0.02 0.09 0.10 0.06 0.14 0.12 0.20 0.00m2 0.39 0.61 0.43 0.49 0.42 0.48 0.61 0.66 0.77 0.16 0.28 0.22 0.67
p g
Note: Dependent variable is the difference between regions’ fiscal deficit outturns and fiscal deficit targets. The larger this difference is, the larger is the fiscal compliance margin. *, **, and *** indicate statistical
significance at the 10%, 5%, and 1% levels, respectively. Instrument set in all models includes the second and third lag of the explanatory variables. Hansen is the p-value of the test of the over-identifying restrictions (see Hansen, 1982), which is asymptotically distributed chi square under the null hypothesis that these moment conditions are valid. A p-value equal or higher than 0.05 indicates that the
instrument set is valid, which is confirmed under all models. m1 and m2 are the p-values of serial correlation tests of order 1 and 2, respectively, using residuals in first differences. The null hypothesis under
both m1 and m2 tests is that there is no correlation between variables in the instrument set and the residuals. Observed p-values higher than 0.05 under the m2 test for all models indicates that there is no correlation with the instrument set defined in second lags.
BANCO DE ESPAÑA 27 DOCUMENTO DE TRABAJO N.º 1632
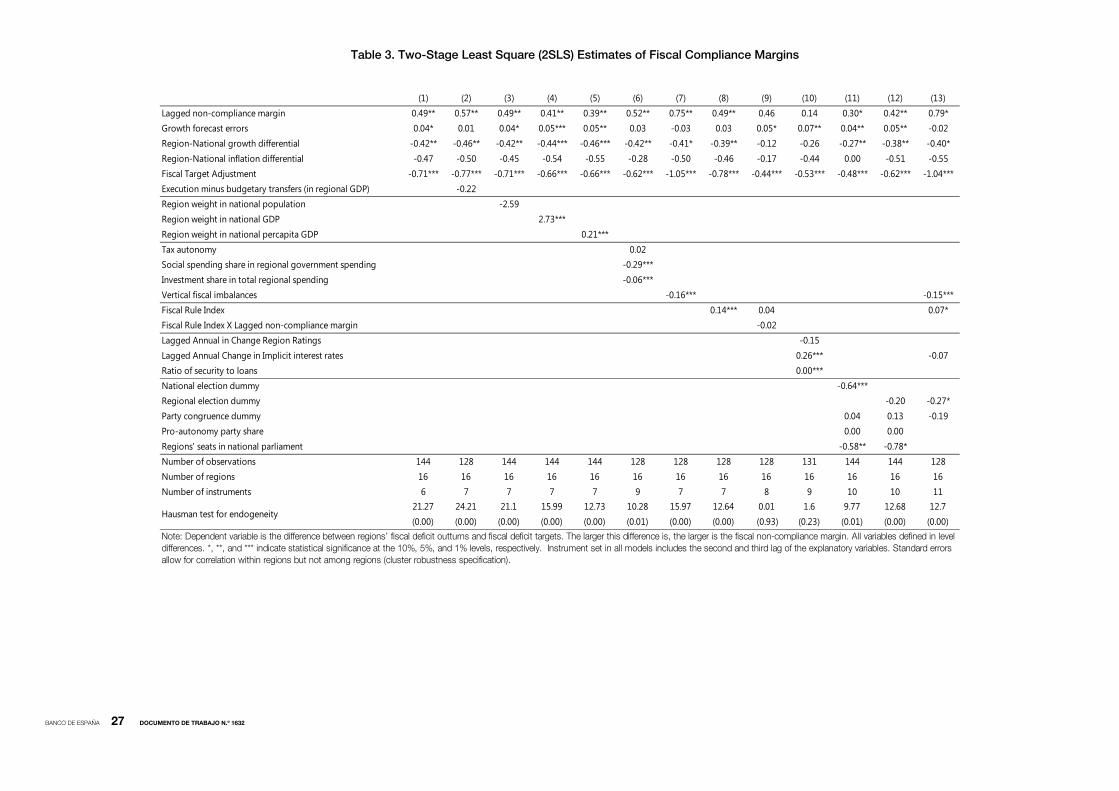
Table 3. Two-Stage Least Square (2SLS) Estimates of Fiscal Compliance Margins
(1) (2) (3) (4) (5) (6) (7) (8) (9) (10) (11) (12) (13)Lagged non-compliance margin 0.49** 0.57** 0.49** 0.41** 0.39** 0.52** 0.75** 0.49** 0.46 0.14 0.30* 0.42** 0.79*Growth forecast errors 0.04* 0.01 0.04* 0.05*** 0.05** 0.03 -0.03 0.03 0.05* 0.07** 0.04** 0.05** -0.02Region-National growth differential -0.42** -0.46** -0.42** -0.44*** -0.46*** -0.42** -0.41* -0.39** -0.12 -0.26 -0.27** -0.38** -0.40*Region-National inflation differential -0.47 -0.50 -0.45 -0.54 -0.55 -0.28 -0.50 -0.46 -0.17 -0.44 0.00 -0.51 -0.55Fiscal Target Adjustment -0.71*** -0.77*** -0.71*** -0.66*** -0.66*** -0.62*** -1.05*** -0.78*** -0.44*** -0.53*** -0.48*** -0.62*** -1.04***Execution minus budgetary transfers (in regional GDP) -0.22Region weight in national population -2.59Region weight in national GDP 2.73***Region weight in national percapita GDP 0.21***Tax autonomy 0.02Social spending share in regional government spending -0.29***Investment share in total regional spending -0.06***Vertical fiscal imbalances -0.16*** -0.15***Fiscal Rule Index 0.14*** 0.04 0.07*Fiscal Rule Index X Lagged non-compliance margin -0.02Lagged Annual in Change Region Ratings -0.15Lagged Annual Change in Implicit interest rates 0.26*** -0.07Ratio of security to loans 0.00***National election dummy -0.64***Regional election dummy -0.20 -0.27*Party congruence dummy 0.04 0.13 -0.19Pro-autonomy party share 0.00 0.00Regions' seats in national parliament -0.58** -0.78*Number of observations 144 128 144 144 144 128 128 128 128 131 144 144 128Number of regions 16 16 16 16 16 16 16 16 16 16 16 16 16Number of instruments 6 7 7 7 7 9 7 7 8 9 10 10 11
Hausman test for endogeneity21.27(0.00)
24.21(0.00)
21.1(0.00)
15.99(0.00)
12.73(0.00)
10.28(0.01)
15.97(0.00)
12.64(0.00)
0.01 (0.93)
1.6(0.23)
9.77(0.01)
12.68(0.00)
12.7(0.00)
Note: Dependent variable is the difference between regions’ fiscal deficit outturns and fiscal deficit targets. The larger this difference is, the larger is the fiscal non-compliance margin. All variables defined in level
differences. *, **, and *** indicate statistical significance at the 10%, 5%, and 1% levels, respectively. Instrument set in all models includes the second and third lag of the explanatory variables. Standard errors allow for correlation within regions but not among regions (cluster robustness specification).

BANCO DE ESPAÑA 28 DOCUMENTO DE TRABAJO N.º 1632
5 Conclusions and Policy discussion
This paper argues that in multi-level governance systems SNGs tend not to comply voluntarily
with fiscal targets the larger are their compliance costs as well as the costs the CG is expected
to incur in by enforcing these targets. It proposes a conceptual framework where these costs
can be, firstly, political and determined by factors directly undermining CGs’ condition to be
elected and form stable government coalitions (for example, national or regional electoral
calendar; RGs’ political representation, affiliation, and political autonomy preferences). Second,
compliance and enforcement costs are also linked to intergovernmental fiscal frameworks –
fiscal rules, tax and expenditure assignments, borrowing controls – and, more specifically to
how these arrangements shape perceptions among voters, creditors, and politicians of SNGs’
fiscal autonomy and whether them rather CGs should be held politically accountable for any
disruption in regions’ fiscal obligations in the event of non-compliance. Lack of fiscal autonomy
shifts political accountability to CGs –thus raising enforcement costs – while stronger rules and
access to financial markets tips the political barometer towards RGs – thus raising
non-compliance costs.
In our framework involuntary fiscal non-compliance, on turn, occurs when SNGs are
unable to be fiscally compliant even when they are willing to be. This pattern becomes more
likely in times of fiscal stress, defined as periods with large negative fiscal shocks. Fiscal stress
times are also periods of increasing (domestic or supranational) political pressures on CGs’ to
ensure fiscal consolidation targets at the general government level are met. To minimize the
political costs such pressures entail, CGs tend to “pass the buck” of the adjustment down to
RGs. This leads to ambitious but feasible center-imposed SNG fiscal targets turned unfeasible
once the fiscal shock materializes.
Applied to Spain’s regions, this conceptual framework shows that fiscal non-compliance
present involuntary traits. We find fiscal non-compliance to be driven by factors partly outside the
control of Spanish regions, namely common macroeconomic shocks and large adjustment
efforts. The latter is arguably attributable to ambitious and rigid fiscal targets set by the center as a
result of national and supranational pressures for general government consolidation referred to
above.
Fiscal non-compliance among Spain’s regions has also been shown to have a
voluntary dimension, with fiscal rather than political arrangements playing a somewhat more
prominent role. Fiscal deficit targets were missed more frequently and by wider margins the
lower a region’ s autonomy to cut spending due to expenditure mandates and the larger the
gap between the resources they can raise to deliver these mandates and their actual costs (i.e.,
the larger VFIs are). Contrary to expectations, stronger and well-enforced fiscal rules have not
made fiscal compliance more frequent or compliance margins wider. The analysis has also
identified some tentative support for the disciplinary role of financial markets, with increases in
regions’ market financing costs reducing fiscal non-compliance margins. The frequencies and
margins of fiscal non-compliance have also shown to increase during election years. Other
political factors expected to induce voluntary fiscal non-compliance such as political autonomy
preferences, political alignment with the center, and political representation demonstrate
ambiguous or non-significant regression estimates.

BANCO DE ESPAÑA 29 DOCUMENTO DE TRABAJO N.º 1632
The main policy lesson in our analysis is that enhancing fiscal compliance in multi-level
governance systems requires a more comprehensive assessment of intergovernmental fiscal
arrangements that goes beyond strengthening formal rule-monitoring and enforcement
procedures. This assessment should include not only rule-based fiscal frameworks but also (i)
the assignment of revenue-raising and spending mandates and (ii) the burden-sharing of fiscal
consolidation efforts and related setting of fiscal deficit targets. All that with a focus on making
CG enforcement politically credible. In particular,
— Rule-based frameworks. To strengthen fiscal compliance at the national level,
much emphasis has been placed on the need to bolster rule-base fiscal
frameworks with formal enforcement procedures such as financial and
administrative sanctions and automatic mechanisms that prevent correct for past
deviations from fiscal targets (Schaechter et al., 2012). That has been the case in
Spain, particularly after the most recent reforms which, as discussed, introduced
some of these procedures, aimed at tackling regional fiscal non-compliance.
Looking ahead, there is still some scope to further strengthen existing procedures
by making their activation more automatic and tightening the legal requirements to
publicly explain deviations from fiscal targets (Lledó, 2015). Such measures may
come particularly handy during election years when the political costs for the CG
in enforcing targets are more salient and non-compliance has been shown to be
more pervasive than in years with no elections.
— Intergovernmental fiscal responsibilities. In line with previous work looking at the
effectiveness of subnational fiscal rules (Kotia and Lledó, 2015), our analysis
stresses the need to revisit and, possibly reduce, existing vertical fiscal imbalances
by ensuring SNGs revenue-raising and borrowing mandates are consistent with
their spending mandates. These measures would help strengthen SNG fiscal
autonomy and policy accountability, including for fiscal deficit targets. In doing so,
it would make the enforcement of SNG fiscal deficit targets politically less costly
and more credible.
— Fiscal consolidation burden-sharing. The negative impact of increases in fiscal
targets on compliance margins warrants a review of how the burden of fiscal
consolidation is shared across and within government levels and, correspondingly,
how realistically fiscal deficit targets are set. SNG reputational costs for
non-compliance with fiscal targets that are widely perceived as unfeasible among
voters, markets, and politicians are minimal, rendering even well-designed and well-
implemented enforcement mechanisms toothless. In the case of Spain, this may call
for adoption of differentiated fiscal targets across regions to balance adjustment
needs with existing fiscal capacity. In light of the impact of negative growth shocks
on fiscal compliance, a review is also warranted of how appropriate is the technical
capacity and procedures behind the formulation of macroeconomic forecasts
informing central and subnational budgets and fiscal plans.
Two additional qualifications are worth mentioning as regards the normative proposals
outlined above, that go beyond the scope of our paper:
— First, while the adoption of differentiated fiscal targets might be efficient when
conditioning on a given fiscal starting position (that is, a given level of regional
deficit and debt), in a more general, dynamic setting, moral hazard arguments
dictate that SNGs may develop incentives not to conduct sound fiscal policies in
good times. This might be the case when SNGs anticipate that additional room for
BANCO DE ESPAÑA 30 DOCUMENTO DE TRABAJO N.º 1632
fiscal maneuver is to be granted in crisis times to those governments with weaker
initial fiscal positions. The strict implementation of fiscal rules is crucial for the
development of ex-ante fiscal margins against adverse shocks, and guarantee that
the heterogeneity of structural fiscal positions among regions in normal times is
minimized.
— Second, the international experience shows that the occurrence of subnational
fiscal crisis cannot be ruled out even in a setting in which national fiscal rules were
fully credible and intergovernmental fiscal responsibilities were set at an optimal
level. In the later regard, the recent Spanish experience indicates that granting to
regions additional instruments to prevent liquidity crisis is warranted, so that
pressure on the CG to financially support or bail-out SNGs is reduced. In
particular, the possibility of designing rainy day funds with regular contributions
during periods of economic prosperity could be studied, along with the
development of tools that guarantee the regular access of regions to financial
markets even in periods of fiscal stress (Delgado-Téllez et al., 2016).

BANCO DE ESPAÑA 31 DOCUMENTO DE TRABAJO N.º 1632
6 Annex
Table A-1. Variables Used in the Empirical Analysis
Variable Description Source
Fiscal Non-Compliance Margin (Official Assessment)Difference between fiscal deficit targets and outcomes in percent of national GDP between 2003-7 and in percent of regional GDP from 2008-15 Ministry of Finance
Fiscal Non-Compliance Margin (Homogenous Assessment)
Difference between fiscal deficit targets (homogenous assessement) and outcomes in percent of regional GDP Authors' own calculation
Fiscal deficit targets (Homogenous Assessment)
Equal to (Fiscal deficit targets (official assessment) X Nominal GDP (CG budget))/Regional GDP between 2003-07 and to fiscal deficit target (official assessement) from 2008-15
Authors' own calculation, Ministry of Finance (Nominal and Regional GDP)
Growth Forecast ErrorsReal GDP growth outturn - Real GDP forecast
National Institute of Statistics (outturn), Ministry of Finance (forecast)
Region-National growth differential Regional GDP growth - National GDP growth National Institute of Statistics
Region-National inflation differential Percent change in regional CPI growth - Percent change in national CPI National Institute of Statistics
Fiscal Target Adjustment Difference between fiscal defict target (homogenous assessement) in the current and previous year
Authors' own calculation
Execution minus budgetary transfers (in regional GDP)Transfers from CG (outturns) - Transfers from CG (budget) Ministry of Finance and National
Institute of Statistics
Region weight in national population Ratio of regional to national population National Institute of Statistics
Region weight in national GDP Ratio of regional to national GDP National Institute of Statistics
Region weight in national percapita GDP Ratio of regional to national percapita GDP National Institute of Statistics
Tax Autonomy Ratio of regional own revenues (regulatory power) to total regional revenuesAuthors' own calculation and Ministry of Finance
Social spending share in regional government spendingRatio of regional spending in basic social services (health education and others) to total regional spending.
IVIE and Ministry of Finance
Investment share in total regional spending Ratio of regional investment to total regional spending Ministry of Finance
Vertical fiscal imbalances
[1 - Regional Own Revenues/Regional Own Spending], where own regional revenue (spending) corresponds to a region's total revenue (spending) minus transfers received by the CG and other public entitites (transfer paid to the CG and other public entitites)
Authors' own calculation
Fiscal Rule Index Numerical fiscal rule strengthen index European Commission
Fiscal Rule Index X Lagged non-compliance margin Interactions between the lag of non-compliance margin and the Fiscal rule index Authors' own calculation
Region RatingsAverage rating numerical index, taking into account three rating agencies: Fitch, S&P and Moody's
Authors' own calculation using Fitch, S&P, and Moody's databases.
Implicit interest rates Regional interest payments in percent of end-of-year regional public debt stock Ministry of Finance
Ratio of security to loansRatio of total outstanding government securities issued by the regions to outstanding loans from commercial banks
Bank of Spain
National election dummy Dummy that equals 1 for the year of national parliament elections.Webpages of the national and regional parliaments.
Regional election dummy Dummy that equals 1 the year of regional parliament elections.Webpages of the national and regional parliaments.
Party congruence dummyDummy that equals 1 if regional and national government led by same party or party coalition
Webpages of the national and regional parliaments.
Pro-autonomy party share Percent of members of regional parliaments from regional/pro-autonomy partiesWebpages of the national and regional parliaments.
Regions' seats in national parliament Share of members of the national parliament elected in each regionWebpages of the national and regional parliaments.
BANCO DE ESPAÑA 32 DOCUMENTO DE TRABAJO N.º 1632
REFERENCES
AUERBACH, A., (1999). “On the Performance and Use of Government Revenue Forecasts”, National Tax Journal, Vol. 52,
No. 4, pp. 765–782.
ARGIMÓN, I., and P. HERNÁNDEZ DE COS (2012). “Fiscal Rules and Federalism as Determinants of Budget
Performance: An Empirical Investigation for the Spanish Case”, Public Finance Review, Vol. 40, No. 1, pp 30-65.
AUTORIDAD INDEPENDIENTE DE RESPONSABILIDAD FISCAL (AIReF). 2016. Informe sobre los Presupuestos iniciales
de las Administraciones Públicas para 2016, April 2016,
BEETSMA, R., M. GIULIODORI, and P. WIERTS (2009). “Planning to Cheat: EU Fiscal Policy in Real Time”, Economic
Policy, Issue 60, pp. 753–804.
BEETSMA, R., B. BLUHM, M. GIULIODORI, and P. WIERTS (2013). “From Budgetary Forecasts to Ex-Post Fiscal Data:
Exploring the Evolution of Fiscal Forecast Errors in the EU”, Contemporary Economic Policy, Vol. 31, No.4, pp. 795–813.
BOLTON, P., and G. ROLAND (1997). “The Breakup of Nations”, Quarterly Journal of Economics, Vol. 11, No.4, pp.
1057–89.
BORDIGNON, M., (2006). ‘”Fiscal Decentralization: How to Harden the Budget Constraint”, in Wierts, P., S. Deroose, E.
Flores and A. Turini, eds, Fiscal Policy Surveillance in Europe, Basingstoke: Palgrave Macmillan.
BRUCK, T., and A. STEPHAN (2006). “Do Eurozone Countries Cheat with their Budget Deficit Forecasts?”, Kyklos, Vol.
59, pp 3–15.
CANUTO, O., and L. LIU, eds, (2013). “Until Debt Do Us Part: Subnational Debt, Insolvency, and Markets”, Washington,
DC: International Bank for reconstruction and Development, The World Bank.
CORDES, T., T. KINDA, P. MUTHOORA, and A. WEBER (2015). “Expenditure Rules: Effective Tools for Sound Fiscal
Policy,” IMF Working Paper 15/2 (Washington: IMF).
COX, G., and M. MCCUBBINS (1986). “Electoral politics as a redistributive game”, The Journal of Politics, Vol. 48, pp.
370-389.
CRIVELLI, E., and K. STAAL (2013). “Size, spillovers, and soft budget constraints”, International Tax and Public Finance,
Vol. 20, No. 2, pp. 338–356.
DELGADO-TELLEZ, M., C. I. GONZÁLEZ and J. J. PÉREZ (2016). “Regional government access to market funding:
international experience and recent developments”, Bank of Spain Economic Bulletin, February 2016.
DIXIT, A.K., and L. LONDREGRAN (1996). “The Determinant of Success of Special Interests in Redistributive Politics”, The
Journal of Politics, Vol. 58, No. 4, pp. 1132–55.
FOREMNY, D., (2014). “Subnational Deficits in European Countries: The Impact of Fiscal Rules and Tax Autonomy”,
European Journal of Political Economy, Vol. 34, pp. 86–110.
FRANKEL, J., and J. SCHREGER (2013). “Over-Optimistic Official Forecasts and Fiscal Rules in the Eurozone”, Review of
World Economics, Vol.149, pp. 247-272.
GROSSMAN, P., (1994). “A Political Economy of Intergovernmental Grants”, Public Choice, Vol. 78, No. 3–4, pp. 295–303.
HANSEN, L., (1982). “Large Sample Properties of Generalized Method of Moments Estimators”, Econometrica, Volume
50, Issue 4, pp 1029-1054.
HERNÁNDEZ DE COS, P., and J. PÉREZ (2013). “Sub-National Public Debt in Spain: Political Economy Issues and the
Role of Fiscal Rules and Decentralization”, pp. 188-216 in Fiscal Relations across Government Levels in Times of
Crisis—Making Compatible Fiscal Decentralization and Budgetary Discipline, European Commission Economics
Papers, 501, pp. 186–216.
INMAN, R., (2003). “Transfers and Bailouts: Enforcing Local Fiscal Discipline with Lessons from U. S. Federalism”, In Fiscal
Decentralization and the Challenge of Hard Budget Constraints, J. Rodden, Eskelund, G. and Litvack, J., eds, pp. 35–
83. Cambridge, MA: MIT Press.
INTERNATIONAL MONETARY FUND (2015). Crisis Program Review, IMF Policy Paper, November 9, 2015.
JONUNG, L., and M. LARCH (2006). “Improving Fiscal Policy in the EU: The Case for Independent Forecasts”, Economic
Policy, Vol. 21, pp. 491–534.
KOTIA, A., and V. LLEDÓ (2016). “Do Subnational Fiscal Rules Foster Fiscal Discipline? New Evidence from Europe”, IMF
Working Paper 16/84, (Washington: IMF).
LAGO PEÑAS, S., X. FERNÁNDEZ-LEICEAGA, and A. VAQUERO (2016). “¿Por qué incumplen fiscalmente las CCAA?”,
FUNCAS, Documento de Trabajo Nº 784/2016.
LEAL, M.A., and J. LÓPEZ LABORDA (2015). “Un Estudio de los Factores Determinantes de las Desviaciones Presupuestarias
de las Comunidades Autónomas en el Periodo 2003-2012”, Investigaciones Regionales, Vol.31, pp. 35-58.
LEAL, T., and J. J. PÉREZ (2011). “Análisis de las desviaciones presupuestarias aplicado al caso del presupuesto del
Estado”, Estudios de Economía Aplicada, Vol. 29, pp. 909-932.
LEAL, T., J. J. PÉREZ, M. TUJULA and J.-P. VIDAL (2008). “Fiscal forecasting: lessons from the literature and challenges”,
Fiscal Studies, 29, pp. 347-386.
LEITE-MONTEIRO, M., and M. SATO (2003). “Economic Integration and Fiscal Devolution”, Journal of Public Economics,
Vol. 87, No. 11, pp. 2507–25.
LLEDÓ, V., (2015). “Coordinating Fiscal Consolidation in Spain: Progress, Challenges, and Prospects”, in IMF (ed), Spain
Selected Issues, IMF Country Report No. 15/233, (Washington: IMF).
MOLINA-PARRA, A., and D. MARTÍNEZ-LÓPEZ (2016). “Do federal deficits motivate regional fiscal (im)balances? Evidence
from the Spanish case”, GEN Working Paper A 2015-3, (Santiago de Compostela: University of Vigo).
PÉREZ GARCÍA, F., V. CUCARELLA, and L. HÉRNANDEZ (2015). “Servicios Públicos, Diferencias Territoriales e Igualdad
de Oportunidades,” (Bilbao: Fundación BBVA).
PÉREZ, J. J., and R. PRIETO (2015). “Risk factors and the maturity of subnational debt: an empirical investigation for the
case of Spain”, Public Finance Review, 43, pp. 786-815.

BANCO DE ESPAÑA 33 DOCUMENTO DE TRABAJO N.º 1632
PORTO, A., and P. SANGUINETTI (2001). “Political Determinants of Intergovernmental Grants: Evidence from Argentina.”
Economics and Politics, Vol. 13, No. 3, pp. 237–56.
REUTER, W., (2015). “National numerical fiscal rules: Not complied with, but Still Effective?” European Journal of Political
Economy, Vol. 39, pp. 67-81.
RODDEN, J., G. ESKELUND, and J. LITVACK (2003). “Introduction and Overview” in Rodden, J., G. Eskelund. G., and J.
Litvack, eds, Fiscal Decentralization and the Challenge of Hard Budget Constraints, ed. 1–31. (Cambridge: MIT Press).
SATO, M., “The Political Economy of Interregional Grants.” In Robin Boadway and Anwar Shah (eds), Intergovernmental
Fiscal Transfers: Principles and Practice, 173-201, (Washington: World Bank).
SCHAECHTER, A., T. KINDA, N. BUDINA and A. WEBER (2012). “Fiscal Rules in Response to the Crisis—Toward the
“Next-Generation” Rules. A New Dataset”, IMF Working Paper, WP/12/187 (Washington: International Monetary Fund).
STRAUCH, R., M and J.VON HAGEN (2009). “How Forms of Fiscal Governance Affect Fiscal Performance. In M.
Hallerberg, S. Rolf, and J. von Hagen (Eds.), Fiscal governance in Europe, (Cambridge: Cambridge University Press).
SIMON-COSANO, P., S. LAGO-PEÑAS and A. VAQUERO (2012). “On the political determinants of Intergovernmental
grants in decentralized countries: the case of Spain”, International Center for Public Policy Working Paper 12-30.
TER-MINASSIAN, T., (2015). “Promoting Responsible and Sustainable Fiscal Decentralization”, in Ahmad, E. and G.
Brosio, eds., Handbook of Multi-level Finance, (Cheltenham: Edward Elgar Publishing).
VAMMALLE, C., D. ALLAIN-DUPRE, and N. GAILLARD (2012). “A Sub-Central Government Perspective on Fiscal Policy in a
Tight Fiscal Environment”, Chapter 1 in Institutional and Financial Relations across Levels of Government, OECD Fiscal
Federalism Studies, Kim, J. and C. Vamalle, eds, pp. 17-44, (Paris: OECD/Korea Institute of Public Finance (KIPF)).
VIGNEAULT, M., (2007). “Grants and Soft Budget Constraints”, in R. Boadway, and Shah, A., eds, Intergovernmental
Fiscal Transfers: Principles and Practice, Washington, DC: World Bank
VON HAGEN, J., (2005). “Political economy of fiscal institutions”, in Barry, D.A. and R. Weingast, Oxford Handbook on
Political Economy (pp. 464–478). Oxford: Oxford University Press.
VON HAGEN, J., and B. EICHENGREEN (1996). “Federalism, fiscal restraints, and European monetary union”, American
Economic Review, 2:134-38.
WILDASIN, D., (1997). “Externalities and Bailouts: Hard and Soft Budget Constraints in Intergovernmental Fiscal
Relations”, Policy Research Working Paper, 1843, World Bank.
BANCO DE ESPAÑA PUBLICATIONS
WORKING PAPERS
1514 ALFREDO IBÁÑEZ: Default near-the-default-point: the value of and the distance to default.
1515 IVÁN KATARYNIUK and JAVIER VALLÉS: Fiscal consolidation after the Great Recession: the role of composition.
1516 PABLO HERNÁNDEZ DE COS and ENRIQUE MORAL-BENITO: On the predictability of narrative fi scal adjustments.
1517 GALO NUÑO and CARLOS THOMAS: Monetary policy and sovereign debt vulnerability.
1518 CRISTIANA BELU MANESCU and GALO NUÑO: Quantitative effects of the shale oil revolution.
1519 YAEL V. HOCHBERG, CARLOS J. SERRANO and ROSEMARIE H. ZIEDONIS: Patent collateral, investor commitment
and the market for venture lending.
1520 TRINO-MANUEL ÑÍGUEZ, IVAN PAYA, DAVID PEEL and JAVIER PEROTE: Higher-order risk preferences, constant
relative risk aversion and the optimal portfolio allocation.
1521 LILIANA ROJAS-SUÁREZ and JOSÉ MARÍA SERENA: Changes in funding patterns by Latin American banking systems:
how large? how risky?
1522 JUAN F. JIMENO: Long-lasting consequences of the European crisis.
1523 MAXIMO CAMACHO, DANILO LEIVA-LEON and GABRIEL PEREZ-QUIROS: Country shocks, monetary policy
expectations and ECB decisions. A dynamic non-linear approach.
1524 JOSÉ MARÍA SERENA GARRALDA and GARIMA VASISHTHA: What drives bank-intermediated trade fi nance?
Evidence from cross-country analysis.
1525 GABRIELE FIORENTINI, ALESSANDRO GALESI and ENRIQUE SENTANA: Fast ML estimation of dynamic bifactor
models: an application to European infl ation.
1526 YUNUS AKSOY and HENRIQUE S. BASSO: Securitization and asset prices.
1527 MARÍA DOLORES GADEA, ANA GÓMEZ-LOSCOS and GABRIEL PEREZ-QUIROS: The Great Moderation in historical
perspective. Is it that great?
1528 YUNUS AKSOY, HENRIQUE S. BASSO, RON P. SMITH and TOBIAS GRASL: Demographic structure and
macroeconomic trends.
1529 JOSÉ MARÍA CASADO, CRISTINA FERNÁNDEZ and JUAN F. JIMENO: Worker fl ows in the European Union during
the Great Recession.
1530 CRISTINA FERNÁNDEZ and PILAR GARCÍA PEREA: The impact of the euro on euro area GDP per capita.
1531 IRMA ALONSO ÁLVAREZ: Institutional drivers of capital fl ows.
1532 PAUL EHLING, MICHAEL GALLMEYER, CHRISTIAN HEYERDAHL-LARSEN and PHILIPP ILLEDITSCH: Disagreement
about infl ation and the yield curve.
1533 GALO NUÑO and BENJAMIN MOLL: Controlling a distribution of heterogeneous agents.
1534 TITO BOERI and JUAN F. JIMENO: The unbearable divergence of unemployment in Europe.
1535 OLYMPIA BOVER: Measuring expectations from household surveys: new results on subjective probabilities of future
house prices.
1536 CRISTINA FERNÁNDEZ, AITOR LACUESTA, JOSÉ MANUEL MONTERO and ALBERTO URTASUN: Heterogeneity
of markups at the fi rm level and changes during the great recession: the case of Spain.
1537 MIGUEL SARMIENTO and JORGE E. GALÁN: The infl uence of risk-taking on bank effi ciency: evidence from Colombia.
1538 ISABEL ARGIMÓN, MICHEL DIETSCH and ÁNGEL ESTRADA: Prudential fi lters, portfolio composition and capital ratios
in European banks.
1539 MARIA M. CAMPOS, DOMENICO DEPALO, EVANGELIA PAPAPETROU, JAVIER J. PÉREZ and ROBERTO RAMOS:
Understanding the public sector pay gap.
1540 ÓSCAR ARCE, SAMUEL HURTADO and CARLOS THOMAS: Policy spillovers and synergies in a monetary union.
1601 CHRISTIAN CASTRO, ÁNGEL ESTRADA and JORGE MARTÍNEZ: The countercyclical capital buffer in Spain:
an analysis of key guiding indicators.
1602 TRINO-MANUEL ÑÍGUEZ and JAVIER PEROTE: Multivariate moments expansion density: application of the dynamic
equicorrelation model.
1603 ALBERTO FUERTES and JOSÉ MARÍA SERENA: How fi rms borrow in international bond markets: securities regulation
and market segmentation.

1604 ENRIQUE ALBEROLA, IVÁN KATARYNIUK, ÁNGEL MELGUIZO and RENÉ OROZCO: Fiscal policy and the cycle
in Latin America: the role of fi nancing conditions and fi scal rules.
1605 ANA LAMO, ENRIQUE MORAL-BENITO and JAVIER J. PÉREZ: Does slack infl uence public and private labour
market interactions?
1606 FRUCTUOSO BORRALLO, IGNACIO HERNANDO and JAVIER VALLÉS: The effects of US unconventional monetary
policies in Latin America.
1607 VINCENZO MERELLA and DANIEL SANTABÁRBARA: Do the rich (really) consume higher-quality goods? Evidence from
international trade data.
1608 CARMEN BROTO and MATÍAS LAMAS: Measuring market liquidity in US fi xed income markets: a new synthetic
indicator.
1609 MANUEL GARCÍA-SANTANA, ENRIQUE MORAL-BENITO, JOSEP PIJOAN-MAS and ROBERTO RAMOS: Growing like
Spain: 1995-2007.
1610 MIGUEL GARCÍA-POSADA and RAQUEL VEGAS: Las reformas de la Ley Concursal durante la Gran Recesión.
1611 LUNA AZAHARA ROMO GONZÁLEZ: The drivers of European banks’ US dollar debt issuance: opportunistic funding
in times of crisis?
1612 CELESTINO GIRÓN, MARTA MORANO, ENRIQUE M. QUILIS, DANIEL SANTABÁRBARA and CARLOS TORREGROSA:
Modelling interest payments for macroeconomic assessment.
1613 ENRIQUE MORAL-BENITO: Growing by learning: fi rm-level evidence on the size-productivity nexus.
1614 JAIME MARTÍNEZ-MARTÍN: Breaking down world trade elasticities: a panel ECM approach.
1615 ALESSANDRO GALESI and OMAR RACHEDI: Structural transformation, services deepening, and the transmission
of monetary policy.
1616 BING XU, ADRIAN VAN RIXTEL and HONGLIN WANG: Do banks extract informational rents through collateral?
1617 MIHÁLY TAMÁS BORSI: Credit contractions and unemployment.
1618 MIHÁLY TAMÁS BORSI: Fiscal multipliers across the credit cycle.
1619 GABRIELE FIORENTINI, ALESSANDRO GALESI and ENRIQUE SENTANA: A spectral EM algorithm for dynamic
factor models.
1620 FRANCISCO MARTÍ and JAVIER J. PÉREZ: Spanish public fi nances through the fi nancial crisis.
1621 ADRIAN VAN RIXTEL, LUNA ROMO GONZÁLEZ and JING YANG: The determinants of long-term debt issuance by
European banks: evidence of two crises.
1622 JAVIER ANDRÉS, ÓSCAR ARCE and CARLOS THOMAS: When fi scal consolidation meets private deleveraging.
1623 CARLOS SANZ: The effect of electoral systems on voter turnout: evidence from a natural experiment.
1624 GALO NUÑO and CARLOS THOMAS: Optimal monetary policy with heterogeneous agents.
1625 MARÍA DOLORES GADEA, ANA GÓMEZ-LOSCOS and ANTONIO MONTAÑÉS: Oil price and economic growth:
a long story?
1626 PAUL DE GRAUWE and EDDIE GERBA: Stock market cycles and supply side dynamics: two worlds, one vision?
1627 RICARDO GIMENO and EVA ORTEGA: The evolution of infl ation expectations in euro area markets.
1628 SUSANA PÁRRAGA RODRÍGUEZ: The dynamic effect of public expenditure shocks in the United States.
1629 SUSANA PÁRRAGA RODRÍGUEZ: The aggregate effects of government incometransfer shocks - EU evidence.
1630 JUAN S. MORA-SANGUINETTI, MARTA MARTÍNEZ-MATUTE and MIGUEL GARCÍA-POSADA: Credit, crisis
and contract enforcement: evidence from the Spanish loan market.
1631 PABLO BURRIEL and ALESSANDRO GALESI: Uncovering the heterogeneous effects of ECB unconventional
monetary policies across euro area countries.
1632 MAR DELGADO TÉLLEZ, VÍCTOR D. LLEDÓ and JAVIER J. PÉREZ: On the determinants of fi scal non-compliance:
an empirical analysis of Spain’s regions.
Unidad de Servicios AuxiliaresAlcalá, 48 - 28014 Madrid
E-mail: [email protected]