on the economics of industrial safety - duke law research
TRANSCRIPT

ON THE ECONOMICS OF INDUSTRIAL SAFETY
WALTER Y. 01*
INTRODUCTION
Articles on this subject often begin by citing the National Safety Councilstatistics that over two million workers are injured each year, 14,000 are killed,and 190,000 are permanently disabled by industrial accidents.' The passageof the Williams-Steiger Bill in 19702 which established the Occupational Safetyand Health Administration (OSHA) clearly reflects our legislators' beliefsthat this accident toll is intolerably high. Further, one can infer from the Re-port of the National Commission on State Workmen's Compensation Laws(NCSWCL)3 that the current compensation to victims of industrial accidentsis grossly inadequate. Legislative actions at both federal and state levels havemainly been intended to achieve two objectives: (1) to reduce the frequencyand severity of work-related injuries and diseases, and (2) to provide moreequitable compensation to victims of these mishaps. The former has significancefor economic efficiency, indicating that the present industrial accident tollexceeds some socially optimal accident toll. The latter is concerned with whatconstitutes "just and fair" compensation. 4 An economist has something tosay about the former issue, and I shall try to do so in this paper even thoughI agree with Professor Stigler who wrote, "[1]acking real expertise and lackingalso evangelical ardor, the economist has had little influence upon the evolu-tion of economic policy."5
*Professor, Graduate School of Management, University of Rochester; Visiting Senior Re-
search Economist, Industrial Relations Section, Princeton University (1973-74).' NATIONAL SAFETY COUNCIL, ACCIDENT FACTS 18 (1972). These data were based on the old
Z16.1 standard-the BLS, pre-OSHA, injury data compilation technique-wherein a work injurywas counted only if the injured worker was unable to report for work on the day followingthe accident. The reporting requirements under OSHA, 29 C.F.R. §§ 1904.1-.22 (1973),have expanded the scope to include more minor injuries as well as diseases which, in the lasthalf of 1971, accounted for 5 per cent of all cases under the new standard. This shift in thedefinition of work injuries has roughly trebled the number of injuries. In the future, we shouldexpect to read that over 6 or 7 million workers are injured each year. For further details on thecomparability of the old and new data series, see Schauer & Ryder, New Approach to OccupationalSafety and Health Statistics, 95 MONTHLY LAB. REV. 14 (1972).
2 Pub. L. No. 91-596, §§ 2-34, 84 Stat. 1590 (Dec. 29, 1970) (codified in scattered sections of5, 15, 18, 29, 42, 49 U.S.C.).
3 NATIONAL COMMISSION ON STATE WORKMEN'S COMPENSATION LAws, THE REPORT OF THENATIONAL COMMISSION ON STATE WORKMEN'S COMPENSATION LAws (1972).
4 Some policies that are addressed to the equity objective may also have an impact on efficiency.Thus, according to the NCSWCL Report, the workmen's compensation program may encouragesafety by giving employers a monetary incentive to invest in safety-and thereby improve theirsafety records-in order to reduce premium costs. Id. at 87. No empirical evidence was offeredto support this conjecture.
'Stigler, The Economist and the State, 55 AM. ECON. REv. 1, 12 (1965). This is not to say thateconomists have had no influence. In the same article Stigler writes, "even when economiststook an active and a direct interest in a policy issue, they did not make systematic empirical studiesto establish the extent and nature of the problem or the probable efficiency of alternative methodsof solving the problem." Id. at 11. It is a serious indictment of the profession, but the same absence

LAW AND CONTEMPORARY PROBLEMS
Calabresi has convincingly argued that the goal of public policy shouldbe the minimization of the sum of accident costs and accident prevention costs.0
A legal limit on the heights of skyscrapers would surely reduce fatalities inthe construction trades, but would it be consistent with the maximum welfareof society? Policies that reduce the frequency and severity of industrial acci-dents are desirable only if it can be demonstrated that industrial safety ispresently below that socially optimal level which minimizes the sum of accidentand accident prevention costs. In measuring accident costs, it is importantto distinguish between risks and outcomes. How much additional compensationwould be demanded by Jones to accept a job on which he knew he would losea leg? Alternatively, how much additional compensation would be demandedby 100 Joneses if they knew that one of them was virtually certain to lose aleg? The latter is the pertinent question for workers who offer their laborservices in hazardous employments. The value of a leg is not invariant to theprobability of losing a leg. In evaluating accident cost savings, the relevantmeasure is thus the value to groups of workers of lower injury risks, not thevalue of fewer unfortunate outcomes to particular named individuals. 7 Thecase histories which have been advanced in favor of more industrial safetyhave largely neglected the difficult problem of identifying and measuringaccident prevention costs. And safety literature appears not to question thebelief that whatever the prevention costs, they must be less than the benefitsof lower accident costs.
Part I of the paper develops the concept of an optimum level of safety ina world of inherent injury risks. The model is relaxed in Part II where workinjury risks can be influenced by accident avoiding actions by employers andworkers. Since no one intentionally injures another, the observed work injuryrates can be viewed as equilibrium rates that may differ from socially optimalrates. Part III then presents some empirical evidence on injury rate differentialsover time and across industries, occupations, establishment sizes, and char-acteristics of workers. These empirical regularities are suggestive of some of theproperties of the technological trade-offs between injuries and goods. In thelight of the analytic framework of Part II and the empirical results of PartIII, a final section evaluates the policies initiated by OSHA and the recom-mendations set forth by the NCSWCL.
of systematic empirical studies also characterizes other designers of public policy. Finally, "theextent to which safety in production processes and purity in products are achieved by a competitivemarket and by a regulatory body" is listed by Stigler as one of five subjects that has not been"investigated with even modest thoroughness." Id.
6 G. CALABRESI, THE COST OF ACCIDENTS: A LEGAL AND ECONOMIC ANALYSIS (1970).7 This distinction is put nicely by Thaler and Rosen who develop empirical estimates of the
value of saving a life as opposed to the value of a life. R. Thaler & S. Rosen, The Value of Savinga Life: Evidence From the Labor Market (paper presented at the National Bureau of EconomicResearch Conference, Washington, D.C., Nov. 30, 1973). The problem only arises for injuriesthat involve death or permanent disability. I have argued that the accident costs of temporarydisabilities that do not change the injured worker's post-recovery productivity can be valuedlike objects with market values. With perfect insurance markets, a certain loss of $500 is the sameas the uncertain prospect of losing $1,000 with a probability of 0.5. Oi, An Essay on Workmen'sCompensation and Industrial Safety, in 1 NATIONAL COMMISSION ON STATE WORKMEN'S COMPENSATIONLAws, SUPPLEMENTAL STUDIES FOR THE NATIONAL COMMISSION ON STATE WORKMEN'S COMPENSATION
LAWS 41, 59 (1973).
670
EcONOMICS OF INDUSTRIAL SAFETY
I
OPTIMAL SAFETY IN A WORLD OF INHERENT INJURY RISKS
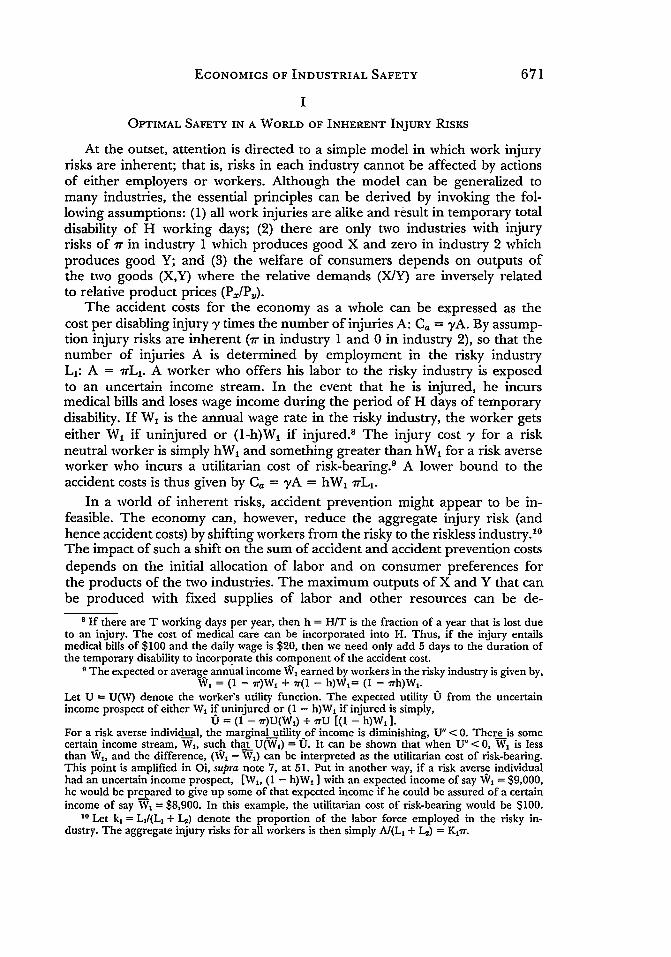
At the outset, attention is directed to a simple model in which work injuryrisks are inherent; that is, risks in each industry cannot be affected by actionsof either employers or workers. Although the model can be generalized tomany industries, the essential principles can be derived by invoking the fol-lowing assumptions: (1) all work injuries are alike and result in temporary totaldisability of H working days; (2) there are only two industries with injuryrisks of 7r in industry 1 which produces good X and zero in industry 2 whichproduces good Y; and (3) the welfare of consumers depends on outputs ofthe two goods (X,Y) where the relative demands (X/Y) are inversely relatedto relative product prices (P/P,,).
The accident costs for the economy as a whole can be expressed as thecost per disabling injury -/ times the number of injuries A: Ca = -A. By assump-tion injury risks are inherent (7r in industry 1 and 0 in industry 2), so that thenumber of injuries A is determined by employment in the risky industryL,: A = 1rL1. A worker who offers his labor to the risky industry is exposedto an uncertain income stream. In the event that he is injured, he incursmedical bills and loses wage income during the period of H days of temporarydisability. If W, is the annual wage rate in the risky industry, the worker getseither W, if uninjured or (1-h)WI if injured.8 The injury cost -y for a riskneutral worker is simply hW1 and something greater than hW1 for a risk averseworker who incurs a utilitarian cost of risk-bearing. 9 A lower bound to theaccident costs is thus given by Ca = yA = hW1 7rL,.
In a world of inherent risks, accident prevention might appear to be in-feasible. The economy can, however, reduce the aggregate injury risk (andhence accident costs) by shifting workers from the risky to the riskless industry.'0
The impact of such a shift on the sum of accident and accident prevention costsdepends on the initial allocation of labor and on consumer preferences forthe products of the two industries. The maximum outputs of X and Y that canbe produced with fixed supplies of labor and other resources can be de-
l If there are T working days per year, then h = H/T is the fraction of a year that is lost dueto an injury. The cost of medical care can be incorporated into H. Thus, if the injury entailsmedical bills of S100 and the daily wage is $20, then we need only add 5 days to the duration ofthe temporary disability to incorporate this component of the accident cost.
The expected or average annual income W, earned by workers in the risky industry is given by,W1 = (1 - 7r)W + 7r(1 - h)Wl= (1 - irh)Wl.
Let U = U(W) denote the worker's utility function. The expected utility 0 from the uncertainincome prospect of either W1 if uninjured or (1 - h)W1 if injured is simply,
0 = (1 - ir)U(W1) + rU [(1 - h)Wl ].For a risk averse individual, the marginal utility of income is diminishing, U" < 0. There is somecertain income stream, W1, such that U(W1 ) = U. It can be shown that when U" < 0, Wi is lessthan ,VI, and the difference, (W1I - W) can be interpreted as the utilitarian cost of risk-bearing.This point is amplified in Oi, supra note 7, at 51. Put in another way, if a risk averse individualhad an uncertain income prospect, [W,, (1 - h)W1 ] with an expected income of say V1 = $9,000,he would be prepared to give up some of that expected income if he could be assured of a certainincome of say W, = $8,900. In this example, the utilitarian cost of risk-bearing would be $100.
10 Let k, = L,/(L, + L,) denote the proportion of the labor force employed in the risky in-dustry. The aggregate injury risks for all workers is then simply A/(L 1 + L2) = K,r.

LAW AND CONTEMPORARY PROBLEMS
scribed by a product transformation curve like AB in Figure 1. At pointA, X = 0 implying that L, = 0, and hence accident costs will also be zero. Bymoving to the right along AB, the economy can get more output X from therisky industry but at a cost of less output of Y and more work injuries. Consumerpreferences for the two goods can be described by a family of indifferencecurves like I, and 12 where 12 represents consumption bundles that yield ahigher utility than bundles along I,. The maximum of consumer preferences(utility) that can be attained with fixed resources is achieved at the bliss pointE where the highest indifference curve is just tangent to the product transfor-mation curve. Since the loss of productive labor time due to injuries is alreadyincorporated in the AB curve, the bliss point E corresponds to an optimumbundle of goods (X,Y) which, in turn implies the allocation of labor to the twoindustries. The aggregate injury rate, k1ir that corresponds to point E, is thusan optimum level of industrial safety which maximizes consumer welfare."
y
A
E 21
G
BX
FIGURE 1
Various policies such as the imposition of an excise tax on good X couldreduce output and employment L, in the risky industry thereby loweringaccident costs. If we were initially at the bliss point E, an excise tax on X couldinduce a movement from E to F. However, at point F, consumers (who arealso workers) are forced to a lower level of utility. Although accident costsare lower at F, the marginal value that consumers attach to the output X ofthe risky industry exceeds the opportunity cost (including the cost of moreinjuries) of producing more of X. The accident prevention cost in this modelis thus seen to be derived from consumer preferences for the outputs (X,Y)of risky and riskless industries.
Is there any reason to expect that competitive forces will lead to a marketequilibrium at the bliss point E? If workers are informed about the inherent
11 The problem of maximizing utility subject to a resource constraint is the dual to the problemof minimizing resource inputs to attain a given level of utility described by a particular indifferencecurve. When consumer utility (welfare) is maximized the economy is also minimizing the sum ofaccident and accident prevention costs.
672

ECONOMICS OF INDUSTRIAL SAFETY
injury risks, they realize that employment in the risky industry entails a po-tential income loss of y = hW1 which will occur with probability 7r. Assume thatworkers are liable for all accident costs. Under risk neutrality, a worker wouldsupply his labor to the risky industry only if the wage in that industry W, ex-ceeded the certain riskless wage in the other industry, W2, by an amount equalto the expected income loss due to injury. Hence, in equilibrium, (1-7rh)W,= W2, and the risk premium (or equalizing wage differential) will be (W,-W 2)= 7rhW, =- ry. The higher wage will increase the marginal cost and hence theprice of X, the product of the risky industry. Given competitive product andlabor markets, product prices will be equated to marginal costs, and since themarginal cost of X (given W,-W 2 = 'ny) fully incorporates all of the accidentcosts, the resulting market equilibrium will be at a bliss point E. The sameoptimal safety level will also be attained in a world of risk averse workers ifinsurance is fair.' 2 However, with risk averse workers and no insurance market,the risk premium in the risky industry must exceed the expected injury costby an amount equal to the utilitarian cost of risk-bearing for the marginalworker. In this event, the market equilibrium will be at a point to the left of E."3
Consider next a situation in which workers are initially ignorant and be-lieve that the risks are the same in the two industries. Wage rates would thenbe the same, W, = W2, and the equilibrium would be at a point like G in Fig-ure 1. At G, the economy is allocating "too much" labor to the risky industryand suffers a high aggregate injury toll. But is this a stable equilibrium? Theuninformed workers in the risky industry earn, on average, less than their peersin the riskless industry Y because some fraction ir of them will be injured eachyear and incur wage losses. Employers in the riskless industry Y clearly havean incentive to point out this fact to workers in industry X. If W, = W2,
employers who inform workers about the injury risks in industry X, couldattract those workers at any wage exceeding (1-irh)WI. As more workers areattracted to the riskless industry Y, wage rates there, W2, will fall until even-tually the equalizing wage differential, (W1 - W2) = iry, that prevailedwith fully informed workers is reestablished. Full information by all partic-ipants is not essential to establish an optimum competitive market equilib-rium.
Finally, it should be noted that the assignment of liability for accidentcosts has no effect on the allocation of labor and hence on the equilibriumnumber of disabling injuries. If employers were liable, there would be a dis-
12 By fair insurance, I mean that the premium rate p per dollar of coverage is just equal to the
injury risk ,r. Eisner and Strotz, Smith, and others have proven that with actuarially fair insurancerates, risk averse individuals will always demand full coverage against all potential losses. See,e.g., Eisner & Strotz, Flight Insurance and the Theory of Choice, 69 J. POL. ECON. 355 (1961); Smith,Optimal Insurance Coverage, 76 J. POL. ECON. 68 (1968). Hence, with fair insurance, fully insured,risk averse workers behave just like neutral workers who maximize expected income irrespectiveof the variance of income. A fuller discussion of this point can be found in Oi, supra note 7, at 52.
13 It will still be the case that the least risk averse workers, who incur the lowest utilitariancost of risk-bearing, will end up in the risky industry. The equilibrium with no insurance mar-ket is not a socially optimal one because risk averse workers are unable to spread the accidentcosts. Since the added cost of risk-bearing, (WI - W2) > 'ry, must be incorporated into the mar-ginal cost of producing X, this non-optimal equilibrium results in a contraction in the outputof X and fewer injuries.
673

LAW AND CONTEMPORARY PROBLEMS
crepancy between the wages paid to workers (I shall refer to these asearnings) and the wage costs to employers in the risky industry. The earningsof workers in the risky industry will be equal to the wages in the riskless in-dustry, but wage costs in the risky industry will be higher by the amount ofthe expected injury cost. Moreover, the presence of workmen's compensationin this world of inherent risks also has no effect. If workers receive benefitsfrom workmen's compensation in the event of an injury, the expected value ofthese benefits will simply reduce the size of the equalizing risk premiumneeded to attract workers to the risky industry.
II
EQUILIBRIUM INJURY RATES UNDER ENDOGENOUS RISKS
While industrial accidents are random events, the probabilities (injuryrisks) of these regrettable events can be influenced by employers and work-ers. Technology, however, constrains the extent to which injury risks can becontrolled. Some jobs, such as drilling and tunneling or refuse collection, areinherently more dangerous than others. The incentives and information avail-able to the involved parties will affect injury risks (and hence injury rates)within these technological constraints. The observed injury rate differentialsover time and across industries, occupations, and types of workers can thusbe viewed as equilibrium injury rates that were simultaneously determinedby the interaction of the demand for, and supply of, industrial safety by em-ployers and workers. The equilibrium will obviously be affected by compul-sory insurance schemes and mandatory safety standards.
Industrial accidents and the injuries that they inflict can properly beviewed as undesirable by-products. 4 Textbook production functions de-scribe how inputs of labor and capital can be transformed into outputs ofeconomic goods. A more accurate picture is one in which firms face jointproduction functions wherein inputs generate two joint products, economicgoods X and work injuries or accidents A. If instead of injuries A, we mea-sure their complement, uninjured workers B, then for a given outlay for in-puts, there is a negative technical trade-off between goods X and uninjuredworkers B. Given its outlays for labor, capital, and other inputs (includingsafety), a firm can expand its "output" of uninjured workers B (achieving alower injury rate) only by reducing output of its principal product X. Thesetechnical trade-offs can be achieved in a variety of ways. A firm could pur-chase safety inputs such as installing guards, hiring safety engineers, orpaying new employees to attend orientation lectures on safe work practices.Alternatively, it could initiate safety practices such as slowing down the speedof its assembly lines or giving liberal sick leave privileges to guard against thepossibilities of accidents caused by workers who return to work before they havefully recovered from an illness. The firm's safety expenditures S must includenot only the identifiable costs of safety inputs but also the implicit opportu-nity costs equal to the value of output X that could have been produced in the
11 See text at pp. 672-74 supra.
674

ECONOMICS OF INDUSTRIAL SAFETY
absence of the safety practices. The rational firm will choose that combina-tion of safety inputs and practices which minimize the total safety expendituresS needed to achieve any given injury risk ir."
In this manner, the technical trade-offs between goods and injuries canbe incorporated into the firm's safety expenditures S which include both theexplicit costs (of inspectors, safety devices, and so on) and the implicitcosts (of slowing assembly lines, rest periods, and so on). We can thus specifyan injury risk function which describes the accident prevention cost functionfor the firm:(1) 7r=g(S,L) - g<0, -=gL>O.
dS gdL
S Ca
w1 7l"
FIGURE 2
Holding employment L constant, an increase in safety expenditures will re-duce the injury risk -r . Conversely, when safety outlays S are held constant,an increase in employment L can be expected to increase the injury riskir because the firm now spends less on industrial safety for each worker.' 6
Within certain technological limits, the firm can, in principle, alter its injuryrisks by allocating more or less resources to safety. For a given size of the
15 For analytic simplicity, I have assumed that the injury risk can be described by a singleparameter ir, the -probability of being injured. The wide diversity of work-related injuries couldhave been described by a vector of probabilities for each type of injury ranging from cuts andbruises through loss of limb to deaths. I felt that the simplifying assumption was warranted inthe light of the modest objectives of the analysis set forth here.
10 Equation (1) can be derived in another way. Let A = injured workers, while B = L - A =uninjured workers that are "produced" by combining safety S and labor L via the productionfunction,
d!B dB>.B=f(S,L) -> 0, ->0.
dS dL

LAW AND CONTEMPORARY PROBLEMS
labor force L, the inverse of equation (1) is depicted by the S curve in Figure2 above. The position and shape of the S curve will obviously vary across firmsand industries being higher for the innately more hazardous industries. 17 TheS curve thus describes the firm's accident prevention costs; the firm mustallocate more to safety expenditures S in order to achieve a lower injuryrisk ir.
A higher work injury risk ir can lead to larger accident costs to the firmin terms of both labor and material costs. Industrial accidents are often ac-companied by destruction of machinery and materials, disruptions in pro-duction schedules, and so on. In terms of labor costs, the replacement ofinjured workers unavoidably raises the firm's labor turnover with an accom-panying increase in the fixed employment cost of recruiting and training newemployees. Furthermore, a firm that can offer safer working conditions canattract workers at lower wage rates that contain smaller risk premium com-ponents. If the wage rate is related to the injury risk via the relationship,W = W(ir) with W' (ir) > 0, the accident costs to the firm Ca, can bewritten:' 8
dCa(2) Ca = [Fir + W(r) ]L, C'a =-r [F + W'(r) IL > 0,
where F is the sum of the material costs and the fixed employment cost peraccident. If equation (1) is inverted to yield, S = G(7r,L), where (dS/dir) =Gir < 0, we write the sum of accident and accident prevention costs for the firmas follows:(3) Ca + S = [Fir + W(r) ]L + G('r,L).
An increase in safety expenditures S which lowers the injury risk 7r willreduce the sum of accident and accident prevention costs if (C'a + S') > 0,that is,
(4) - S' < C'a, -G.(ir,L) < [F + W'(w)]L.
If this function is homogeneous of the first degree, it can be rewritten as,A= h(0).
L LAn increase in safety per worker, (S/L) should lead to a larger fraction of uninjured workers(B/L); that is, h' > 0. The injury risk is simply ir = A/L, but since B = L - A, we have,
ir= I - = I - h(0).L L
It is apparent that this expression (given h' > 0) will yield the same derivatives as that attributedto the g function of equation (1).
27 The S curve depicted in Figure 2 incorporates the plausible assumption of diminishingreturns to safety outlays. In terms of equation (1), diminishing returns means that (dir/dS) < 0,and (d2 ir/dS 2) > 0. It also seems reasonable to suppose that even when the firm spends nothing onsafety, there is some upper limit to the injury risk ir,.
18 If the fixed employment cost is R, we can write,total labor cost = RH + WL,
where H is the flow of new hires needed to sustain a labor force of L workers. We can relate Hto L via,
H = (q + lr)L,
676

ECONOMICS OF INDUSTRIAL SAFETY
The marginal prevention cost curve, -S', and the marginal accident costcurve, C'a, are shown in Figure 3. From the firm's viewpoint, an equilib-rium injury rate if is attained when -S' = C'a.
-S t
C1a
r 7"FIGURE 3
If workers do not fully incorporate the costs to them of higher injury risks,W'(r) will be close to zero implying a downward shift and a flatteningof the C'a curve. In this event, 4r will climb because employers haveless incentive to spend resources on safety. To the extent that the wagestructure, W = W(ir), does not fully incorporate the accident coststo workers, the equilibrium injury rate ir exceeds a socially optimal injuryrate i*. It is believed that workmen's compensation brings us closer tosocially optimal injury risks because a firm's premium costs are linked to itsinjury experience, at least for the largest firms.' 9 Two remarks are in order
where q is the quit rate and ir is the injury rate. Notice that the quit component of total labor costs,RqL, has been omitted in equation (2). 1 have skimmed over some rough edges of this modelincluding (a) that the injury risk must be converted to annual losses of workers, and (b) that ifinjuries only involve temporary disabilities, the fixed cost of replacing injured workers will bebelow R. The importance of fixed employment costs is more fully discussed in Oi, Labor as a Quasi-fixed Factor, 70 J. POL. EcoN. 538 (1962). The parameter F is the sum of R and the materialcost M. Finally, the relationship, W = W(ir), should strictly only pertain to that part of the wagerate that consists of the risk premium. The convex shape of the Ca curve in Figure 2 incorporatesthe assumptions that,
d._W -= W'(r) > 0, d2-W = W"(r) > O.
d~r dwr2
In terms of the discussion in Part I, if Wo is the wage in a riskless industry (with iro = 0), then wehave,
w( L) ) W0,W(I)- 1-rh
which yields the desired convex shape for Ca.19 This argument is more fully developed in Russell, Pricing Industrial Accidents, in 3 NATIONAL
COMMISSION ON STATE WORKMEN'S COMPENSATION LAWS, SUPPLEMENTAL STUDIES FOR THE

LAW AND CONTEMPORARY PROBLEMS
here. First, if the premium costs-which are merely a portion of the accidentcosts to injured workers-comprise only a small part of the marginal accidentcosts, even a full assignment to firms of costs to victims will lead to only asmall shift in C'0 , meaning only a small change in equilibrium injuryrates r.
2 0 Second, if the compulsory partial insurance under workmen'scompensation is a close substitute for private insurance (purchased byeither the worker or employer), any change in benefit levels under workmen'scompensation will simply result in a substitution of public for private insur-ance with very little change in the risk structure of wage costs, W = W(ir).
This model can also be used to analyze how a change in the size of a firm'slabor force L will affect 'ft. Equation (4) tells us that a rise in L will lead toupward shifts in both the marginal accident cost C'a and accident preven-tion cost -S' curves. The upward shift in C'a will be directly proportionalto the increase in L, but the magnitude of the shift in -S' depends on the prop-erties of equation (1). If there are increasing returns to accident prevention asmany allege (meaning that if S and L were increased by the same proportion,7r would fall), the -S' curve rises by less than the rise in L. In this event,the equilibrium injury risk -fr will fall as the size of the labor force is in-creased. To the extent that technical properties of joint production functionsfor goods and injuries vary across industries and occupations (and possiblyeven over time), we should expect to observe variations in equilibrium injuryrates. The important question is, however, under what conditions will theseequilibrium injury risks correspond to socially optimal work injury risks?
If, for the moment, we assume that the fraction of accidents due to con-tributory negligence by workers is the same in all industries and is unaffectedby employer actions, I believe that two conditions must be met to realize theequality between equilibrium and socially optimal injury risks. First,the marginal accident cost curve, C'%, must represent the social costs ofadditional increments to risk that are incurred by injured workers and byinjured employment sites. This condition will be met if the risk structure ofwage cost, W = W(ir) incorporates all accident costs to victims and if F is equalto the social costs of replacing injured workers and repairing damaged em-ployment sites. Second, firms must be efficient in the provision of accidentprevention; otherwise, the -S' curve will not represent the social costs ofaccident prevention. It is sometimes argued that ill-informed employers areunaware of the technology of accident prevention or its effectiveness. Thisargument can be translated into the curves of Figure 3. The ill-informed firmperceives a -S' curve that is to the right of the true marginal accidentprevention cost curve. Given this misperception, the firm spends too little
NATIONAL COMMISSION ON STATE WORKMEN'S COMPENSATION LAws 27 (1973). The internalizationof the compensation costs offers a partial explanation for the variations in injury rates acrossestablishment size groups, but it cannot explain why the smallest establishments in many industrieshave lower injury rates than middle-sized establishments.
20 Surry states that the indirect costs (of damaged machinery, lost labor time by supervisorsand fellow-workers, output losses, and so on) may be two to five times the workmen's compen-sation costs for an accident. J. SURRY, INDUSTRIAL ACCIDENT RESEARCH: A HUMAN ENGINEERINGAPPRAISAL (1971). Her estimates are in line with those reported by Simonds and Grimaldi.R. SIMONDS & J. GRIMALDI, SAFETY MANAGEMENT, ACCIDENT COST AND CONTROL (1963).
678

ECONOMICS OF INDUSTRIAL SAFETY 679
on safety resulting in an equilibrium risk 7 that exceeds the optimal risk.Such firms can either be induced to allocate more resources to safety (throughpersuasion or public information programs) or be coerced to do so by the im-position of mandatory safety standards backed by inspection enforcement.But in discussing optimality, we cannot ignore my earlier assumption ofproportional contributory negligence.
The blame for the current industrial accident toll must be shared by em-ployers and workers. Work injury risks surely depend on the safety char-acteristics of both work environments and workers. The risks can be af-fected by a worker's physical and mental health, his exercise of care on thejob, or the matching of job and personal attributes--all factors that can bestbe controlled by the worker.21 It might well be the case that the work injurytoll could be even more sharply reduced by policies which tried to affectworker conduct. According to a recent Wisconsin study, nearly 45 per cent ofthe industrial accidents in their sample were due to disfunctional acts byworkers (what might have been called contributory negligence), while less than25 per cent were due to identifiable physical hazards.2 2 Accident re-searchers agree that both work environment and worker behavior areimportant contributing factors, but without good empirical evidence, they can-not agree on the relative importance of each. In formulating industrial safetypolicies, we have shied away from policies that try to impose costs on dis-functional acts by workers.23 If the workers' estimate of the private accidentand accident prevention costs to them are below the social costs, there is aclear possibility that they will not exercise enough care, resulting in higherequilibrium injury risks.
21 In chapter 4, Surry provides us with a summary of numerous studies that relate work in-
jury rates to the physical health and psychological attributes of workers under various environ-mental conditions. J. SuRRY, supra note 20. Some studies relate smoking, alcoholism, and drugsto the incidence of industrial accidents, and I suspect that these factors are even more closelycorrelated with the incidence of occupational diseases. If my suspicion is correct, it raises aninteresting legal issue; can an employer be sued for discriminatory hiring practices if he deniesemployment to a worker who smokes? Some data contained in a brief report by Simonds suggeststhat a firm's overall injury rate is inversely correlated with the percentage of its labor force thatis married; that is, single and divorced individuals may be innately less safe. Simonds, OSHACompliance: "Safety Is Good Business", 50 PERSONNEL, July-Aug. 1973, at 30. Before I believe thisconjecture, I would very much want to control for other variables such as age, sex, length oftime on the job, and occupation.
22See WISCONSIN STATE DEP'T OF LABOR, INDUSTRY, AND HUMAN RELATIONS, INSPECTIONEFFECTIVENESS REPORT (1971). In the conclusions to this study, the authors propose that sinceinspections can only correct easily identifiable hazards like the absence of a safety guard (andif the guard is removable, the inspections cannot compel the firm always to use the guard; that is,physical hazards are often transitory in nature), a policy of safety instruction and informationto workers might be more effective in lowering the frequency of work-related injuries.
23 Aside from exceptions under union contracts and firm-initiated supplemental fringebenefits, the wage losses due to disabling work injuries are typically shared under current stateworkmen's compensation laws. I believe that there are at least two reasons why public policiesdo not try to control injury risks by increasing the share of accident costs borne by the workeror by imposing minimum negligence standards on worker conduct. First, such policies ofteninvolve a conflict between the objectives of equitable compensation to victims and reduction ofindustrial accidents. Second, the administrative and enforcement costs of a minimum negligencestandard on worker conduct may be (or at least imagined to be) inordinately high. One couldadd a possible third reason, namely that such policies which try to affect worker behavior are likelyto be ineffective anyway.

LAW AND CONTEMPORARY PROBLEMS
The model of equilibrium injury rates set forth here is one of partial equi-librium. A more sophisticated model has been developed by Thaler andRosen.2 4 Given some risk structure of wage costs, W = W(iw), each workeris assumed to choose that combination of a wage rate and injury risk thatmaximizes his expected utility. The distribution of workers who confrontdifferent risks .r thus depends on worker preferences and the shape of therisk structure of wages W(r). Conversely, given any risk structure W(17)firms choose that combination of (W,7r) which, given their accident pre-vention functions, maximizes profits. The supply prices of workers reflect-ing their risk premiums for added risks, and the offer prices of firms whichreflect their ability to avoid accident costs, jointly determine an equilibriumrisk structure of wage rates, W = W(7r).25 Neither my model nor the Thaler-Rosen model adequately copes with the general equilibrium problem. Ifconsumer preferences shift so that at prevailing "prices" consumers wantgarbage collected thrice weekly, this increase in consumer demands willlead to more industrial accidents as more workers are attracted into thehazardous industry of refuse collection. When the private and social costs ofaccidents and accident prevention are the same (as viewed by employers andworkers), the rise in disabling work injuries due to a larger demand for gar-bage collection will be socially optimal.
III
SOME EMPIRICAL EVIDENCE ON INDUSTRIAL SAFETY
Good empirical studies are neither necessary nor sufficient for theevolution of public policy. Sensational reports about tragic events andanecdotal evidence are often more effective in eliciting legislative action.Indeed, the paucity of pertinent and reliable data poses a serious problemfor anyone even attempting to measure accident and accident preventioncosts. The published injury statistics are, however, quite informative and re-veal some striking empirical regularities. In this section, I present some ofthese empirical regularities and try to interpret them in the light of a modelof equilibrium injury risks.26 Two caveats about the published data are inorder before beginning: work injuries are defined according to the Z16.1standard, 27 and the reporting of injury data to the Bureau of Labor Statistics
24 R. Thaler & S. Rosen, supra note 7.2' The Thaler-Rosen model is based on a theory of hedonic prices developed by Rosen. Rosen,
Hedonic Prices and Implicit Markets: Product Differentiation in Pure Competition, 82 J. POL. EcoN. 34(1974). In equilibrium, W = W(ir) must be an increasing function of 1r; that is, W'(ir) > 0.Some writers such as O'Connell assert that even fully informed workers do not trade-off higherwages for larger injury risks. According to O'Connell, workers are deterred from hazardous jobsonly by the fear of injury. O'Connell, Elective No-Fault Liability Insurance for All Kinds of Accidents:A Proposal, INs. L.J., Sept. 1973, at 495. As I remarked in the Introduction, one cannot identifythe underlying motives by asking workers why they chose particular jobs.
26 The materials here are mainly condensed from two earlier studies, Oi, supra note 7; Oi, Eco-nomic and Empirical Aspects of Industrial Safety (forthcoming, currently on file with the author).
27 See note 1 supra. Under nearly all state laws, a compensable work injury is one "arisingout of and in the normal course of employment" which is a superficially straightforward def-
680

ECONOMICS OF INDUSTRIAL SAFETY 681
prior to 1971 was entirely voluntary. 28 It has been argued that the Z16.1standard grossly understated the true number of work injuries, while thevoluntary reporting induced some measurement errors.29 While the BLS in-jury statistics undoubtedly do contain measurement errors, they neverthe-less appear to be sufficiently accurate for our purpose-description of themajor variations in work injury rates.
A. Secular Trends in Work Injury Rates
Attention is first directed to the data on accidental deaths. According tothe National Safety Council, accidents of all types accounted for 6 per centof all deaths in 1970.30 The overall accidental death rate per 100,000 popula-tion (including motor vehicles, home, and work) fell from 80.8 in 1929 to56.0 in 1970. 31 The secular decline was even sharper for the work fatalityrate per 100,000 employed persons which fell from 42.0 to 18.1 between 1929and 1970.32 One of every five accidental deaths in 1929 occurred at work, andthis figure was one in every eight by 1970.33 Improvements in medicine andindustrial safety, as well as a changing composition of employed persons, allcontributed to this sharp reduction in industrial fatalities.
The conclusion that there has been a substantial secular improvement inindustrial safety is confirmed by the total work injury frequency rate for allmanufacturing for the period 1926-60. The conclusion does not stand up aswell when the data are extended to 1970 or when they are disaggregated. InTable I, the BLS injury rate data for selected industries over the period1949-70 is presented. Some industries, such as logging and highway con-struction, have exhibited steady reductions in injury rates while others, suchas meat packing and retail trade, have become more hazardous over time.While explanations may be attempted for trends in specific industries-forexample, construction has become safer because of the mechanization ofmany materials handling and lifting operations-such attempts do not come togrips with a model of equilibrium injury rates. In addition to these seculartrends, Kossoris has shown that there is a definite cyclical pattern.34
inition. An example illustrates the complexities not only with respect to the compilation of statis-tics but also to the litigations over contested claims. In climbing out of his car, Smith steps on a rockand sprains his ankle. If his car was parked in a lot that was owned or leased by his employerfor the use of employees, Smith's sprain is a compensable work injury. However, if Smith parkedhis car in a public parking lot, the sprained ankle-cannot be included as a work injury statisticand is ineligible for any compensation benefits. -
28 The BLS data on employment, hours, and earnings are also based on establishment reportsthat are voluntarily supplied to BLS. The industry-wide aggregates and averages that are publishedare, however, weighted sums and means where sampling methods are employed in derivingthe weights.29 J.B. GORDON, A. AKMAN &,.M. BRooxs, INDUSTRIAL SAFETY STATISTICS: A RE-EXAMINATION(1971).
30 NATIONAL SAFETY COJNCIL, ACCIDENT FACTS 18 (1970).31 Id. More detailed- data for intervening years as well as the age/sex breakdown of work
fatalities can be found in Oi, supra note 7, at 101-02, Tables 5.1 & 5.2.32 NATIONAL SAFETY COUNCIL, ACCIDENT FACTS (1970).33 Id.34 Kossoris, Changes in Injury Frequency Rates and Employment in Manufacturing, 1936-41, 56
MONTHLY LAB. REv. 949 (1943); Kossoris, Industrial Injuries and the Business Cycle, 46 MONTHLY LAB.REv. 579 (1938).

LAW AND CONTEMPORARY PROBLEMS
Work injury rates are positively correlated with economic activity, rising inthe upswing and falling in the downswing. s5
TABLE IINJURY FREQUENCY RATES FOR SELECTED INDUSTRIES, 1949-70
(rates per million man-hours)
Industry 1949 1960 1965 1970Manufacturing 15.0 12.0 12.8 15.2
Meat packing 23.2 25.4 35.4 46.9Canning and preserving 20.8 22.6 23.1 25.7Logging 92.2 58.8 52.6 42.4Structural clay products 36.8 31.1 32.8 30.5Motor vehicles 6.7 3.3 2.3 2.0
Non-manufacturingHighway construction 45.5 35.0 30.6 28.9Public warehousing 31.2 28.8 26.0 31.1Bnkfig 2.4 2.4 2.2 2.4
Retail general merchandise 5.1 6.8 7.8 8.0
Source: U.S. BUREAU OF LABOR STATISTICS, DEP'T OF LABOR, BULL. No. 1735,HANDBOOK OF LABOR STATISTICS 1972, at 361, Table 163 (1972); U.S. BUREAU OFLABOR STATISTICS, DEP'T OF LABOR, BULL. No. 1016, HANDBOOK OF LABOR STA-
TISTICS, 1950 EDITION 180, Table G-4 (1951).Historical data for all manufacturing from Table G-3 were as follows:
1926 24.21930 23.11935 17.91940 15.31945 18.6
U.S. BUREAU OF LABOR STATISTICS, DEP'T OF LABOR, BULL. No. 1016, HANDBOOKOF LABOR STATISTICS, 1950 EDITION 179 (1951).
B. The Industrial Dispersion of Injury Rates
The data appearing in several special BLS studies of specific industriessuggest that the dispersion of work injury risks across occupations withina given industry is considerably larger than the dispersion of industry-widerates across industries. However, since the available data are reported on anindustry basis, researchers have emphasized the industrial dispersion.
3' It is beyond the scope of this paper to try to explain the mixed patterns exhibited by the timeseries data where injury frequency rates are falling in some industries, rising in others, and followingother time paths in still other industries. Berkowitz has argued that the secular decline in the injuryrate for manufacturing is a response to the rising cost of industrial accidents. Berkowitz, Alloca-tion Effects of Workmen's Compensation, in INDUSTRIAL RELATIONS RESEARCH ASSOCIATION, PRO-CEEDINGS OF THE TWENTY-FOURTH ANNUAL WINTER MEETING 342 (1971). However, his measureof the accident cost is the real wage rate (the ratio of average hourly earnings in manufacturingto the consumer price index). His model cannot explain the reversal in the trend from 1960to 1970, nor can it explain the rising trend in meat packing or canning and preserving. AlthoughSmith provides us with a somewhat better model, Smith, Intertemporal Changes in Work InjuryRate, in INDUSTRIAL RELATIONS RESEARCH ASSOCIATION, PROCEEDINGS OF THE TWENTY-FIFTH
ANNIVERSARY (ANNUAL WINTER) MEETING 167 (1973), I have argued that we still do not havea satisfactory model which explains the time series variations in work injury rates. Oi, supranote 26, pt. III.
682
EcONOMICS OF INDUSTRIAL SAFETY
Anyone who has studied the BLS injury statistics knows the magnitudeof the industrial dispersion. To cite but a few figures, the injury rates permillion man-hours in 1970 were 2.4 in banking, 63.9 in refuse collection, 8.0in retail trade. Further, the time series data exhibit a strong autocorrelation;that is, the high injury rate industries in 1960 were also the high injury rateindustries in 1970. Given the strong temporal stability in the ranking of in-dustries by injury frequency rate, workers should have fairly good ideas aboutrelative injury risks.36
C. Age and Sex Differentials
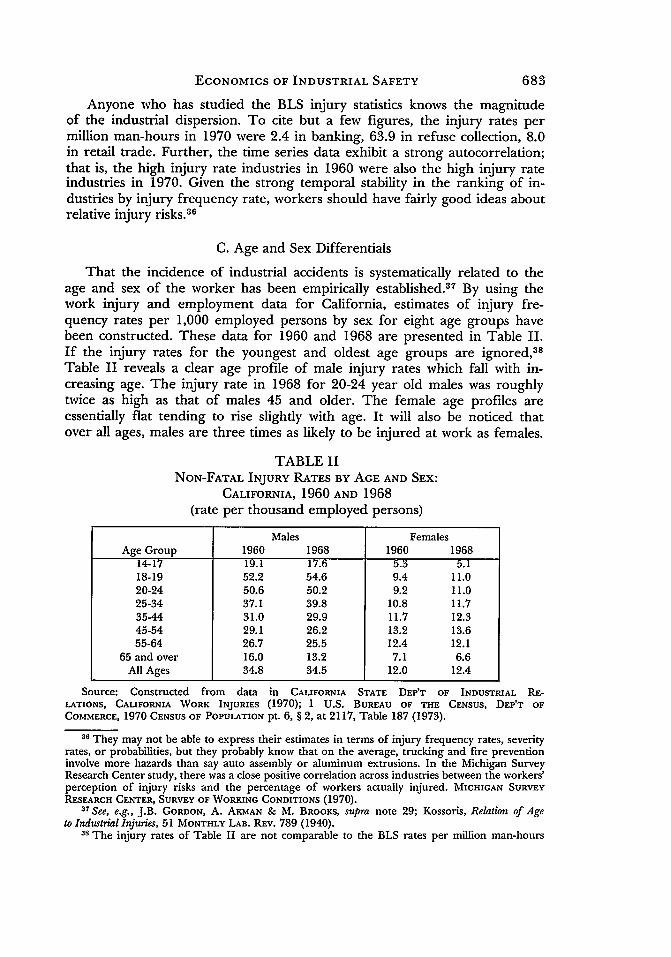
That the incidence of industrial accidents is systematically related to theage and sex of the worker has been empirically established.3 7 By using thework injury and employment data for California, estimates of injury fre-quency rates per 1,000 employed persons by sex for eight age groups havebeen constructed. These data for 1960 and 1968 are presented in Table II.If the injury rates for the youngest and oldest age groups are ignored,38
Table II reveals a clear age profile of male injury rates which fall with in-creasing age. The injury rate in 1968 for 20-24 year old males was roughlytwice as high as that of males 45 and older. The female age profiles areessentially flat tending to rise slightly with age. It will also be noticed thatover all ages, males are three times as likely to be injured at work as females.
TABLE INON-FATAL INJURY RATES BY AGE AND SEX:
CALIFORNIA, 1960 AND 1968(rate per thousand employed persons)
Males FemalesAge Group 1960 1968 1960 1968
14-17 19.1 17.6 5.3 5.118-19 52.2 54.6 9.4 11.020-24 50.6 50.2 9.2 11.025-34 37.1 39.8 10.8 11.735-44 31.0 29.9 11.7 12.345-54 29.1 26.2 13.2 13.655-64 26.7 25.5 12.4 12.1
65 and over 16.0 13.2 7.1 6.6All Ages 34.8 34.5 12.0 12.4
Source: Constructed from data in CALIFORNIA STATE DEP'T OF INDUSTRIAL RE-LATIONS, CAUFORNIA WORK INJURIES (1970); 1 U.S. BUREAU OF THE CENSUS, DEP'T OFCOMMERCE, 1970 CENSUS OF POPULATION pt. 6, § 2, at 2117, Table 187 (1973).
36 They may not be able to express their estimates in terms of injury frequency rates, severityrates, or probabilities, but they probably know that on the average, trucking and fire preventioninvolve more hazards than say auto assembly or aluminum extrusions. In the Michigan SurveyResearch Center study, there was a close positive correlation across industries between the workers'perception of injury risks and the percentage of workers actually injured. MICHIGAN SURVEYRESEARCH CENTER, SURVEY OF WORKING CONDITIONS (1970).
37 See, e.g., J.B. GoRDON, A. AKMAN & M. BROOMS, supra note 29; Kossoris, Relation of Ageto Industrial Injuries, 51 MONTHLY LAB. REV. 789 (1940).
3s The injury rates of Table II are not comparable to the BLS rates per million man-hours
683

LAW AND CONTEMPORARY PROBLEMS
The total injury frequency rates conceal the composition of work in-juries. At least two studies have shown that the percentage of serious injuriesclimbs with age. According to the 1965 California data, the work fatalityrate per 100,000 employed persons was only 14.4 for the 20-24 age groupcompared to an overall fatality rate of 19.5; the rate for the 50-54 age groupwas 21.6 .39 Data from workmen's compensation files for New York City for1955-56 have been used to estimate a truly serious injury frequency rate of1.45 per million man-hours which ranged from 1.14 for the 20-24 age groupto 1.92 for the 45-49 age group.40 The nimble young man is far likelier to beinjured at work, but his health and youth somehow enable him to avoidbeing seriously maimed or killed.
The observed age/sex differentials in work injury rates revealed byTable II (and corroborated by other data sets) could have been generated by sev-eral structural forces. Age and sex can properly be viewed as proxy variables thathappen to be correlated with systematic differences in such causal factors as (1) in-nate accident liability, (2) perceived costs of work injuries, (3) attitudes towardrisk-bearing, (4) occupational and industrial affiliation, or (5) job experience.
The first explanation argues that, other things being equal (the industry, oc-cupation, firm, safety of the work site, fellow workers, and so on), certainworkers are innately more liable to be involved in industrial accidents. Mostsafety researchers reject the thesis of accident proneness, 4I but it is difficultto separate reckless behavior, job inexperience, and misperceptions of acci-dent costs from an innate attribute of accident proneness. I am unaware ofany empirical study which has convincingly presented a test of the hypothesisthat the innate injury risks are the same for young versus old males or malesversus females.
According to a second model, workers distribute themselves across jobsof varying riskiness by weighing the benefits of higher pay (due to risk pre-miums) against their perceived costs of being injured, C = 7ry. Individualswith lower perceived costs (due either to a low subjective estimate of theinjury risk ir or a low cost of being injured y) will tend to be concentratedin the more hazardous jobs. Bits of casual evidence lend some support to thismodel. The ratio of serious to total work injuries and the duration of tem-porary disability both rise with increasing age implying that the cost perinjury y will be higher for older workers. The allegation that young men aremore reckless and embrace a philosophy of "those things happen to the other
of exposure. If the California rates per 1,000 workers are divided by two (1,000 employee yearsare approximately equal to two million man-hours), the California rates can be converted to theBLS measure of injury frequency rates. To the extent that the youngest, 14-17, and oldest, 65and over, age groups contain larger fractions of part-time employees, average annual man-hoursper employee will be lower imparting a downward bias in the injury frequency rate per millionman-hours. I assume that the variations in annual man-hours per employee across the six middlegroups is small.
39 These data were compiled by Gordon and his co-workers, J.B. GORDON, A. AKMAN & M.BROOKS, supra note 29, and were reproduced in Oi, supra note 7, at 94.40jaffe & Day, Some Illustrative Rate Tables on Seriously Disabling Work Injuries, in BuREAU OFAPPLIED SOCIAL RESEARCH, RESEARCH CONFERENCE ON WORKMEN'S COMPENSATION AND VOCA-
TIONAL REHABILITATION 83 (A. Jaffe ed. 1973).41 See J. SURRY, supra note 20, at 155-68, for a critical discussion of this point.
684

ECONOMICS OF INDUSTRIAL SAFETY
guy," suggests that they would underestimate injury risks. The model is,however, less plausible in explaining the sex differential.
That individuals differ in their attitudes toward risk-bearing is surelycorrect. Other things being equal, risk averse workers would choose saferjobs even though this meant lower but more stable wage incomes. Individ-uals in our economy express their attitudes toward risk-bearing in manyways, of which their choice of more or less risky employment is but one.The behavior of young males suggests that they have the least risk aversionand may indeed prefer risk. They drive fast, ride motorcycles, engage incrime, and buy little insurance relative to older males and females. Choosingriskier jobs fits into this general behavioral pattern, but its quantitativeimportance is a matter of conjecture.
The industrial and occupational distribution of female workers is verydifferent from that of males. Females are more heavily concentrated in thesafer clerical jobs, and even as blue-collar workers in manufacturing theytend to be in the safer industries. Aggregation over these different distribu-tions could thus generate a substantial sex differential in economy-wideinjury rates even if the injury risks were the same for the two sexes in eachindustry and occupation. 42 But this explanation fails to answer tbh question ofwhy females end up in the safer industries. A complete analysis must developa theory of occupational choice in which injury risk is only one of severalfactors. 43 I had initially conjectured that part of the difference in injury ratesbetween young and old male workers might be due to differences in theindustrial distribution of employment. An examination of the Californiainjury data revealed, however, that the shapes of the age profile (with injuryrates monotonically declining with age) were the same in contract construc-tion, manufacturing, and transportation/public utilities. 44
Finally, age and sex differentials in work injury rates may be due to ageand sex differences in job experience. In the next section the empirical ev-idence showing that injury risks are higher for new, inexperienced workersis discussed. To the extent that labor turnover rates are higher for youngmales, they will, on average, have less job experience and hence confronthigher injury risks.
D. Labor Turnover and Injury Risks
Labor turnover provides us with what I regard as the most convincingexplanation for the cyclical fluctuations in work injury rates. A simple learn-ing model could generate an inverse relationship between injury risks andjob experience as measured by the length of time that a worker has been on
42 Surry cites several wartime studies of injury risks on manufacturing production jobs, welders,assembly, and so forth. These showed that given job experience, females, if anything, had higherwork injury rates. Id. at 13. It would be useful to assemble more recent data to verify this finding.
43 Comparative advantage must surely influence job choices. Men are relatively better at jobsrequiring physical strength. Sex discrimination may affect not only pay for the same job but alsoavailability of types of jobs; employers may simply refuse to hire women for hazardous jobs.
44 It should be pointed out that the heights of the age profiles differed, being higher in con-struction. The estimated injury frequency rates can be found in Oi, supra note 26, at Table 2.5.
685

LAW AND CONTEMPORARY PROBLEMS
a particular job. Given the characteristics of the work environment and fellowworkers, industrial accidents result from errors by the worker. Newly hiredworkers who are unfamiliar with their jobs and the peculiarities of the worksite are far more likely to commit errors of which some will result in disablinginjuries. As they gain experience, the frequency of errors (and hence injuries)falls. The direct empirical evidence indicates that the injury rates of workerswith one month of job experience are one and a half to two times as high asthe rates for workers with six months of job experience. 4 5 Implications withrespect to both cross-sectional and time series variations in injury rates canbe derived from this inverse relationship.
An increase in the accession rate during a period of rising employmentmeans that the firm's labor force will, on average, have less job experience,implying an increase in the overall work injury rate. Most time series re-gression models do, indeed, reveal significant positive correlations betweenthe injury frequency rate and the accession (or new hires) rate even whenother variables are included in the equation. 46 These time series regressionsprovide additional indirect evidence supporting the hypothesis that job ex-perience (which is related to labor turnover) is an important factor.
The cross-sectional implications are even more suggestive. Consider twofirms in the same industry with identical joint production functions. Firm Aadopts personnel policies which reduce labor turnover so that inexperiencedworkers with less than one year of job experience comprise only 10 per centof A's labor force.47 Conversely, firm B with its higher turnover rate ends upwith 40 per cent inexperienced workers. If the injury rate of inexperiencedworkers is twice as high as that of experienced, the injury rate for firm B'slabor force will be 27.3 per cent higher than that of A. Although the heightand shape of the relationship between injury rates and job experience willdepend on the technology of production, safety outlays, and so on, part of
45 Using data from two earlier studies, L. CHANEY & H. HANNA, THE SAFETY MOVEMENT IN THE
IRON AND STEEL INDUSTRY, 1907 TO 1917 (BLS Bull. No. 234, 1918), and Van Zelst, The Effectof Age and Experience on Accident Rate, 38 J. App. PSYCH. 313 (1954), Surry depicts these inverserelationships for two industrial plants. J. SuRRY, supra note 20, at 14. It is not a surprising empiricalfinding. The faculty advisor to a student sailing club informed me that "[i]f a kid is going to tipover a boat, 95 times out of 100, he'll do it within the first 300 yards from the dock." We do nothave the requisite data to determine an appropriate measure ofjob experience. Is it the individual'stime on a specific job with a particular firm, his experience in a particular occupation (for example,lathe operator), or simply general work experience in the labor force? It should also be noticedthat the existence of a stable inverse relationship between injury rates and job experience wouldgenerate age differentials wherein younger workers suffer higher work injury rates.
46 A regression model for the manufacturing sector can be found in Smith, supra note 35,and for two-digit manufacturing industries in Oi, supra note 26, at pt. III. My preliminary resultssuggest that the response of injury rates to changes in the accession rate differs across industries;this latter finding is not surprising if different industries confront different joint productionfunctions for injuries and goods.
47 Personal attributes such as marital status, sex, age, and so on may be closely correlatedwith job tenure. If so, a firm could affect its turnover rate by adopting a selective (possibly dis-criminatory) hiring policy. Pencavel and Oi have argued that a firm can reduce turnover by payinghigher wages. See J. PENCAVEL, AN ANALYSIS OF THE QUIT RATE IN MANUFACTURING INDUSTRY
(1970); Oi, supra note 18. It is my understanding that under the 1973 United Auto Workerscontracts, new workers who remained with the company for six months would be rewarded bypay incentives. This feature was introduced by management for the express purpose of reducingthe high costs of labor turnover.
686

ECONOMICS OF INDUSTRIAL SAFETY
the high injury rates in logging or canning and preserving is undoubtedlydue to the seasonal nature of employment resulting in high labor turnoverrates. Previous attempts to measure the costs of labor turnover have ignoredthe fact that accident costs are positively correlated with labor turnover. Theimplementation of policies that encourage lower labor turnover may, in theend, be even more effective in reducing industrial accidents than federallymandated safety standards and inspections.
E. The Establishment Size Profile
A number of researchers have directed our attention to the wide dis-persion in work injury rates across establishment size categories. 4 In arecent study49 I found that, except for printing and publishing, the relation-ship between injury rates and establishment size (hereafter called the establish-ment size profile) for the twenty two-digit manufacturing industries" couldbe described by either (1) an inverted U-shaped curve with the smallest andlargest establishments reporting lower injury rates or (2) a monotonicallydeclining curve with the largest establishments being the safest. The magni-tudes of the injury rate differentials were impressively large. These size pro-files for five industries (based on unpublished BLS data for the period 1968-70) are presented in Table II. In the primary metals industry, workers inestablishments with 50 to 99 employees suffered an injury frequency ratethat was 19 times larger than that of workers in establishments with 2,500or more employees; the corresponding ratio in transportation equipment was16. It has been alleged that, under the Z16.1 standard, the reported injurystatistics for large firms were biased downward because workers with minorinjuries were simply transferred to less arduous jobs within the same largefirm and were never- reported as being injured. If true, the percentage ofserious injuries (which excludes temporary disabilities of 1-3 days duration)should be higher for larger firms. The data in the bottom panel of Table IIItend to confirm this allegation, but the magnitude of the differences in thesepercentages is small.
The shape and dispersion of injury rate differentials are maintainedwhen the data are disaggregated into finer industry classifications. Theinjury rate differentials across size categories within an industry are fre-quently larger than the injury rate differentials across industries holdingestablishment size constant. The mixed pattern of these profiles (most ex-hibiting the inverted U-shape and a large minority exhibiting the declining
4 8 See, e.g., J. SuRRY, supra note 20; Russell, supra note 19.49 Oi, supra note 26.50 The Standard Industrial Classification (SIC) was developed to promote "uniformity and
comparability in the presentation of statistical data collected by various agencies of the UnitedStates Government, State agencies, trade associations, and private research organizations."EXECUTIVE OFFICE OF THE PRESIDENT, OFFICE OF MANAGEMENT AND BUDGET, STANDARD INDUSTRIAL
CLASSIFICATION MANUAL, 1972, at 9 (1972). The classification makes use of a numerical schemeto differentiate among industries depending on the level of detail required; there are elevendivisions (A-K) which are further divided into major groups (two-digit codes), industry groups(three-digit codes), and industries (four-digit codes).
687

LAW AND CONTEMPORARY PROBLEMS
profile) reveals that workers in the smallest establishments do not alwaysconfront the largest injury risks.
TABLE IIIINJURY FREQUENCY RATE AND PERCENTAGE OF SERIOUS INJURIES
(by establishment size for five industries, 1968-70)
Establishment with Textile Primary Transportationan Avg. Employment Food Mills Metals Machinery Equipment
20. 22. 33. 35. 37.
Injury frequency rate Y(per million man-hours)
1-19 17.90 9.27 30.13 15.10 25.9720-49 27.00 13.00 46.97 20.20 32.6750-99 32.67 15.60 53.60 22.53 35.80
100-249 32.97 16.87 47.17 23.87 34.87250-499 30.83 11.93 34.97 19.67 23.73500-999 20.97 7.33 19.13 14.47 14.77
1,000-2,499 19.17 5.97 10.10 12.90 8.472.500 or more 16.90 3.63 2.73 5.07 2.83
Percentage ofserious injuries S
1-19 61.9 63.4 61.8 71.6 51.420-49 56.9 66.7 59.4 55.0 55.850-99 57.1 61.0 60.9 56.2 52.7
100-249 62.2 69.0 65.1 59.1 59.4250-499 64.1 71.1 71.9 65.2 70.6500-999 71.9 76.0 79.3 68.9 74.9
1,000-2,499 76.1 77.2 86.9 73.4 77.02,500 or more 66.9 76.1 86.3 84.9 90.6
Source: Oi, Economic andon file with the author).
Empirical Aspects of Industrial Safety (forthcoming, currently
Several hypotheses can be advanced to explain the lower injury frequencyrates for larger establishments. The larger manufacturing establishmentsmay (1) have lower labor turnover rates, (2) have larger fractions of em-ployees in the safer clerical and sales occupations, (3) hire fewer youngmales, (4) substitute capital for labor in particularly dangerous operations,and so on. Further, in the context of the model outlined in Part II, the largerfirms may be more efficient in producing accident prevention or may con-front a higher marginal accident cost curve. We do not have publisheddata by establishment size on labor turnover rates and the composition ofemployed persons51 thereby precluding meaningful tests for the first set ofhypotheses. We have some fragmentary data for New York on the inputs ofsafety and medical personnel. According to the 1972 New York data for all
51 Data on the percentage of workers in nonproduction jobs (mainly supervisory, clerical,ard sales) are available by size from the Census of Manufactures. I had anticipated that the largerthe percentage of workers in the safe nonproduction jobs, the lower would be the injury ratefor all workers. A regression model to test this hypothesis yielded implausible results generallyopposing my prior anticipations. See Oi, supra note 26, at Table 4.6. The broad categories of pro-duction versus nonproduction workers may conceal a considerable heterogeneity of the detailedoccupations and jobs within each.
688

ECONOMICS OF INDUSTRIAL SAFETY
industries, 52 15.0 per cent of all establishments employed some safety per-sonnel. The percentage climbs with establishment size rising from 7.6 percent for establishments with 100-249 employees to 37.5 per cent for estab-lishments with 10,000 or more employees. The 1,023 respondents who hadsome safety personnel employed a total of 2,033 safety workers of whomonly 38.8 per cent were classified as safety engineers or industrial hygienists.In addition, the ratio of safety workers to all employees (adjusted for thepercentage of establishments with safety personnel) fell with increasing size.If there are increasing returns to safety personnel, the New York data couldhelp to explain the lower injury rates of larger firms, but the implied pro-ductivity of safety workers is implausibly large. Finally, I am unable to ex-plain the lower injury rates for the smallest establishments with the availabledata on the input of safety personnel and the percentage of nonproductionworkers.
53
TABLE IVINJURY FREQUENCY RATES FOR SELECTED INDUSTRIES
(rates per million man-hours)
Industry 1960 1965 1970
Five target industries176 Roofing and sheet metal work 40.8 45.9 43.0
201 Meat products 29.3 37.0 43.124 Lumber and wood products 38.0 36.0 34.1379 Misc. transportation equipment - 31.6 33.34463 Marine cargo handling - 68.8 -
Other industries161 Highway and street construction 35.0 30.6 28.9
203 Canned and preserved fruits and 22.6 23.1 25.7vegetables
371 Motor vehicles and equipment 5.2 4.7 5.33732 Boat building and repairing 29.5 36.1 35.2422 Public warehousing 28.8 26.0 31.19349 Refuse collection 46.7 53.8 63.99390 Police 34.1 43.1 45.69390p Fire protection 33.4 31.4 41.7
Source: U.S. BUREAU OF LABOR STATISTICS, DEP'T OF LABOR, BULL. No. 1735, HANDBOOKOF LABOR STATISTICS 1972, at 361, Table 163 (1972).
Under the OSHA inspection program, five target industries have beensingled out as being especially hazardous. The basis for choosing these in-dustries is unclear. Table IV presents the published BLS injury rates for the
52 The New York data was based on 6,836 voluntary responses to a mail survey of establish-
ments employing 100 or more employees. NEW YORK STATE DEP'T OF LABOR, HEALTH ANDSAFETY PERSONNEL IN INDUSTRY IN NEW YORK STATE (1972). These data are reproduced in Oi,supra note 26, at Table 4.10.
53 The presumably close personal relationships between employer and employees in the smallestestablishments has been offered as a conjectural hypothesis to explain the inverted U-shapedsize profile. That worker moral and the social climate of the work environment matter has beenstudied by psychologists.
689

LAW AND CONTEMPORARY PROBLEMS
five target industries as well as rates for other arbitrarily selected industries.If one looks only at these industry-wide averages, the injury rates in the targetindustries are well above the national average for all industries which, in1970, probably involved an injury rate of 12 to 14 per million man-hours.In addition to local government enterprises such as refuse collection, police,and fire protection which are shown in Table IV, many of the mining in-dustries entail risks that are considerably higher than those included in thetarget group. 54 Furthermore, the use of industry membership as the basisfor inclusion in a target group can be misleading. In 1970, the injury fre-quency rate for blast furnaces (SIC 331) was only 6.5, but employees inestablishments with 50 to 99 employees suffered an injury rate of48.7.
TABLE VINJURY STATISTICS FOR THE FIvE TARGET INDUSTRIES: 1966-70*
(classified by establishment size)Estabs. with Avg. Employment of:
Industry 1-99 100-999 1,000 All Sizesor more
Total injury frequency rate F176 Roofing and sheet metal work 44.66 22.99 - 38.38201 Meat products 42.36 44.83 28.78 39.3224 Lumber and wood products 42.83 32.91 11.96 35.24379 Misc. transp. equipment 38.29 35.54 11.37 35.814463 Marine cargo handling 54.17 63.90 69.20 62.69
Serious injury frequency rate Z176 Roofing and sheet metal work 26.72 12.44 - 22.58201 Meat products 23.39 27.57 18.61 24.0024 Lumber and wood products 28.02 23.53 9.33 23.89379 Misc. transp. equipment 20.57 20.91 8.53 20.494463 Marine cargo handling 42.59 58.10 66.30 56.15
Fatality rate D176 Roofing and sheet metal work .206 .081 - .170201 Meat products .029 .041 .024 .03424 Lumber and wood products .227 .136 .149 .173379 Misc. transp. equipment .061 .128 0 .1034463 Marine cargo handling .081 .153 .193 .144
Source: Unpublished files, U.S. Bureau of Labor Statistics, Dep't of Labor.
*AIl rates are per million man-hours of exposure. The rates for "All Sizes" are weighted
averages based on the man-hours data in the raw sample counts. The fatality rates D per millionman-hours can be converted to fatality rates per 100,000 employed persons by multiplying themby 200 for all industries, the fatality rate per million man-hours in 1966-70 was around D = .09.
In Table V, I present data on (1) the total injury frequency rate F, (2)the serious injury frequency rate Z which excludes temporary disabilitiesof one to three days, and (3) the death or fatality rate D per million man-hours of
54 Safety in mining is under the control of the Department of the Interior and is thus outsideof the jurisdiction of OSHA. Hence, mining industries do not appear in the target group.
690

ECONOMICS OF INDUSTRIAL SAFETY
exposure for three broad size groups in the five target industries.55 When thedata were disaggregated into eight size categories, the size profiles of totaland serious injury rates followed an inverted U-shape in four industries.The exception was marine cargo handling in which the injury rates (F,Z)tended to climb with increasing firm size. If the voluntary samples can beregarded as random samples, the fraction of total employment in large es-tablishments (with 1,000 or more employees) is considerably smaller in thesetarget industries.56 Since the largest firms also happen to be the safest innearly all industries, the smaller average firm size may account for the highindustry-wide injury rates. The injury rate differentials between the largestfirms (with 1,000 or more employees) and the rest of the industry are sub-stantial-between a half to a third of the rates for the smaller firms. As Inoted earlier, we still do not have a satisfactory explanation for these widediscrepancies in injury risks across size categories within the same industry.
Finally, numerous other empirical regularities can be found in the liter-ature on industrial safety. There is, for example, a diurnal cycle of injuryrates wherein work injury risks are highest in the mid-morning and mid-afternoon. Physical fatigue is not a significant factor. The interested readeris strongly encouraged to consult Surry for further details on other factorsrelated to work injury risks.57
IV
PUBLIC POLICY TOWARD INDUSTRIAL SAFETY
Legislative actions over the last decade appear to embrace as fact thatif left to themselves, competitive labor markets would generate equilibriuminjury rates that are, in some sense, non-optimal. 58 In this section, the theory
" The injury rates shown in Table V are weighted averages of the raw sample data for theperiod 1966-70. To the extent that the percentage of establishments in each size category whichvoluntarily supplied injury data to BLS may vary, the weighted averages for "All Sizes" may differfrom the published BLS statistics.
'6 Based on data from I U.S. BUREAU OF THE CENSUS, DEP'T OF COMMERCE, 1967 CENSUS OF
MANUFACTURES ch. 2, Table 2 (1971), 32.8 per cent of all employees in all manufacturing industrieswere in establishments with 1,000 or more employees. The sample data for the five years, 1966-70,indicated the following percentages of employment in establishments with 1,000 or more em-ployees in the five target industries:
Industry Per centin 1,000 +size group
176 Roofing and sheet metal work 0201 Meat products 31.624 Lumber and wood 11.2
379 Misc. trans. equipment 2.54463 Marine cargo handling 6.8
Id., ch. 2, Table 3.57J. SuRRY, supra note 20.58 It is unclear whether the legislators' concept of optimal work injury risks is the same as that
of the economists; that is, injury risks that minimize the sum of accident and accident preventioncosts. There are reasons to suspect that the legislators' concept of optimality is some normativeconcept in which their legislatively perceived "costs" of disabling injuries and diseases far exceedthe social "costs."
691

LAW AND CONTEMPORARY PROBLEMS
and evidence developed above are used to analyze two developments:5 9
(1) the recommendations of the NCSWCL with respect to the scope of coveredemployment and the levels of benefit payments to disabled workers, and(2) programs designed to increase industrial safety which have been adoptedby OSHA pursuant to the Occupational Safety and Health Act of 1970.
A. Benefits and Coverage Under Workmen's Compensation
Workmen's compensation is basically a system of compulsory no-faultinsurance. If an injury is classified as a compensable work injury, the em-ployer is liable for part of the injured worker's accident costs for medicalcare, rehabilitation, and wage losses irrespective of who was at fault. Further,the employer is legally compelled to assure the funds for his share of thecost by purchasing insurance from a state insurance fund, private insurancecarriers, and for the largest firms, via self-insurance. In return, the employer'sliability is ordinarily limited to fixed schedules of benefit payments prescribedunder the particular law.60 Although the vast majority of workers are pres-ently covered under state or federal workmen's compensation laws, theNCSWCL Report recommended that the scope of covered employment shouldbe expanded to include agricultural workers, domestic servants, and em-ployees of small firms presently excluded. The administrative and transactioncosts of expanding coverage are large, and if these administrative costs areincluded in the cost of accident prevention, 61 it is probable that the NCSWCLproposal for expanded coverage would not lower the sum of accident andaccident prevention costs.
By linking premium costs to the firm's industrial accident experience,workmen's compensation is supposed to give employers an incentive to pre-vent accidents. The higher the share of accident costs to victims that is borneby employers, the greater is this supposed incentive. This argument tacitlyassumes that in the absence of workmen's compensation, differences inaccident costs will not be reflected in the structure of wage costs facingemployers with different injury risks. In this event, the marginal accidentcost curve, C'a in Figure 3 above, will be flat (because W'(ir) = 0meaning no risk premiums) so that employers have less to gain from invest-ing in accident prevention. The validity of this argument depends on answersto two empirical questions. (1) Are differences in injury risks reflected inthe structure of wage costs, W = W(wr), with riskier jobs commandinghigher risk premiums? (2) How does the provision of compulsory work-men's compensation insurance affect W(,r)?
19 The historical facts surrounding the evolution of state workmen's compensation laws andthe details and programs under recent state and federal legislation are obviously also important,but are subjects beyond the scope of this paper.
60 If the injured party can prove that the employer was at fault, he can sue for additionaldamages in a private legal suit. The employer, however, waives his common law defenses ofcontributory negligence, assumption of risk, and the fellow-servant doctrine. Even under work-men's compensation, litigations may arise about which injuries or diseases are "compensable."The issue is especially difficult in cases involving industrial diseases.
61 Calabresi calls them the costs of secondary cost avoidance. G. GALABRESI, supra note 6.
692

ECONOMICS OF INDUSTRIAL SAFETY
Several recent studies have shown that when the effects on wages ofage, sex, race, education, and experience are controlled in a regressionmodel, wage rates are systematically higher in occupations or industries thatentail larger work injury risks. According to Thaler and Rosen, if the fatalityrisks could be reduced, the lower risk premium component in wages impliesa value to saving a life of roughly $250,000.62 Gordon found that the wagedifferentials across different Glass I railroads were roughly equal to theactuarial value of differences in wage losses due to different injury risksacross railroads. 63 Although wage rates paid to workers differ from wagecosts (by the amount of the fringe benefits and supplements), these studiesstrongly support the existence of a risk structure of wages, W = W(ir) withW' (0r) > 0.
Protection against the contingent costs of disabling work injuries can beprovided by either public or private insurance. Workmen's compensationand Social Security are the two principal sources of public insurance. If thesefail to cover all accident costs, they can be supplemented by private insurancepurchased either by the individual worker or by his employer. For a varietyof reasons, the difference between total employee compensation (wagecosts) and wage payments to workers has increased over time with muchof the growth attributable to employer-financed supplements in the form ofgroup health, accident, and life insurance for their employees. 64 It is surelyreasonable to suppose that public and private insurance are very close sub-stitutes. If they were perfect substitutes, an increase in public insurancecoverage via higher legislated benefit payments would be accompanied by adecrease in private insurance. In this event, more compulsory public in-surance under workmen's compensation would have little effect on the riskstructure of wage costs, W = W(r). However, when workers initially hadno private insurance, and risk premiums did not fully cover the actuarialcosts of different injury risks, the imposition of more public insurance mayhave had the desired effect of internalizing accident costs.
The efficacy of more public insurance as a means of lowering the in-dustrial accident toll has also been questioned by Chelius.65 Benefit levelsand hence premium costs for workmen's compensation vary widely acrossstates. If the theory behind the NCSWCL proposal is correct, oneshould find that injury rates for firms in high-benefit states should be lowerthan those for firms in low-benefit states. The results of his regression model(fitted to data for individual establishments) were just the opposite. Injury
62 R. Thaler & S. Rosen, supra note 7.63 K. Gordon, The Relationship Between Employee Accident Rates and Wages on U.S. Class
I Railroads, 1971 (unpublished paper on file with the author).64 At the present time, unionized workers and those in the larger firms receive the largest
fringe benefits. The compulsory fringe benefits under Social Security have shown the sharpestrelative increase in the last decade. The magnitude and composition of these fringe benefitscan be found in Oi, supra note 7, at 99-100.
65 Chelius, An Empirical Analysis of Safety Regulations, in 3 NATIONAL COMMISSION ON STATE
WORKMEN'S COMPENSATION LAWS, SUPPLEMENTAL STUDIES FOR THE NATIONAL COMMISSION ON
STATE WORKMEN'S COMPENSATION LAWS 53 (1973). See also Chelius, The Control ofIndustrial Accidents: Economic Theory and Empirical Evidence, 38 LAW & CONTEMP. PROB. 700(1974).
LAW AND CONTEMPORARY PROBLEMS
rates were higher in the high-benefit states, and if one were bold (or foolish)enough to attach causality to this result, it implies that benefit levels shouldbe reduced to get lower injury rates; Chelius did not draw that inference.Nevertheless, his findings must, in my opinion, be regarded as highly tenta-tive for at least two reasons. First, the method of controlling for other con-tributing factors, such as the age/sex/occupational composition of thelabor force, and labor turnover rates, tacitly assumes that firms of varyingsizes and in different industries confront the same technological trade-offsbetween injuries and goods. Second, his measure of injury frequency rateswas based on only a single year's experience. Although Chelius limited hisanalysis to establishments with 100 or more employees, the samplingvariability from year to year in injury rates, especially serious injury rates,is large for firms with 100 to 500 employees.
Further, the NCSWCL proposals that would raise benefit levels can only bejustified on equity grounds."S The Commission failed to provide any empirical ev-idence that its proposal would operate to reduce the frequency and severity ofindustrial accidents. I suspect that the NCSWCL recommendations to expand thescope of covered employment and injuries67 will also prove not to be consistentwith the goal of minimizing the sum of accident and accident preventioncosts, when the administrative costs of implementing these programs aretaken into account.
B. Statistics, Standards, and Surveillance Under OSHA
The Occupational Safety and Health Administration, which has been in oper-ation for three years, has attempted to design and implement federal policiesto lower the industrial accident toll. Its three principal activities have been:(1) implementing a mandatory system for reporting work injuries and dis-
66 The NCSWCL argued that the scheduled maximum weekly benefits in many states were
well below 66% per cent of average weekly wages and that benefit levels had failed to keep upwith the secular increases in wages. If benefits are defined to include all payments to injuredworkers (that is, wage losses and medical bills), they will be equal to premium costs to employersless the costs and profits of insurers which are a fairly constant proportion of premiums over time.According to data in NATIONAL COMMISSION ON STATE WORKMEN'S COMPENSATION LAWS, COM-
PENDIUM ON WORKMEN'S COMPENSATION 279, Table 17.1 (1973), premium costs for workmen'scompensation as a percentage of wages were as follows:
1940 1.19%1950 0.89%1960 0.93%1970 1.13%
Over the period, 1948-70, this percentage exhibits a significant positive trend; the correlationfor a linear trend line was +.7065. Although benefit levels may lag behind wage changes in aparticular state, the aggregate data do not support the latter contention; premium costs haveincreased taster than payrolls of covered workers.
67 In reading the NCSWCL Report, I get the impression that the Commission wanted all
workers to be covered, and the scope of compensable work injuries and diseases greatly enlarged.In summarizing their recommendations on extending workmen's compensation to self-employedpersons, proprietors, and partners, the Commission recommends "that the term 'employee'be defined as broadly as possible." NATIONAL COMMISSION ON STATE WORKMEN'S COMPENSATIONLAWS, THE REPORT OF THE NATIONAL COMMISSION ON STATE WORKMEN'S COMPENSATION
LAws 48 (1972).
694

ECONOMICS OF INDUSTRIAL SAFETY
eases, (2) promulgating existing and new federal safety and health standards,and (3) enforcing compliance through a program of OSHA inspections.68
1. Statistics
The lack of reliable and relevant injury statistics that would enable us todescribe and analyze the industrial safety problem was one of the major con-cerns in the hearings preceding the establishment of OSHA. Under the 1970Act, firms are legally compelled to maintain and report work injury statis-tics according to definitions and procedures set forth by OSHA. From apurely descriptive viewpoint, the new OSHA injury statistics are likely to bemore reliable, as judged by conventional sampling theory criteria. However,the switch from ANSI to OSHA definitions makes it difficult to compare in-jury statistics to earlier data prior to 1971.69 Further, the requirement that eachestablishment must post the annual summary of its injury experience for thepreceding year may or may not make it easier for workers to get better infor-mation about the injury risks for a particular firm.70
From an analytic viewpoint, the comprehensive reporting requirements forOSHA are unlikely to assist the accident researcher who is attempting todetermine the causal factors that generate industrial accidents. As I argued inPart III, fragmentary evidence suggests that work injury frequency rates arehigher for younger male workers, are probably higher for production andnewly hired workers, lower for females (although perhaps not if one controlsfor occupation), and higher in particular occupations. Although the char-acteristics of seriously injured workers may be recorded in the logs, thesedata are of little value in the absence of additional data on exposure times forall workers in each category. It is regrettable that the design of the manda-tory OSHA reporting requirements will result in injury statistics that willonly aid in describing the magnitudes of the frequency and severity of in-dustrial injuries and diseases in various industries. Thus, the OSHA data willmake no significant contribution to our understanding of how to reduce theindustrial accident toll.
2. Standards
No one, to the best of my knowledge, has studied the economics, politics,and psychology behind the conception and enactment of federal and state
6 8 The full range of activities is described in EXECUTIVE OFFICE OF THE PRESIDENT, THE
PRESIDENT'S REPORT ON OCCUPATIONAL SAFETY AND HEALTH (1973). OSHA is also involved intraining more industrial safety specialists who can staff positions either as regulators (employeesof OSHA) or as employees of the regulated. Funds are being allocated to the National Instituteon Occupational Safety and Health (NIOSH) to study mainly health hazards.
61 The Z16.1 standard mentioned in note 1 supra was a development of the forerunners ofthe American National Standards Institute (ANSI). In 1971 it was superseded by the OSHAdefinitions outlined in 29 C.F.R. §§ 1904.1-.22 (1973). For a treatment of this subject, seeSchauer & Ryder, supra note 1.
70 A worker could, conceivably, go from plant to plant and examine the posted annual sum-maries to see which plant had the best industrial safety record last year. He would have to knowthe difference between permanent partial versus temporary total disabilities. Since truly seriouswork injuries are rare events, the injury record for any one year is not a terribly accurate estimateof the firm's long-run injury risks.
695

LAW AND CONTEMPORARY PROBLEMS
health and safety standards.7 1 Hazards that are easily identified, and thatappear to be easily correctable, seem to be the ones for which standards areset irrespective of the true economic costs and benefits. We thus have stan-dards for elevators, machine guards, catwalk railings, shatter-proof glass,the chemical composition of various industrial compounds, and so on, butno standards for the speed of assembly lines or the characteristics thatworkers must possess to hold certain jobs. Asbestosis may be far morelikely to cause disease in workers who smoke, but federal standards do notprevent smokers from working in asbestos factories.
Many existing safety standards are either ineffective or obsolete, butlittle effort is made to appraise their efficacy. The larger issue of whethermandated safety standards can reduce the frequency and severity of in-dustrial accidents has been questioned in a study which found that the injuryrates for 25 construction companies in Michigan were approximately the sameas injury rates for a sample of 25 Ohio construction firms even though Ohiohad far stricter safety standards and a larger bureaucracy to oversee its safetyand workmen's compensation program.72 In a review of some unpublishedstudies evaluating the benefits of proposed safety standards, I was struck bythe failure to distinguish between marginal and average savings. This short-coming derives, I suspect, from the absence of a model of accident causation.A hypothetical example serves to illustrate this point. The absence of a rail-ing on a particular type of landing was found to be responsible for 50 acci-dents during a year. If railings are installed, the presumed savings are thecosts of 50 disabling accidents. If the landing is part of a stairway system,the landing could easily have constituted the "bottleneck" or point of highestaccident risk. The risks of falling on the stairs below the landing were belowwhat they otherwise would have been because the less agile workers werecaught at the landing. By installing the railing, the frequency of accidentsdue to falling down steps will surely increase. The correct benefit thatshould be attributed to the railings is the marginal (or incremental) reductionin all accidents.
Finally, OSHA seems to have a tendency to embrace the most stringentexisting or proposed standards without even attempting to measure the costsand benefits of the more stringent standards. The lavatory standard promul-gated by OSHA in 1973 illustrates this point:7 3
The standard.... requires industrial establishments with one to 100 employeesto provide one lavatory for every 10 employees. Firms with more than 100 em-ployees must provide one fixture for each additional 15 employees.
When the standard was proposed, the association objected pointing out thatNew York State required only half as many lavatories for industrial employ-ment and there was no evidence of "adverse physiological effects or employeecomplaints."
... Spencer Foods, Inc., attacked the numbers scheme as being far thestrictest standard in existence, unsupported by health needs, economically
71 Morey, Mandatory Occupational Safety and Health Standards--Some Legal Problems, 38 LAw &CONTEMP. PROB. 584 (1974).
712 Sands, How Effective Is Safety Legislation?, 11 J. LAw & EcoN. 165 (1968).73 29 C.F.R. § 1910.141(d)(2) (1973).
696

ECONOMICS OF INDUSTRIAL SAFETY
onerous, and insufficiently discriminating in types of employment. Severalcompanies suggested some kind of grandfather clause covering existing fa-cilities.
7 4
In Associated Industries of New York State, Inc. v. United States Department of
Labor, 7 5 the Second Circuit, after examining the basis for the lavatorystandard,7 6 vacated the pertinent portion of the OSHA standard and remandedthe case to the Department of Labor "for further proceedings consistent withthis opinion."7 The number of federal safety and health standards is already
astronomically large and continues to grow; it would seem prudent to insistthat henceforth OSHA prove the efficacy and economic desirability of anynew standards.
3. Surveillance
The largest part of the OSHA budget is devoted to its inspection program.
As of December, 1973, OSHA employed 556 field officers to enforce com-pliance with OSHA safety and health standards. Some 36,100 inspectionswere made in 1972, and penalties of over $3 million were levied againstfirms that violated the OSHA standards.78 Given budget constraints and apopulation of roughly 5 million establishments, OSHA must establish apriority system for determining which establishments are to be inspected.External factors, such as work fatalities or catastrophes and employee com-plaints, determine the first priorities. Establishments that fall under theTarget Industry Program and the Target Health Hazards Program are then
singled out for more frequent inspections. Finally, a random samplingscheme of the remaining establishments is used to assign inspectors toplants.
If, for the moment, we assume that OSHA safety inspections areindeed effective in reducing injury rates F, does the present priority systemlead to the largest reduction in the incidence of industrial accidents? Twofeatures of the OSHA assignment scheme lead me to suspect that it does not.First, emphasis is placed on the injury frequency rate and not on the totalnumber of injuries per year. Second, the chances that an establishment willbe inspected are not appreciably different for small and large establishmentsin a given industry. A numerical example illustrates the first point. Supposethat there are 100 firms in both industries A and B. The injury rate in industryA is twice as high as that in industry B, say FA = 40 per million man-hours and FB = 20. The OSHA scheme would assign more inspectors to
7' The Associated Industries of New York State, Inc. filed suit to rescind this standard. See
Daily Labor Report, Oct. 15, 1973, § A, at 11.75 487 F.2d 342 (2d Cir. 1973).76 "The only legitimate reliance [for the lavatory standard] is on (1) the codes of five states. :.
of which the Depaittment could take official notice but to which petitioner opposes twelve."Id. at 352.
7 Id. at 354.78 More detailed data were available for the last half of 1972 in which 16,756 inspections
identified 57,527 violations. Roughly 58 per cent of the inspections resulted in the issuanceof citations. However, only 0.73 per cent of all violations were classified as serious. Additionaldata can be found in EXECUTIVE OFFICE OF THE PRESIDENT, THE PRESIDENT's REPORT ON OCCU-PATIONAL SAFETY AND HEALTH 33-42 (1973).

LAW AND CONTEMPORARY PROBLEMS
industry A. But this fails to account for possible differences in the exposureto risks. If industry A employs 10,000 workers (20 million man-hours) andindustry B hired 30,000 (60 million man-hours), then the annual number ofdisabling work injuries would be 800 in industry A and 1,200 in industry B.If a safety inspection could lower the injury rate by 20 per cent, (and thebudget only allowed us to conduct 100 inspections), we could save moredisabling work injuries by assigning inspectors to industry B which ex-periences a lower injury rate but also has larger numbers of workers exposedto risks. A similar exercise can be carried out to demonstrate the principlethat larger establishments should be inspected more frequently.7 9
The more important question is whether safety inspections are effectiveand desirable at all. What are the costs and benefits of OSHA inspections?We can get a rough idea of the social costs of inspections from some backof the envelope calculations, which suggest a lower bound guesstimate ofaround $500 per inspection. 80 The benefits are harder to gauge because welack the data to estimate the net savings in accident and accident preventioncosts resulting from OSHA inspections. The published data in The President'sReport on Occupational Safety and Health allows us to determine the natureof the violations and the industry and size of inspected establishments.However, we cannot, for example, compare the previous work injury ex-periences of establishments cited for violations with those not cited. Further-more, it seems that OSHA follow-ups are mainly concerned with determiningwhether the cited violations have been corrected rather than with the largerand more pertinent issue of measuring the post-inspection safety recordagainst the firm's previous work injury experience. The benefits of theOSHA inspection program might well exceed the costs, but we simply donot have the requisite data to make this empirical determination.8 1 Pub-lished accounts of the activities of OSHA, including its outside contracts,reveal no attempts by the agency either to evaluate the efficacy of its in-spection program or to estimate its costs and benefits. I find this ratherdistressing.
79 I have carried out these illustrative calculations using the 1968-70 size profiles of injuryfrequency rates for three two-digit manufacturing industries. Although establishments with50 to 99 employees typically reported the highest injury rates, it turns out that the productivityof an inspection is larger when establishments with say 250 to 499 employees are inspected first.See Oi, supra note 26, at pt. V.
80 1 assume that the annual cost of each inspector (his wages and fringe benefits and the costsof supporting personnel and equipment) is around $25,000. Each inspector probably makes around100 inspections a year implying a cost to OSHA of $250 per inspection. Travel may add another$50. To this, we must add the costs to the inspected establishment that must assign supervisoryand clerical staff to accompany the inspector (and typically either a union representative or con-versations with workers), as well as the value of any lost output due to disruptions in the normalproductive process. I assume that these costs to the firm are at least $200. I believe that theseguesses are on the low side, and I would not be surprised to learn that the social cost per inspection(including costs to both the inspecting and inspected) could go as high as $1,500.
81 At a minimum, we would have to have data on (1) the reduction in the number and kindsof disabling work injuries due to inspections, (2) the costs to workers and firms of the variouskinds of industrial accidents, and (3) the prevention costs of eliminating the hazards. It will beremembered that, according to the Wisconsin Report, at most 25 per cent of all industrial accidentswere caused by physical hazards that could be identified by inspections. WIscoNsIN STATEDEP'T OF LABOR, INDUSTRY, AND HUMAN RELATIONS, supra note 22.
698

ECONOMICS OF INDUSTRIAL SAFETY
CONCLUSION
The public concern about industrial safety is understandable. Industrialaccidents-or for that matter, any accidents-are tragic events. We do notlike to attach monetary values to the outcomes of truly serious accidents;what is the proper monetary sum to compensate a man for the loss of hissight? As a result, many rally to the slogan of "safety at any cost" when theyare told about the plight of seriously disabled workers. However, "safety atany cost" carried to its logical conclusion has socially unacceptable economicimplications. The production of goods, such as meat, coal, oil, lumber, andgarbage collection, which involves high work injury risks would be outlawedin order to reduce the frequency of severe industrial accidents. But this is anextreme position, and moderates should contend that more industrial safetyis all that is needed. Yet, in the light of the available empirical evidence, Iam unable to conclude whether the current equilibrium work injury ratesare above or below the socially optimal injury risks. What I have tried toemphasize in this paper is that the socially optimal injury risks are those whichminimize the sum of accident costs and accident prevention costs. Onlyif the current levels of industrial injury risks exceed (or fall below) theseoptimal levels is there a basis for public intervention.