on the effect of networks of cycle …personal.us.es/marques/risk-preprint.pdfmentioned...
TRANSCRIPT
ON THE EFFECT OF NETWORKS OF CYCLE-TRACKS ON THE RISK OF CYCLING. THE
CASE OF SEVILLE
R. Marqués1 and V. Hernández-Herrador2
(1) Department of Electronics and Electromagnetism.
Faculty of Physics, University of Seville
Av Reina Mercedes s/n, 41012 Sevilla (Spain)
e-mail: [email protected] (corresponding author)
(2) Independent consultant
Av Flota de Indias 2, 41011 Sevilla (Spain)
e-mail: [email protected]
5
10
15
ABSTRACT
We analyze the evolution of the risk of cycling in Seville before and after the implementation of a
network of segregated cycle tracks in the city. Specifically, we study the evolution of the risk for
cyclists of being involved in a collision with a motor vehicle, using data reported by the traffic
police along the period 2000-2013, i.e. seven years before and after the network was built. A
sudden drop of such risk was observed after the implementation of the network of bikeways. We
study, through a multilinear regression analysis, the evolution of the risk by means of explanatory
variables representing changes in the built environment, specifically the length of the bikeways and
a stepwise jump variable taking the values 0/1 before/after the network was implemented. We
found that this last variable has a high value as explanatory variable, even higher than the length of
the network, thus suggesting that networking the bikeways has a substantial effect on cycling safety
by itself and beyond the mere increase in the length of the bikeways. We also analyze safety in
numbers through a non linear regression analysis. Our results fully agree qualitatively and
quantitatively with the results previously reported by Jacobsen (2003), thus providing an
independent confirmation of Jacobsen's results. Finally, the mutual causal relationships between the
increase in safety, the increase in the number of cyclists and the presence of the network of
bikeways are discussed.
KEYWORDS: Bicyclists; risk of cycling; bikeways; networks; sustainable transport; Seville
20
25
30
35

1.- INTRODUCTION
Growing public awareness about the negative effects of car-based mobility on environment and
health has attracted considerable attention to alternatives based on active mobility in urban
environments. Such alternatives include utilitarian cycling, that appears as a valid option for short
trips below 5-10 km (Dekoster and Schollaert, 2000; Pucher and Buehler, 2012). Bicycles are also
a good alternative as feedering mode for public transport networks (Martens, 2004; Dekoster and
Schollaert, 2000; Pucher and Buehler, 2012). However, cyclists (as well as pedestrians) are
vulnerable because they can not benefit of the protective metallic shell of car drivers, nor can
develop a comparable kinetic energy. These facts make difficult to develop appropriate traffic
safety measures to protect cyclists in the street (Elvik, 2010).
Fortunately, there is a wide evidence showing that the number of bicycle traffic accidents does not
grow linearly with the number of cyclists (Elvik, 2009). Seemingly, the number of accidents varies
as a less-than-one power of the number of cyclists in the streets, which implies that the risk of
cycling drops when the number of cyclists increases. This effect has been named safety in numbers
(Jacobsen, 2003; Elvik, 2009). Safety in numbers implies that policies aimed to promote cycling
are also policies promoting cycling safety. However, as Wegman pointed out (Wegman et al., 2012)
“... if numbers of cyclists are correlated with risk and these numbers are assumed to be the only
explanation, we are in error. Large numbers of cyclists in countries such as the Netherlands,
Denmark and Germany are associated with high densities of bicycle facilities. If not both numbers
of cyclists and bicycle facilities are taken into account, the wrong conclusions may be arrived at.
There is no solid evidence that the low fatality rates ... can only be explained by ‘numbers’.
Therefore, Jacobsen’s conclusion may be wrong if we simply add numbers of cyclists to the system
without adding safety quality, that is to say, risk reducing measures.” Actually, it could happens that
40
45
50
55
60
causality just goes in the opposite direction of what a careless interpretation of Jacobsen's analysis
could suggest: There would not be more safety because there are many cyclist. Instead, there would
be many cyclists because there is more safety.
Therefore, it is necessary to analyze the effects of bicycle facilities on cycling safety. Among the
aforementioned bicycle facilities, building bicycle lanes and bicycle tracks1 are probably the most
common measures (Pucher et al., 2010). Most planners and bicycle advocates (with the exception
cited below) firmly believe that these facilities reduce the risk of cycling. In fact, statistics on a
national scale in countries with a well developed cycling infrastructure, like the Netherlands,
Denmark or Germany, point in the direction desired by such planners and cycling advocates:
bicycle kilometers traveled per inhabitant continued to increase, while the number of cycling
fatalities continued to decline (Pucher and Buehler, 2008a,b). However, there is a number of
bicycle advocates, grouped around the vehicular cycling theories, which firmly believe that cycling
on bike lanes and cycle tracks is less safe than cycling in the traffic. They argue that statistical
evidence can not substitute rational causality analysis and, through the analysis of a number of
practical examples, try to show that cycling in the traffic is less dangerous than cycling on
bikeways provided some basic skills are shared by the bicyclists (Forester, 2001; see also Puchers's
reply, 2001). Although most cycling advocates does not follow such theories and support building
bicycle lanes and tracks, the influence of vehicular cycling theories has been determinant for cycle
traffic policies in some countries. For instance, in the USA, the guidelines of the American
Association of State Highway and Transportation Officials (AASHTO) favored bicycling on
roadways for many years, discouraging the implementation of cycle tracks (Lusk et al., 2013).
Thus, the controversy about the actual contribution of segregated bicycle facilities to cycling safety
1 An urban cycle track is an exclusive bicycle path alongside a city street that is separated from the motorized vehicletraffic by a physical barrier. It can run at the level of the carrigeway, at the level of the sidewalk (but clearly separated from pedestrian's paths) or at an intermediate level, as in the city of Copenhaguen. Bicycle lanes are exclusive bicycle paths separated from the motorized traffic by a white or colored line, or by any other mark painted on the pavement.
65
70
75
80
85

is still ongoing (Waldraw, 2014).
This paper presents a longitudinal study of the effect on cycling safety of the implementation of a
network of bi-directional and segregated cycle tracks in the city of Seville (Spain) between 2006
and 2013. Our main motivation for this analysis was to shed light on the above mentioned
controversy about the effect of cycle tracks and bikeways on cycling safety. Regarding this effect,
we feel it is important to differentiate between the effect of the bikeways itself and the effect of
connecting them in order to make a network covering all the area of interest. Therefore, we have
developed a methodology suitable for differentiating both effects. Besides, motivated by the above
mentioned Wegman's discussion about causality and safety in numbers, we also have investigated
the possible causal relationships between cycling safety, the implementation of the network of
bikeways and the increase in the number of cyclists associated to such implementation. Finally, we
tried to obtain some practical lessons from the analysis, regarding how to increase cycling safety in
cities.
We feel that the choice of Seville as a case study is appropriate because this city experienced a big
growth of utilitarian cycling, from negligible values to near a 6% of all trips, after the
implementation of the aforementioned network of cycle tracks (Marqués et al., 2014; Marques et
al., 2015; Castillo-Manzano et al., 2015a), which was followed by the implementation of a
successful system of bicycle sharing (Castillo-Manzano and Sánchez-Braza, 2013; Castillo-
Manzano et al., 2015b). As far as we know, there is no other similar experience in terms of growing
of utilitarian cycling in parallel to the implementation of a network of bicycle tracks. Therefore,
we feel that this case study offers a unique opportunity for evaluating the effects of bicycle
facilities on cycling safety and to elucidate the causal relationships involved in such process.
90
95
100
105
110
The analysis spans over the whole period 2000-2013 (i.e. seven years before and seven years after
the implementation of the bikeways network). We analyze the time evolution of the risk of cycling
in the city, studying the relations between this variable and the main possible causes and/or
consequences of such evolution, i.e. the presence and the length of the bikeways network, and the
evolution of the number of bicycle trips, including the possible presence of a safety in number
effect as it was reported by Jacobsen (2003) and Elvik (2009). Finally, changes in other meaningful
variables, such as the the percentage of Killed or Seriously Injured (KSI)2 cyclists over the total
number of bicycle traffic accidents, are also briefly discussed.
The paper is organized as follows: In Section 2 we present a review of the existing literature
regarding the effects of bikeways on cycling safety. In Section 3 we present and discuss the main
data supporting our study and develop the methodology for the analysis of such data. In Section 4
we present the main numerical results of our analysis. In Section 5 we discuss and interpret these
results. Finally, in Section 6, the main conclusions of our work are presented
2 “Severely injured” is defined as those victims who need hospitalization for more tan 24 hours.
115
120
125
2.- LITERATURE REVIEW
Despite the evidence of the positive effect of bikeways on cycling safety coming from statistics at
the the national level (Pucher and Buehler, 2008a,b), the evidence coming from the microanalysis
of specific infrastructures is much lower. In a review dated on 2009 (Reynolds et al., 2009),
Reynolds and co-workers analyzed 23 papers dealing with the effects on bicycle safety of several
kinds of bicycle infrastructures and indicated that the literature on the topic was very sparse. They
also highlighted that only a few types of infrastructures were studied at that time. Among the
infrastructures not studied before 2009 were cycle tracks (except at roundabouts). Notwithstanding,
the general conclusion of the review was that “purpose-built bicycle-only facilities (e.g. bike
routes, bike lanes, bike paths, cycle tracks at roundabouts) reduce the risk of crashes and injuries
compared to cycling on-road with traffic”
A more recent review (Thomas and DeRobertis, 2013) specifically devoted to cycle tracks analyzed
23 papers dating from 1987. The review pointed out that only four of such papers (Welleman and
Dijkstra, 1988; Wegman and Dijkstra1988; Gårder et al., 1994; Lusk et al., 2011) included
exposure in the analysis, something that is essential for risk evaluation. From these four papers,
only one was relatively recent (Lusk et al., 2011). The remaining three papers dated from more than
twenty years ago. The papers from Welleman, Wegman and Dijkstra (Welleman and Dijkstra, 1988;
Wegman and Dijkstra1988) were focused on bicycles and mopeds (which were allowed to ride in
cycle tracks at that time in the Netherlands) and reported a general improvement of safety for
bicyclists on cycle tracks but not for moped riders. They also found that most injuries in cycle
tracks occur at intersections and recommended to end the cycle tracks before intersections, a
practice that is not presently recommended in the Netherlands (see, for instance, Ploeger, 2007).
The paper from Gårder ( Gårder et al., 1994) also concluded that cycle tracks may enhance safety
130
135
140
145
150

between intersections, but not at intersections, and also recommended to end the cycle tracks
before intersections. The overall conclusion of Gårder's paper was that cycle paths increase the risk
“in average”. The paper from Lusk and co-workers (Lusk et al., 2011) compared accident rates in
several two-ways cycle tracks built in Montreal (Canada) with some reference streets, and
concluded that this ratio in streets with cycle tracks was 0,72 times the corresponding ratio for the
reference streets, thus showing a positive impact of cycle tracks on cycling safety. The volume of
cycle traffic on cycle tracks was also higher than in the reference streets. Therefore, in the frame of
Lusk's study, the positive impact of cycle tracks on cycling safety could be a matter of safety in
numbers (or vice-versa, according Wegman's discussion). A subsequent paper from the same
authors (Lusk et al., 2013) analyzed 19 cycle tracks in the USA and reported that the accidents ratio
on these bikeways was substantially lower than published rates for cyclists riding on the
carriageway. Both Lusk's papers are cross-sectional studies comparing different streets and did not
included any before and after analysis on the same streets. A longitudinal study (Teschke et al.,
2012) made at Toronto and Vancouver (Canada) also reported a substantially lower risk for
bicyclists riding on quiet streets and on busy streets with cycling infrastructure than for bicyclists
riding on busy streets without bicycle facilities.
Other papers also reviewed by Thomas and DeRobertis (2013) reported quite uneven results. The
most critical report with regard to safety on cycle tracks was a paper coming from the Helsinki City
Planning Dept. (Pasanen, 2001). This paper reported that 45% of cycled km in Helsinki (500.000
inhabitants) were on two-ways cycle paths, while 56% of accidents take place on such cycle paths.
The report concluded that more than a half of the 800 km of two-ways cycle paths of Helsinki are
“dangerous”. Like Lusk paper, Pasanen report does no included any before and after analysis,
comparing the situation in Helsinki before and after the network of cycle paths was built.
155
160
165
170
175
Two before and after studies were reviewed by Thomas and DeRobertis (2013). A study (Jensen,
2007) made at Copenhaguen (Denmark) reported that building cycle tracks resulted in a 10%
increase in bicycle traffic crashes and injuries, in a 20% increase in bicycle/moped traffic and a
10% decrease in motor vehicle traffic. Another before and after study carried out also in Denmark
(Agerholm et al., 2008) found that the implementation of cycle paths resulted in a 25% increase of
traffic accidents for moped riders, bicyclists and pedestrians, most of them at intersections. Nor
Jensen's nor Algerholm's studies controlled for the volume of bicycle traffic. Therefore, it can be
guessed that considering this exposure would have likely changed the results and conclusions of
these studies (Thomas and DeRobertis, 2013).
Other studies not included in the aforementioned review were recently developed in New York
(Chen et al., 2012), Montreal (Nosal & Miranda-Moreno, 2012) and in the Australian Capital
Territory (De Rome et al., 2014). Chen and co-workers (2012) studied the impact of the
implementation of cycle lanes in some streets of New York by comparing data before and after the
installation of these cycle lanes. They concluded that the installation of the cycle lanes did not lead
to an increase in the number of bicycle traffic accidents “despite the probable increase in the
number of cyclists”. In Montreal, Nosal and co-workers (2012) studied the cyclist's injury rates for
a set of four cycle tracks and four bicycle lanes and compared them to injury rates for nine control
streets. They concluded that, in overall, riding on bicycle paths was safer than riding on the control
streets. In the Capital Territory of Australia, De Rome et al. (2014) interviewed cyclist that have
been involved in a traffic crash, concluding that fewer cyclists were injured in on-road cycle lanes
than in other cycling environments.
180
185
190
195
200

Table 1:
Summary of different specific studies about the impact of bikeways on cycling safety.
The columns of the Table show the authors of the study, the date, the place of the study,
the type of analysis (longitudinal, cross-sectional or review) and the main conclusions
of the study (positive, negative or neutral) regarding the impact of bikeways on cyclist's
safety.
Author(s) Year Place of study Type of analysis Main conclusion
Welleman & Dijkstra
1988 The Netherlands Review Positive between intersections but negative at intersections.
Wegman & Dijkstra
1988 The Netherlands Review Positive between intersections but negative at intersections.
Gårder 1994 Sweden Review Negative in overall, but positive between intersections.
Pasanen 2001 Helsinki Cross sectional Negative.
Jensen 2007 Copenhaguen Longitudinal Negative (however, exposure was not controlled).
Agerholm et al. 2008 Western Denmark Longitudinal Negative (however, exposure was not controlled).
Reynolds et al. 2009 N/A Review Mainly positive.
Lusk et al. 2011 Montreal Cross sectional Positive.
Teschke et al. 2012 Toronto and Vancouver
Longitudinal Positive
Chen et al. 2012 New York Longitudinal Neutral (possibly positive after exposure analysis)
Nosal & Miranda-Moreno
2012 Montreal Cross sectional Positive
Thomas & DeRobertis
2013 N/A Review Positive
Lusk et al. 2013 USA (19 cities) Cross sectional Positive
De Rome et al. 2014 Australia Capital Territory
Longitudinal Positive
The results from the above mentioned studies are summarized in Table 1. These results confirm
that, as mentioned above, meso- and micro-analysis at the local level are much less conclusive with
205
210

regard to the positive effects of bikeways on cycling safety than one might expect from statistics at
a national scale. Therefore, it is necessary to continue developing studies on the effectiveness of
bicycle paths at the meso- and micro-levels, i.e. at cities and at some selected infrastructures, in
order to elucidate the actual effect of each specific bicycle facility on cycling safety, and how this
effect is produced.
215
3.- DATA AND METHODOLOGY
The data used in our analysis are shown in Table 2. We use as a primary source for bicycle traffic
accidents the microdata database of the Spanish Traffic Authority (Dirección General de Tráfico,
DGT). These microdata are collected by the traffic police on the site of the accident. They include
data on the vehicles and/or pedestrians involved in the accident, as well as the victims of the
accident and if these victims were or not KSI. These data are shown in Table 2 for bicycle accidents
(columns 2 to 7). The Table also shows the total length (km) of the network of cycle tracks and the
number of bicycle trips (millions), as well as the risk of cycling, defined with regard to collisions
between bicycles and motor vehicles for the reasons explained below.
The evolution of the city's cycle track network was described by some of the authors in some
previous works (Marques et al., 2014; Marqués et al, 2015). In 2006 and before the city had 12 km
of unconnected cycle tracks, plus 7 km of shared paths for recreational purpose along the
Guadalquivir River. Along the year 2007 the Municipality built 65 km of new cycle tracks, so that
the city had a network of 77 km of cycle tracks (see Marqués et al., 2015; Fig. 1). In 2013 the
length of the network reached 164 km, from which 152 were cycle tracks and the remaining 12 km
shared paths, most of them for recreational purpose. People allowed to ride on cycle tracks in
Seville are cyclists, skaters (not skateboards) and disabled people who use wheelchairs. In practice,
however, almost all users are cyclists.
Table 2 also includes the total number of bicycle trips in the city, which were computed from 2006
to 2013 using the methodology reported by Marqués et al. (2015) and subsequently by Hernández-
Herrador et al. (2014). This methodology basically consisted in measuring, from counts at some
representative places of the city (mainly on the cycle track network), the percentage of trips made
220
225
230
235
240

on public and private bicycles. Since the total number of trips (rentals) made on public bikes is
recorded daily by the operator of the public bike sharing system, the total number of trips made on
any kind of bicycle can be easily extrapolated from these data and from the measured percentage of
trips on public bikes. This methodology began to be used in 2011. For years before 2011, we used
the counts made by the municipality, and estimated the evolution of the total number of bicycle
trips from the average daily bicycle traffic measured in such counts (Marqués et al., 2015).
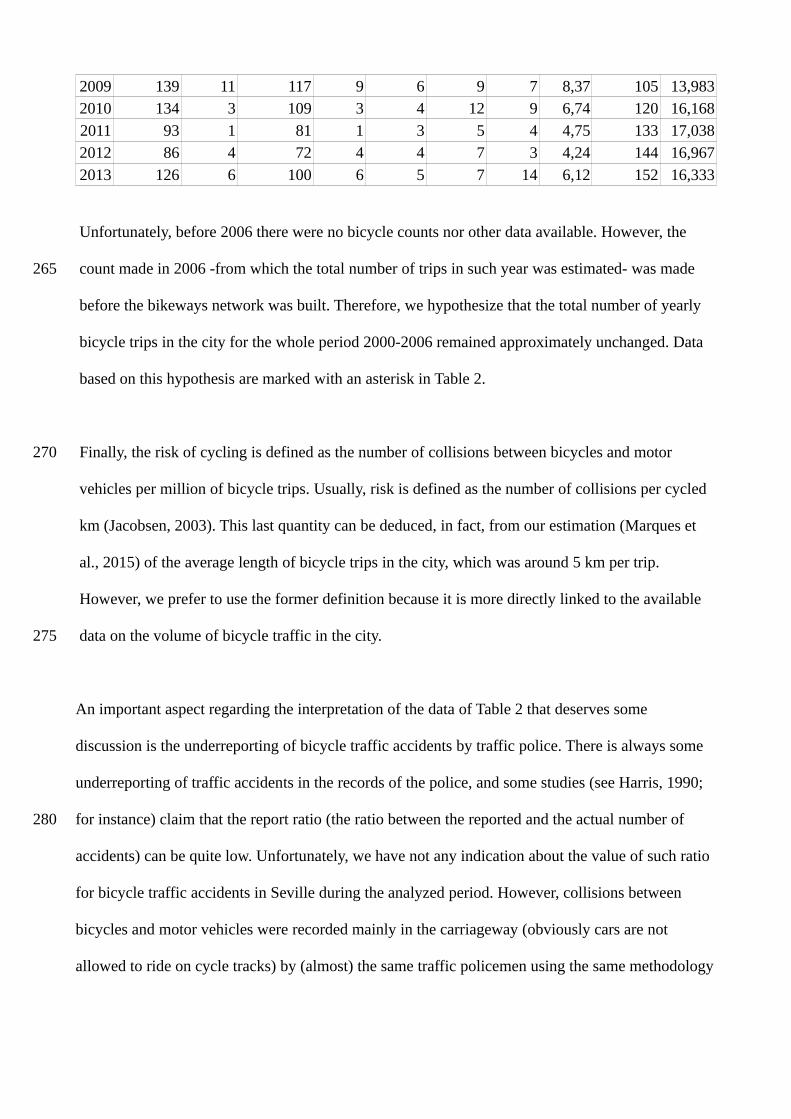
Table 2:
Bicycle traffic accidents recorded in the city of Seville by the traffic police (columns 2
to 7), risk of cycling as it is defined in the text (Risk-MV), total number of km of cycle
tracks and million of bicycle trips each year. Traffic accidents include the total number
of bicycle accidents, the yearly number of cyclists killed or seriously injured (KSI) in
such accidents, the total number of collisions with motor vehicles (Bicycle-MV), the
number of cyclists KSI in such accidents (KSI-MV), the number of collisions with
pedestrians (Bicycle-peds), the number of collisions between cyclists (Bicycle-bicycle)
and the number of bicycle traffic accidents with no other vehicle involved (Bicycle
only). Asterisks (*): Estimations assuming that the volume of bicycle traffic was
unchanged between 2000 and 2006.
YearBicycle
accidentsCyclists
KSIBicycle-
MVKSI-MV
Bicycle-bicycle
Bicycle-peds.
Bicycleonly
Risk-MV
Km ofcycletracks
Milliontrips
2000 54 4 52 4 0 2 0 17.02* 12 3.055*
2001 65 8 64 8 0 0 1 20.95* 12 3.055*2002 54 9 53 9 0 1 1 17.35* 12 3.055*
2003 59 7 58 7 0 1 0 18.99* 12 3.055*2004 57 5 54 4 0 0 3 17.68* 12 3.055*
2005 42 1 38 0 0 1 3 12.44* 12 3.055*2006 56 3 48 3 1 2 5 15,71 12 3,055
2007 56 3 48 2 1 2 5 7,4 77 6,4862008 82 10 68 10 3 4 7 7,33 92 9,283
245
250
255
260
2009 139 11 117 9 6 9 7 8,37 105 13,9832010 134 3 109 3 4 12 9 6,74 120 16,168
2011 93 1 81 1 3 5 4 4,75 133 17,0382012 86 4 72 4 4 7 3 4,24 144 16,967
2013 126 6 100 6 5 7 14 6,12 152 16,333
Unfortunately, before 2006 there were no bicycle counts nor other data available. However, the
count made in 2006 -from which the total number of trips in such year was estimated- was made
before the bikeways network was built. Therefore, we hypothesize that the total number of yearly
bicycle trips in the city for the whole period 2000-2006 remained approximately unchanged. Data
based on this hypothesis are marked with an asterisk in Table 2.
Finally, the risk of cycling is defined as the number of collisions between bicycles and motor
vehicles per million of bicycle trips. Usually, risk is defined as the number of collisions per cycled
km (Jacobsen, 2003). This last quantity can be deduced, in fact, from our estimation (Marques et
al., 2015) of the average length of bicycle trips in the city, which was around 5 km per trip.
However, we prefer to use the former definition because it is more directly linked to the available
data on the volume of bicycle traffic in the city.
An important aspect regarding the interpretation of the data of Table 2 that deserves some
discussion is the underreporting of bicycle traffic accidents by traffic police. There is always some
underreporting of traffic accidents in the records of the police, and some studies (see Harris, 1990;
for instance) claim that the report ratio (the ratio between the reported and the actual number of
accidents) can be quite low. Unfortunately, we have not any indication about the value of such ratio
for bicycle traffic accidents in Seville during the analyzed period. However, collisions between
bicycles and motor vehicles were recorded mainly in the carriageway (obviously cars are not
allowed to ride on cycle tracks) by (almost) the same traffic policemen using the same methodology
265
270
275
280
over the whole period 2000-2013. Therefore, we can assume that the report ratio for collisions
between bicycles and motor vehicles remained approximately constant over such period. On the
basis of this assumption, it can be concluded that the number of bicycle and motor vehicle collisions
recorded by the traffic police is a good indicator (except by a time-independent constant) of the
actual number of such collisions in the city. Therefore, since we are interested in the time evolution
of risk rather than in their absolute value, it is methodologically correct, in the frame of such
analysis, to define risk as the ratio between the total number of collisions between bicycles and
motor vehicles reported by traffic police, and the number of bicycle trips each year. This “risk” is
shown in the ninth column of Table 2 using millions of bicycle trips as the unit for trips.
Risk of cycling could also had been defined as the ratio between the total number of bicycle traffic
accidents and the total number of bicycle trips each year. However, as it can be seen in Table 2, the
relative number of bicycle accidents other than collisions with motor vehicles increased after 2006.
This change seems natural, due to the concentration of cyclists in the cycle paths and the location
of many cycle paths on or next the sidewalks (Marqués et al., 2015). However, since traffic
policemen could be less likely to report collisions with pedestrian or with other bicycles (which
may happen outside the carriageway) than collisions with motor vehicles (which usually happen on
the carriageway), this different likelihood could have changed the report ratio for all kind of
accidents before and after 2006. For this reason, we prefer to define risk with regard only to
collisions with motor vehicles, whose report ratio has very likely remained unchanged before and
after 2006, as it was explained before. Since collisions with motor vehicles are anyway the most
frequent and also the most dangerous bicycle traffic accidents (see Table 2), we feel that this
definition still captures the most essential features of the risk of cycling. An additional advantage of
this definition is that it facilitates the direct comparison with the available analyses on risk and
safety in numbers (Jacobsen, 2003; Elvik, 2009) which also focused on collisions between bicycles
285
290
295
300
305
and motor vehicles.
Data on Table 2 shows a clear change of tendency after 2006, when the bikeways network started
to operate. There was a sudden increase in the yearly number of bicycle trips and in the yearly
number of bicycle accidents. However, the risk of cycling experienced a negative jump from values
around 17 to values around 7 or less. This sudden drop could be related to the sudden increase in
the length of available cycle tracks and/or the increase in the number of bicycle trips, according to
the safety in number theory. Moreover, since the cycle paths existing before 2007 were few and
unconnected, there was a qualitative change between 2006 and 2007, with the apparition of a cycle
network interconnecting the city. Thus, the aforementioned drop of the risk could be also related to
this qualitative change in the built environment.
In order to elucidate these relationships, we develop a multilinear regression analysis with the risk
of cycling as dependent variable and the length of the bikeways network, the number of bicycle
trips in the city, and a stepwise jump variable taking the values 0/1 before/after the bikeways
network was built, as explanatory variables. By introducing this last variable we want to include in
the analysis the possible effect of the creation of the bikeways network by itself, as a possible cause
different from the total length of bikeways.
As we mentioned in the introduction, our analysis spans over the whole 2000-2013 period (i.e.
seven years before and seven years after the implementation of the bikeways network). However,
since trip and risk data for years before 2006 come from an unchecked (although reasonable)
hypothesis, the analysis is first developed for the period 2006-2013, and then is repeated for the
whole period 2000-2013, checking for the consistency of the results.
310
315
320
325
330

In order to check for the accuracy of the "safety in numbers" theory, as it was reported by Jacobsen
(2003), we develop a nonlinear regression analysis with different powers of the number of trips as
explanatory variable, and search for the value of the exponent that minimizes the absolute value of
the constant term (see next section for a more detailed explanation). Finally, we briefly analyze the
changes in other meaningful variables, such the percentage of KSI cyclists over the total number of
bicycle traffic accidents. More details about the methodology will be given along the following
section as they become necessary.
335
340
4.- ANALYSIS AND RESULTS
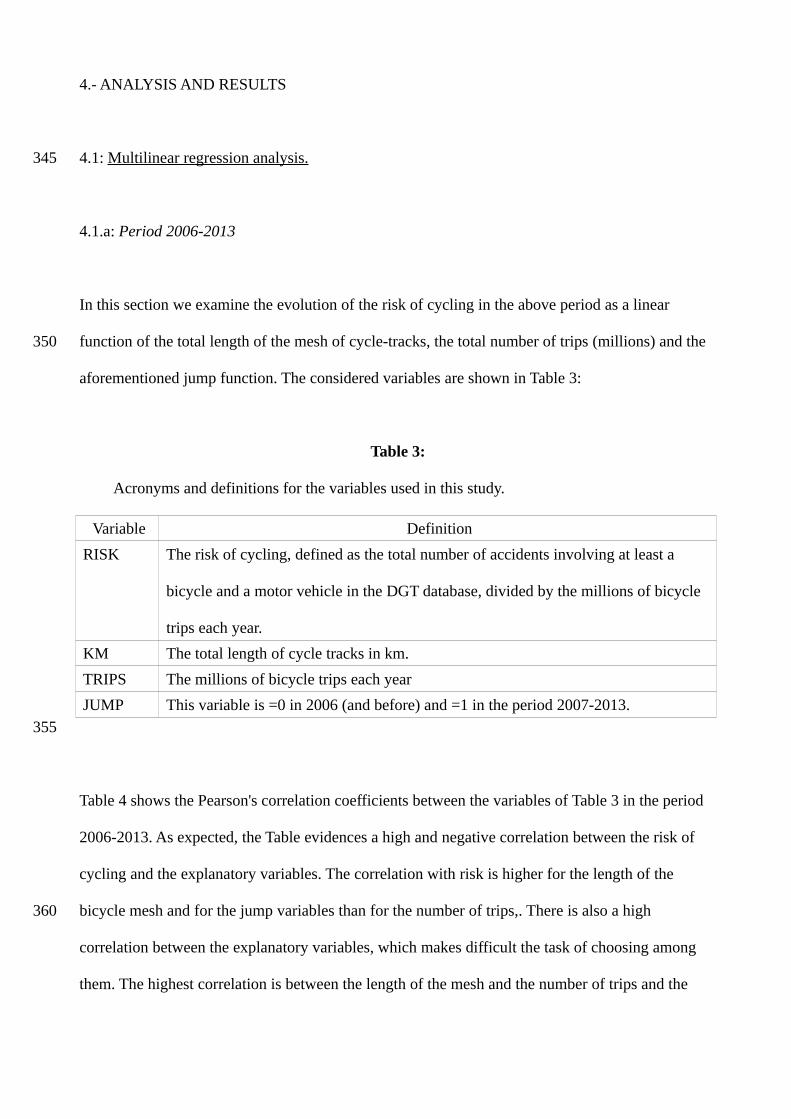
4.1: Multilinear regression analysis.
4.1.a: Period 2006-2013
In this section we examine the evolution of the risk of cycling in the above period as a linear
function of the total length of the mesh of cycle-tracks, the total number of trips (millions) and the
aforementioned jump function. The considered variables are shown in Table 3:
Table 3:
Acronyms and definitions for the variables used in this study.
Variable Definition
RISK The risk of cycling, defined as the total number of accidents involving at least a
bicycle and a motor vehicle in the DGT database, divided by the millions of bicycle
trips each year.
KM The total length of cycle tracks in km.
TRIPS The millions of bicycle trips each year
JUMP This variable is =0 in 2006 (and before) and =1 in the period 2007-2013.
Table 4 shows the Pearson's correlation coefficients between the variables of Table 3 in the period
2006-2013. As expected, the Table evidences a high and negative correlation between the risk of
cycling and the explanatory variables. The correlation with risk is higher for the length of the
bicycle mesh and for the jump variables than for the number of trips,. There is also a high
correlation between the explanatory variables, which makes difficult the task of choosing among
them. The highest correlation is between the length of the mesh and the number of trips and the
345
350
355
360
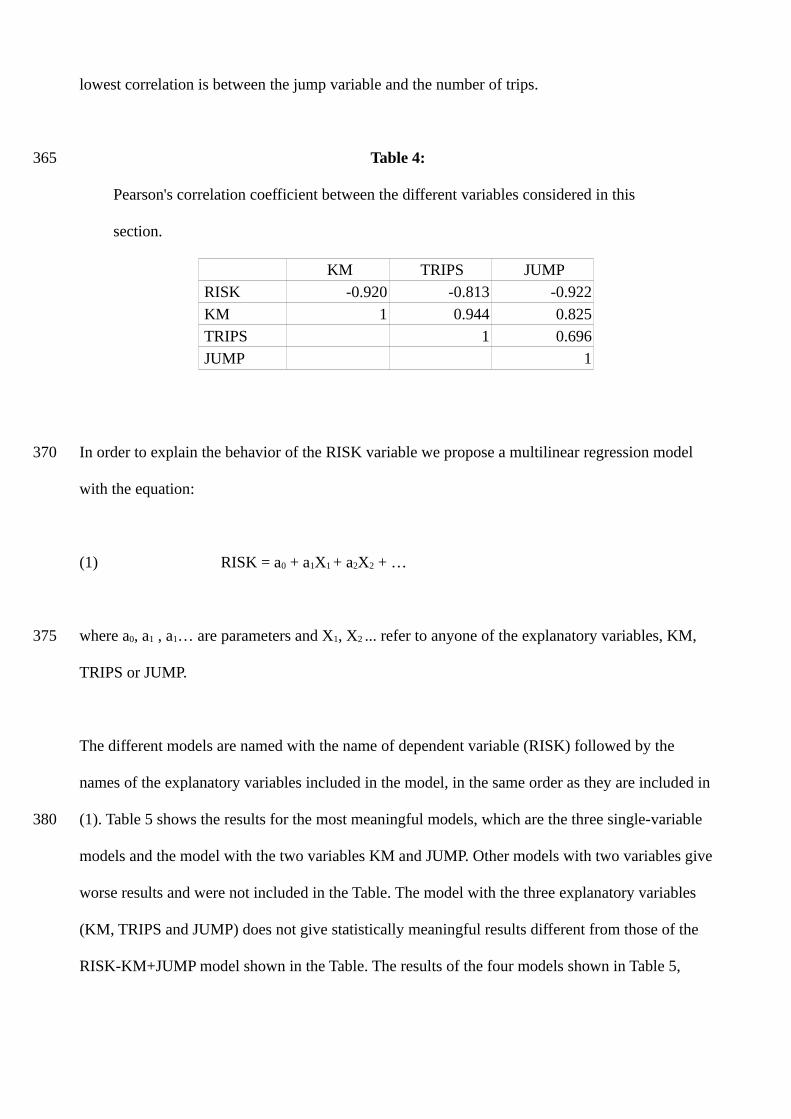
lowest correlation is between the jump variable and the number of trips.
Table 4:
Pearson's correlation coefficient between the different variables considered in this
section.
KM TRIPS JUMPRISK -0.920 -0.813 -0.922
KM 1 0.944 0.825TRIPS 1 0.696
JUMP 1
In order to explain the behavior of the RISK variable we propose a multilinear regression model
with the equation:
(1) RISK = a0 + a1X1 + a2X2 + …
where a0, a1 , a1… are parameters and X1, X2 ... refer to anyone of the explanatory variables, KM,
TRIPS or JUMP.
The different models are named with the name of dependent variable (RISK) followed by the
names of the explanatory variables included in the model, in the same order as they are included in
(1). Table 5 shows the results for the most meaningful models, which are the three single-variable
models and the model with the two variables KM and JUMP. Other models with two variables give
worse results and were not included in the Table. The model with the three explanatory variables
(KM, TRIPS and JUMP) does not give statistically meaningful results different from those of the
RISK-KM+JUMP model shown in the Table. The results of the four models shown in Table 5,
365
370
375
380

altogether with the actual values of RISK, are shown in graphic form in Figure 1.
Models in columns 2-4 of Table 5 are single-variable models, with the variables KM, TRIPS and
JUMP respectively. The model in the last column is a two-variables model with X1 = KM and X2 =
JUMP. Parameters shown are the values of the different coefficients in Eq.1, its standard errors, the
coefficient of determination R2 of the model and the F-values of the F-distribution for each model.
The last two files show the increment of R2 and the corresponding F-value of the RISK-KM+JUMP
model with regard to the RISK-KM model.
Table 5:
Parameters of the most relevant linear regression models (Eq.1) for the period 2006-
2013.
RISK-KM RISK-TRIPS RISK-JUMP RISK-KM+JUMP
a0 15.141 14.202 15.712 16.183
σ 1.417 2.090 1.488 1.131
a1 -0.072 -0.533 -9.290 -0.039
σ 0.013 0.156 1.590 0.016
a2 -5.143
σ 2.106
R2 0.847 0.661 0.850 0.930F 33.146*** 11.713** 34.1203*** 33.271***
ΔR2 0.083F(ΔR2) 5.966*
385
390
395
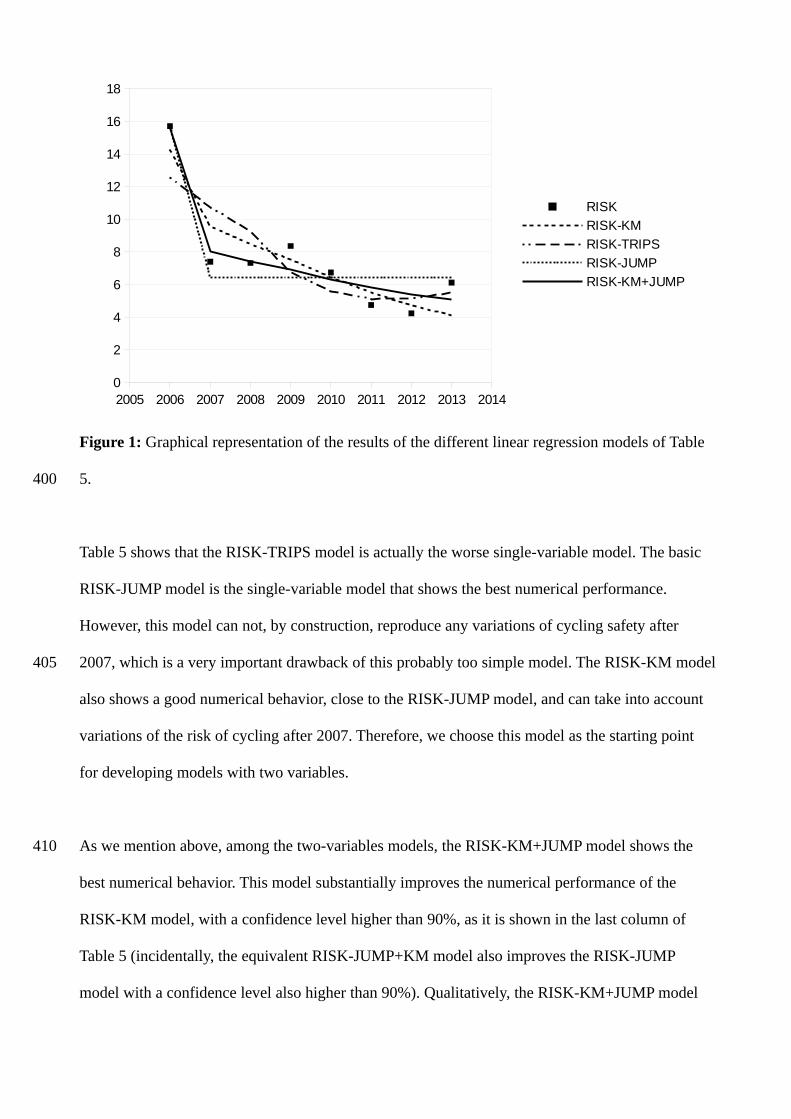
Figure 1: Graphical representation of the results of the different linear regression models of Table
5.
Table 5 shows that the RISK-TRIPS model is actually the worse single-variable model. The basic
RISK-JUMP model is the single-variable model that shows the best numerical performance.
However, this model can not, by construction, reproduce any variations of cycling safety after
2007, which is a very important drawback of this probably too simple model. The RISK-KM model
also shows a good numerical behavior, close to the RISK-JUMP model, and can take into account
variations of the risk of cycling after 2007. Therefore, we choose this model as the starting point
for developing models with two variables.
As we mention above, among the two-variables models, the RISK-KM+JUMP model shows the
best numerical behavior. This model substantially improves the numerical performance of the
RISK-KM model, with a confidence level higher than 90%, as it is shown in the last column of
Table 5 (incidentally, the equivalent RISK-JUMP+KM model also improves the RISK-JUMP
model with a confidence level also higher than 90%). Qualitatively, the RISK-KM+JUMP model
2005 2006 2007 2008 2009 2010 2011 2012 2013 20140
2
4
6
8
10
12
14
16
18
RISK
RISK-KM
RISK-TRIPS
RISK-JUMP
RISK-KM+JUMP
400
405
410

substantially improves the ability of the RISK-KM model for reproducing the big drop of the risk
of cycling between 2006 and 2007, as can be seen in Figure 1. Therefore, we can conclude that the
RISK-KM+JUMP model is the best model in the frame of the proposed multilinear regression
analysis.
4.1.b: Period 2000-2013
The data for the RISK in the period 2000-2005 shown in Table 2 are based on the hypothesis that
the yearly number of bicycle trips was constant over such period. Although it is a reasonable
hypothesis since no changes in the bicycle infrastructure happened over such period, we did not
consider these data in the previous section because this hypothesis can not be checked
independently. However, once we have a picture of the evolution of the risk of cycling in the period
2006-2013, it can be of interest to check for the consistency of such picture with the estimated data
for the whole 2000-2013 period, assuming the aforementioned hypothesis. Table 6 shows the
results of the multilinear regression analysis for such period, assuming that the number of bicycle
trips remained constant over the period 2000-2006, as it is shown in Table 2.
In addition to Table 6, Figure 2 shows these results in a graphic form. By comparing Table 6 with
Table 5 it can be seen that the parameters ai of the different models are very similar. The accuracy
of the different models shown in Table 6 is slightly worse than for the models shown in Table 5,
something that could be due to the inaccuracy of the assumed hypothesis for the number of trips in
the period 2000-2006. However, the different models still describe the evolution of the risk with
good accuracy, and the qualitative considerations made in the previous section about the relative
explanatory value of the different models still hold. Thus, we can conclude that the analysis for the
period 2000-2013 is consistent with the analysis for the period 2006-2013, provided the yearly
415
420
425
430
435

number of bicycle trips is assumed constant in 2006 and before.
Table 6:
Parameters of the linear regression models (Eq.1) for the period 2000-2013. The
parameters listed in the Table are the same as in Table 5.
RISK-KM RISK-TRIPS RISK-JUMP RISK-KM+JUMP
a0 17.957 18.841 17.162 17.633
σ 0.950 1.342 0.814 0.877
a1 -0.095 -0.839 -10.739 -0.039
σ 0.011 0.130 1.151 0.031
a2 -6.593
σ 3.464
R2 0.859 0.777 0.879 0.894F 73.315*** 41.715*** 87.000*** 46.478***
ΔR2 0.035F(ΔR
2)3.622*
Figure 2: Graphical representation of the results of the different linear regression models of Table
5.
1998 2000 2002 2004 2006 2008 2010 2012 20140
5
10
15
20
25
RISK
RISK-KM
RISK-TRIPS
RISK-JUMP
RISK-KM+JUMP
440
445
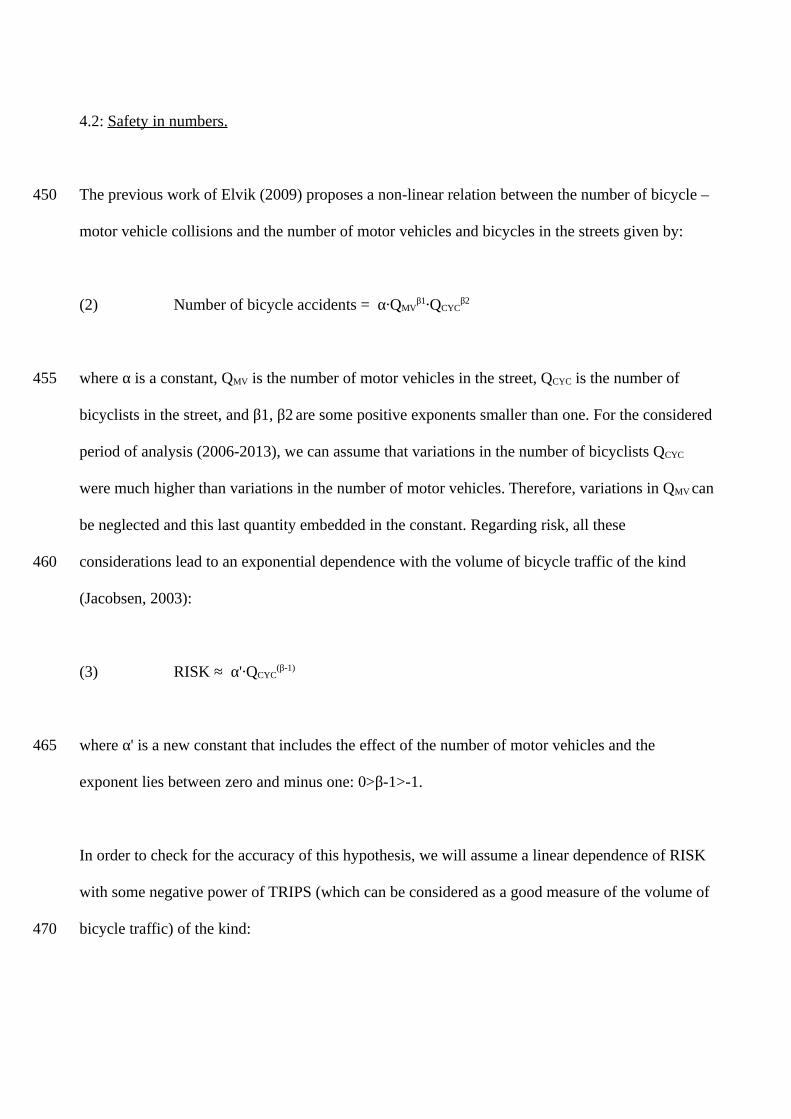
4.2: Safety in numbers.
The previous work of Elvik (2009) proposes a non-linear relation between the number of bicycle –
motor vehicle collisions and the number of motor vehicles and bicycles in the streets given by:
(2) Number of bicycle accidents = α∙QMVβ1∙QCYC
β2
where α is a constant, QMV is the number of motor vehicles in the street, QCYC is the number of
bicyclists in the street, and β1, β2 are some positive exponents smaller than one. For the considered
period of analysis (2006-2013), we can assume that variations in the number of bicyclists QCYC
were much higher than variations in the number of motor vehicles. Therefore, variations in QMV can
be neglected and this last quantity embedded in the constant. Regarding risk, all these
considerations lead to an exponential dependence with the volume of bicycle traffic of the kind
(Jacobsen, 2003):
(3) RISK ≈ α'∙QCYC(β-1)
where α' is a new constant that includes the effect of the number of motor vehicles and the
exponent lies between zero and minus one: 0>β-1>-1.
In order to check for the accuracy of this hypothesis, we will assume a linear dependence of RISK
with some negative power of TRIPS (which can be considered as a good measure of the volume of
bicycle traffic) of the kind:
450
455
460
465
470
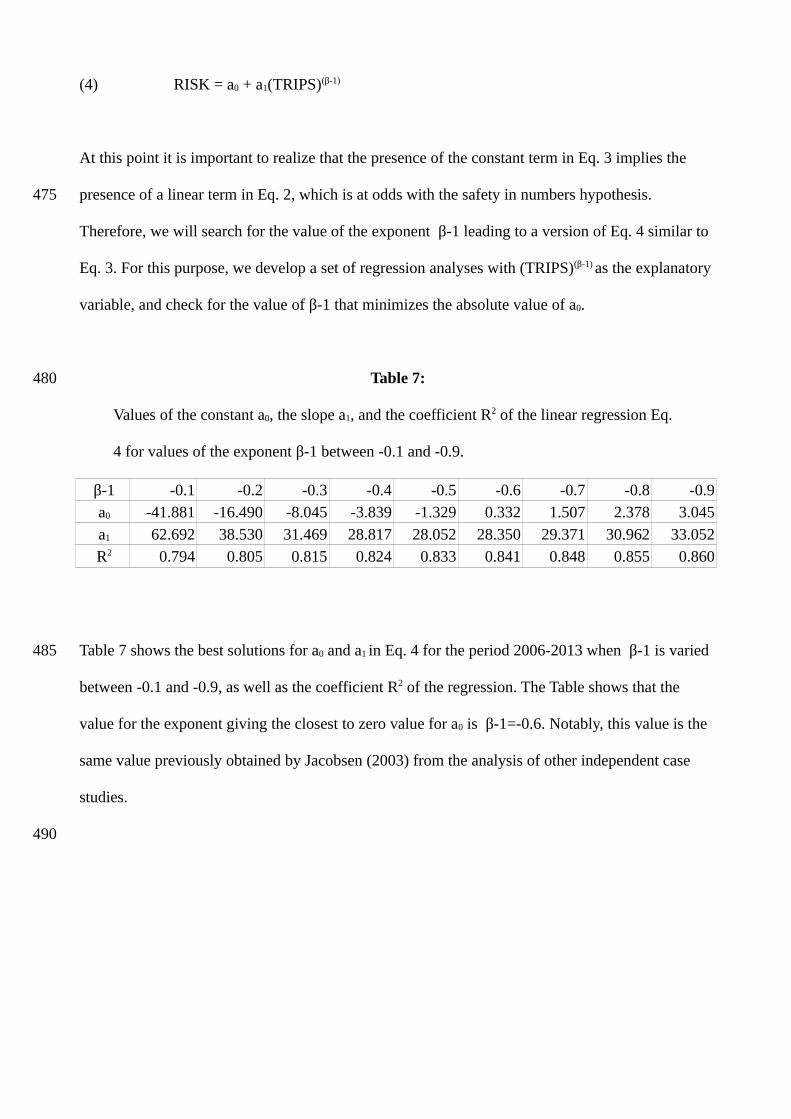
(4) RISK = a0 + a1(TRIPS)(β-1)
At this point it is important to realize that the presence of the constant term in Eq. 3 implies the
presence of a linear term in Eq. 2, which is at odds with the safety in numbers hypothesis.
Therefore, we will search for the value of the exponent β-1 leading to a version of Eq. 4 similar to
Eq. 3. For this purpose, we develop a set of regression analyses with (TRIPS)(β-1) as the explanatory
variable, and check for the value of β-1 that minimizes the absolute value of a0.
Table 7:
Values of the constant a0, the slope a1, and the coefficient R2 of the linear regression Eq.
4 for values of the exponent β-1 between -0.1 and -0.9.
β-1 -0.1 -0.2 -0.3 -0.4 -0.5 -0.6 -0.7 -0.8 -0.9a0 -41.881 -16.490 -8.045 -3.839 -1.329 0.332 1.507 2.378 3.045
a1 62.692 38.530 31.469 28.817 28.052 28.350 29.371 30.962 33.052R2 0.794 0.805 0.815 0.824 0.833 0.841 0.848 0.855 0.860
Table 7 shows the best solutions for a0 and a1 in Eq. 4 for the period 2006-2013 when β-1 is varied
between -0.1 and -0.9, as well as the coefficient R2 of the regression. The Table shows that the
value for the exponent giving the closest to zero value for a0 is β-1=-0.6. Notably, this value is the
same value previously obtained by Jacobsen (2003) from the analysis of other independent case
studies.
475
480
485
490

Figure 3: Graphic representations of the results of Eq. 4 with β-1=-0.6.
Figure 3 shows the results obtained from Eq. 4 for the risk of cycling in the period 2006-2013. By
comparing Table 7 and Figure 3 with Table 2 and Figure 1, we can see that the results of the
approximation given by Eq.4 with β-1=-0.6 are substantially better that the results obtained from
the linear model RISK-TRIPS studied in Section 3.1.a. However, they are still worse than results of
the model RISK-KM+JUMP studied in the previous sections.
4.3: Additional considerations
Besides the studied risk of cycling, another meaningful indicator regarding cycling safety is the
percentage of KSI cyclists over the total number of bicycle traffic accidents. The number of cyclist
KSI each year is too small to develop a meaningful statistical analysis of this indicator using
regression techniques. However, it would be of interest to compare the values of such indicator
before and after the bikeways network was built. From Table 2 it can be easily realized that the
percentage of KSI cyclists over the total number of collisions between bicycles and motor vehicles
2005 2006 2007 2008 2009 2010 2011 2012 2013 20140
2
4
6
8
10
12
14
16
18
RISK
Eq. 4
495
500
505
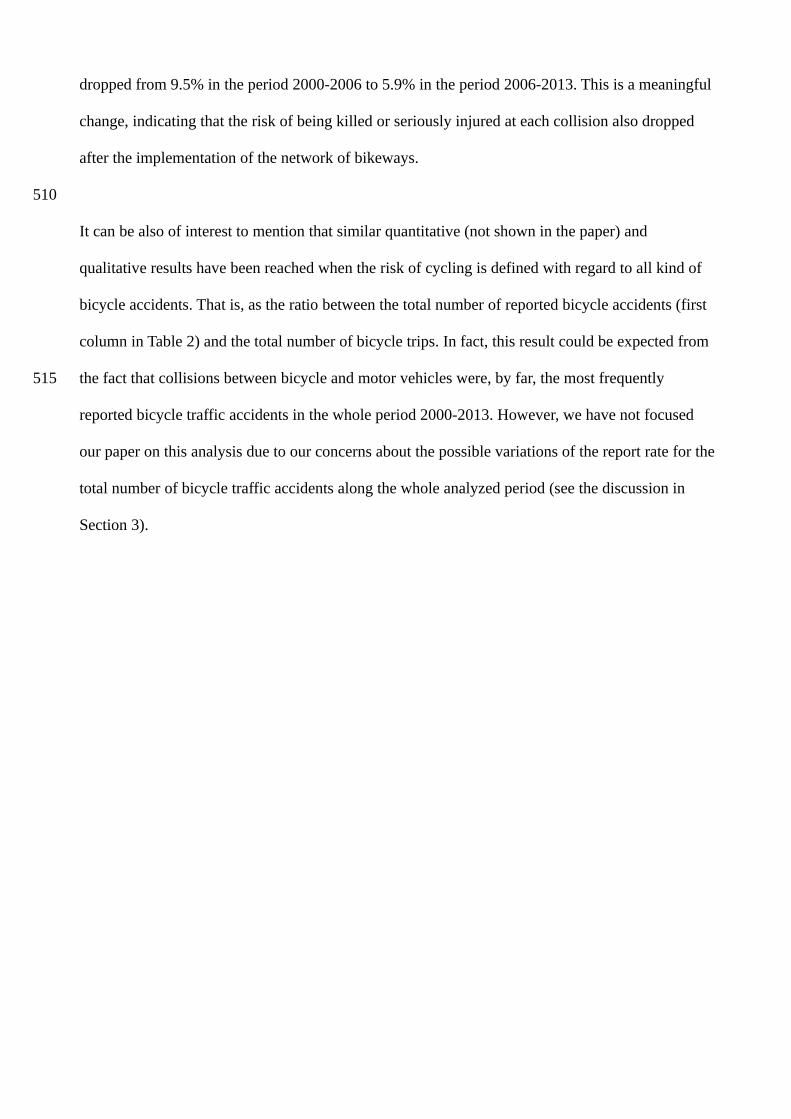
dropped from 9.5% in the period 2000-2006 to 5.9% in the period 2006-2013. This is a meaningful
change, indicating that the risk of being killed or seriously injured at each collision also dropped
after the implementation of the network of bikeways.
It can be also of interest to mention that similar quantitative (not shown in the paper) and
qualitative results have been reached when the risk of cycling is defined with regard to all kind of
bicycle accidents. That is, as the ratio between the total number of reported bicycle accidents (first
column in Table 2) and the total number of bicycle trips. In fact, this result could be expected from
the fact that collisions between bicycle and motor vehicles were, by far, the most frequently
reported bicycle traffic accidents in the whole period 2000-2013. However, we have not focused
our paper on this analysis due to our concerns about the possible variations of the report rate for the
total number of bicycle traffic accidents along the whole analyzed period (see the discussion in
Section 3).
510
515

5.- DISCUSSION
The numerical analysis developed in the previous section shows big changes in the risk of cycling
in the city of Seville in parallel to the implementation of a connected network of segregated cycle
tracks, which can be summarized as:
• Big drop of the risk of cycling after the implementation of the bikeways network, clearly
associated, through a linear relation, with the variations in the length of the network.
• Relevance of the JUMP variable (=0/1 before/after the network was built) for the linear
regression analysis of the evolution of the risk of cycling. This variable also remains relevant once
the effect of the length of the network is taken into account.
• Nonlinear variation of the risk of cycling with the number of bicycle trips, fully consistent
with the safety in numbers theory (Jacobsen, 2003).
Before to proceed with the interpretation of the above results, it would be appropriate a brief
discussion on the possible contribution to the variations of the risk of other variables, such as
changes in the population of the city, changes in the volume of motorized traffic, traffic calming
policies or other changes in the built environment. Changes in population were not meaningful in
the whole period from 2000 to 2013, where the population of the city remained more or less
unchanged around 700.000 inhabitants. Regarding the influence of the volume of motorized traffic,
the annual average daily traffic (AADT) in the main city avenues dropped between 2007 and 2013
by a -16%, partly due to the increase in the modal share of bicycles. A 16% is a meaningful
percentage, but much less than the increase of bicycle trips, which was higher than 400%, or than
the increase in the length of bikeways, which was higher than a 1,000%. Therefore, it can not be
expected a contribution of changes in the AADT to the variation of the risk of cycling comparable
to the contribution of the aforementioned variables. In fact, it has been numerically checked that
520
525
530
535
540

the contribution of adding the AADT to the best model of Table 5 (RISK-KM+JUMP) is not
significant, and that the contribution to the other single variable models is very small.
Traffic calming policies, such as generalized speed limits and/or shared traffic areas, have a
potentially high impact on pedestrians and cyclists safety. These policies, however, were poorly
developed in Seville during the analyzed period. Only for a few months in 2011 restrictions to
motorized traffic were imposed in the historical center of the city, but these restrictions were soon
removed after a change in the city government. Therefore, the reported drop in the risk of cycling
can not be attributed to the impact of such policies. There were, however, other meaningful
changes in the built environment during the analyzed period, such as the pedestrianization of some
areas, mainly at the historical center but also at some streets nearby (Castillo-Manzano et al.,
2014). Since bicycle traffic on such areas was allowed, some impact of such pedestrianization on
cycling safety can be expected. However, the comparative size/length of these new pedestrian
areas with regard to the total length of cycle paths is small (a few km as much). Therefore, no
substantial effects on cycling safety can be expected aside the already considered effects of the total
length of cycle paths.
Numerical regression analyses, as well as other numerical approaches, can reveal the presence of
relationships between numerical variables simultaneously measured, but they do not directly reveal
the causality between them. That is, causality behind these relationships can flow, in principle, in
any sense (or in both) between the different variables. An example of this concept is the discussion
about causality behind “safety in numbers” already cited in the Introduction (Wegman, 2012).
Therefore, in order to identify the causality behind the relations found in our numerical analysis, it
is necessary to introduce other considerations, coming from the qualitative analysis of the “history”
of the analyzed facts.
545
550
555
560
565

From this point of view, it becomes apparent that it was the political decision of implementing the
network of bikeways which triggered the whole process leading to the reported substantial
reduction in the risk of cycling after 2007 (Marques et al, 2015). It remains, however, the question
of how this causal relationship worked. There was a direct relation between the implementation of
the network and the decrease of risk, or it worked through the increase of the number of bicycle
trips through a safety in numbers effect?. The fact that the variables directly related to the
implementation of the network of bikeways (KM and JUMP) also were the variables better related
with the drop in RISK in the regression analysis, suggest that it was the implementation of the
network which directly caused the big drop on risk. According to this interpretation, the main
causality flow was directly from the implementation of the bikeways network to the drop of risk,
and from this drop to the increase in the number of trips, according to the aforementioned
Wegman's hypothesis.
This interpretation is consistent with the specific characteristics of the network built in the city.
Three main characteristics of this network were continuity, connectivity and segregation (Marques
et al., 2015). This means that the network was designed and built in order to cover, from the very
beginning (just at the end of 2007), most of the whole city territory (see Marques et al, 2015; Fig. 1
and Table 2). In addition, the whole network was segregated from motorized traffic, thus offering
safe connections between all neighborhoods of the city and reducing the risk of cycling. Under
these circumstances, it is not strange that many potential cyclist felt safe enough to ride their bikes
through the city as an utilitarian vehicle, thus causing the subsequent big increase in the number of
bicycle trips in the city.
Obviously, this interpretation must be nuanced taking into account the fact that increasing the
570
575
580
585
590
number of cyclists in the bikeways also implies increasing the number of cyclists in the ordinary
carriageway (not all streets have cycle paths and intersections are unavoidable), and that this
increase of the number of cyclists in the carriageway also may produce an increase in the safety of
cycling through a direct “safety in numbers” effect. Therefore, the causal relations between risk and
“number of cyclists” should have been complex and bidirectional.
When we analyzed the relation between the risk of cycling and the variables related to the
implementation of the bikeways network (KM and JUMP), we realized that the best correlation
was with the quite simple JUMP variable, taking different values before and after the network was
built. There is also a clear relation between cycling safety and the total length of bikeways, but the
addition of the aforementioned JUMP variable substantially improves the model. This fact deserves
some discussion. The JUMP variable was designed in order to take into account the effect of
networking the bikeways as a cause different from the increase of the total length of bikeways.
Therefore, we can conclude that connecting the bikeways making a network had a big impact on
cycling safety by itself, and that such impact did go beyond the mere addition of the effects of each
individual bikeway. Once again, this interpretation is consistent with the specific characteristics of
continuity and connectivity of the cycle network of Seville (Marques et al., 2015).
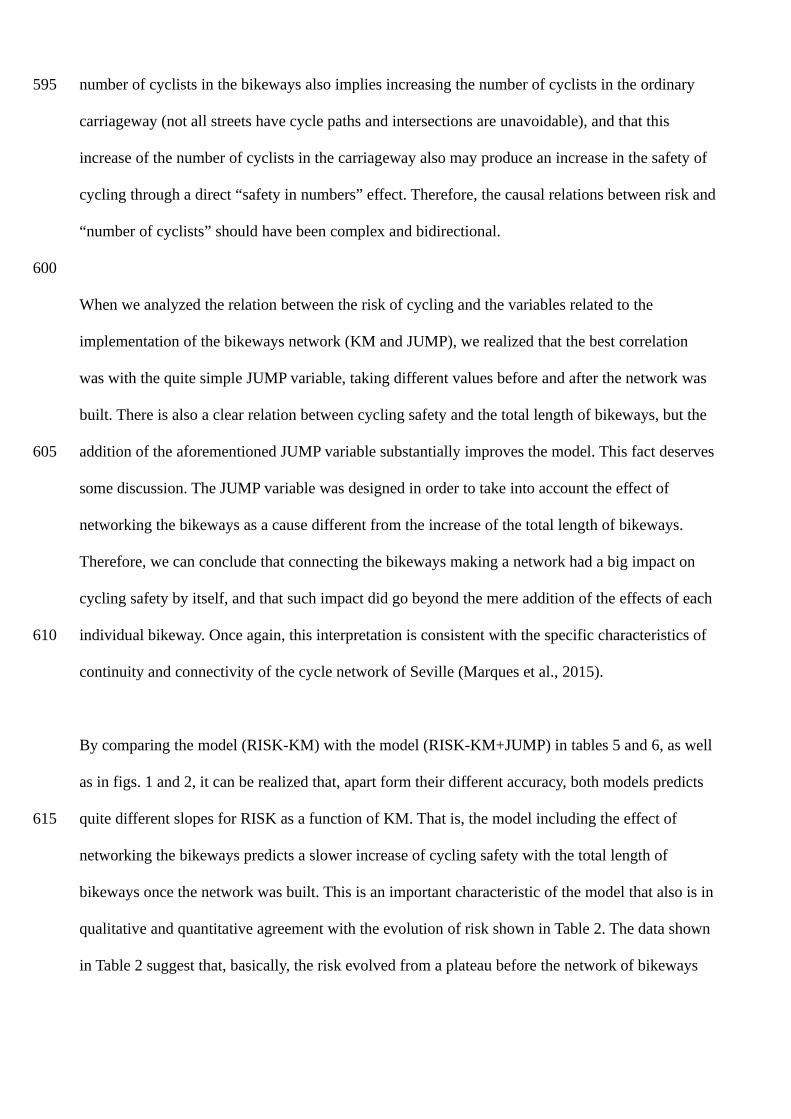
By comparing the model (RISK-KM) with the model (RISK-KM+JUMP) in tables 5 and 6, as well
as in figs. 1 and 2, it can be realized that, apart form their different accuracy, both models predicts
quite different slopes for RISK as a function of KM. That is, the model including the effect of
networking the bikeways predicts a slower increase of cycling safety with the total length of
bikeways once the network was built. This is an important characteristic of the model that also is in
qualitative and quantitative agreement with the evolution of risk shown in Table 2. The data shown
in Table 2 suggest that, basically, the risk evolved from a plateau before the network of bikeways
595
600
605
610
615

was present to another plateau after such network was present, with a slow decay in time
simultaneously to the increase in the length of bikeways. This qualitative behavior could not have
been predicted so well by a model taking into account only the effect of the length of the network
of bikeways (see Figs. 1 and 2). Such predictions of the model have important consequences for the
design of future planning policies aimed to further improve cycling safety. If the aforementioned
RISK-KM+JUMP model is valid, this means that the benefits that could be expected from the mere
extension of the network of bikeways would be smaller or comparable to the benefits coming from
other policies, such as traffic calming or restrictions to motorized traffic. Obviously, this not means
that implementing the network of bikeways was useless: In fact, the effect of the JUMP variable is
present because the network was built. It only means that, once the network was built, we must also
look at other measures in order to further improve cycling safety.
The inclusion in the models of a variable taking into account the connectivity can be of wide
interest for the analysis of the effect of bikeways on cycling safety in other contexts. For instance,
it could help to explain the aforementioned gap between the analyses of the impact of bikeways on
cycling safety at the macro-scale of countries and regions, and at the micro-scale of single
bikeways. Since this last analysis can not take into account connectivity, the actual contribution of
the whole system of bikeways can be underestimated by such analyses. Implementing this variable
in the analysis may not be a simple task. In Seville, it was because the basic network was built in
just one year. Therefore, connectivity could be incorporated to the model by just using a jump
variable. In other scenarios this incorporation may be more complex.
From the point of view of the design of network of bikeways, the above analysis highlights the
importance of connectivity for such design. Therefore, including such variable in the models to
analyze and predict the effects of these networks, as we propose in this work, can be of key
620
625
630
635
640

importance. Including connectivity in the models has two obvious qualitative predictions. If the
network is designed with a high degree of connectivity, its short term impact on cycling safety (and
therefore on the usage of the bike as an utilitarian mode of transport) will be higher than expected
from the analysis of single bikeways. Conversely, once the connectivity of the network has been
ensured, other measures such as traffic calming and/or restrictions to motorized traffic become
more and more important for cycling safety.
645
650
4.- CONCLUSIONS
The evolution of the risk of cycling in the city of Seville during the period 2006-2013 has been
analyzed and, under some reasonable hypothesis, this analysis has been extended to the period
2000-2013. The aforementioned risk of cycling is defined as the yearly ratio between the total
number of bicycle collisions with motor vehicles and the total number (millions) of bicycle trips.
The first outcome from our analysis is the evidence of a clear drop of the risk of cycling in the city
just after the bikeways network was built.
To better understanding this phenomenon, we analyzed the effects on the risk of cycling of the total
length (km) of cycle tracks, of the number (millions) of bicycle trips and of an “ad hoc” jump
variable which takes the values 0/1 before/after the cycle network was built. This jump variable
was designed in order to include in the analysis the effect of the creation of the cycle network by
itself, as a different effect from the mere increase of the length of bikeways. The analysis shows
that the best single-variable regression is with the aforementioned jump variable, followed by the
regression with the length of the mesh of bikeways. The best regression with two variables includes
the total length of bikeways and the aforementioned jump variable. In all cases this jump variable is
present. Therefore we conclude that this "effect of the network" must be considered as a relevant
effect, besides the obvious effect of the length of the mesh.
We also investigated the presence of a “safety in numbers” effect. We found that the most
consistent model relating risk and number of bicycle trips was that postulating a relation between
the risk and the volume of bicycle traffic through a fractional negative exponent β-1=-0.6. This
result is in perfect agreement with the previous result of Jacobsen (2003). Therefore, our analysis
provides an independent numerical confirmation of the theory of “safety in numbers” as it was
655
660
665
670
675

previously developed by such author. Our analysis also shows that the percentage of killed or
seriously injured cyclists over the total number of bicycle traffic accidents, also dropped after the
implementation of the network of cycle tracks in 2007.
The causal relationships between the different variables of the model have been discussed from an
historical and qualitative perspective, taking into account the main characteristics of the network of
bikeways and the historical evolution of the urban environment. Our interpretation is that the
primary cause for the aforementioned big drop of risk was the implementation of the network of
bikeways, and that the subsequent reduction of risk was the primary cause for the increase in the
number of bicycle trips. However, since not all the streets have bikeways, other more complex
causal relationships should be present, such as a direct “safety in numbers” effect due to the
increase in the number of cyclists in the carriageway without bikeways. Therefore, our
interpretation postulates a bi-directional causal relationship between “numbers” and safety.
Our main conclusion regarding policies aimed to promote cycling safety in the city of Seville was
the confirmation of the importance of the decision of creating a complete network of bikeways
covering the whole city instead of just continue making isolated bikeways. Future policies aimed
to further increase cycling safety in the city should, however, take into account the need of
complementing the extension of the network of bikeways with other measures such as traffic
calming and/or restrictions to motorized traffic, which have been yet poorly developed in the city.
We feel that our analysis sheds light on the debate about the effect of bikeways on cycling safety,
highlighting the positive effect of networking such bikeways. We think that the present
methodology could be also of interest for other cities that also are developing policies aimed to
promote utilitarian cycling. Other topic of interest for future research is the analysis of the effect of
680
685
690
695
700

bikeways on bicycle traffic accidents other than collisions with motor vehicles, such as accidents
involving pedestrians and/or other cyclists.
705

ACKNOWLEDGMENTS
We acknowledge the Spanish Dirección General de Tráfico for kindly providing the accident data
for this analysis. We also acknowledge the Department of Electronics and Electromagnetism of the
University of Seville for supporting this research.
This research did not receive any specific grant from funding agencies in the public, commercial,
or not-for-profit sectors.
710

REFERENCES
Agerholm, N., Caspersen, S., & Lahrmann, H. (2008). Traffic safety on bicycle paths: results from
a new large scale Danish study. International Cooperation on Theories and Concepts in Traffic
Safety.
Castillo-Manzano, J. I., & Sánchez-Braza, A. (2013). Managing a smart bicycle system when
demand outstrips supply: the case of the university community in Seville. Transportation, 40(2),
459-477.
Castillo-Manzano, J. I., Lopez-Valpuesta, L., & Asencio-Flores, J. P. (2014). Extending
pedestrianization processes outside the old city center; conflict and benefits in the case of the city
of Seville. Habitat International, 44, 194-201.
Castillo-Manzano, J. I., López-Valpuesta, L., & Marchena-Gómez, M. (2015a). Seville: A city with
two souls. Cities, 42, 142-151.
Castillo-Manzano, J. I., Castro-Nuño, M., & López-Valpuesta, L. (2015b). Analyzing the transition
from a public bicycle system to bicycle ownership: A complex relationship. Transportation
Research Part D: Transport and Environment, 38, 15-26.
Chen, L., Chen, C., Srinivasan, R., McKnight, C. E., Ewing, R., & Roe, M. (2012). Evaluating the
safety effects of bicycle lanes in New York City. American journal of public health, 102(6), 1120-
1127.
715
720
725
730
735
De Rome, L., Boufous, S., Georgeson, T., Senserrick, T., Richardson, D., & Ivers, R. (2014).
Bicycle crashes in different riding environments in the Australian capital territory. Traffic injury
prevention, 15(1), 81-88.
Dekoster, J., Schollaert, U., & Bochu, C. (2000). Cycling: the way ahead for towns and cities.
Office for Official Publications of the European Communities.
Elvik, R. (2009). The non-linearity of risk and the promotion of environmentally sustainable
transport. Accident Analysis & Prevention, 41(4), 849-855.
Elvik, R. (2010). Why some road safety problems are more difficult to solve than others. Accident
Analysis & Prevention, 42(4), 1089-1096.
Forester, J. (2001). The bicycle transportation controversy. Transportation Quarterly, 55(2), 7-17.
Gårder, P., Leden, L., & Thedéen, T. (1994). Safety implications of bicycle paths at signalized
intersections. Accident Analysis & Prevention, 26(4), 429-439.
Jacobsen, P. L. (2003). Safety in numbers: more walkers and bicyclists, safer walking and
bicycling. Injury prevention, 9(3), 205-209.
Jensen, S. U. (2007). Bicycle tracks and lanes: a before-and-after study. Transportation Research
Record, TRB, National Research Council, Washington, DC.
Harris, S. (1990). The real number of road traffic accident casualties in the Netherlands: a year-
740
745
750
755
760

long survey. Accident Analysis & Prevention, 22(4), 371-378.
Hernández-Herrador, V., Calvo-Salazar, M., Marqués, R. (2014) Evaluación del uso de la bicicleta
en la ciudad de Sevilla, Noviembre de 2013. Available at:
http://personal.us.es/marques/Sevilla2013.pdf
Lusk, A. C., Furth, P. G., Morency, P., Miranda-Moreno, L. F., Willett, W. C., & Dennerlein, J. T.
(2011). Risk of injury for bicycling on cycle tracks versus in the street. Injury prevention, 17(2),
131-135.
Lusk, A. C., Morency, P., Miranda-Moreno, L. F., Willett, W. C., & Dennerlein, J. T. (2013).
Bicycle guidelines and crash rates on cycle tracks in the United States. American journal of public
health, 103(7), 1240-1248.
Marqués, R., Hernández-Herrador, V., & Calvo-Salazar, M. (2014). Sevilla: a successful experience
of bicycle promotion in a Mediterranean context. WIT Transactions on Ecology and the
Environment, 191, 769-781.
Marqués, R., Hernández-Herrador, V., Calvo-Salazar, M., & García-Cebrián, J. A. (2015). How
infrastructure can promote cycling in cities: Lessons from Seville. Research in Transportation
Economics, 53, 31-44.
Martens, K. (2004). The bicycle as a feedering mode: experiences from three European countries.
Transportation Research Part D: Transport and Environment, 9(4), 281-294.
765
770
775
780
785
Nosal, T., & Miranda-Moreno, L. F. (2012). Cycle-Tracks, Bicycle Lanes, and On-street Cycling in
Montreal, Canada: A Preliminary Comparison of the Cyclist Injury Risk. In Transportation
Research Board 91st Annual Meeting (No. 12-2987).
Pasanen, E., (2001). The Risks of Cycling. Helsinki City Planning Department, Finland.
Ploeger, J., Kroeze, P.A., Ditewig, R., Dijkstra, A., Godefrooj, T.P.F., Immerzeel, J.W., Salomons,
W., Wink, E.D., Zeegers, Th. (2007) Design Manual For Bycicle Traffic. CROW The Netherlands.
Pucher, J. (2001). Cycling safety on bikeways vs. roads. Transportation Quarterly, 55(4), 9-11.
Pucher, J., & Buehler, R. (2008a). Cycling for everyone: lessons from Europe. Transportation
Research Record: Journal of the transportation research board, (2074), 58-65.
Pucher, J., & Buehler, R. (2008b). Making cycling irresistible: lessons from the Netherlands,
Denmark and Germany. Transport Reviews, 28(4), 495-528.
Pucher, J., Dill, J., & Handy, S. (2010). Infrastructure, programs, and policies to increase bicycling:
an international review. Preventive medicine, 50, S106-S125.
Pucher, J., & Buehler, R. (2012). City cycling. MIT Press.
Reynolds, C. C., Harris, M. A., Teschke, K., Cripton, P. A., & Winters, M. (2009). The impact of
transportation infrastructure on bicycling injuries and crashes: a review of the literature.
Environmental Health, 8(1), 1.
790
795
800
805
810
Teschke, K., Harris, M. A., Reynolds, C. C., Winters, M., Babul, S., Chipman, M., ... & Monro, M.
(2012). Route infrastructure and the risk of injuries to bicyclists: a case-crossover study. American
journal of public health, 102(12), 2336-2343.
Thomas, B., & DeRobertis, M. (2013). The safety of urban cycle tracks: A review of the literature.
Accident Analysis & Prevention, 52, 219-227.
Wardlaw, M. J. (2014). History, risk, infrastructure: perspectives on bicycling in the Netherlands
and the UK. Journal of Transport & Health, 1(4), 243-250.
Wegman, F. C. M., & Dijkstra, A. (1988). Safety effects of bicycle facilities: The Dutch experience.
Contribution to the International Road and Traffic Conference ROADS and TRAFFIC 2000, 16th
International Study Week for Traffic Engineering and Safety, Berlin, 6-9 September 1988, Theme
4E: Safety aspects of cycle paths.
Wegman, F., Zhang, F., & Dijkstra, A. (2012). How to make more cycling good for road safety?.
Accident Analysis & Prevention, 44(1), 19-29.
Welleman, A. G., & Dijkstra, A. (1988). Safety Aspects of Urban Cycle Tracks.
815
820
825
830
835