on the efficient production of metastable oxygen from...
TRANSCRIPT

American Institute of Aeronautics and Astronautics
1
On Optimizing the Metastable Oxygen Production from Electrical Discharges
Svetozar Popovic, Old Dominion University, Norfolk, VA; Milka Nikolic, Old Dominion University, Norfolk, VA; Janardan Upadhyay, Old Dominion University, Norfolk, VA; Leposava Vuskovic, Old Dominion University, Norfolk,
VA AIAA-2010-5042
41st Plasmadynamics and Lasers Conference, Chicago, Illinois, June 28-1, 2010
On the Efficient Production of Metastable Oxygen from
Electrical Discharges
Svetozar Popović * †, Milka Nikolić.
‡, Janardan Upardhyay
§, and Leposava Vušković
**
Old Dominion University, Norfolk, VA 23529
We investigate the performance of a cavity microwave discharge (MWD) operating in tandem with a
dielectric barrier discharge (DBD). Tandem discharge operates in helium/oxygen mixtures, where
metastable molecular oxygen can be produced efficiently using MWD in proportionally large quantities
(order of 20% of total oxygen number density). In this new arrangement, DBD provides the metastables-
rich mixture to MWD, thereby providing seeding and modifying the discharge kinetics. Both discharges
operate in synchronized pulse repetitive mode, which is tailored to maximize power efficiency of the
oxygen metastable production. The system operates at pressures up to 350 Torr at average power between
3 to 20 Watt.
Nomenclature
E = average electric field
V = effective voltage across McCarroll cavity
d = effective discharge diameter
α = form factor
d0 = inner diameter of the tube
Z = microwave cavity impedance
P = power absorbed in microwave cavity
Pf = forward power
Pr = reflected power
PA = microwave power factor
Γ = reflection coefficient
s = standing wave ratio (SWR)
N = total average number density
Nx = number of exposed O2 molecules
NO2 = O2 number density
NSDO = O2(1Δ g) number density
NSSO = O2 (b1Σg
+) number density
k = Boltzmann constant
T = gas-kinetic temperature
p = pressure
* Professor, Department of Physics, AIAA Senior Member
‡ Graduate Student, Department of Physics.
§ Graduate Student, Department of Physics..
** Professor and Eminent Scholar, Department of Physics

American Institute of Aeronautics and Astronautics
2
W = total energy deposited in the discharge
W0 = chord
dt = time step
v = linear velocity of particles in the flow
A = tube cross-section area
r = O2/He number density ratio
f = total flow rate
fHeO2 = flow rate of premixed He/O2 mixture
fHe = He flow rate
fO2 = O2 flow rate
YSDO = O2(1Δ g) yield
YSSO = O2 (b1Σg
+) yield
I. Introduction
XYGEN molecule has seven long-living metastable states located in the energy diagram below the first
dissociation limit, at 5.1eV, approximately. Most interesting are the three singlet states, a1g (Oxygen Singlet
Delta – OSD), b1Σg
+ and c
1Σu
- (Oxygen Singlet Sigma – OSS). Transition from the singlet states to the oxygen
ground state, 3Σg
-, represents a magnetic dipole transition (singlet-triplet intercombination). Hence their low
transition probability and long life time: more than 2000 s for OSD, and 3 to 7 s for OSS (See Table I)1. Rather
difficult to observe by conventional spectroscopy techniques, these states, especially the OSD, have became of
increased interest due to their reactivity and important role in a variety of environments, experiments and
applications2. OSD (a
1Δg) is the lowest electronically excited state of molecular oxygen with 0.977 eV above the
ground state X3Σg
- and its most efficient production would occur in discharges where the average electron energy is
about 1 eV. It turns out that average electron energy of 1 eV usually occurs at the reduced field values of about 10
Td. Unfortunately, most self-sustained and the e-beam sustained discharges operate at substantially higher reduced
electric fields and/or average electron energies. In most cases, the electrons are able to excite higher energy levels of
the molecular oxygen, such as B3Σu
- or A
3Σu
+ which will then collisionally decay into another metastable state, c
1Σu
-
or to the long-lived A’3Δu state. All these states have dissociation energy less than 1 eV and could undergo thermal
dissociation to form the ground state, O(3P), or the metastable state, O(
1D). OSD is not present at kinetic
temperatures above 2000 K where most of the oxygen is dissociated or reacted. Second prominent member of this
group is OSS (b1Σg
+). Its lowest vibrational state is about 1.63 eV above the ground state, which is within the
average energy range of electrons in most electrical discharges. Hence, electrical discharges can easily produce all
molecular oxygen metastables and two atomic metastable states. This provides a strongly reactive mixture that has
not always a well adjusted kinetics for a particular application.
List of possible atomic and molecular transitions that could be used in the detection of metastable oxygen using
optical emission spectroscopy is given in Table II. They include magnetic-dipole allowed atomic and molecular
transitions and double/binary (dimole) emission.
O

American Institute of Aeronautics and Astronautics
3
Table II - List of dipole-forbidden and dimole transitions (arranged by increasing wavelength)
Transition Designation Band origin
(cm-1
)
Wavelength
nm
Energy
eV
Obs.
A 3Σu
+→ X
3Σg
- Herzberg I 35010 286 nm 4.349
A’3Δu→ X
3Σg
- Herzberg III 34387 291 nm 4.272
c 1Σu
- → X
3Σg
- Herzberg II 32665 306 nm 4.058
A’3Δu→ a
1Δg Chamberlain 26346 380 nm 3.273
c 1Σu
- → a
1Δg 24776 404 nm 3.078
a1Δg+
b1Σg
+→2X
3Σg
-
binary 20010 476 nm 2.486 +
c 1Σu
- → b
1Σg
+ 19543 512 nm 2.428
2 a1Δg→2X
3Σg
- dimole 17240 580 nm 2.142 +
1D →
3P atomic 15872* 630.03 nm 1.972 +
2 a1Δg→2X
3Σg
- dimole 15750 634 nm 1.957 +
2 a1Δg→2X
3Σg
- dimole 14220 703 nm 1.767 +
b1Σg
+→ X
3Σg
- Atmospheric 13122 762.08 nm 1.630 +
a1Δg→ X
3Σg
- IR Atmospheric 7889 1267.59 nm 0.978
b1Σg
+→ a
1Δg Noxon 5233 1910.95 nm 0.649
For illustration, one molecular, one atomic and a dimole transition are shown in Figures 1a,b The dimole
transition is clearly visible, but rather weak and diffuse. On the other hand, the atmospheric band is remarkably
strong, especially in the post-discharge interval between two microwave pulses. Therefore, time resolved
spectroscopy could be used to obtain spectroscopic analysis of gas temperature and b state density from relative
intensities of rotational lines and from absolutely calibrated integral spectrum of the b1Σg
+(v = 0)→ X
3Σg
- (v = 0)
band. Absolutely calibrated emission spectroscopy was also used to estimate concentration of O(1D) since the
1D →

American Institute of Aeronautics and Astronautics
4
3P transition was readily seen at 630.03 nm near the pulse end and up to about 200 µs after. OSD concentrations
were determined by cavity ring down spectroscopy in the arrangement involving MWD only.
Figure 1a. b1Σg
+→ X
3Σg
- “atmospheric” band showing strong presence of OSS in the post-discharge region.
Discharge conditions: p = 300 torr, average MW forward power 12 W, average MW reflected power 0.5 W, pulse
repetition rate 1000pps, square-wave, pulse duration 300µs; DBD voltage 3 kV; flow rate 40 sccm, 97% He 0.1%
O2. Spectrum was observed side-on starting at 50µs after the pulse end, with a gate of 50µs. RR an RQ branches are
located between 759 and 762 nm. And PP and PQ branches are extended from 762 to over 770 nm.
4000
6000
8000
10000
12000
14000
622 624 626 628 630 632 634 636 638
Wavelength (nm)
Inte
nsit
y (
a.
u.)
Fig. 1b. Blue wing of a broad dimole radiation with the band origin around 634 nm is sometimes accompanied by
the atomic oxygen 1D →
3P line at 630.03 nm. Discharge conditions: p = 30 torr, average MW forward power 6 W,
average MW reflected power 0.5 W, pulse repetition rate 1000pps, square-wave, pulse duration 300µs; DBD voltage
3 kV; flow rate 40 sccm, 97% He 3% O2. Spectrum was observed end-on at 50µs after the pulse end, with a gate of
100µs.
In the following sections, we will describe the DBD and MWD separately, and their operation in tandem
configuration. We will also discuss the reduced electric field, average deposition energy and metastable oxygen
yields as the scaling parameters of MWD operating per se or in tandem with DBD. Diagnostic techniques used will
be briefly described and arguments for their use will be discussed in the following section. Last section before
0
2000
4000
6000
8000
10000
758 760 762 764 766 768 770 772
Wavelength (nm)
Inte
nsit
y (
a.u
)
R P

American Institute of Aeronautics and Astronautics
5
conclusion will cover and analyze the experimental results and discuss scaling possibilities for high pressure
operation.
II. Tandem Discharge
A. Dielectric Barrier Discharge
Scheme of the dielectric barrier discharge used in tandem with MWD is given in Figure 2, which was described
in more detail by Leiweke and Ganguly3. In Figure 2 it is presented in the individual operation mode. Quartz tube
wall is the dielectric barrier between the anode, located inside the tube, and grounded cathode, located outside the
tube. A CMOS switch defined the pulse repetitive operation of DBD. The switch was triggered by a pulse generator,
which was controlled by the pulse from MW generator, which acted as a master clock.
Figure 2. Scheme of the DBD
In its short pulse version, with voltage rise-time of 10 ns, and pulse duration up to 100 ns, this discharge
was capable of producing large concentration of metastable states, while operating in pure Ar, as shown in Fig. 3.
This property holds for any gas mixture, which we have already observed by the seeding effects DBD has on the
downstream MWD. Detailed analysis of the flow of metastables through the DBD post-discharge section is still
being made and we are not yet able to state definite composition of the MWD provided by DBD. Robust
concentration of Ar metastables shown in Fig,3, indicates potential for strong effects on MWD kinetics.

American Institute of Aeronautics and Astronautics
6
Figure 3. Ar metastable column density increase with pressure in the DBD operation as individual unit
3
B. Microwave Cavity Discharge
McCarroll cavity discharge in cw operation mode has been already successfully used for metastable oxygen
production and detection4, 5, 6
. This discharge seemed to have a convenient electron density and temperature
distribution to fit conveniently into specific energy requirement for OSD production. In most types of discharges,
average reduced electric field exceeds value of around 10 Td, which is widely considered to provide maximum
metastable state population7. In the microwave discharges the reduced electric field covers the range between 1 and
100 Td. To illustrate this we are using the simple estimate of reduced electric field obtained from the measured
discharge parameters.
Average electric field across the half-inch tube in an Evenson cavity can be evaluated from the measured of
forward and reflected power using the following relations:
f
r
frf
P
P
PPPP
sZZZ
PZV
d
VE
)1(
1
1
2
00 (1)

American Institute of Aeronautics and Astronautics
7
where E is the average electric field, V is the effective voltage across McCarroll cavity, 0dd , d0 is the
diameter of the tube, α is the form factor of the discharge – a number lower than one, P is the power absorbed by the
discharge, given as the difference between forward power Pf and reflected power Pr, Z is the impedance of the cavity
with the discharge, 500Z , s is the standing wave ratio, and
based on the distribution of the electric field across the tube, which is a combination of TM mode (along the tube
axis) and the surface wave mode (across the tube). In this configuration, the actual plasma resembles a partially
filled ellipsoid shell. At lower pressures, the shell is mostly filled and is practically homogeneous. At higher
pressure, the surface plasma structure appears more enhanced. Without going in to many details on the discharge
morphology, for present purpose we take an average form factor value of 0.8, evaluated for pressure range of 50 to
300 Torr, and absorbed power range of 10 to 100 W.
Depending on conditions, the reflection coefficient was between 0.1 and 0.7 in present experiment, the
standing wave ratio was between 1.2 and 6, and the average electric field between 20 and 90 V/cm. In this simple
approach we can estimate the average reduced electric field as the ratio of the average electric field E in the cavity
and the average number density in the discharge N:
pd
PZkT
pd
VkT
N
E f0)1( (2)
expressed in the terms of measured quantities – discharge temperature T, reflection coefficient , forward power Pf ,
and pressure p, where k is Boltzmann constant. For present experimental analysis the Eq. (2) is conveniently
transformed into
f
f
r PP
P
p
T
N
E )1(
760
2730259.0 (3)
where E/N is expressed in Td (10-17
Vcm2), T in K, p in Torr, and Pf , Pr in W. Formula for the reduced electric field
is further simplified into
Torrp
WPKTTd
N
E A
~
072.0
(4)
where
is MWD power factor. For illustration, pressure dependence of E/N based on measured pressure and temperature is
given in Figure 5. According to these data we can conclude that the optimum reduced electric value ( ~10 Td )is
crossed between 10 and 50 Torr in the power range between 20 and 100 W. For the higher pressure operation more
power has to be delivered into the discharge.
F
F
RA P
P
PP
1
~

American Institute of Aeronautics and Astronautics
8
0
5
10
15
20
25
0 20 40 60 80 100 120 140 160 180
Pressure (Torr)
E/N
(T
d)
Pf = 30 W
Pf = 60 W
Pf = 80 W
Figure 4. Reduced electric field evaluated from formula given in Eq. (4). Evaluation was made using temperature
data obtained from the OSS spectrum (0-0 atmospheric band). This procedure will be discussed later in the text.
Discharge conditions: MWD in cw operation; f =100 sccm; 97% He/ 3% O2; DBD voltage 1.5 kV; DBD repetition
rate 1000 pps.
C. Tandem Discharge
Our first goal in this work was to inspect the possibility to increase the yield of OSD in the oxygen content
of discharge mixture by inducing transition to this state by collisional/radiative recombination from the high-energy
oxygen states including other metastables and ozone. So far, all discharge-based techniques for production of OSD
relied on the excitation intensive mechanisms whereby the discharges were designed so that rate of OSD production
is obtained at minimum energy cost. Nevertheless, large concentrations of ozone and other metastables have escaped
the plasma reactor. This led not only to the energy losses, but also to the complexity that these other species brought
into the OSD chemistry.
In order to accomplish this task we combined DBD and MWD to share the same flow tube. The immediate
plan was to study the possibilities of tailoring DBD so to enhance quenching of other metastables, reduce overall
energy loss by reducing the breakdown conditions, and generate substantial ultraviolet radiation for
photodissociation of ozone. The second goal was readily fulfilled and increased dramatically the pressure range of
operation in MWD. It opened so many possibilities that we had to reduce temporarily our program just to the study
the effect of the increased pressure range.
The tandem discharge tube is shown schematically in Figure 5. Two discharges are arranged in a sequence.
Upstream discharge is a short-pulse (~50 ns, voltage rise-time 10 ns) dielectric barrier discharge with the anode
located inside the tube. This section of the tube is of rectangular cross-section so that the discharge is diffuse and
relatively homogeneous, extending for about the length of the anode at pressures higher than 30 Torr. Microwave
cavity discharge is generated in the commercial McCarroll cavity discharge (Opthos), located 8 cm downstream.
The tube section occupied by the MWD and its post-discharge is 30 cm long. Side-on observations were made
through the slit on the cavity’s short circuit plate and at various locations along the post-discharge section. End-on
observations were made through two quartz windows at both ends of the tube. Gas flow was directed from the port
upstream of DBD through both discharges to the end of the MWD’s post-discharge section. Two additional gas
ports are located in the post-discharge section of the DBD to provide inflow for atomic-oxygen quenching gas (CO2
in present work) and for other reactive gases.

American Institute of Aeronautics and Astronautics
9
Figure 5. Scheme of the experimental setup for the tandem discharge operation and diagnostics
DBD was supplied by a Glassman 20-kVgenerator, although only up to 7.5 kV was used in this work.
MWD was supplied by an Opthos modulated Microwave generator (maximum power 100 W). Triggering of DBD
and the time-resolved diagnostic tools was made using a pulse generator, where the modulated square-wave signal
from MW generator was used as the master clock. Both discharges operated at repetition rate close to 1kHz, dictated
by the limited frequency range of MW generator. Pulse generator regulated triggering of the filtered photomultiplier
tube (PMT) and ICCD (Princeton Instruments). PMT was used to observe time-resolved spectral lines from DBD. A
high-resolution spectrometer (Acton) with the ICCD was used to record post-discharge spectra of the metastable
oxygen features by side-on and end-on observation. Side-on observation was used for temperature diagnostics in the
discharge section (in post-discharge time windows), and end–on viewing had longer observation path, suitable for
recording of weak. metastable radiation. Additional low-resolution spectrometer (Ocean Optics) was used to record
spectrum in wide wavelength range - 200-900 nm. Observed radiation was transmitted to detectors with UV-visible-
near-infrared fiber optic cables. All time-resolved detection systems were calibrated using a Spectra Physics
blackbody irradiance source.
III. Diagnostic Techniques
A variant of the cavity ring down spectroscopic technique, the off-axis integral cavity optical spectroscopy
(ICOS) was used to quantitatively detect the a1g state of O2 via the hitherto unobserved (1,0) band of the b
1g+-a
1g
Noxon system. This approach allows for the quantitative detection of singlet O2 with a minimum detectable density
of 4x10¹³
molecule cm-3
at 298 K corresponding to 3x10¹²
molecules per cm-3
per quantum state. Off-axis ICOS is
convenient because it allows narrowband, continuous-wave lasers to be used in conjunction with optical cavities in a
simple and effective manner 8, 9
. The absorption signal is obtained through the temporal integration of the laser
intensity transmitted through the cavity in the same fashion as in conventional absorption measurements. The
absorption due to the medium inside the cavity is determined from the cavity output, i.e. laser transmission, which is
a function of the mirror reflectivity as well as scattering and absorption losses between the mirrors9.
The afterglow from the OSD-generating plasma (microwave discharge in the McCaroll cavity) passed
through a coupling and through the off-axis ICOS measurement system at about 3000 sccm and a variable total
pressure. Coupling device is either a quartz tube with or without a frit, or a 5 cm Teflon® tube. Frit was used to
filter out water molecules and OH radicals5. The off-axis ICOS system consisted of an 82-cm long high-finesse

American Institute of Aeronautics and Astronautics
10
optical cavity bounded by two highly reflective mirrors (R=99.9986%). The mirror reflectivity was determined by
performing a cavity-ring down measurement10
. Ring down time constant is up to 250 μs (see Fig. 6). The exact laser
frequency and tuning rate are determined by using known water absorption features and a calibrated SiO2 etalon.
The ambient water spectrum is taken after the off-axis ICOS cell is filled with about 5 Torr of ambient laboratory
air. The lines appearing in the spectrum are easily assigned to known water transitions using the HITRAN96
database11
. Diode laser output is tuned by changing the temperature of the case to the wavelength range of a
particular transition between the rotational levels of the Q branch of the Noxon a1g b
1g
+ (1,0) band. In addition,
the laser output was fine-tuned over 2 GHz frequency range in order to scan the Doppler and pressure-broadened
rotational lines. This was accomplished by supplying a saw-tooth current ramp to the laser current source, while
holding the laser case temperature constant. For calibration purpose, beam is directed prior and after the set of
spectral measurements through a fused-silica etalon. Repetition rate of the saw-tooth pulse (laser wavelength tuning
rate) is always kept at least an order of magnitude smaller than the characteristic cavity frequency. However, too low
repetition rate distorts the symmetry of the line profile. This effect is observed in most recorded line profiles, but the
error due to line profile distortion could be reduced to less than 2% by choosing carefully the sweep parameters. A
typical
Figure 6: Ringdown signal waveform in the off-axis ICOS system5.

American Institute of Aeronautics and Astronautics
11
Figure 7: A rotational line from Noxon band as observed with help of the sweep tuning of the semiconductor laser5.
absorption line shown in Fig. 7 was fitted with Voigt profiles using the approximate procedure derived by
Whiting 12
.
Besides the diagnostics of OSD, special emphasis was given to the relative density of atomic and molecular
states, which indicate the particle kinetics in the discharge. Following the ideas implemented in Ref. 5, we are
developing a link between simpler atomic-molecular optical emission spectroscopy (OES) and the OSD production.
Primary OES diagnostics was to detect and monitor emission from metastable oxygen based on the following
reactions:
- Radiative decay of OSD
nmathXOaO gg 12693
2
1
2
- Radiative decay of OSS
nmathXObO gg 7623
2
1
2
- Spontaneous emission from OSD complex (dimole radiation)
nmathvXOvaOvaO ggg 5770,21,0, 3
2
1
2
1
2
nmathvXOvaO gg 6340,20,2 3
2
1
2

American Institute of Aeronautics and Astronautics
12
nmathvXOaO gg 7031,20,2 3
2
1
2
All of these radiation bands, except for the vibrationally excited OSD complex have been already observed
in electrical discharges7, mostly in long ducts or drift tubes.
Secondary OES diagnostics is related to the spectroscopic determination of gas temperature, which is
important for accurate determination of the reduced electric field from Eq. 4. The most common spectroscopic
technique is based on the use of small amount of nitrogen and observation of a rotational band belonging to the
Second Positive System (C3Πu→B
3Πg). The observed spectrum of a band is compared with synthetic spectrum
where temperature is the only free parameter. This technique assumes equilibrium of rotational lines within a
vibrational band and also the reproduction of the same equilibrium in the ground state upon the electron impact
excitation of the C state. This assumption may be severely violated in the presence of strong atomic population, by
the energy transfer from excited atoms to selected rotational lines in the system. In addition, chemical reactions may
produce additional cascading excitation that result in strong populations of short-lived energetic excited nitrogen
molecules. This effect results apparent two- or multi-temperature distribution of rotational states neither of which
could be assigned to gas kinetic temperature.
As we have shown in Figure 1a, the b1Σg
+→ X
3Σg
- transition from OSS to ground state is rather strong and
clear from most interfering spectral features in MWD. This long-living state is a more reliable object for
spectroscopic determination of temperature, because a negligible amount is lost or created by chemical reactions
during the time window of observation. The spectrum is composed of two branches, R and P, each having two
subbranches RQ, RR, PP and PQ. R and P branches are shown in Figure 8a and 8b in a finer resolution. During the
discharge, the spectrum is somewhat distorted by oxygen short-lived bands, but only 50 μs after the pulse ends the
spectrum is clear and more suitable for temperature diagnostics. We assume that the gas temperature could not drop
substantially in that time interval. Average rate of temperature decay in post-discharge measured by this method was
1K per 10 μs, which indicates that the using of a time window (gate 50 μs) delayed by 50 μs from the end of the
discharge would result in temperature several degrees lower.
0
5000
10000
15000
20000
758 758.5 759 759.5 760 760.5 761 761.5 762 762.5 763
Wavelength (nm)
Inte
nsi
ty (
a.u
.)
Figure 8a. RR and RQ branches of the atmospheric band b
1Σg
+ (v=0)→ X
3Σg
-(v=0) recorded by end-on observation
of the MWD post-discharge: repetition rate 1000 pips; pulse duration 300 μs; average forward power 12 W; DBD:
voltage 2.5 kV, repetition rate 1000 pips; 0.4% O2, 99.6% He, pressure 30 Torr; Time window: delay 300 μs; gate
600 μs.
American Institute of Aeronautics and Astronautics
13
0
3000
6000
9000
762.5 763.0 763.5 764.0 764.5 765.0 765.5 766.0
Wavelength (nm)
Inte
nsi
ty (
a.
u.)
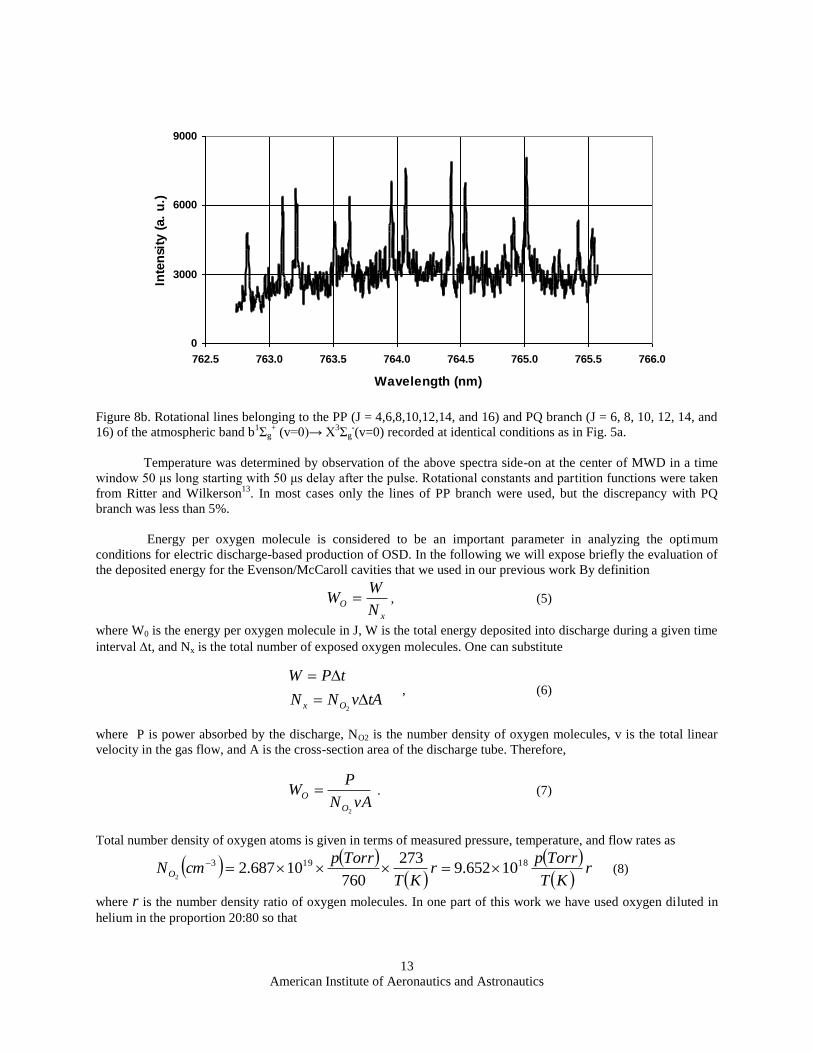
Figure 8b. Rotational lines belonging to the PP (J = 4,6,8,10,12,14, and 16) and PQ branch (J = 6, 8, 10, 12, 14, and
16) of the atmospheric band b1Σg
+ (v=0)→ X
3Σg
-(v=0) recorded at identical conditions as in Fig. 5a.
Temperature was determined by observation of the above spectra side-on at the center of MWD in a time
window 50 μs long starting with 50 μs delay after the pulse. Rotational constants and partition functions were taken
from Ritter and Wilkerson13
. In most cases only the lines of PP branch were used, but the discrepancy with PQ
branch was less than 5%.
Energy per oxygen molecule is considered to be an important parameter in analyzing the optimum
conditions for electric discharge-based production of OSD. In the following we will expose briefly the evaluation of
the deposited energy for the Evenson/McCaroll cavities that we used in our previous work By definition
x
ON
WW , (5)
where W0 is the energy per oxygen molecule in J, W is the total energy deposited into discharge during a given time
interval t, and Nx is the total number of exposed oxygen molecules. One can substitute
tAvNN
tPW
Ox
2
, (6)
where P is power absorbed by the discharge, NO2 is the number density of oxygen molecules, v is the total linear
velocity in the gas flow, and A is the cross-section area of the discharge tube. Therefore,
vAN
PW
O
O
2
. (7)
Total number density of oxygen atoms is given in terms of measured pressure, temperature, and flow rates as
rKT
Torrpr
KT
TorrpcmNO
18193 10652.9273
76010687.2
2
(8)
where r is the number density ratio of oxygen molecules. In one part of this work we have used oxygen diluted in
helium in the proportion 20:80 so that

American Institute of Aeronautics and Astronautics
14
f
f
ff
fr
HeO
HeOHe
HeO 2
2
2 2.02.0
.
where the flow rates of helium/oxygen mixture, 2HeOf , and of helium, Hef , are given in sccm. Otherwise, r is
obtained by the simple ratio of the oxygen and total flow rates. Linear velocity of molecules in the mixture flowing
through the discharge is given by
2
3
2
3
0464.01760
27360 cmATorrp
KTscmf
cmATorrp
KTscmfscmv
(9)
Total number density of singlet O2 (1), NSDO, is obtained by deconvolution and integration of the broadened
absorption line from the Noxon band in the cavity ringdown waveform. Total number density, NSSO, of singlet
gO 1
2 was evaluated comparing the blackbody irradiation source intensity recorded with the same apparatus as
used for recording the radiation of the atmospheric band b1Σg
+→ X
3Σg
- . Total yields are then calculated from
22
2
2
1910036.1O
SDO
O
HeO
SDO
O
SDO
SDOf
f
p
TN
f
ff
p
kTN
N
NY
(10a)
22
2
2
191018.55
HeO
SSO
HeO
HeHeO
SSO
O
SSOSSO
f
f
p
TN
f
ff
p
kTN
N
NY
(10b)
where the pressure p is given in Torr, temperature T in K, and flow rates 22
,, HeOO fff in sccm.
IV. Results
In Fig. 9 is shown the distribution of average temperature along the MWD. It shows that in our relatively
narrow parameter range the temperature remains roughly constant. There are fine details related to the influence of
DBD discharge, manifested in slightly elevated temperature in the upstream section. Also, local measurements
indicate the possibility of small departure from laminar flow which would result in higher residence times and
increased quenching processes. These subjects is will be the matter of future study, which may result in a different
construction of microwave cavity and more careful synchronization between DBD and MWD.
Figure 9. Temperature distribution along MWD discharge

American Institute of Aeronautics and Astronautics
15
Figure 10 shows the OSD yield as a function of the reduced electric field, defined by Eq. (10a). Data on
oxygen-“rich” and oxygen-“lean” mixtures show clear distinction. Oxygen-“lean” mixtures show high yield and
tendency of saturation or a broad maximum around 15 Td. They are scattered much more than the average
experimental error, most probably due to higher contribution of impurities at low flow rates of oxygen. Oxygen-
“lean” mixtures show growing trend, much lower scattering and continuity of yield value at 150 and 300 sccm. Part
of our current work is to elucidate the discrepancy between the “lean” and “rich “ mixtures. Operation at high
pressure in the tandem discharge is allowing for a more intensive study. .This analysis is not yet complete and will
be reported elsewhere.
Results indicate that the maximum yield is shifted by about 3 Td with respect to the established theoretical
predictions (E/N ~ 11 Td). Reason for this discrepancy can be found in the possibility that the MWD form factor is
closer to unity for the “lean “ mixtures. MWD in the “rich” mixtures is more electronegative, due to higher
concentration of oxygen, and evaluation of its form factor is rather complex. This is still a useful information that
has to be addressed in future work.
Absolute value of the yield is less doubtful since the errors were estimated conservatively, using standard
methods for evaluation of density from the absorption lines. The main error in the yield value is introduced by errors
in temperature measurements, which are likely to be improved in near future.
Figure 11 shows the OSS yield as evaluated from Eq. (10b) based on the absolute irradiance measurements
of the rotational lines of the R branch of the b1Σg
+ (v=0)→ X
3Σg
-(v=0) transition. Although absolute values are still
under scrutiny, the location of the maximum was tested at other gas mixtures..
Figure 10. Results for O2(1Δg) yield measurements using off-axis ICOS method illustrate different behavior of
Oxygen “lean” and “rich” mixture with Helium.

American Institute of Aeronautics and Astronautics
16
0
0.002
0.004
0.006
0.008
0.01
0 5 10 15 20 25 30 35
E/N (Td)
OS
S Y
ield
(%
)
Figure 11. Results for the O2(
1Σg
+) yield evaluated from absolute intensity measurements of rotational lines in the R
branch of the atmospheric band. Gas mixture consisted of 3% Oxygen and 97% He.
V. Conclusion
Maximum yield of OSD obtained in this experiment was as much as 19%. This yield is by more than a
factor 2 higher than the yield reported previously for microwave cavity discharges. We propose several reasons for
this discrepancy. First, in-situ emission spectroscopy relies on very low emission signals, and numerous sources
could augment the measurement error. On the contrary, the ICOS technique relies on a very long absorption path,
measured in kilometers, stable conditions in the cell, relatively far away from the discharge to be affected by
possible fluctuations induced by high temperature of gas particles in the discharge. Second, emission data could not
take into account the amount of OSD or any solid obstacle in the flow. Therefore, the additional production in the
afterglow is not compensated by any decay and the population seems to be constantly added as long as there are
other metastable specii in the system. Third, in present work, the diluting gas was helium, which is known to
enhance internal energy storage into oxygen, and the range of oxygen content was much wider.
Tandem discharge in the described configuration offers a unique possibility to eliminate ionization penalty
often present in electrical discharges and thus to increase their energy efficiency when used as chemical reactors.
Present example supports this case by demonstrating sustained operation in He/O2 mixtures at average power below
20 W and at pressure of 350 Torr. The experiment was clearly power limited and the power upgrade of the system is
clearly needed. Scaling parameters for holding the reduced electric field strength in the optimum range are known.
Concentration of atomic oxygen in the system has to be decreased in order to stabilize production yield and
discharge volume, and to eliminate depletion by collisional quenching at elevated pressure.
Acknowledgments
Authors gladly acknowledge support and discussions with Drs. Biswa Ganguly, Skip Williams and Robert
Leiweke, WPAFRL, and the staff of Hanscom and WP AFRL for the support during S. Popović’s Summer Faculty
Fellowship tenures.

American Institute of Aeronautics and Astronautics
17
References 1 Slanger T. G. and Copeland R. A., “Energetic Oxygen in the Upper Atmosphere and the Laboratory”, Chemical
Review, 103 (2003) 47314765. 2
Carroll D L, Verdeyen J T, King D M, Zimmerman J W, Laystrom J K, Woodard BS, Benavides G F, Kittel K,
Stafford D S, Kushner M J and Solomon W C, “Continuous-wave laser oscillation on the 1315 nm transition of
atomic iodine pumped by O2(a1Δ) produced in an electric discharge,” Appl. Phys. Lett. 86 (2005)111104 (3 pages).
3 Leiweke RJ and Ganguly BN, “Effects of pulsed-excitation applied voltage rise time on argon metastable
production efficiency in high pressure dielectric barrier discharge,” Applied Physics Letters, 90 (2007) 241501 (3
pages). 4 Rawlins W T, Lee S, Kessler W J and Davis S J, “Observations of gain on the I(
2P1/2 →
2P3/2) transition by energy
transfer from O2(a1Δg) generated by a microwave discharge in a subsonic-flow reactor,”Appl. Phys. Lett, 86 (2005)
051105. 5 Popović S, Rašković M, Kuo S P and Vušković L, “Reactive oxygen emission from microwave discharge
plasmas,”Journal of Physics: Conf. Ser. 86, (2007) 012013. 6 Williams S., Popovic S., Gupta M., “Microwave plasma generation and filtered transport of O2 (a
1Δg),”Plasma
Sources Science and Technology, 18, (2009). 035014. 7 Smirnov VV, Stelmakh OM, Fabelinsky VI, Kozlov DN, Starik AM, and Titova NS, “On the influence of
electronically excited oxygen molecules on combustion of hydrogen–oxygen mixture,”Journal of Physics D:
Applied Physics, 41 (2008) 192001. 8 Paul J B, Lapson L and Anderson J G, “Ultrasensitive Absorption Spectroscopy with a High-Finesse Optical
Cavity and Off-Axis Alignment,” Appl.Opt. 40 (2001) 4904-4910. 9 O'Keefe A, Scherer J J and Paul J B, “CW integrated cavity output spectroscopy,” Chem. Phys. Lett. 307 (1999)
343-349. 10
Baer D S, Paul J B, Gupta M and O'Keefe A, “Sensitive absorption measurements in the near-infrared region
using off-axis integrated-cavity-output spectroscopy,” App. Phys. B 75 (2002) 261-265. 11
Rothman L S, Rinsland C P, Goldman A, Massie S T, Edwards D P, Mandin J -Y, Schroeder J,
Mc-Cann A, Gamache R R, Wattsin R B, Yoshino K, Chance K V, Juck K W, Brown L R, Nemtchechin V and
Varanasi P , J. Quant. Spec. Radiat. Transf. 60 (1998) 665-710. 12
Whiting E E, “An empirical approximation to the Voigt profile,” J. Quant. Spec. Radiat. Transf. 8 (1968)1379-
1384. 13
Ritter KJ and Wilkerson TD, “High-resolution spectroscopy of the oxygen A band,” J. Mol. Spectr., 121 (1987) 1-
19.