on the history and future of cosmic planet formationhubblesite.org/pubinfo/pdf/2015/35/pdf.pdf ·...
TRANSCRIPT
MNRAS 454, 1811–1817 (2015) doi:10.1093/mnras/stv1817
On the history and future of cosmic planet formation
Peter Behroozi‹ and Molly S. Peeples‹Space Telescope Science Institute, Baltimore, MD 21218, USA
Accepted 2015 August 4. Received 2015 June 25; in original form 2015 April 1
ABSTRACTWe combine constraints on galaxy formation histories with planet formation models, yieldingthe Earth-like and giant planet formation histories of the Milky Way and the Universe asa whole. In the Hubble volume (1013 Mpc3), we expect there to be ∼1020 Earth-like and∼1020 giant planets; our own galaxy is expected to host ∼109 and ∼1010 Earth-like and giantplanets, respectively. Proposed metallicity thresholds for planet formation do not significantlyaffect these numbers. However, the metallicity dependence for giant planets results in latertypical formation times and larger host galaxies than for Earth-like planets. The Solar systemformed at the median age for existing giant planets in the Milky Way, and consistent withpast estimates, formed after 80 per cent of Earth-like planets. However, if existing gas withinvirialized dark matter haloes continues to collapse and form stars and planets, the Universewill form over 10 times more planets than currently exist. We show that this would imply atleast a 92 per cent chance that we are not the only civilization the Universe will ever have,independent of arguments involving the Drake equation.
Key words: planets and satellites: gaseous planets – planets and satellites: terrestrial planets –galaxies: formation.
1 IN T RO D U C T I O N
Early estimates of the planet formation history of the Universe(Livio 1999; Lineweaver 2001) suggested that the Earth formed af-ter 75–80 per cent of other similar planets, even when consideringpotential galactic habitable zones (Lineweaver, Fenner & Gibson2004). Since that time, thousands of exoplanets have been found,aided by the Kepler mission (Lissauer, Dawson & Tremaine 2014).Many advances have been made in the past decade, especially in ourunderstanding of how planet formation depends on the mass andmetallicity of the host star (Fischer & Valenti 2005; Buchhave et al.2012; Wang & Fischer 2013; Buchhave et al. 2014; Gonzalez 2014;Lissauer et al. 2014; Reffert et al. 2015). Concurrently, constraintson galaxies’ star formation and metallicity histories have been im-proving rapidly (Maiolino et al. 2008; Mannucci et al. 2010; Mous-takas et al. 2011; Behroozi, Wechsler & Conroy 2013e; Peeples &Somerville 2013; Munoz & Peeples 2015).
In this paper, we combine recent planet frequency models (Buch-have et al. 2014; Lissauer et al. 2014) with reconstructed galaxyformation histories (Maiolino et al. 2008; Behroozi et al. 2013e) toupdate constraints on the planet formation history of the Milky Wayand the Universe as a whole, both for Earth-like planets and for giantplanets. We adopt a flat, ! cold dark matter (CDM) cosmology with"M = 0.27, "! = 0.73, h = 0.7, ns = 0.95, and σ 8 = 0.82, similarto recent WMAP9 constraints (Hinshaw et al. 2013); the initial mass
⋆ E-mail: [email protected] (PB); [email protected] (MSP)
function (IMF) is assumed to follow Chabrier (2003) from 0.1 to100 M⊙.
2 M E T H O D O L O G Y
While planet formation can depend on host star mass, new stars’masses are drawn from a nearly universal distribution (Chabrier2003). When averaged over an entire galaxy, the planet formationrate (PFR) is then proportional to the galaxy’s star formation rate,modified by the PFR’s metallicity dependence. Using a power-lawparametrization for this metallicity dependence (see e.g. Fischer &Valenti 2005; Gonzalez 2014), we model the PFR of a galaxy as afunction of its stellar mass (M∗(t)) and cosmic time (t),
PFR(M∗, t) = n(Z(M∗, t)/Z⊙)α
⟨m∗⟩SFR(M∗, t), (1)
where n is the mean number of planets formed per star, α is thepower-law dependence of planet incidence on metallicity, Z(M∗, t)is the galaxy’s mean gas-phase metallicity, ⟨m∗⟩ = 0.67 M⊙ is themean mass of a newly formed star (Chabrier 2003), and SFR(M∗, t)is the galaxy’s star formation rate in M⊙ yr−1. Additional factors(e.g. stellar IMFs and densities) influencing the PFR are discussedin Appendix A.
For giant planets (R > 6 R⊕; including, e.g. Jupiter and Saturn),the metallicity (specifically, [Fe/H]) dependence is long-established(Fischer & Valenti 2005); recent estimates suggest nG ∼ 0.022and αG ∼ 3.0 (Gonzalez 2014), albeit with significant systematicuncertainties. To define Earth-like (i.e. ‘habitable zone’) planets, weadopt the same definition as Lissauer et al. (2014), requiring that
C⃝ 2015 The AuthorsPublished by Oxford University Press on behalf of the Royal Astronomical Society
at Space Telescope Science Institute on October 20, 2015
http://mnras.oxfordjournals.org/
Dow
nloaded from

1812 P. Behroozi and M. S. Peeples
planets with an Earth-like atmosphere could support stable surfacereservoirs of liquid water. Effectively, this includes all objects whoseradii and orbital periods are within a factor of e of those of the Earth(Lissauer et al. 2014). In the Solar system, this would include Marsand Venus, but exclude, e.g. Mercury and the Moon. The metallicitydependence for Earth-like planets is believed to be smaller than forgiant planets (Buchhave et al. 2012; Campante et al. 2015), withrecent estimates suggesting αE ∼ 0–0.7 (Wang & Fischer 2013;Lissauer et al. 2014). This range of αE has only a small impact onour results, so we conservatively take αE = 0 (i.e. no metallicitydependence) for Earth-like planets. However, Johnson & Li (2012)suggest a theoretical minimum metallicity threshold for Earth-likeplanet formation of [Fe/H] ∼ −1.5 + log10
!rau
"(with r the orbital
radius), so we mark a fiducial threshold of [Fe/H] = −1.5 in allrelevant plots. For nE, Kepler has provided the largest statisticalsamples (Catanzarite & Shao 2011); Lissauer et al. (2014) suggestan incidence of ∼0.1 Earth-like planets per Sun-like star. Habitablezones are expected to exist only around 0.6–1.4 M⊙ (K to F5-class)stars (Kasting, Whitmire & Reynolds 1993; Kopparapu et al. 2014),which make up 14.8 per cent of stars by number (Chabrier 2003),so we take nE = 0.015.
Behroozi et al. (2013e) determined SFR(M∗, t) for galaxies upto ∼13 Gyr ago (z = 8), covering >90 per cent of all star formation(Behroozi, Wechsler & Conroy 2013b). The methodology is detailedin Appendix B; briefly, it involves linking galaxies at one redshift togalaxies with the same cumulative number densities at another red-shift to trace their stellar mass buildup, as the most massive galaxiesat one redshift will tend to remain the most massive galaxies at laterredshifts. The full computation also involves corrections for scatterin galaxy growth histories and galaxy–galaxy mergers (Behrooziet al. 2013d,f). Knowing the stellar mass history of galaxies, onemay use observed metallicity–stellar mass–redshift relations (e.g.Maiolino et al. 2008; Moustakas et al. 2011) or metallicity–stellarmass–star formation rate relations (e.g. Mannucci et al. 2010) todetermine galaxy metallicity histories (see also Munoz & Peeples2015). Here, we use the fitting function in Maiolino et al. (2008),which is constrained for z < 3.5 (<11.7 Gyr ago), mildly extrapo-lated over the same redshift range as our star formation histories. AsMaiolino et al. (2008) measure oxygen abundance ratios ([O/H]),we use the formula [Fe/H] = −0.1 + 1.182 [O/H] (from fittingMilky Way stellar abundances in the SDSS-III APOGEE; Holtz-man et al. 2015) to convert to iron abundance ratios. If all starsinstead had solar iron-to-oxygen ratios, our derived giant planetabundance would increase by ∼0.3 dex.
3 R ESULTS
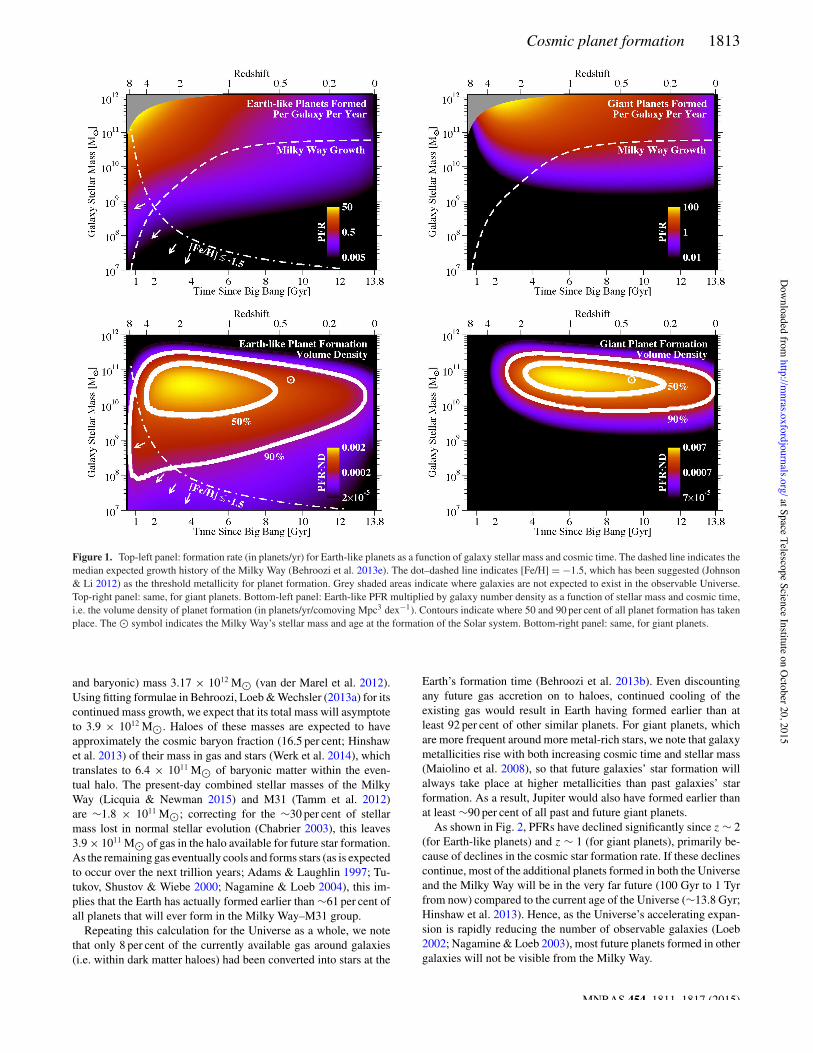
The resulting PFRs from equation (1) are shown in the top panels ofFig. 1. Similar to star formation (Behroozi et al. 2013e), PFRs pergalaxy are greatest at early times in massive galaxies. Indeed, Earth-like PFRs are exactly proportional to galaxy star formation rates(scaled by nE = 0.0073) in our assumed model. The planet formationhistory of the Milky Way (present-day M∗ = 5–7 × 10¹⁰ M⊙, fromcurrent Bayesian models; Licquia & Newman 2015) can be inferredby integrating PFR(M∗, t) along the median growth history for MilkyWay-sized galaxies (dashed line, top panels of Fig. 1). The planetformation history of the Universe, here expressed as the averagevolume density of planet formation, is obtained by multiplying PFR(M∗, t) by the volume density of galaxies as a function of stellarmass and cosmic time (φ(M∗, t), discussed in Appendix B).
The product of PFR with φ shows when and where all Earth-likeand giant planets formed (Fig. 1, bottom panels). Typical galaxy
masses at the time of planet formation are ∼1010.5 M⊙, regardlessof planet type. However, because of their metallicity bias, giantplanets form later than Earth-like planets. Giant planet formation israre in galaxies below 109 M⊙; while the Magellanic Clouds mayhave some giant planets, it is unlikely that lower mass dwarf satellitegalaxies of the Milky Way will have any. In both cases, the Johnson& Li (2012) minimum metallicity threshold is a weak one, as the vastmajority of star formation has taken place at [Fe/H] > −1.5. Wefind that total planet densities would be lowered by <10 per centfor Earth-like planets and ≪0.01 per cent for giant planets withthis metallicity threshold (Fig. 1, bottom panels). However, thisthreshold would strongly diminish the number of Earth-like planetsformed around stars older than 12 billion years in the Milky Way(Fig. 1), which is so far consistent with the age of the oldest observedstar with Earth-like companions (11.2 ± 1.0 Gyr; Campante et al.2015).
We show total planet formation histories and rates from equation(1) for the Milky Way and the Universe in Fig. 2. In the Uni-verse’s observable volume (1013 Mpc3), these results would imply∼1020 Earth-like planets and a similar number of giant planets.1
Errors are dominated by planet incidence rates (nE and nG), whichare uncertain at the 0.5–1 dex level (Lissauer et al. 2014) due todifferent detection efficiency estimates. Smaller systematic errors(0.2–0.3 dex) come from uncertainties in IMFs, stellar populationmodelling in galaxies, and variation in individual galaxy star for-mation histories and metallicities (Behroozi, Conroy & Wechsler2010; Peeples et al. 2014).
4 D ISCUSSION
We discuss the Solar system’s relative formation time (Section 4.1)and its relation to the expected number of future civilizations(Section 4.2).
4.1 Formation time of the Solar system
Fig. 2 shows that the Earth formed later than ∼80 per cent of similarplanets in both the Milky Way and the Universe, matching previousfindings (Livio 1999; Lineweaver 2001). Comparatively, the Solarsystem (including Jupiter) formed closer to the median formationtime for giant planets. This is not evidence for or against giantplanets being prerequisite for life as there is a strong observer bias(Fig. 3). When calculating the age of our own planet, we are reallycalculating the time tc that it took our own species and civilizationto evolve. If tc were extremely long, many new planets would haveformed later than our own planet but before intelligent life evolved –so we would have concluded that our planet formed early comparedto most other planets. However, as tc is shorter than the currentdoubling time, td, for stellar mass in the Milky Way (tc = 4.6 Gyr andtd ∼ 20 Gyr), fewer planets have had time to form while civilizationhas developed. Hence, the ‘late’ formation time of our own planetspeaks more to the ratio of tc to td than to conditions for habitability.
This observer bias can be removed if we calculate our forma-tion time relative to all the planets which will ever be formed. TheMilky Way is expected to merge with Andromeda (M31) in ∼4 Gyr(Cox & Loeb 2008), forming a single object with total (dark matter
1 The number of observable planets in our past lightcone, as opposed toplanets currently in the Hubble volume, is ∼1019 for both Earth-like andgiant planets.
MNRAS 454, 1811–1817 (2015)
at Space Telescope Science Institute on October 20, 2015
http://mnras.oxfordjournals.org/
Dow
nloaded from
Cosmic planet formation 1813
Figure 1. Top-left panel: formation rate (in planets/yr) for Earth-like planets as a function of galaxy stellar mass and cosmic time. The dashed line indicates themedian expected growth history of the Milky Way (Behroozi et al. 2013e). The dot–dashed line indicates [Fe/H] = −1.5, which has been suggested (Johnson& Li 2012) as the threshold metallicity for planet formation. Grey shaded areas indicate where galaxies are not expected to exist in the observable Universe.Top-right panel: same, for giant planets. Bottom-left panel: Earth-like PFR multiplied by galaxy number density as a function of stellar mass and cosmic time,i.e. the volume density of planet formation (in planets/yr/comoving Mpc3 dex−1). Contours indicate where 50 and 90 per cent of all planet formation has takenplace. The ⊙ symbol indicates the Milky Way’s stellar mass and age at the formation of the Solar system. Bottom-right panel: same, for giant planets.
and baryonic) mass 3.17 × 10¹² M⊙ (van der Marel et al. 2012).Using fitting formulae in Behroozi, Loeb & Wechsler (2013a) for itscontinued mass growth, we expect that its total mass will asymptoteto 3.9 × 10¹² M⊙. Haloes of these masses are expected to haveapproximately the cosmic baryon fraction (16.5 per cent; Hinshawet al. 2013) of their mass in gas and stars (Werk et al. 2014), whichtranslates to 6.4 × 10¹¹ M⊙ of baryonic matter within the even-tual halo. The present-day combined stellar masses of the MilkyWay (Licquia & Newman 2015) and M31 (Tamm et al. 2012)are ∼1.8 × 10¹¹ M⊙; correcting for the ∼30 per cent of stellarmass lost in normal stellar evolution (Chabrier 2003), this leaves3.9 × 1011 M⊙ of gas in the halo available for future star formation.As the remaining gas eventually cools and forms stars (as is expectedto occur over the next trillion years; Adams & Laughlin 1997; Tu-tukov, Shustov & Wiebe 2000; Nagamine & Loeb 2004), this im-plies that the Earth has actually formed earlier than ∼61 per cent ofall planets that will ever form in the Milky Way–M31 group.
Repeating this calculation for the Universe as a whole, we notethat only 8 per cent of the currently available gas around galaxies(i.e. within dark matter haloes) had been converted into stars at the
Earth’s formation time (Behroozi et al. 2013b). Even discountingany future gas accretion on to haloes, continued cooling of theexisting gas would result in Earth having formed earlier than atleast 92 per cent of other similar planets. For giant planets, whichare more frequent around more metal-rich stars, we note that galaxymetallicities rise with both increasing cosmic time and stellar mass(Maiolino et al. 2008), so that future galaxies’ star formation willalways take place at higher metallicities than past galaxies’ starformation. As a result, Jupiter would also have formed earlier thanat least ∼90 per cent of all past and future giant planets.
As shown in Fig. 2, PFRs have declined significantly since z ∼ 2(for Earth-like planets) and z ∼ 1 (for giant planets), primarily be-cause of declines in the cosmic star formation rate. If these declinescontinue, most of the additional planets formed in both the Universeand the Milky Way will be in the very far future (100 Gyr to 1 Tyrfrom now) compared to the current age of the Universe (∼13.8 Gyr;Hinshaw et al. 2013). Hence, as the Universe’s accelerating expan-sion is rapidly reducing the number of observable galaxies (Loeb2002; Nagamine & Loeb 2003), most future planets formed in othergalaxies will not be visible from the Milky Way.
MNRAS 454, 1811–1817 (2015)
at Space Telescope Science Institute on October 20, 2015
http://mnras.oxfordjournals.org/
Dow
nloaded from

1814 P. Behroozi and M. S. Peeples
Figure 2. Top-left panel: total Earth-like and giant planets formed in the Milky Way as a function of cosmic time. Giant planet counts have been shifted bya factor of 5 to allow better comparison with the Earth-like planet formation history. Top-right panel: average planet density in the Universe as a function ofcosmic time. Earth-like planet formation tracks the galaxy/cosmic star formation rates, whereas giant planet formation times are greater at late times due to theirmetallicity dependence. Blue squares mark the median formation times of each population. The vertical dotted line indicates the formation time of the Solarsystem, which occurred after 80 per cent of present-day Earth-like planets and 50 per cent of present-day giant planets were formed in the Milky Way. Bottompanels: PFRs and densities, respectively, for the Milky Way and the Universe as a whole. Uncertainties in all estimates are ∼1 dex, arising from uncertaintiesin planet detection rates with Kepler.
4.2 Probability of other civilizations
The Drake equation (Drake & Sobel 1992) for calculating the num-ber of intelligent, communicative civilizations (hereafter, just ‘civ-ilizations’) is famously uncertain, with estimates of the civilizationincidence per habitable planet ranging from 10−5 (Sagan 1963) toarbitrarily small values (e.g. <10−30, combining pessimistic esti-mates from Carter 1983; Ward & Brownlee 2000; Schermer 2002;Spiegel & Turner 2012). Combined with our estimates of the num-ber of Earth-like planets (Section 3) and the fact of our existence,this would result in 1–1015 civilizations in the Universe and 1–104
in the Milky Way at the present time.The formation time of our planet (compared to all which will ever
form) gives weak but independent constraints on the total numberof planets with civilizations which will ever exist. Intuitively, if wewere the only civilization the Universe will ever have, the Coper-nican principle suggests that it is unlikely for our planet to haveformed so early relative to other similar ones.2 As an example, we
2 Our formation time relative to other habitable planets in the Milky Way isunexceptional (Section 4.1), giving little information on the total number of
can calculate an upper bound for the chance that the Universe willonly ever have a single civilization (corresponding to civilizationincidences of <10−21 per habitable planet). For this upper bound,we adopt the prior that Earth is the first planet with a civilizationto have formed – any possibility that Earth is not the first is incom-patible with there being only one civilization. We find using Bayes’rule that the probability of there being N civilizations total is then
P (N |f , E = 1) ∝ Nf N−1P (N ), (2)
where f = 0.92 is the fraction of planets which have yet to form,E = 1 is the assumption that the Earth has the first civilization, andP(N) is the prior on the number of planets with civilizations. Becauseequation (2) falls off exponentially for large civilization numbers N,it is only necessary to know the prior P(N) over a modest dynamicrange (1 ≤ N ≤ 1000). The orders-of-magnitude uncertainties onparameters in the Drake equation suggest that the prior P(N) onthe number of planets with civilizations should be a lognormaldistribution with an exceptionally large width (!20 dex). Locally,
civilizations our galaxy will have. Additional systematics for how planet mi-gration/scattering affect civilization formation are discussed in Appendix A.
MNRAS 454, 1811–1817 (2015)
at Space Telescope Science Institute on October 20, 2015
http://mnras.oxfordjournals.org/
Dow
nloaded from

Cosmic planet formation 1815
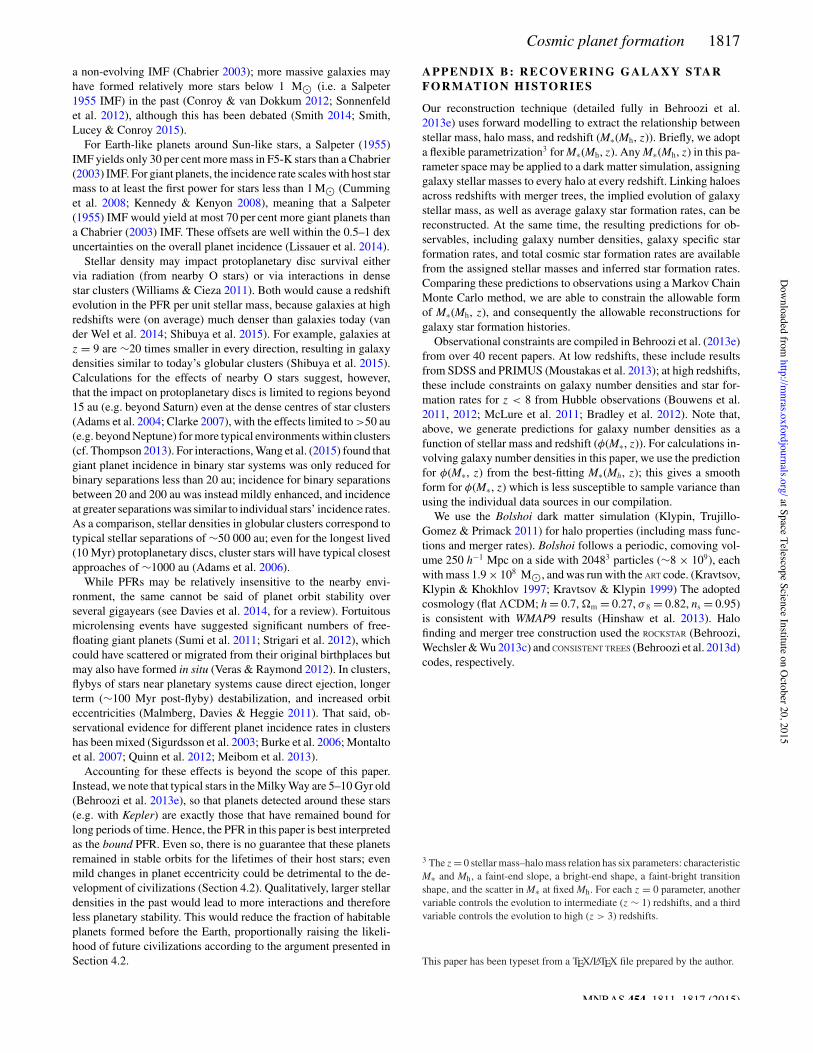
Figure 3. The relative formation time of one’s own planet depends on thetime it takes one’s civilization to form. As shown above, planet formationcontinues while civilizations are developing. Many planets will form if acivilization is slow to develop, so by the time it is able to calculate itsown planet’s formation time relative to others (∼ the time when it developstelescopes), it will find that its planet formed early. In contrast, a rapidlydeveloping civilization (e.g. ours) reaches that stage earlier, giving the Uni-verse less time to make more planets; the civilization will then find that itsown planet formed late relative to most others.
Figure 4. Probability for the total number of planets with civilizationsin the Universe, given that the Earth formed before 92 per cent of similarplanets expected to exist. If Earth is the nth planet since the big bang tohave formed a civilization, then the average (expected) total number ofplanets with civilizations scales as 12.5n. Even for the most conservativepossible assumption (i.e. that Earth was the first planet formed that evolvedan intelligent civilization), it is unlikely that we will be the only civilizationthat the Universe will ever have (black line). As the number of earlierplanets with civilizations increases (red and blue lines), it becomes moreand more likely that the Universe will have many more civilizations thancurrently exist. For comparison, if the Milky Way today contained anothercivilization, it is likely that Earth would be at least the ten billionth planetto host a civilization in the observable universe, which would eventuallycontain at least a hundred billion civilizations.
then, it is an excellent approximation to take P(N) as uniform inlogarithmic space (i.e. P (N ) ∝ 1
N) for 1 ≤ N ≤ 1000.
The resulting probability distribution for the total number ofplanets with civilizations is shown in Fig. 4. The large fraction ofplanet formation which has not yet taken place (f = 0.92) impliesat most an 8 per cent chance of us being the only civilization the
Universe will ever have. More typically, the expected total numberof planets with civilizations would be ⟨N⟩ = 12.5.
As noted above, Earth being the first planet with a civilizationis a very conservative assumption. For example, if the Milky Waytoday had another planet with a civilization (∼10−9 civilizationsper habitable planet), then Earth would be at least the ten billionthplanet with a civilization in the observable Universe. Generalizingthe problem, we suppose that Earth is the Eth planet with a civi-lization. By Poisson statistics, the larger E is, the better the relativeconstraints on N will be. This is exactly analogous to an exposuretime calculation: the more photons E that arrive in an 8 s exposure,the better one can predict the total number of photons N if the ex-posure were extended to a full 100s. For planets, the generalizedprobability distribution is given by
P (N |f , E) ∝ (N − E + 1)#
N
E − 1
$(1 − f )E−1f N−EP (N )
(3)
which is a binomial distribution with a pre-factor (N − E + 1).As shown in Fig. 4, the expected total number of planets withcivilizations scales as ⟨N⟩ = 12.5E, and the relative uncertainties onthis total drop as ∼ 1√
E. Hence, the more planets with civilizations
which have formed before the Earth, the more likely it is for theUniverse to continue forming many more in its future.
5 C O N C L U S I O N S
Current constraints on galaxy and planet formation suggest asfollows.
(i) The Milky Way contains ∼109 Earth-like and ∼1010 giantplanets (Section 3).
(ii) The Hubble volume contains ∼1020 Earth-like planets and asimilar number of giant planets (Section 3).
(iii) A metallicity threshold of [Fe/H] = −1.5 has very limitedeffects on total planet counts (Section 3).
(iv) Earth-like and giant planets both formed primarily in1010.5 M⊙ galaxies; however, giant planets are much rarer thanEarth-like planets in low-mass galaxies (Section 3).
(v) Giant planets have median ages ∼2.5 Gyr younger than Earth-like planets (Section 3).
(vi) The Solar system formed after 80 per cent of existing Earth-like planets (in both the Universe and the Milky Way), after50 per cent of existing giant planets in the Milky Way, and after70 per cent of existing giant planets in the Universe (Section 4.1).
(vii) Assuming that gas cooling and star formation continues, theEarth formed before 92 per cent of similar planets that the Universewill form. This implies a <8 per cent chance that we are the onlycivilization the Universe will ever have (Section 4.2).
ACK NOW L E DG E ME NT S
We thank Fred Behroozi, Mario Livio, Tom Quinn, I. Neill Reid,Joseph Silk, Jason Tumlinson, and the anonymous referee for theirvery helpful comments and suggestions. PSB was supported by aGiacconi Fellowship from the Space Telescope Science Institute,which is operated by the Association of Universities for Researchin Astronomy, Incorporated, under NASA contract NAS5-26555.
Funding for SDSS-III has been provided by the Alfred P. SloanFoundation, the Participating Institutions, the National ScienceFoundation, and the US Department of Energy Office of Science.The SDSS-III web site is http://www.sdss3.org/.
MNRAS 454, 1811–1817 (2015)
at Space Telescope Science Institute on October 20, 2015
http://mnras.oxfordjournals.org/
Dow
nloaded from

1816 P. Behroozi and M. S. Peeples
SDSS-III is managed by the Astrophysical Research Consor-tium for the Participating Institutions of the SDSS-III Collabo-ration including the University of Arizona, the Brazilian Partici-pation Group, Brookhaven National Laboratory, Carnegie MellonUniversity, University of Florida, the French Participation Group,the German Participation Group, Harvard University, the Institutode Astrofisica de Canarias, the Michigan State/Notre Dame/JINAParticipation Group, Johns Hopkins University, Lawrence Berke-ley National Laboratory, Max Planck Institute for Astrophysics,Max Planck Institute for Extraterrestrial Physics, New MexicoState University, New York University, Ohio State University,Pennsylvania State University, University of Portsmouth, PrincetonUniversity, the Spanish Participation Group, University ofTokyo, University of Utah, Vanderbilt University, University ofVirginia, University of Washington, and Yale University.
R E F E R E N C E S
Adams F. C., Laughlin G., 1997, Rev. Mod. Phys., 69, 337Adams F. C., Hollenbach D., Laughlin G., Gorti U., 2004, ApJ, 611, 360Adams F. C., Proszkow E. M., Fatuzzo M., Myers P. C., 2006, ApJ, 641,
504Behroozi P. S., Conroy C., Wechsler R. H., 2010, ApJ, 717, 379Behroozi P. S., Loeb A., Wechsler R. H., 2013a, J. Cosmol. Astropart. Phys.,
6, 19Behroozi P. S., Wechsler R. H., Conroy C., 2013b, ApJ, 762, L31Behroozi P. S., Wechsler R. H., Wu H.-Y., 2013c, ApJ, 762, 109Behroozi P. S., Wechsler R. H., Wu H.-Y., Busha M. T., Klypin A. A.,
Primack J. R., 2013d, ApJ, 763, 18Behroozi P. S., Wechsler R. H., Conroy C., 2013e, ApJ, 770, 57Behroozi P. S., Marchesini D., Wechsler R. H., Muzzin A., Papovich C.,
Stefanon M., 2013f, ApJ, 777, L10Bouwens R. J. et al., 2011, ApJ, 737, 90Bouwens R. J. et al., 2012, ApJ, 754, 83Bradley L. D. et al., 2012, ApJ, 760, 108Buchhave L. A. et al., 2012, Nature, 486, 375Buchhave L. A. et al., 2014, Nature, 509, 593Burke C. J., Gaudi B. S., DePoy D. L., Pogge R. W., 2006, AJ, 132, 210Campante T. L. et al., 2015, ApJ, 799, 170Carter B., 1983, Phil. Trans. R. Soc. A, 310, 347Catanzarite J., Shao M., 2011, ApJ, 738, 151Chabrier G., 2003, PASP, 115, 763Clarke C. J., 2007, MNRAS, 376, 1350Conroy C., van Dokkum P. G., 2012, ApJ, 760, 71Cox T. J., Loeb A., 2008, MNRAS, 386, 461Cumming A., Butler R. P., Marcy G. W., Vogt S. S., Wright J. T., Fischer D.
A., 2008, PASP, 120, 531Dave R., 2008, MNRAS, 385, 147Davies M. B., Adams F. C., Armitage P., Chambers J., Ford E., Morbidelli A.,
Raymond S. N., Veras D., 2014, in Beuther H., Klessen R. S., DullemondC. P., Henning T., eds, Protostars and Planets VI. Univ. Arizona Press,Tuscan, AZ, p. 787
Drake F., Sobel D., 1992, Is Anyone Out There? The Scientific Search forExtraterrestrial Intelligence. Delacorte Press, New York
Fischer D. A., Valenti J., 2005, ApJ, 622, 1102Gonzalez G., 2014, MNRAS, 443, 393Hinshaw G. et al., 2013, ApJS, 208, 19Holtzman J. A. et al., 2015, preprint (arXiv:1501.04110)Johnson J. L., Li H., 2012, ApJ, 751, 81Kasting J. F., Whitmire D. P., Reynolds R. T., 1993, Icarus, 101, 108Kennedy G. M., Kenyon S. J., 2008, ApJ, 673, 502Klypin A. A., Trujillo-Gomez S., Primack J., 2011, ApJ, 740, 102Kopparapu R. K., Ramirez R. M., SchottelKotte J., Kasting J. F.,
Domagal-Goldman S., Eymet V., 2014, ApJ, 787, L29Kravtsov A. V., Klypin A. A., 1999, ApJ, 520, 437Kravtsov A. V., Klypin A. A., Khokhlov A. M., 1997, ApJS, 111, 73
Licquia T. C., Newman J. A., 2015, ApJ, 806, 96Lineweaver C. H., 2001, Icarus, 151, 307Lineweaver C. H., Fenner Y., Gibson B. K., 2004, Science, 303, 59Lissauer J. J., Dawson R. I., Tremaine S., 2014, Nature, 513, 336Livio M., 1999, ApJ, 511, 429Loeb A., 2002, Phys. Rev. D, 65, 047301McLure R. J. et al., 2011, MNRAS, 418, 2074Maiolino R. et al., 2008, A&A, 488, 463Malmberg D., Davies M. B., Heggie D. C., 2011, MNRAS, 411, 859Mannucci F., Cresci G., Maiolino R., Marconi A., Gnerucci A., 2010,
MNRAS, 408, 2115Meibom S. et al., 2013, Nature, 499, 55Montalto M. et al., 2007, A&A, 470, 1137Moustakas J. et al., 2011, preprint (arXiv:1112.3300)Moustakas J. et al., 2013, ApJ, 767, 50Munoz J. A., Peeples M. S., 2015, MNRAS, 448, 1430Nagamine K., Loeb A., 2003, New Astron., 8, 439Nagamine K., Loeb A., 2004, New Astron., 9, 573Peeples M. S., Somerville R. S., 2013, MNRAS, 428, 1766Peeples M. S., Werk J. K., Tumlinson J., Oppenheimer B. D., Prochaska J.
X., Katz N., Weinberg D. H., 2014, ApJ, 786, 54Quinn S. N. et al., 2012, ApJ, 756, L33Reffert S., Bergmann C., Quirrenbach A., Trifonov T., Kunstler A., 2015,
A&A, 574, A116Sagan C., 1963, Planet. Space Sci., 11, 485Salpeter E. E., 1955, ApJ, 121, 161Schermer M., 2002, Sci. Am., 287, 33Shibuya T., Ouchi M., Harikane Y., 2015, ApJS, 219, 15Sigurdsson S., Richer H. B., Hansen B. M., Stairs I. H., Thorsett S. E., 2003,
Science, 301, 193Smith R. J., 2014, MNRAS, 443, L69Smith R. J., Lucey J. R., Conroy C., 2015, MNRAS, 449, 3441Sonnenfeld A., Treu T., Gavazzi R., Marshall P. J., Auger M. W., Suyu S.
H., Koopmans L. V. E., Bolton A. S., 2012, ApJ, 752, 163Spiegel D. S., Turner E. L., 2012, Proc. Natl. Acad. Sci., 109, 395Strigari L. E., Barnabe M., Marshall P. J., Blandford R. D., 2012, MNRAS,
423, 1856Sumi T. et al., 2011, Nature, 473, 349Tamm A., Tempel E., Tenjes P., Tihhonova O., Tuvikene T., 2012, A&A,
546, A4Thompson T. A., 2013, MNRAS, 431, 63Tutukov A. V., Shustov B. M., Wiebe D. S., 2000, Astron. Rep., 44, 711van der Marel R. P., Fardal M., Besla G., Beaton R. L., Sohn S. T., Anderson
J., Brown T., Guhathakurta P., 2012, ApJ, 753, 8van der Wel A. et al., 2014, ApJ, 788, 28Veras D., Raymond S. N., 2012, MNRAS, 421, L117Wang J., Fischer D. A., 2013, AJ, 149, 14Wang J., Fischer D. A., Horch E. P., Xie J.-W., 2015, ApJ, 806, 248Ward P., Brownlee D., 2000, Rare Earth: Why Complex Life is Uncommon
in the Universe. Copernicus, New YorkWeidner C., Kroupa P., 2006, MNRAS, 365, 1333Werk J. K. et al., 2014, ApJ, 792, 8Williams J. P., Cieza L. A., 2011, ARA&A, 49, 67
A P P E N D I X A : A D D I T I O NA L S Y S T E M AT I C SA F F E C T I N G P L A N E T F O R M AT I O NAND STABI LI TY
Beyond galaxy star formation rates and metallicities, PFRs couldvary with the stellar IMF and the nearby stellar density. For thestellar IMF, host star mass is known to affect both the incidenceand survival time of protoplanetary discs (see Williams & Cieza2011, for a review). If the stellar IMF varied with redshift (Dave2008) or galaxy mass (Weidner & Kroupa 2006), this would changethe distribution of host star masses, correspondingly changing thePFR per unit stellar mass. The Milky Way appears consistent with
MNRAS 454, 1811–1817 (2015)
at Space Telescope Science Institute on October 20, 2015
http://mnras.oxfordjournals.org/
Dow
nloaded from
Cosmic planet formation 1817
a non-evolving IMF (Chabrier 2003); more massive galaxies mayhave formed relatively more stars below 1 M⊙ (i.e. a Salpeter1955 IMF) in the past (Conroy & van Dokkum 2012; Sonnenfeldet al. 2012), although this has been debated (Smith 2014; Smith,Lucey & Conroy 2015).
For Earth-like planets around Sun-like stars, a Salpeter (1955)IMF yields only 30 per cent more mass in F5-K stars than a Chabrier(2003) IMF. For giant planets, the incidence rate scales with host starmass to at least the first power for stars less than 1 M⊙ (Cumminget al. 2008; Kennedy & Kenyon 2008), meaning that a Salpeter(1955) IMF would yield at most 70 per cent more giant planets thana Chabrier (2003) IMF. These offsets are well within the 0.5–1 dexuncertainties on the overall planet incidence (Lissauer et al. 2014).
Stellar density may impact protoplanetary disc survival eithervia radiation (from nearby O stars) or via interactions in densestar clusters (Williams & Cieza 2011). Both would cause a redshiftevolution in the PFR per unit stellar mass, because galaxies at highredshifts were (on average) much denser than galaxies today (vander Wel et al. 2014; Shibuya et al. 2015). For example, galaxies atz = 9 are ∼20 times smaller in every direction, resulting in galaxydensities similar to today’s globular clusters (Shibuya et al. 2015).Calculations for the effects of nearby O stars suggest, however,that the impact on protoplanetary discs is limited to regions beyond15 au (e.g. beyond Saturn) even at the dense centres of star clusters(Adams et al. 2004; Clarke 2007), with the effects limited to >50 au(e.g. beyond Neptune) for more typical environments within clusters(cf. Thompson 2013). For interactions, Wang et al. (2015) found thatgiant planet incidence in binary star systems was only reduced forbinary separations less than 20 au; incidence for binary separationsbetween 20 and 200 au was instead mildly enhanced, and incidenceat greater separations was similar to individual stars’ incidence rates.As a comparison, stellar densities in globular clusters correspond totypical stellar separations of ∼50 000 au; even for the longest lived(10 Myr) protoplanetary discs, cluster stars will have typical closestapproaches of ∼1000 au (Adams et al. 2006).
While PFRs may be relatively insensitive to the nearby envi-ronment, the same cannot be said of planet orbit stability overseveral gigayears (see Davies et al. 2014, for a review). Fortuitousmicrolensing events have suggested significant numbers of free-floating giant planets (Sumi et al. 2011; Strigari et al. 2012), whichcould have scattered or migrated from their original birthplaces butmay also have formed in situ (Veras & Raymond 2012). In clusters,flybys of stars near planetary systems cause direct ejection, longerterm (∼100 Myr post-flyby) destabilization, and increased orbiteccentricities (Malmberg, Davies & Heggie 2011). That said, ob-servational evidence for different planet incidence rates in clustershas been mixed (Sigurdsson et al. 2003; Burke et al. 2006; Montaltoet al. 2007; Quinn et al. 2012; Meibom et al. 2013).
Accounting for these effects is beyond the scope of this paper.Instead, we note that typical stars in the Milky Way are 5–10 Gyr old(Behroozi et al. 2013e), so that planets detected around these stars(e.g. with Kepler) are exactly those that have remained bound forlong periods of time. Hence, the PFR in this paper is best interpretedas the bound PFR. Even so, there is no guarantee that these planetsremained in stable orbits for the lifetimes of their host stars; evenmild changes in planet eccentricity could be detrimental to the de-velopment of civilizations (Section 4.2). Qualitatively, larger stellardensities in the past would lead to more interactions and thereforeless planetary stability. This would reduce the fraction of habitableplanets formed before the Earth, proportionally raising the likeli-hood of future civilizations according to the argument presented inSection 4.2.
APPENDI X B: RECOVERI NG GALAXY STARFORMATI ON HI STORI ES
Our reconstruction technique (detailed fully in Behroozi et al.2013e) uses forward modelling to extract the relationship betweenstellar mass, halo mass, and redshift (M∗(Mh, z)). Briefly, we adopta flexible parametrization3 for M∗(Mh, z). Any M∗(Mh, z) in this pa-rameter space may be applied to a dark matter simulation, assigninggalaxy stellar masses to every halo at every redshift. Linking haloesacross redshifts with merger trees, the implied evolution of galaxystellar mass, as well as average galaxy star formation rates, can bereconstructed. At the same time, the resulting predictions for ob-servables, including galaxy number densities, galaxy specific starformation rates, and total cosmic star formation rates are availablefrom the assigned stellar masses and inferred star formation rates.Comparing these predictions to observations using a Markov ChainMonte Carlo method, we are able to constrain the allowable formof M∗(Mh, z), and consequently the allowable reconstructions forgalaxy star formation histories.
Observational constraints are compiled in Behroozi et al. (2013e)from over 40 recent papers. At low redshifts, these include resultsfrom SDSS and PRIMUS (Moustakas et al. 2013); at high redshifts,these include constraints on galaxy number densities and star for-mation rates for z < 8 from Hubble observations (Bouwens et al.2011, 2012; McLure et al. 2011; Bradley et al. 2012). Note that,above, we generate predictions for galaxy number densities as afunction of stellar mass and redshift (φ(M∗, z)). For calculations in-volving galaxy number densities in this paper, we use the predictionfor φ(M∗, z) from the best-fitting M∗(Mh, z); this gives a smoothform for φ(M∗, z) which is less susceptible to sample variance thanusing the individual data sources in our compilation.
We use the Bolshoi dark matter simulation (Klypin, Trujillo-Gomez & Primack 2011) for halo properties (including mass func-tions and merger rates). Bolshoi follows a periodic, comoving vol-ume 250 h−1 Mpc on a side with 20483 particles (∼8 × 10⁹), eachwith mass 1.9 × 10⁸ M⊙, and was run with the ART code. (Kravtsov,Klypin & Khokhlov 1997; Kravtsov & Klypin 1999) The adoptedcosmology (flat !CDM; h = 0.7, "m = 0.27, σ 8 = 0.82, ns = 0.95)is consistent with WMAP9 results (Hinshaw et al. 2013). Halofinding and merger tree construction used the ROCKSTAR (Behroozi,Wechsler & Wu 2013c) and CONSISTENT TREES (Behroozi et al. 2013d)codes, respectively.
3 The z = 0 stellar mass–halo mass relation has six parameters: characteristicM∗ and Mh, a faint-end slope, a bright-end shape, a faint-bright transitionshape, and the scatter in M∗ at fixed Mh. For each z = 0 parameter, anothervariable controls the evolution to intermediate (z ∼ 1) redshifts, and a thirdvariable controls the evolution to high (z > 3) redshifts.
This paper has been typeset from a TEX/LATEX file prepared by the author.
MNRAS 454, 1811–1817 (2015)
at Space Telescope Science Institute on October 20, 2015
http://mnras.oxfordjournals.org/
Dow
nloaded from