on the interaction and spherical blast waves coalescence of
TRANSCRIPT
On the Interaction and Spherical Blast Waves M. Kandula' ,R. Freeman2
'ASRC Aerospace, Kennedy Space Center, FL 32899
2NASA Kennedy Space Center, FL 32899
Coalescence of
Keywords: Spherical blast waves; Blast wave interaction; Measurements on interacting blast waves
Abstract: The scaling and similarity laws concerning the propagation of isolated spherical blast waves are briefly reviewed. Both point source explosions and high pressure gas explosions are considered. Test data on blast overpressure from the interaction and coalescence of spherical blast waves emanating from explosives in the form of shaped charges of different strength placed in the vicinity of a solid propellant stack are presented. These data are discussed with regard to the scaling laws concerning the decay of blast overpressure. The results point out the possibility of detecting source explosions from far-field pressure measurements.
1 Introduction The study of the propagation of blast waves in air is of great technical interest in many industrial applications- chemical, nuclear and aerospace. Blast waves are generated by point explosions (nuclear explosions and detonation of solid explosives, solid and liquid propellant rocket motors), high pressure gas containers (chemical explosions) and laser beam focusing. Blast wave problems also arise in astrophysics, hypersonic aerodynamics and hypervelocity impact. An understanding of the properties of the blast waves both in the near-field and the far-field is useful with regard to the characteristics such as blast overpressure, blast speed, and impulse.
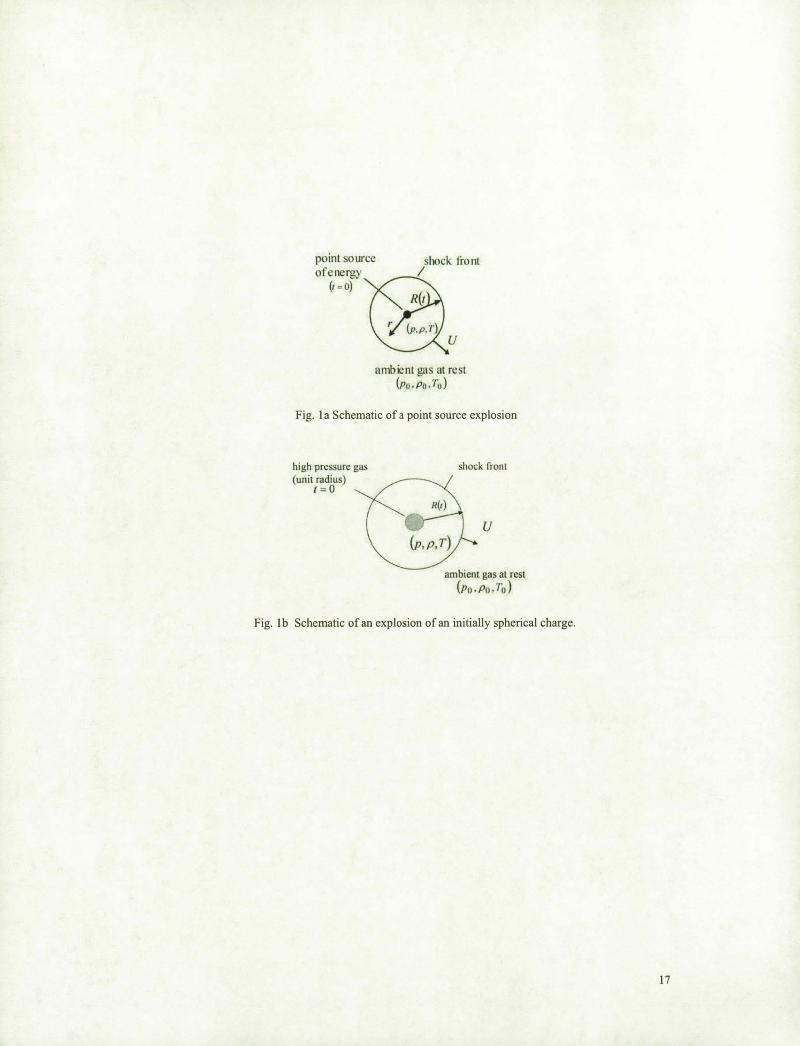
Many theoretical and experimental studies were reported by several investigators on the planar, cylindrical and spherical blast waves since the classical work of Taylor [1-3] on strong (intense) blast waves from point source explosions (Fig. la). Notable theoretical studies on point source explosions include those of Sedov [4-5], and von Neumann [6]. The similarity solutions were related to the description of strong shocks in the early stage of development covering short distances from the center of explosion. Blast waves of moderate shock strength emanating from point sources were theoretically studied by Sakurai [7, 8] with a perturbation scheme, Oshima [9] with a quasi-similarity method, and numerically by Goldstine and von Neumann [10], and Bach and Lee [II].
In the other extreme of the nearly linear regime, when the shock has become rather weak, Whitham [12] proposed a general theory to cover such flows. It describes attenuation of spherical shocks at large distances from the origin. The character of blast waves at large distances from the origin was also reported by Landau [\3].
Numerical solutions to the more realistic case of initially isothermal high pressure gas explosions (Fig. Ib) were provided by Brode [14, 15], Friedman [16], Liu et al [17], Chen and Liung [18]. The existence of secondary shocks under certain circumstances is demonstrated. For a detailed discussion on isolated spherical blast waves, see Sedov [5], Sachdev [19] and Kinney and Graham [20].
Interesting problems also arise in the propagation and interaction (coalescence) of blast waves emanating from the detonation of closely spaced explosive charges (sequentially detonating, spatially distributed ammunition stacks). Regions of significant overpressure associated with the
, Subject Matter Expert, Mail Stop ASRC-S2II Tel: 1-321-867-4456; Fax: 1-321-383-4144; e-mail: [email protected]
2 Launch Services Program.
https://ntrs.nasa.gov/search.jsp?R=20130012036 2018-02-18T02:25:01+00:00Z
coalescence of blast waves from distributed ammUnItIOn stacks may be less extensive than regulatory requirements (Starkenberg and Benjamin [21)).
This paper summarizes the characteristics and scaling laws associated with isolated spherical blast waves. Test data for the propagation and coalescence of blast waves from closely spaced multiple charges and solid propellant are examined and analyzed.
2 Isolated Blast Wave Propagation A knowledge of the properties of isolated blast wave propagation is useful in the understanding of interaction and coalescence of blast waves. Here we briefly summarize the similarity nature of spherical blast waves originating from point-source (massless) explosions and high pressure gas containers.
When disturbances of finite amplitude are propagated in perfect gases (destitute of viscosity or heat conductivity), discontinuities in pressure, velocity and temperature of the medium may occur. These are called shock waves (or shocks) or blast waves (intense shock waves). Shock waves and the flowfield become planar, cylindrically symmetric, or spherically symmetric, respectively if the energy source is in a plane, along a line, or at a point in space. The appearance of shocks is a consequence of nonlinear character of the equations governing the propagation of finite disturbances that is 'in part responsible for the formation of discontinuities.
2.1 Boundary Conditions
2.1.1 Rankine-Hugoniot Relations
The Rankine-Hugoniot relations serve as boundary conditions at the shock front for the analytical or numerical solutions. Behind the shock, a strong blast wind is initiated, which moves in the direction of the shock. The Rankine-Hugoniot relations (boundary conditions) across a shock of finite strength at r = R{t ) are (Shapiro [22]; Liepmann & Roshko [23)):
.El..= r+1 _2_ ~ +1 .!!l..=..!L ~ _r- I {
2 )-1 [ 2) Po r -1 r -I (U ) , Po r + 1 c6 r + 1 '
~ __ 2_ 1-.:Q... [
2 ) U - r+l U 2
(I)
where p, P, and T denote respectively the pressure, density and temperature of the gas, r the
specific heat ratio (isentropic exponent), c the speed of sound, and up the particle velocity
immediately behind the shock. Here the shock velocity U (relative to the undisturbed gas; i.e. relative to a fixed coordinate system) is defined by
U = dRldt (2)
with R denoting the shock radius (or shock trajectory), and t the time. The speed of sound in the undisturbed medium is expressed by
(3)
The shock Mach number Ms (= U I co) and the particle velocity up (near the shock) may be
expressed in terms of the pressure ratio as
(4a)
2
j ]112
Up = (n-l) 2r/{y+ 1) Co Po n + r - 1
Po r+ 1
(4b)
The quantity P = (PI/PO - 1) represents the strength of the shock, and 6.p = PI - Po denotes the
overpressure.
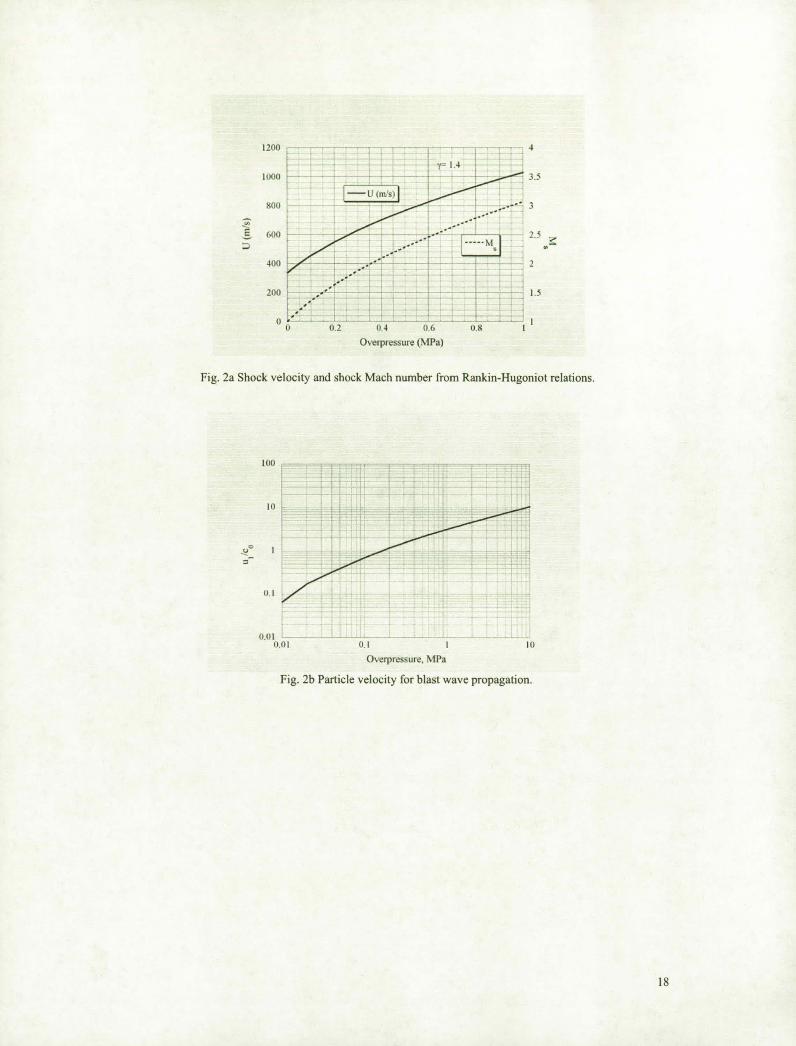
Fig. 2a shows the vanatJOn of shock Mach number and shock speed as a function of overpressure, as given by eq. (4a). The shock speed increases with increasing overpressure. For example, the overpressure corresponding to a shock Mach number of 3 is about 1 MPa. The corresponding shock speed is 1040 mis, which is comparatively high relative to the ambient sound speed (335 mls). The dependence of particle velocity on overpressure is provided in Fig. 2b, as obtained from eq. (4b).
Strong Shock Conditions
The strong shock conditions (PI » Po ,U » Co ), as obtained from (1), simplify to
(5)
In terms of the pressure ratio, the shock Mach number and the particle velocity may be expressed as
2 PI
r(r+ 1) Po (6)
2.1.2 Constancy of total Energy
The energy released Ea is assumed constant, and is expressed by
R
f{ 1 2 1 (p po)} a Ea = -u +-- --- pr dr, 2 r- 1 P Po
a =0,1,2 (7a)
o
where the a = 0, 1 and 2 respectively corresponds to the plane, cylindrical and spherical blast waves. This represents the explosion energy per unit area of the surface of the shock when
R equals unity. In the strong shock limit ( Po « P ), eq. (7a) reduces to
R R
E = 41< f G pu2 }2 dr + 41< f r ~ 1 r2 dr (7b)
o 0
The constancy of energy in each sphere implies that the energy flowing into the sphere with the new material that enters it exactly balances the work which its original surface does by expanding it against the surrounding pressure.
3
2.2 Point Source Explosions
2.2.1 Strong Shock Solutions
Self-similar solutions for the case of very strong shocks (short times after the explosion) were developed by Taylor [1-3] for spherical blast waves in his classical blast wave theory. These solutions are based on the fonn of the shock radius, which yield similarity solution. According to Taylor [2], a finite but large amount of energy is suddenly released by nuclear fission in an infinitely concentrated fonn. This leads to the fonnation of a shock wave according to
(8)
which leads to a similarity solution. Here the quantity S is a dimensionless constant which is dependent on the specific heat ratio r, and is detennined by solving the equations of motion.
The governing partial differential equations (of continuity, momentum and energy) for a spherical wave in Eulerian fonn are thereby reduced to an ordinary differential equation (ODE), involving a single independent similarity variable defined by
~ = rl R{t) (9)
The Rankine-Hugoniot relations for strong shock (eq. 5) are utilized as the boundary condition at the shock front. Taylor [2-3] numerically solved the ODE. Taylor [2-3] solved the system for r = 1.4 numerically, starting from the condition at the shock ~ = 1 .
An exact closed fonn analytical solution to the Taylor problem is given by Sedov [4], von Neumann [6], and later by lL. Taylor [24). Sedov [4] obtained solutions for plane, cylindrical and spherical blast waves, and for various values ofr. Von Neumann [6] sought a similarity solution
for the point explosion in Lagrangian fonnulation. The unknown shock boundary as a free surface is detennined as part of the solution.
2.2.2 Shocks of Moderate Strength
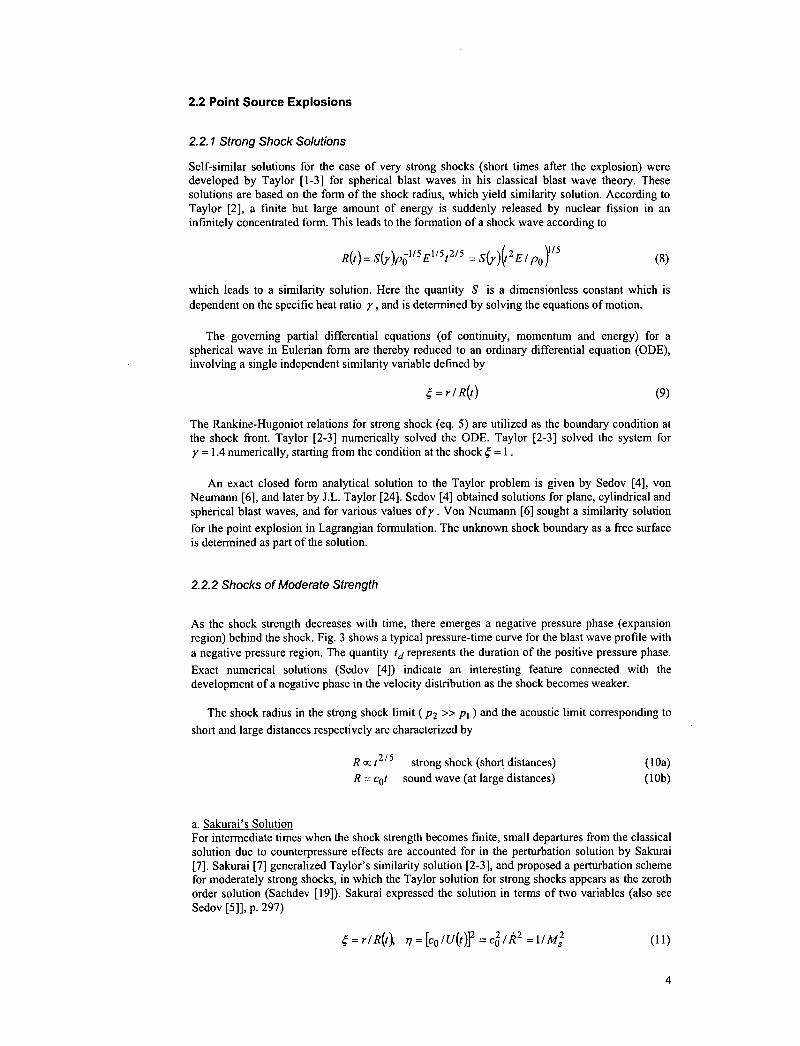
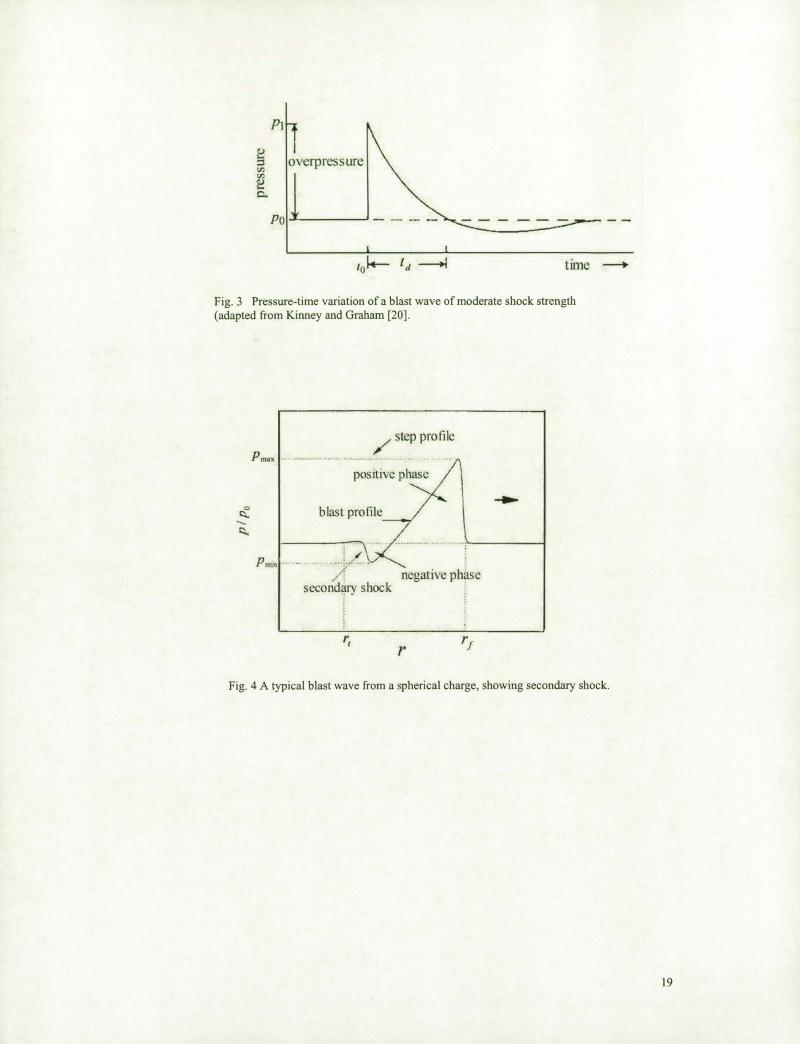
As the shock strength decreases with time, there emerges a negative pressure phase (expansion region) behind the shock. Fig. 3 shows a typical pressure-time curve for the blast wave profile with a negative pressure region. The quantity td represents the duration of the positive pressure phase.
Exact numerical solutions (Sedov [4]) indicate an interesting feature connected with the development of a negative phase in the velocity distribution as the shock becomes weaker.
The shock radius in the strong shock limit (P2 » PI ) and the acoustic limit corresponding to
short and large distances respectively are characterized by
a. Sakurai's Solution
strong shock (short distances) sound wave (at large distances)
(lOa) (lOb)
For intennediate times when the shock strength becomes finite, small departures from the classical solution due to counterpressure effects are accounted for in the perturbation solution by Sakurai [7]. Sakurai [7] generalized Taylor's similarity solution [2-3], and proposed a perturbation scheme for moderately strong shocks, in which the Taylor solution for strong shocks appears as the zeroth order solution (Sachdev [19]). Sakurai expressed the solution in tenns of two variables (also see Sedov [5]], p. 297)
(11 )
4
The Rankine-Hugoniot equations for shocks of arbitrary strength (eq. I) are utilized here as the boundary condition at the shock front.
The similarity parameter of Sakurai [7] is expressed by
(12)
where Co denotes the undisturbed speed of sound, R the shock radius, and Ro the characteristic
length. A quasi-similarity rule was proposed by Oshima [9].
b. Solution of Bach and Lee Bach and Lee [II] reported an approximate solution similar to that of Sakurai [25] for the entire range of the blast evolution (from strong shock to weak acoustic wave). The main assumption is that the density behind the shock wave in the blast obeys a power law, with the exponent being a function of time. A quasi-similarity is shown to exist for the decay coefficient e for moderate blast strengths as (Higashino et al. [26])
(13)
where (14)
The results of Bach and Lee [ll] agree closely with the numerical solution of Goldstine and Von Neumann [10]. The condition e = -I corresponds to the strong shock limit, and e = 0 to the acoustic (weak shock) limit. Sakurai's perturbation solution (Sakurai [7-8]), and the approximate linear velocity profile solution of Sakurai [27] are shown to be less accurate. The velocity profiles suggest that the particle velocities can be negative in regions behind the blast wave in the moderate and weak shock regions (i.e., particles are directed towards the center of symmetry). These results are consistent with the exact numerical solutions of Sedov [5].
2.2.3 The Shock Wave at Large Distance
At large distances from the center of explosion when the shock has become rather weak, Whitham [12] proposed a general theory to describe the attenuation of spherical shocks. The only assumption is that since the entropy changes are of third order in shock strength, the flow with weak shocks may be considered isentropic. Thus R = R(co,t)at large distances from the origin. A
fraction of explosion energy which is degraded as heat is thus not available for doing work as the shock propagates.
2.3 High Pressure Gas Explosions (Bursting Sphere)
A more realistic problem than that of point explosion is the case of a unit sphere of high pressure gas at time t = 0 suddenly expanding into a homogeneous atmosphere (air) at rest. This problem was treated numerically by Brode [14-15] and analytically (approximately) by Friedman [16]. At sufficiently high pressure, an important new phenomenon arises here due to the occurrence of a secondary shock that does not appear in the one-dimensional shock tube problem (Sachdev [19]).
A typical blast wave pressure profile is shown here (Fig 4). The major difference between a planar shock wave and a planar blast wave is that the flow properties behind the shock wave front are constant. A distinct characteristic of a spherical blast wave is a moving shock wave Uump in pressure) immediately accompanied by expansion waves behind the blast wave front. There is a blast wave profile region in which the flow properties are rapidly decreased due to expansion waves (Chen & Liang [18]). Due to its 3-D expansion, the intensity of the blast wave always decreases with time and distance during its propagation. The overpressure phase is due to the shock front and the under-pressure phase is due to the expanding waves following the shock front. Both phases result in two visible shock peaks on the pressure-time plot. Because the blast wave
5
intensity decreases with time, the range (rl ~ r ~ r f) of the blast wave profile increases, and the
magnitude of the pressure peaks (maximum and minimum) of the blast wave decreases (Chiang [18]). By contrast in shock tube experiments, the pressure downstream of a shock wave is often constant between itself and the following contact surface.
2.3.1 Brode's Numerical Solutions
Brode [14] simulated spherical blast waves, and considered two cases of practical importance: 1. strong shock, point-source explosions, 2. the sudden release of high pressure isothermal (both cold and hot) gas from spherical enclosures. For the point explosion problem, he considered the exact solution of von Neumann [6] as an initial condition. Ideal gas equation of state is considered. Artificial viscosity, introduced by von Neumann and Richtmyer [28] is considered for stabilizing the numerical solution.
Brode [15], in a subsequent study, considered a blast wave from a spherical charge of trichlorotoluene (TNT). An equation of state applicable for TNT is utilized. In his numerical studies of detonation with a spherical charge of TNT, the existence of a second shock in the focal region was demonstrated. By considering real gas at high temperature, Brode [15] has shown that the blast over pressure at any radius is lower than that given by the ideal gas solution, since a part of the available energy is absorbed by the processes of ionization and dissociation.
Brode [14] and Goldstine and von Neumann [10] show that the variation of shock overpressure varies with the shock radius R follows a power law of the form
(15)
where n is a slowly varying function of R , and A a constant (Sachdev [19], p. 242), where p is in
atmospheres.
Brode [15] has shown theoretically that the peak overpressure Pso from a free spherical air
blast can be expressed in dimensionless form (Wyle Labs [29])
(16)
where Pso is the peak overpressure due to TNT explosion, Po the atmospheric pressure, A. the
reduced distance, r the actual distance, and E the energy of the blast.
2.3.2 Numerical Solutions of Liang, Wang and Chen
Recently Liang et al. [30] numerically investigated the character (propagation and decay) of a spherical blast wave emanating from an isothermal bursting (rupture of a) sphere of pressurized air in a free field. Three minor shock waves moving behind the main shock are observed.
2.4 Variable Energy Blast Waves and Blast Wave Anisotropy
2.4.1 Variable Energy Blast Waves
Variable energy blast waves present themselves in spark discharges, laser induced blast waves and two-phase detonations. The instantaneous constant energy blast wave represents a special case of a more general class of variable energy blast waves in which the energy input varies with time according to a power law of the form [31]
(17a)
6
where Eo and p are positive constants. According to similarity theory, the shock position under
these circumstances varies as
(17b)
The case of P = 0 reduces to the instantaneous blast wave, whereas the case of P '# 0 corresponds
to the expanding piston problem.
Freeman [31] investigated in detail the special case of linear energy input (P = I ). The data of
Freeman [31] suggest that the shock wave radius at early times is smaller than that according to instantaneous energy blast wave theory [32].
2.4.2 Anisotropy in Blast Waves
Merlen and Dyment [33, 34] investigated similarity solutions for the anisotropic blast waves in a stationary ambient, and explosions in a moving gas with applications to gun-firing and the associated muzzle wave propagation. The anisotropy can arise on account of initial conditions (energy release or distribution) or external flowfield (moving stream) [33, 34]. In a stationary ambient, the anisotropy is occasioned by non-instantaneous release of energy (variable energy) or the azimuthal distribution of energy. Anisotropy can also occur with an isotropic explosion in a moving stream.
a. Intense Anisotropic Blast Waves with Azimuthal Energy Release An axisymmetrical azimuthal distribution of energy may be represented by [34]
(18a)
where 1ft denotes the azimuthal angle. If the energy release is not instantaneous (P '# 0 ), a vacuum
forms inside the flow, and the empty volume will be aspherical [34]. The case of P = I approximates the fire-arm shot (gun firing). The shock radius is expressed in the similarity
form
[ P+2 ]1/5
R{t,e)= E~o Ro{e) (18b)
It was shown that [34] in the farfield the wave properties depend only weakly on the anisotropy of the energy release, and depends primarily on the total energy, so that one can regard the wave as spherical with an equivalent energy.
b. Isotropic Explosion in a Moving Gas The effect of ambient pressure Po (counter pressure effect) and ambient velocity (U 0) have been
investigated by Merlen and Dyment [32] with the aid of a perturbation scheme relative to the selfsimilar solutions of isotropic point explosions. The anisotropic effect of ambient motion and the isotropic effect of ambient pressure are examined. The solutions were sought in the form
where
and ';0 is a constant.
[ P+2 ]1/5
r = R{t)= E~o ,;oR'{1J,t;)
Uo Pot [
3-P )1/5 1J=To -E- , [
2(3-p) ]1/5 t;=~ _t __
';6 P6E2
(19a)
(19b)
7
The theoretical solutions were compared to the measurements on gun firing with various gun calibers [33, 34]. It was demonstrated that the axial propagation of the blast waves X emanating from a gun can be expressed in dimensionless form [33] as
~X =f[~cotl V Pg Cg D V Pg cg D
(20)
where the subscripts 0 and g respectively denote the ambient gas conditions and the gas at the gun
muzzle. The quantity D denotes the gun caliber.
The muzzle wave tends asymptotically towards the blast wave of a non-instantaneous intense point explosion [33]. It was shown that the velocity of the external flow reinforces the shock towards the upstream and weakens it downstream. The pressure of the external medium becomes important only after the shock weakens, as is to be expected.
A generalization of the muzzle wave similarity was later reported by Merlen [35]. This work describes an improvement of the muzzle wave similarity that permits treatment to unsteady and non-sonic gun conditions. A numerical study of blast flowfields induced by supersonic projectiles discharged from shock tubes was published by Jiang et al. [36].
3 Interaction of Spherical Blast Waves (Blast Wave Coalescence) Reported studies on interacting spherical blast waves are relatively few. The interaction of a pair of (weak) cylindrical blast waves of either equal or unequal strength were studied experimentally and computationally by Higashino et al. [26]. Liang et al. [30] numerically investigated spherical blast wave propagation and reflection. In sequential detonation and spatially distributed blast sources, it is known that shock waves coalesce and focusing can lead to significant amplification of peak overpressure. At sufficiently large distances from the charges, coalescence will occur. An overtaking wave may first encounter the negative overpressure phase of the wave being overtaken, causing it to decelerate. The overtaking wave must be somewhat stronger than the wave being overtaken or it will not be able to penetrate the negative overpressure phase and coalescence cannot occur. Once this phase has been penetrated and the overtaking wave has penetrated the positive phase of the wave being overtaken, coalescence takes place but occurs only after some additional propagation.
3.1 Peak Overpressure
Several approximate methods of combining peak overpressure from N coalesced waves are described in Starkenberg and Benjamin [21] as follows:
2.1.1 Simple superposition
(21)
where !lp represents the combined overpressure, and !lp i the overpressure of blast wave i .
3.1.2 Full LAMB Model
Hikida and Needham [37] utilized the following scheme for blast coalescence:
8
f¥J = If¥Ji + r + I [~Ip;Ul-~ PU 2)
i=l 2 2 i=l 2
where N
P=Po + L~Pi' i=l
N
LP;Ui U=.:..i=...:l __
P
where P refers to density, and U the velocity of blast propagation.
3.1.3 Single Effective Charge
(22a)
(22b)
The method (conception) of single effective charge considers the use of pressure produced by the total explosive weight of all stacks with the coalesced waves combined at their centers of charge. That is, the peak overpressures associated with coalesced waves are essentially the same as those produced by single charges of the same total explosive weight. Zaker [38] experimentally showed that with three equal charges, the third pulse tends to overtake the second before the second overtakes the first. Thus
N
E/o/ = LEi i=l
(23)
Zaker [38] experimentally showed that with three equal charges, the third pulse tends to overtake the second before the second overtakes the first.
Charges of equal/unequal mass (charges) and delay time, and separation distances need to be considered in the development of pressure combination algorithms and coalescence maps (patterns).
3.2 Structure of Wave Interaction
According to the classification by von Neumann [39], the interaction of shock waves is called regular reflection when they first encounter each other (see Higashino et al. [26]). Later on, the interaction changes to an irregular type of reflection called by von Neumann as Mach reflection. Colella and Henderson [40] have shown that for very weak shock waves, the von Neumann theory yields no physically acceptable solution (the so-called von Neumann paradox), and this type of weak irregular reflection is termed a von Neumann reflection.
4 Test Data on Overpressure Blast overpressure data were obtained from scale model and full scale solid rocket propellant motors (upper stage) with embedded charges at NASA White Sands Test facility (WSTF) [41]. The solid propellant is struck by shaped charges of 500 gm and 20 gm. Both symmetrical (equal strength) and unsymmetrical (unequal strength) wave interactions were studied. Additional discussion of the test data is presented in [42].
9
4.1 Scale Model Tests
4.1.1 Test Configuration and Instrumentation
In one of the scale-model tests, considered here, the propellant weight was 215 kg. For comparison, the propellant in the full scale motor is about 2,007 kg. The propellant composition is: 71 % ammonium perchlorate, 18 % aluminum powder, II % hydroxyl-termicrated polybutadiene binder (HTPB). The configuration (Fig. 5a) includes a Ti-cylinder around the propellant stack to simulate the effects of the casing around the actual motor. The solid propellant was impacted with one 500-gm conical-shaped charge (CSC) of C4 and 17 gm of Comp A-4 booster pellet. The blast overpressure data is recorded up to 45 sec. from the fire command (t = 0 sec). Only the near-field blast pressure was measured.
The blast overpressure was measured by piezoelectric transducer pressure gauges (PCB) mounted on three adjustable elevated gauges lines (EGL), designated F, G and H, separated 120 deg. Apart (Fig 5b). Five pairs of PCB's were flush mounted equal distances apart on each side of the pipe, in designated positions A and B. The EGL's were constructed from 101.6 mm diameter steel pipe, 9.144 m long, and were held 1.83 m above the ground (parallel to). The PCB's had a 500 kHz resonant frequency, and a 1- J1S rise time. The PCB's were located 180 deg from each
other, parallel to the ground. EGL-F and EGL-H are fitted with a flat plate at one end, with the PCB mounted in the plate center, thus measuring the stagnation overpressure, which includes the dynamic components of overpressure due to the particle motion (impact).
In compressible flow the isentropic stagnation pressure PI always exceeds the sum of the
local static pressure P and dynamic pressure q , and is expressed by
(24a)
where ( y_1 2)rl(r-1)
PI = I+--M 2
(24b)
I 2 1 2 q=-pu =-yM P
2 2 (24c)
Eq. (24a) suggests that in incompressible flow (M ~ 0) the dynamic pressure represents exactly the impact effects, i.e., the difference between the stagnation pressure and the static pressure (Kinney [20], Shapiro [22]). In compressible flow, the stagnation pressure is not simply the sum of static and dynamic pressure as in the case of incompressible flow.
4.1.2 Test Data for Overpressure
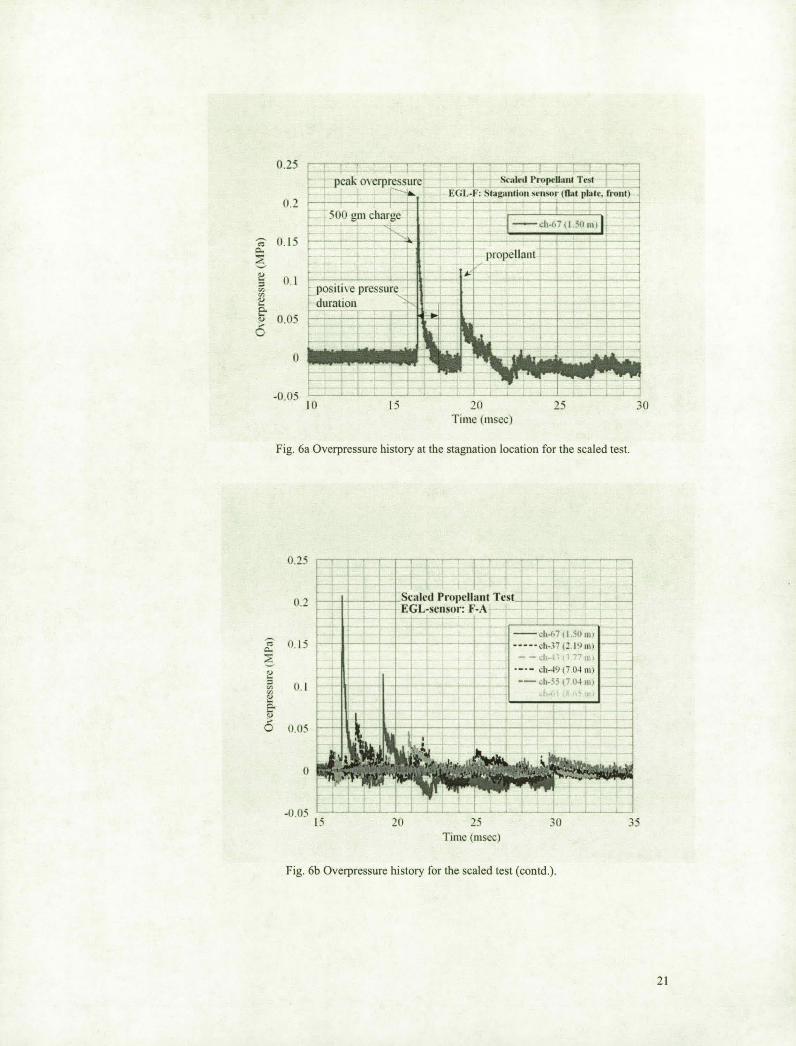
Fig.6a shows the overpressure history for the stagnation overpressure from the closest gauge on EGL-F (channel-67), which is 1.50 m from ground zero. This typical blast waveform is characterized by a peak overpressure of 0.207 MPa at 16.2 ms, and positive pressure duration (about I ms). We also notice a distinct wave due to propellant explosions, with a peak overpressure of 0.113 MPa at 19.2 ms. Only one major peak overpressure due to the propellant bum is observed here. The peak stagnation overpressure due to the charge is higher than that due to that of the propellant. Calculations (eq. 24) show that the estimated peak static overpressure at this location due to the charge is about 0.136 MPa. It is notable that the propellant pulse is somewhat wider than the pulse resulting from the 500-gm CSC. The relatively longer decay of the overpressure from the propellant blast is attributable to the long duration over which the energy is added to the flowfield. The overpressure phase is associated with the shock front location, and the under-pressure phase is connected with the expansion waves following the front. The data also suggest that the interaction between the blast waves from the 500-gm charge and the propellant is not appreciable.
10
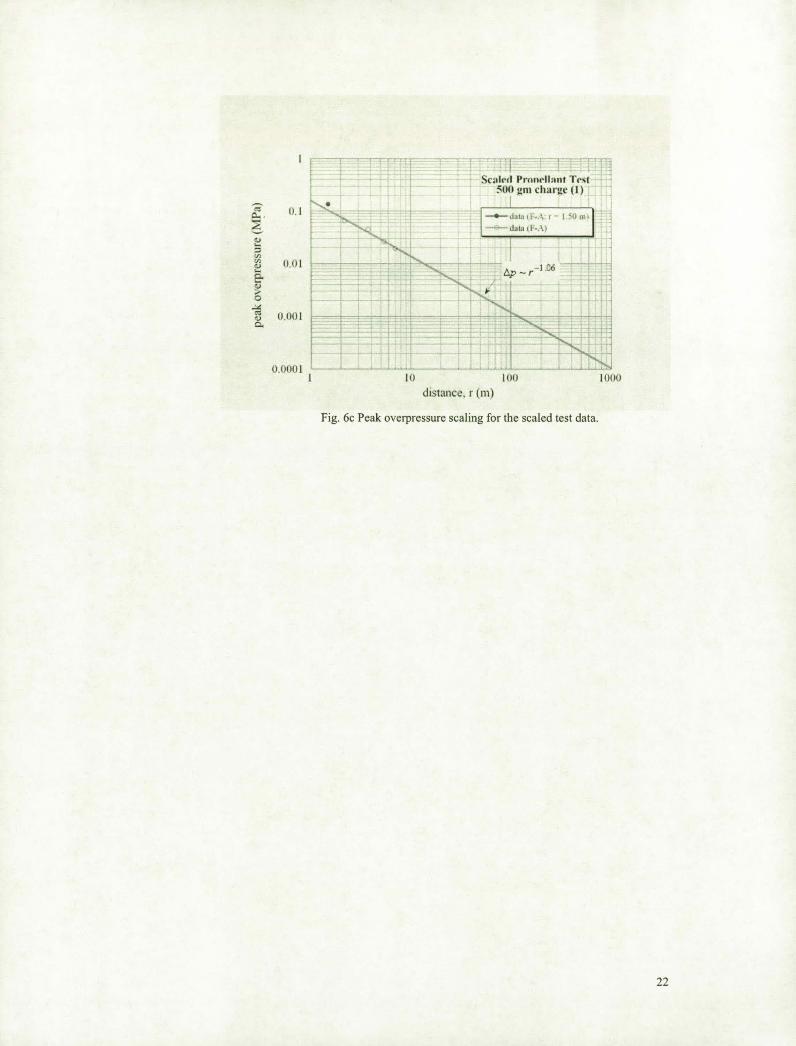
The overpressure history for a number of locations along the EGL: F-A is demonstrated in Fig. 6b. This plot illustrates the propagation and attenuation of the blast wave. The peak 6.p diminishes from 0.207 MPa at 1.494 m to 0.0172 MPa at 7 m. Considering the first two PCB's
(separated by about 0.61 m), the SOO-gm peak is displaced by about 1 ms. This result is consistent with the shock speed of about 4S7.2 mls (Fig. 2a) at t:.p '" 0.11 MPa of the second peak.
4.1.3 Peak Overpressure Extrapolation to the Far-Field
Fig. 6c presents an extrapolation of the near-field peak ~ data to the far-field. The near-field data
are correlated by the power law relation
(2S)
This result compares to the acoustic limit expressed by
(26)
4.2 Full Scale Propellant Test
4.2.1 Test Configuration and Instrumentation
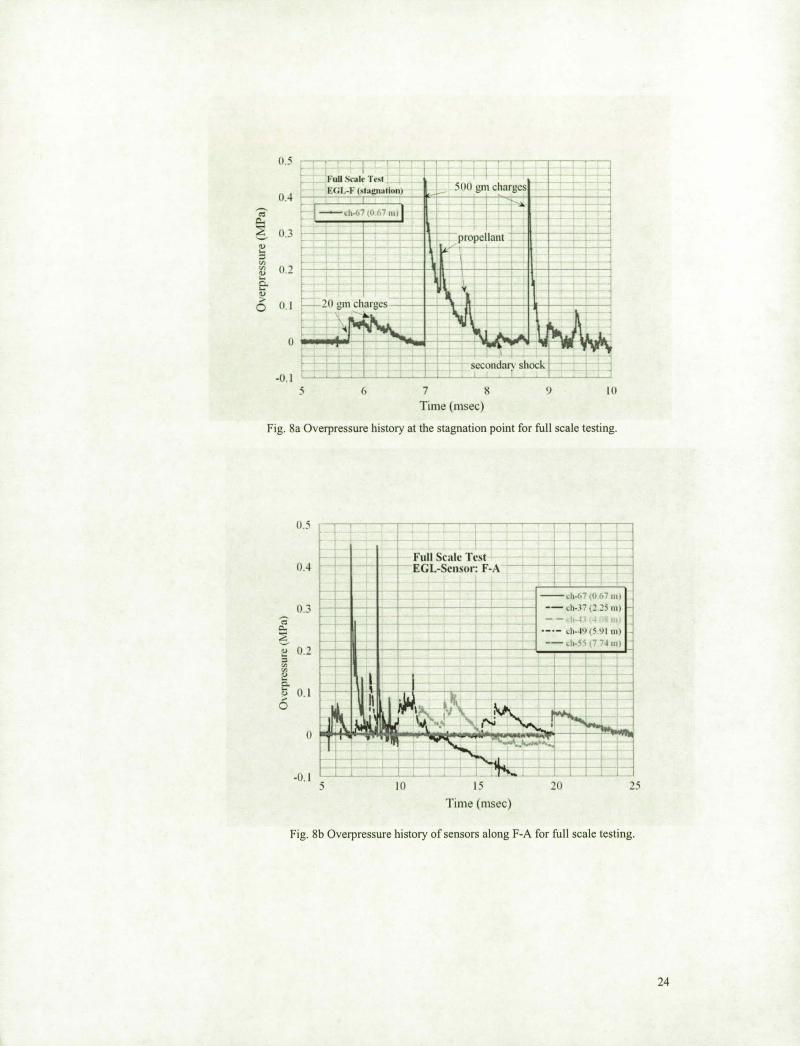
The full scale tests are described in Ref. 41. Fig. 7a shows a photographic view of the actual motor. The overall dimensions of the test article were I.S24 m wide x 2.286 m tall with 2007 kg of propellant. The propellant composition was: 71 percent ammonium perchlorate, 18 percent aluminum powder, 11 percent hydroxyl-termicrated polybutadiene binder (HTPB). The motor casing was fabricated from titanium alloy TI-6AI-4V. A total of four conical shaped charges (eSC) were used. An aft enclosure was used to simulate the nozzle. Two SOO-gm shaped charges used for the breakup system were oriented 180° from each other. Two 20-gm shaped charges were located in the spin table assembly, near the top of the nozzle skirt. The 20-gm charges were located at azimuths of 191.3° and 338°, while the SOO-gm charges were at 90° and 270°. The SOOgm CSCs are initiated 0.87 ms after the 20-gm shaped charges are actuated.
The test set up and instrumentation was essentially similar to those described for the scaled propellant tests (Fig. 7b). The instrumentation for the full scale testing was similar to that in the scaled tests, except the charges were not symmetric for EGL-F and EGL-G.
4.2.2 Test Data for Overpressure
Fig. 8a illustrates the temporal history of the stagnation overpressure on EGL-F (channel-67), indicating a series of blast waves. Two 20-gm charges are followed by two SOO-gm charge peaks in succession. The peak t:.p of about 0.448 MPa due to SOO-gm is considerably higher than that
due to 20-gm peaks, since the energies are different, as indicated by the scaling law. The estimated peal static overpressure (from eq. 24) is about 0.348 MPa. For the EGL-F the two SOO-gm are separated by about 1.22 m, and travel at about 701 mis, so that 1:11", 1.7 ms (the measured /)./ is about 1.7 ms). The peak t:.p related to propellant explosion is superposed on to the SOO-gm charge
waveforms, with relative peak magnitude of about 0.138 MPa. This value of the propellant overpressure of 0.13 MPa for the full scale motor is of the same of order of magnitude as that in the scaled test. This suggests that the propellant fragment in both the scaled or full scale test is perhaps of comparable size. The existence of multiple peaks in the overpressure history represents the interaction between the blast waves emanating from the SOO-gm charge and the propellant. Also secondary shock waves are noted. The 20-gm charges do not seem to have initiated any significant propellant bum (or breakup), with more localized rather than large-scale action.
It is remarkable that the positive pressure duration of the peak of the first SOO gm charge is considerably less than that due to the peak of the second SOO gm charge, even though the peaks for the two charges are essentially the same.
11
The peak tlp history for various locations along the EGL-F (Fig. 8b) suggests that the 500-
gm charges ultimately coalesce at about 20 sec. This merging of shocks is a consequence of the fact that the trailing shock travels relative to the particle motion occasioned in the wake of the leading shock; thus it moves at a higher speed for the same strength. The tlp decreases from 0.448
MPa to 0.052 MPa as the distance increases (due to spherical spreading). The strength of the merged shock is due to the two charges. There seems to be a problem (data drop out) with channel 37 after about 12 sec.
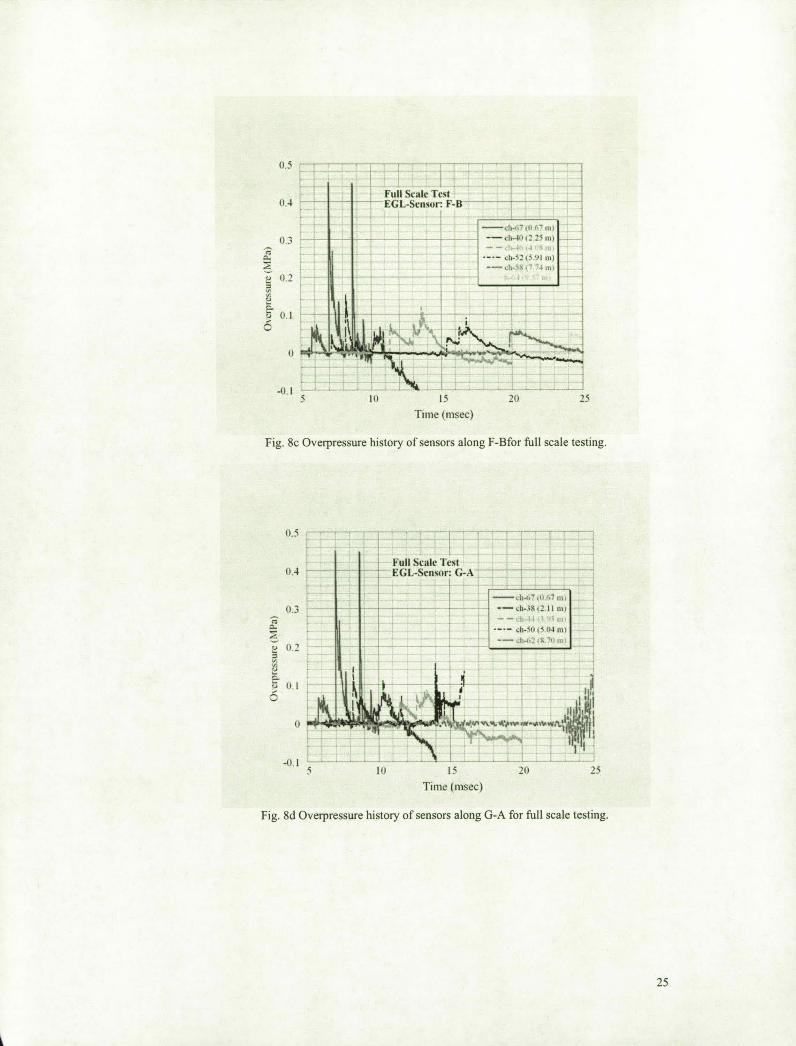
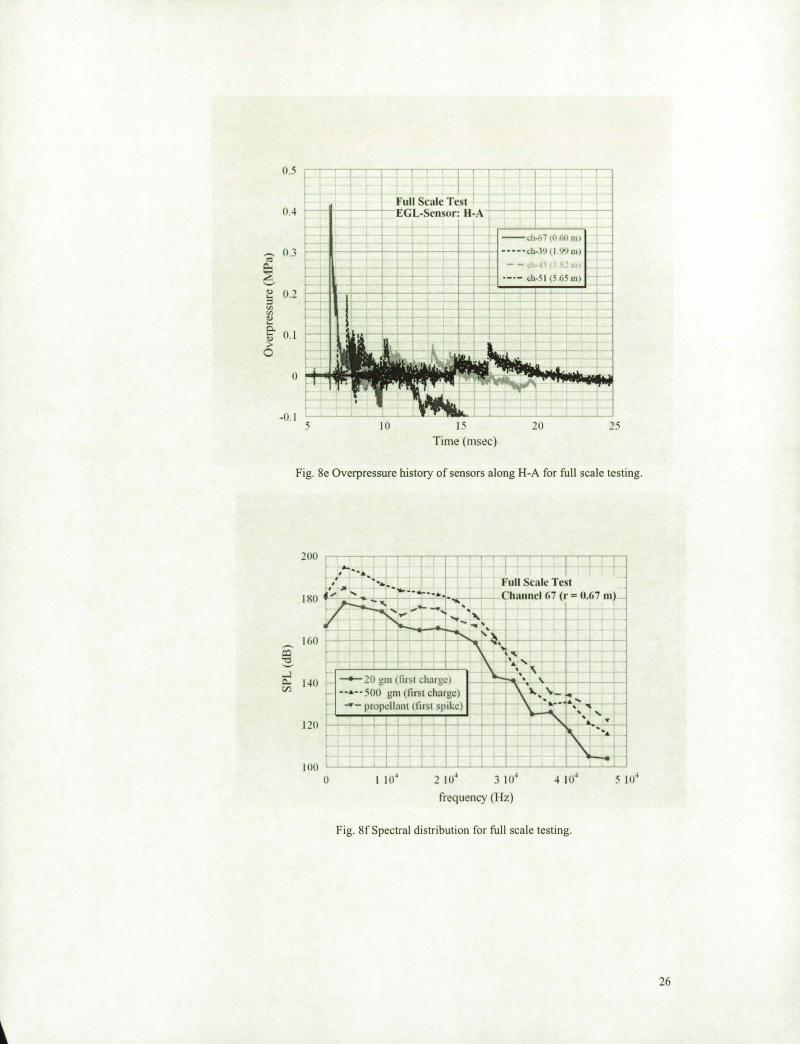
The characteristics of the blast propagation for EGL: F-B transducers, shown in Fig. 8c, are seen to be similar to that of EGL: F-A in all respects. This result is to be expected, as the transducers are similarly situated, and demonstrates the consistency of measurements. Likewise, in the case of EGL:G-A (Fig. 8d), the behavior is similar to that of EGL-F, since the charges are similarly situated. The relatively small positive pressure duration of the peak of the second 500 gm charge to that of the first 500 gm charge is also manifested in the data ofF-B and F-G also. In the case of EGL:H-A (Fig. 8e), the two 500-gm charges are located equidistantly relative to the gauges, so that the two peaks are spaced very closely. However they are located farther from the stagnation sensor (ch-67). Thus even though coalescence might have occurred, the measured stagnation pressure at this location is seen to be lower than that seen for EGL:F-A.
4.2.3 Spectral Distribution of Energy
The spectral distribution of energy for the pressure signal from channel 67 (F-A) for individual explosions of short duration for the various explosions (20 gm charge, 500 gm charge, and propellant explosion) are depicted in Fig. 8f. The quantity SPL denotes the sound pressure level (dB) relative to a reference pressure Pre! of20 j4'a, where
(27)
It is seen that the energy is distributed over a broad range of frequencies, as is to be expected for impulse type functions typical of the blast wave. There is some spectral similarity for the various explosions, with the spectra displaying a distinct peak. The spectra are similar to those presented for blast waveforms (Diaci and Mozina [43]).
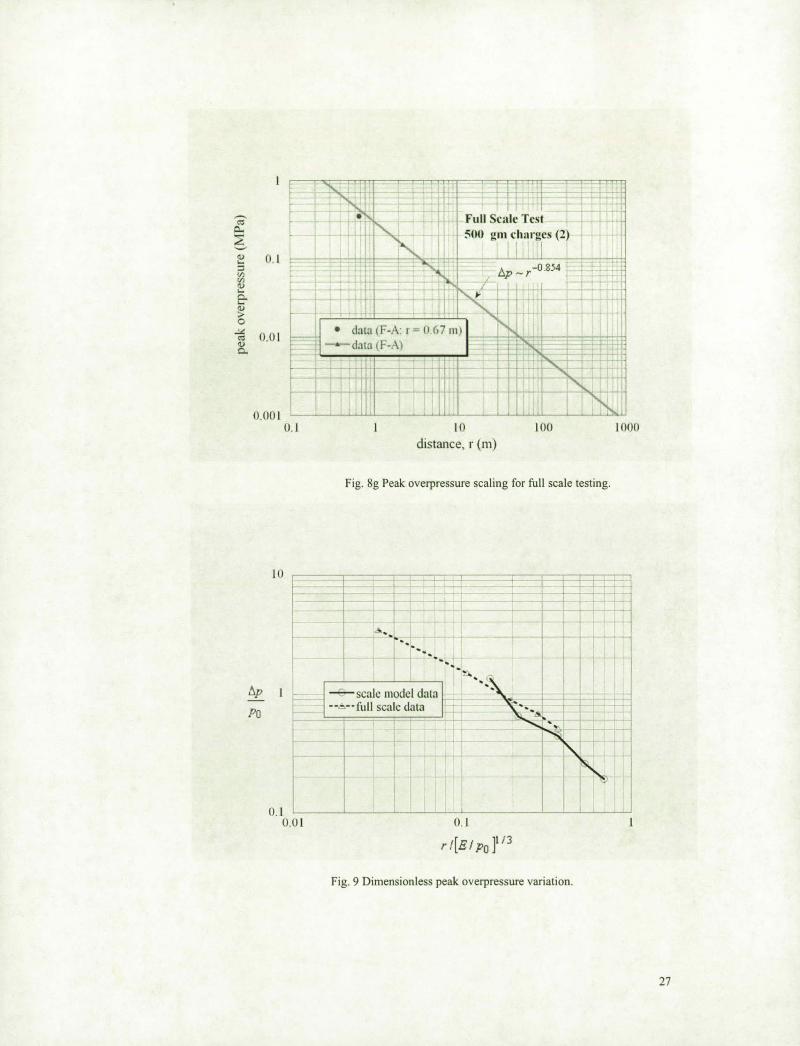
4.2.4 Peak Overpressure Extrapolation to the Far-Field
Fig. 8g presents the extrapolation of peak static overpressures to the far-field. The near-field data could be correlated by the power law relation
tlp _ r -0.854 (28)
The extrapolation suggests that the peak pressures at about 7.62 km are about 0.00 I MPa, and thus are discernible. This consideration points to the feasibility of a ground microphone system for the possible detection of unanticipated (unexpected) onboard explosions. However, the occurrence of multiple explosions, blast wave coalescence, and absorption of sound at high frequency and over long distances should be taken into account, and present considerable complexity in the detection process.
4.3 Scaling of the Farfield Overpressure
The anisotropy of the blast waves represents an important consideration linked to farfield detection of explosions. The present data (pressure wave forms) suggest that in general the explosions are closer to instantaneous blast waves rather than variable energy blast waves. In the absence of a moving medium surrounding the initial blast, the anisotropy effects in the present experiments thus likely arise primarily due to the distributed energy sources (initial energies). As the wave properties in the farfield depend primarily on the energy levels of explosions rather than their anisotropic variations [34], it seems reasonable to regard the wave as essentially spherical with an equivalent energy.
12
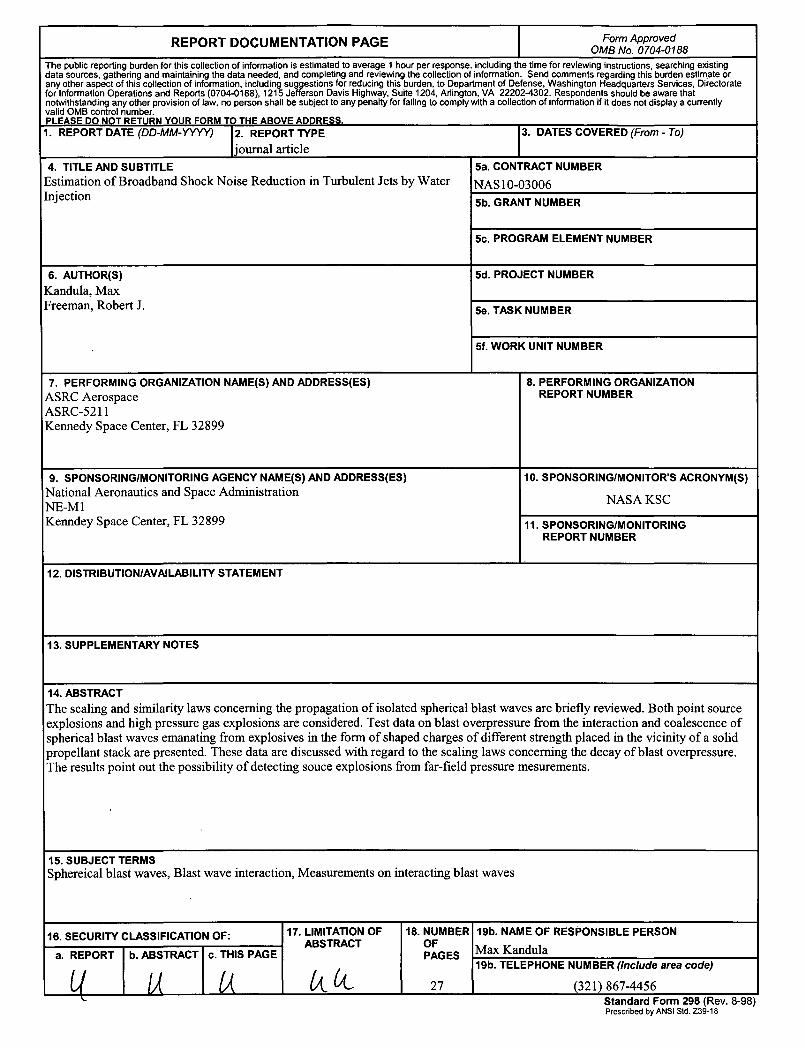
With regard to the possibility of detecting source explosions from farfield measurements, the data concerning the spatial variation of peak overpressure from both the scaled model test and the full scale test (as shown in Figs. 6c and 8g) are reformulated in dimensionless form in an attempt to determine the existence of any similarity behavior.
Fig. 9 depicts a plot of the overpressure vs. distance in dimensional form (corresponding to point source explosion) as
tlp-f[ r 1 Po - (E / PoY/3
(29)
In plotting this data, the total equivalent TNT of the propellant and the explosives have been considered. In particular, the equivalent TNT for the solid propellant is taken as 10 percent by mass, and for the 500 gm charge an equivalent of 0.707 kg of TNT is considered.
The results suggest that both the scale model data and the full scale data for the peak overpressure match satisfactorily, considering a scale ratio of about IO for the propellant mass in the present data. It is thus seen that the anisotropic effects on the farfield are not appreciable in the present experiments. This result tends to point out the feasibility of detection of source explosions from farfield measurements. Further experimental data are needed to confirm this assertion.
5 Conclusions Both the scaled test data and full scale propellant blast test data have been helpful in our understanding of the blast propagation from single and multiple charges. The data illustrate the effects of blast coalescence and propagation of blast waves of different strength. The test data for blast overpressure are found to be generally consistent with the available blast scaling laws. In this test data, the coalescence effects do not appear to be significant with regard to the blast overpressure. Also the peak over pressure seems to follow a trend of nearly linear decay with distance (acoustic type) at relatively short distances from the explosion source. The scale model and the full scale data for the peak overpressure demonstrate a similarity nature.
Acknowledgments
Thanks are due to Dr. Paul Schallhorn of the Launch Services Program (LSP) at the Kennedy Space Center for his interest in this work and for the financial support. The authors would like to thank the reviewers for their helpful suggestions and providing additional references.
13
References
1. Taylor, GI.: The air wave surrounding an expanding sphere. Proceedings of the Royal Society A 186, p. 273 (1946) ..
2. Taylor, GI.: "The formation of a blast wave by a very intense explosion, I," Proceedings of the Royal Society, Ser. A 201,159-174 (1950).
3. Taylor, GI.: The formation of a blast wave by a very intense explosion, II. The atomic explosion of 1945. Proceedings of the Royal Society, Ser. A. 201, p. 175 (1950).
4. Sedov, LI.: Propagation of intense (strong) blast waves. Prikl. Mat. Mek. (PMM) 10, p.241 (1946) (in Russian).
5. Sedov, LI.: Similarity and Dimensional Methods in Mechanics, Academic Press, New York, Chap. 4 (1959) (lOth ed., CRC Press, London, 1993).
6. Von Neumann, J.: The point source solution. National Defense Research Committee, Div. B Report AM-9 (see Collected Works of J. von Neumann, Vol. VI, Pergamon Press, Oxford, p. 219,1947).
7. Sakurai, A.: On the propagation and the structure of the blast wave 1. Journal of the Physical Society of Japan 8, p. 662 (1953).
8. Sakurai, A.: On the propagation and the structure of the blast wave II. Journal of the Physical Society of Japan 9, p. 256 (1954).
9. Oshima, K.: Blast waves produced by exploding wire. Aero. Res. Inst., University of Tokyo, Rept. 358-26-9 (1960).
10. Goldstine, RH., von Neumann, J.: Blast wave calculation. Communications in Pure and Applied Mathematics 8, 327-354 (1955).
11. Bach, GG., Lee, JHS.: An analytical solution of blast waves. AIAA J. 8, p. 271 (1970).
12. Whitham, GB.: The propagation of spherical blast. Rept. 358, Aeronautical Research Institute, Univ. of Tokyo, Japan (1960).
13. Landau, LD.: On shock waves at a large distance from the place of their origin. Soviet Journal of Physics. 9, p. 496 (1945).
14. Brode, HL.: Numerical solutions for spherical blast waves: Journal of Applied Physics 26, 766-775 (1955).
15. Brode, HL.: Blast wave from a spherical charge. Phys. of Fluids 2 (2), 217-229 (1959).
16. Friedman, MP.: A simplified analysis of spherical and cylindrical blast waves. J. of Fluid Mech. 11, 1-15 (1961).
17. Liu, n., Khoo, BC.,Yeo, KS.: The numerical simulations of explosion and implosion in air: Use of a modified Harten's TVD scheme. International Journal for Numerical Methods in Fluids, 31, 1999,661-680 (1999).
18. Chen, H., Liang, SM.: Planar blast/vortex interaction and sound generation. AIAA J. 40 (11), 2298-2304 (2002).
19. Sachdev, PL., Shock waves and Explosions. Chapman & HaIVCRC, New York (2000).
20. Kinney, GF, Graham, KJ.: Explosive Shocks in Air, 2nd ed. (1985) (see also 1st edn., SpringerVerlag).
14
21. Starkenberg, JK., Benjamin, KJ.: Predicting coalescence of blast waves from sequentially exploding ammunition stacks. Army Research Lab Report ARL-TR-645, December 1994.
22. Shapiro, A.: The Dynamics and Thermodynamics of Compressible Fluid Flow, John Wiley, New York (1953).
23. Liepmann, HW., Roshko, A.: Elements of Gas Dynamics, John Wiley & Sons Inc, p. 63 (1953).
24. Taylor, JL.: An exact solution of the spherical blast wave problem. Philosophical Magazine 46, p. 317 (1955).
25. Sakurai, A.: Exploding wires based on a conf. Exploding wire phenomena. in (W.G. Chace and H.K. Moore, eds.), I, Plenum Press, New York (1959).
26 .. Higashino, F., Henderson, LF., Shimizu, F.: Experiments on the interaction of a pair of cylindrical weak blast waves in air. Shock Waves 1,275-284 (1991).
27. Sakurai, A., Blast wave theory, in Basic Developments in Fluid Dynamics (ed. M. Holt), Academic Press, New York, 309-375 (1965).
28. Von Neumann, J., Richtmyer, RD.: A method for the numerical calculation of hydrodynamic shocks. Journal of Applied Physics 21, 232-237 (1950).
29. Wyle Laboratories, Sonic and vibration environments for ground facilities - A design manual, Report No. WR 68-2 (1968) (L.C. Sutherland, Principal Author and Editor).
30. Liang, SM., Wang, JS., Chen, H.: Numerical study of spherical blast-wave propagation and reflection. Shock Waves 12,59-68 (2002).
31. Freeman, RA.: Variable energy blast waves, Brit. J. App. Phys. (1. Physics D), ser 2. 1, 1697-1710 (1968).
32. Dabora, E.: Variable energy blast waves. AIAA 1. 10(10), 1384-1386 (1972).
33. Merlen, A., Dyment, A.: Similarity and asymptotic analysis for gun-firing aerodynamics. 1. Fluid Mech. 225, 497-528 (1991).
34. Merlen, A., Dyment, A.: Anisotropic blast waves and explosions in a moving gas. Eur. 1. Mech. BlFluids 11(2), 161-198 (1992).
35. Merlen, A.: Generalization of the muzzle wave similarity rules. Shock Waves 9(5), 341-352 (1999).
36. Jiang, Z., Takayama, K., Skews, BW.: Numerical study on blast flowfields induced by supersonic projectiles discharged from shock tubes. Phys. Fluids 10(1),277-288 (1988).
37. Hikida, S., Needham, LE.: Low Altitude Multiple Burst (LAMB) Model. S-cubed Final Report, S-CUBED-R-81-5067 (1981).
38. Zaker, T A.: Farfield overpressure from closely spaced sequential detonations. 11 th Explosive Safety (1969).
39. von Neumann, 1., Oblique reflection of shocks. Explos. Res. Rept. 12, Dept. Navy, Washington DC, 1943 (see also Collected Works 6:238-200, Oxford Pergamon, 1963).
40 Cole la, P., Henderson, LF.: The von Neumann paradox for the diffraction of weak shock waves. 1. of Fluid Mech. 213, 71-94 (1990).
41. NASA White Sands Test Facility.: STAR 48B Full Scale Demonstration Test. Special Test Report WSTF # 02-36952 (October 29, 2002).
15
42. Kandula, M., Freeman, R., On the interaction and propagation of spherical blast waves. AlAA-2007-4117 (2007).
43. Diaci, J., Mozina, J., A study of blast wave forms detected simultaneously by a microphone and a laser probe during laser ablation. Applied Physics ASS, 352-358 (1992).
16
point source shock front ofenergy I v=O)@ RV
r (P,p,T) u
ambiem gas at rest (Po,Po,To)
Fig. 1 a Schematic of a point source explosion
high pressure gas (unit radius)
1=0
shock fTont
u
ambient gas at rest (Po ,Po ,1'o)
Fig. 1 b Schematic of an explosion of an initially spherical charge.
17
1200 '~-C 4
1000 ~ y= 1.4 3.5
1
'OO C ....... ,
~.- .... ~
600 -=- ' 2.5 :s:: ::l j •••• .' W> .. '
400 .~ .
.' .. ' . I
~~ ... 200 ... ~ 1.5 . . I
I I
I
o ~~~~-o 0.2 0.4 0.6 0.8 I I
Overpressure (MPa)
Fig. 2a Shock velocity and shock Mach number from Rankin-Hugoniot relations.
10
~: ~ :l
U. I
1 0.0 1 l
0.0 1 0. 1 10
Overpressure. 1\1 Pa
Fig. 2b Particle velocity for blast wave propagation.
18
POI...L------l
time ~
Fig. 3 Pressure-time variation of a blast wave of moderate shock strength (adapted from Kinney and Graham [20].
Pm"" .
Pm," ..
/ step profile
positi
blast profile
r I r
Fig. 4 A typical blast wave from a spherical charge, showing secondary shock.
19
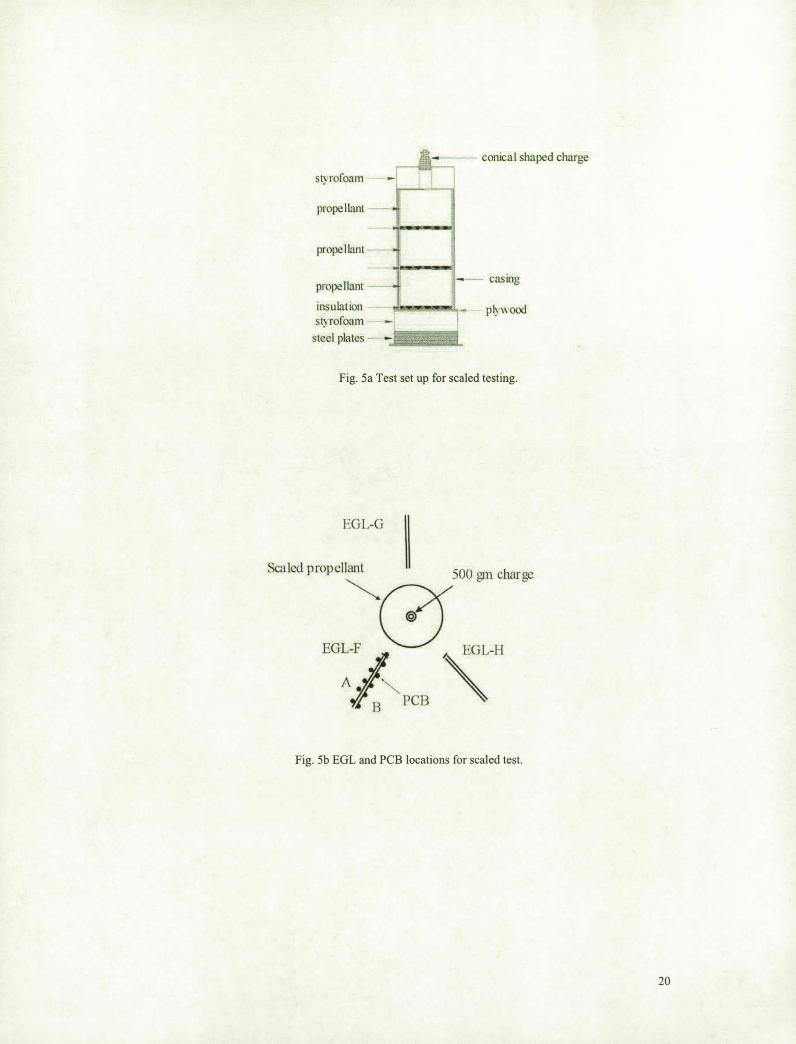
~ ..
styrofoam - - I """'-=---.l
propellant - .
propellant
propellant -
insulation styroroam
steel plate -
conical shaped charge
- - casing
p~'Wood
Fig. Sa Test set up for scaled testing.
EGL-G
Scaled propellant 500 O1}1 charQe ~ 0':>
@
B PCB
Fig. 5b EGL and PCB locations for scaled test.
20
0.25 r ,-
.. peak oycrpressure f'-...; ..
I --::::; P"opella lll Te I EGL-F: SI;lganlioll scm,or (Oal plait' , frOlll)
0.2
--- 0.1 -~oo gm 'h"'"'
c: 0-;:2: --0>
O. l .... ~ CI) OJ .... e-
0.05 p
6
o
-0.05 f
,.... co 0-
~ g in VI
~ 0. .... OJ
6
10 I - 20 Time (l1lsec)
Fig. 6a Overpressure history at the stagnation location for the scaled test.
0.25
0. 15
0. 1
0.05
0
-0.0-I - 20 2-
Time (J11sec)
--- -- ch-37 (21 9 m) --·1 II
-_.- ch-l9 (7 O~ Ill) -- ch-~5 t71J~ tI'}
30
Fig. 6b Overpressure history for the scaled test (contd.) .
30
21
~
'" 0. 1 ~ .
6 C1) '-=oJ !J) !J) 0.01 C1) 6p_r- 1.06 '-e-~ 0
~ 0.001 C1)
0.
0.0001
distance, r (m)
Fig. 6c Peak overpressure scaling for the scaled test data.
22
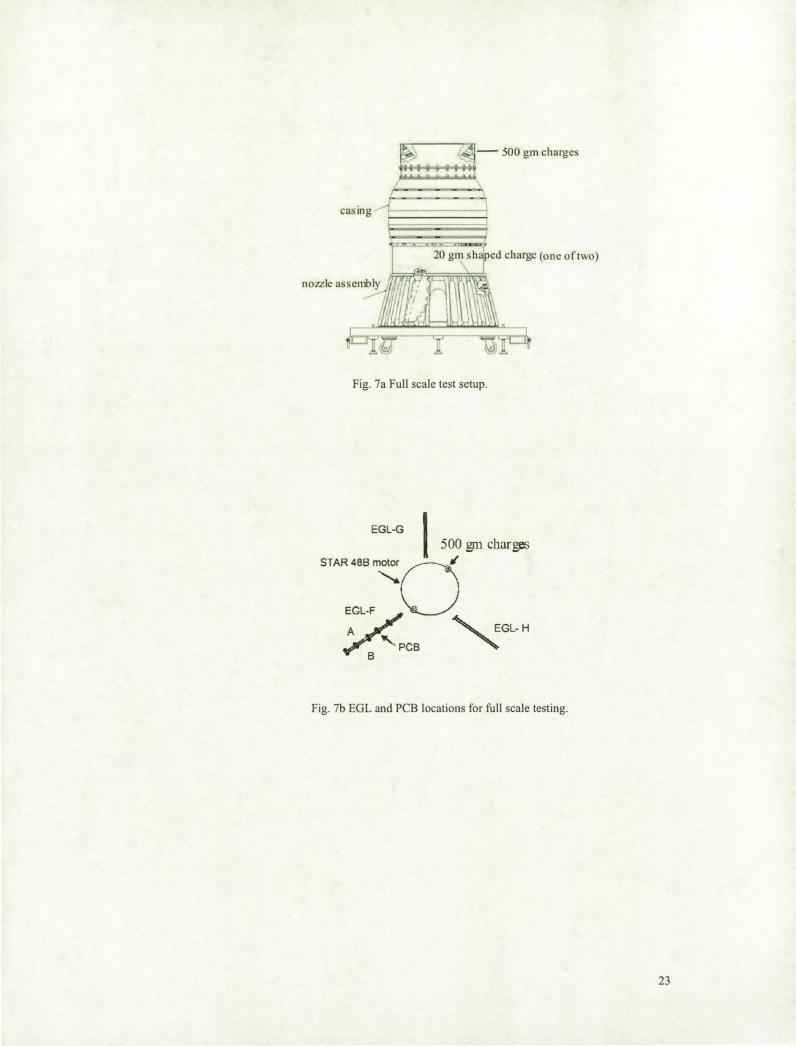
Fig. 7a Full scale test setup.
EGL-G I 500 gIll charges
STAR 488 m,o" :GL-/ '" EGL- H
Z'PC8 "-8
Fig. 7b EGL and PCB locations for full scale testing.
23
0.5 T Full Sc.I .... <'>.
0.4 E .L-F (s.'I:",lIlon)
'2" 1--<11'(,' (U 1,7 1\1 1 \ e:, .2. 0.3 '-" (I) .... ~ '" 0.2 (I) .... e-(I)
6 0.1
0
-0. 1 U 6 7 8 9 JO
Time (msec)
Fig. 8a Overpressure history at the stagnation point for full scale testing.
,..... " 0-
~ ~ Vi til
~ C. "-<>
6
0.5
0.'1
0.3
0.2
0.1
0
-0. 1 L 5 10
Full calc Test I t ~r t . EGL-Sensor: F-A - - ~
15
Time (msec)
--.11.(" (116" 01) - - lh-n 1 ~- 111 )
20 25
Fig. 8b Overpressure history of sensors along F-A for full scale testing.
24
0.5
OA
0.3 ~ ., Q..
~
g 0.1 ;;; ~ e-
0.1 <:.>
6
0
-0.1 5 10 15
Time (msec)
, -- -- oh-52 (59 1111) -- "h~". {"'I ..,,, 01 1
20 25
Fig. 8c Overpressure history of sensors along F-Bfor full scale testing.
O. - --,-
l~ Full Scale Test j
004 >-~ ~ EGL-Sensor: G-A- ~J ' _. --..:-h"""lO(,7m)
0.3 -- ch-.18 (2 I I 111 1 .,
Q.. -- -- oh--O (jO~ Ill) 6 ... - \.h-(1~ (~""In Ill )
2 0.2 ~ ~
~ '" 2 0-
- ~ ~ 0. 1 6 1'1
JII j I
0 ..... ,.,·'\,1' III, 1
-0.1 5 [0 2
Time (msec)
Fig. 8d Overpressure history of sensors along G-A for full scale testing.
25
0.5 - ~ i
OA
e 0.2 :: Vl
~ f 0.1 f-o I
0+_
-0.1 10
T
Full Scale Test EGl- cnsor: H-A
15 Time (msec)
._.- t h-; I 6 01)
20 25
Fig. 8e Overpressure history of sensors along H-A for full scale testing.
200 I ..........
, '. " JI. ..........
180 f'" -- .. ---•
...... 160 co ~ ...J ~ 140
120
100 o 2 I O~ 3 I O~
frequency (Hz)
Fig. 8f Spectral distribution for full scale testing.
26
~ 0. 1 :::l VI VI CI) '-
2-~ o
...:..: I a.'l 0.01 f 0.
~
t O.OOl I
0.1
6.p
Po
10
0. 1 O.Ol
I Full Scale Test :;00 ~m chal'j!cs (2)
I
10
distance, r (m) 100
Fig. 8g Peak overpressure scaling for full scale testing.
-- scale model data -- -- full sca le data
+
1
f
+
Fig. 9 Dimensionless peak overpressure variation.
1000
27
REPORT DOCUMENTATION PAGE Form Approved OMS No. 0704-0188
The public reporting burden for this collection of information is estimated to average 1 hour per response. including the time for reviewing instructions. searching existing data sources. gathering and maintaining the data needed. and completing and reviewing the collection of information. Send comments regarding this burden estimate or any other aspect of this collection of information. including suggestions for reducing this burden. to Department of Defense. Washington Headquarters Services. Directorate for Information Operations and Reports (0704-0188).1215 Jefferson Davis Highway. Suite 1204. Arlington. VA 22202-4302. Respondents should be aware that notwithstanding any other provision of law. no person shall be subject to any penalty for failing to comply with a collection of information if it does not display a currently valid OMS control number. PLEASE DO NOT RETURN YOUR FORM TO THE ABOVE ADDRESS. 1. REPORT DATE (DD-MM-YYYY) 1.2. REPORT TYPE 3. DATES COVERED (From - To)
journal article 4. TITLE AND SUBTITLE Sa. CONTRACT NUMBER
Estimation of Broadband Shock Noise Reduction in Turbulent Jets by Water NAS I 0-03006 Injection
Sb. GRANT NUMBER
Sc. PROGRAM ELEMENT NUMBER
6. AUTHOR(S) Sd. PROJECT NUMBER
Kandula, Max Freeman, Robert J. Se. TASK NUMBER
Sf. WORK UNIT NUMBER
7. PERFORMING ORGANIZATION NAME(S) AND ADDRESS(ES) 8. PERFORMING ORGANIZATION
ASRC Aerospace REPORT NUMBER
ASRC-5211 Kennedy Space Center, FL 32899
9. SPONSORING/MONITORING AGENCY NAME(S) AND ADDRESS(ES) 10. SPONSORING/MONITOR'S ACRONYM(S)
National Aeronautics and Space Administration NASAKSC NE-Ml
Kenndey Space Center, FL 32899 11. SPONSORING/MONITORING REPORT NUMBER
12. DISTRIBUTION/AVAILABILITY STATEMENT
13. SUPPLEMENTARY NOTES
14. ABSTRACT
The scaling and similarity laws concerning the propagation of isolated spherical blast waves are briefly reviewed. Both point source explosions and high pressure gas explosions are considered. Test data on blast overpressure from the interaction and coalescence of spherical blast waves emanating from explosives in the form of shaped charges of different strength placed in the vicinity of a solid propellant stack are presented. These data are discussed with regard to the scaling laws concerning the decay of blast overpressure. The results point out the possibility of detecting souce explosions from far-field pressure mesurements.
1S. SUBJECT TERMS Sphereical blast waves, Blast wave interaction, Measurements on interacting blast waves
16. SECURITY CLASSIFICATION OF: 17. LIMITATION OF 18. NUMBER 19b. NAME OF RESPONSIBLE PERSON ABSTRACT OF Max Kandula a. REPORT b.ABSTRACT c. THIS PAGE PAGES
() fA fA ltk 19b. TELEPHONE NUMBER (Include area code)
27 (321) 867-4456 ~ -Standard Form 298 (Rev. 8 98)
Prescribed by ANSI Std. Z39·18