on the lateral response of piles: numerical analysis against centrifuge ... · on the lateral...
TRANSCRIPT

Paper No. OTLGI
ON THE LATERAL RESPONSE OF PILES: NUMERICAL ANALYSI S AGAINST CENTRIFUGE EXPERIMENTS
Spyros GIANNAKOS 1, Nikos GEROLYMOS 2, George GAZETAS3
ABSTRACT To gain insight into the inelastic behavior of piles, the response of a vertical pile embedded in a dry sand of 75% relative density and subjected to cyclic lateral loading was studied experimentally in centrifuge tests conducted in Laboratoire Central des Ponts et Chaussees. Three types of cyclic loading were applied, two asymmetric and one symmetric with respect to the unloaded pile. The model pile (scale 1/40) was aluminum hollow cylinder of 18 mm external diameter, 3 mm wall thickness, and 365 mm length. The objective of the tests was to investigate the influence of certain nonlinear features of cyclic loading such as strength relaxation and stiffness hardening on pile response. Comparison is given with results from three-dimensional finite element analysis. Keywords: Cyclic loading, lateral response, centrifuge, piles
INTRODUCTION Many researchers have studied the response of piles in lateral loading (Dawson 1980, Poulos 1982, Brown et al 1987, Grashuis et al 1990, Long et al 1994, Lin et al 1999, Zhang et al 2000, Verdure et al 2003, Hutchinson et al 2005, Tuladhar et al 2008, Gerolymos et al 2009, Achmus et al 2009). The main observations on the response of a pile subjected to quasi-static cyclic lateral loading are summarized as follows: • Both deflection and moment increase with increasing number of cycles and cyclic load level. • The ultimate lateral load capacity decreases with increasing number of cycles and cyclic load level • Effects of cyclic degradation are more severe for stiff soils than for soft. • The cyclic behavior of the pile is similar for homogeneous and non-homogeneous soils. • The loading rate has a significant effect on the pile response, with the deflections at a given load decreasing as the loading rate increases. • For the same displacement, the bending moments developed at the piles of a group are greater than those of a single pile and the maximum moments are observed at higher depths. • For cohesionless soils, no gap or a very small gap is observed at the end of the cyclic loading. • One-way cyclic lateral loading induces higher permanent strains and greater cumulative deformations of the piles than the two-way cyclic lateral loading. According to Poulos (1982), there are two phenomena that may contribute to the increased deflection of laterally loaded piles with increasing number of cycles: 1) The phenomenon of structural “shakedown” of the pile-soil system. This phenomenon occurs on every pile embedded in an elastoplastic soil mass when 1 Phd student, Department of Civil Engineering, National Technical University of Athens, Greece e-mail: [email protected] 2 Lecturer, Department of Civil Engineering, National Technical University of Athens, Greece. 3 Professor, Department of Civil Engineering, National Technical University of Athens, Greece.

5th International Conference on Earthquake Geotechnical Engineering January 2011, 10-13
Santiago, Chile
Fontainebleau
Sand
12 m
1.6 m
1 m
0.6 m
20 p
airs
of s
trai
n ga
uges Pile
Disp. Sensor DT2
Calculated dis. DPC
Disp. Sensor DT1
d = 0.72 m
Load
Fontainebleau
Sand
12 m
1.6 m
1 m
0.6 m
20 p
airs
of s
trai
n ga
uges Pile
Disp. Sensor DT2
Calculated dis. DPC
Disp. Sensor DT1
d = 0.72 m
Load G0 : MPa
0
4
8
12
0 40 80 120
G0 : MPa
0
4
8
12
0 40 80 120
Fontainebleau
Sand
12 m
1.6 m
1 m
0.6 m
20 p
airs
of s
trai
n ga
uges Pile
Disp. Sensor DT2
Calculated dis. DPC
Disp. Sensor DT1
d = 0.72 m
Load
Fontainebleau
Sand
12 m
1.6 m
1 m
0.6 m
20 p
airs
of s
trai
n ga
uges Pile
Disp. Sensor DT2
Calculated dis. DPC
Disp. Sensor DT1
d = 0.72 m
Load G0 : MPa
0
4
8
12
0 40 80 120
G0 : MPa
0
4
8
12
0 40 80 120
the accumulated permanent deformations stabilize. Thus, it results in incremental collapse. 2) The phenomenon of cyclic soil degradation which is the decrease in stiffness and strength of the soil due to cyclic loading. In this paper, the results of three centrifuge tests of a single pile subjected on lateral cyclic loading are presented. The results of the experiments are compared with those from a numerical 3-D simulation of the experiments in ABAQUS with the use of a constitutive model that takes into consideration the soil non-linearity. Three performance measure parameters are introduced in order to evaluate the overall response of the model.
CENTRIFUGE LATERAL CYCLIC LOAD PILE EXPERIMENTS Three centrifuge tests on a single pile subjected to cyclic horizontal loading were performed by Rosquoёt et al (2004) at Laboratoire Central des Ponts et Chaussées (LCPC). The centrifuge models were 1/40 in scale and involved pile head loading with three different force time histories. The loading time histories were: i) 12 cycles from 960 kN to 480 kN (test P32) ii) 12 cycles from 960 kN to 0 kN (test P344) iii) 6 cycles from 960 kN to -960 kN (test P330). The experimental set up and the loading time histories (in prototype scale) are portrayed in Figure 1.
Figure 1. (a) Pile configuration and soil properties of the centrifuge tests conducted in LCPC. (b) Load time histories of the three tests (P32, P344 and P330). All dimensions refer to the modeled
prototype The cyclic lateral load tests were conducted on vertical friction pile placed in a sand mass of uniform density. The Fontainebleau sand centrifuge “specimens” were prepared by the air sand-raining process into a rectangular container (80 cm wide by 120 cm long by 36 cm deep), with the use of a special automatic hopper developed at LCPC (Garnier, 2002). The desired density of the dry sand was obtained by varying three parameters: a) the flow of sand (opening of the hopper), b) the automatically maintained drop height, and c) the scanning rate. The unit weight and the relative density of the speciment were
0 5 10 15 20 25 30 35 40-1000
-500
0
500
1000
0 5 10 15 20 25 30 35 40-1000
-500
0
500
1000
0 5 10 15 20 25 30 35 40-1000
-500
0
500
1000
time : s
Loa
d :
kN
P344 test
P32 test
P330 test
960
480
960
960
- 960
0
Loa
d :
kN
Loa
d :
kN
0 5 10 15 20 25 30 35 40-1000
-500
0
500
1000
0 5 10 15 20 25 30 35 40-1000
-500
0
500
1000
0 5 10 15 20 25 30 35 40-1000
-500
0
500
1000
time : s
Loa
d :
kN
P344 test
P32 test
P330 test
960
480
960
960
- 960
0
Loa
d :
kN
Loa
d :
kN

5th International Conference on Earthquake Geotechnical Engineering January 2011, 10-13
Santiago, Chile measured to be γd = 16.5 ± 0.04 kN/m3 and Dr = 86%, respectively. Laboratory results from drained and undrained torsional and direct shear tests on Fontainebleau sand reconstituted specimens indicated mean values of peak and critical-state angles of φp = 41.8ο and φcv = 33ο, respectively. Figure 1a depicts the idealized small strain shear modulus Go used. Evidently, in this dense sand the pile used may be considered as flexible. The model pile at scale 1/40 is a hollow aluminum cylinder of 18 mm external diameter, 3 mm wall thickness, and 365 mm length. The flexural stiffness of the pile is 0.197 kN m2 and the elastic limit stress of the aluminum is 245 MPa. The centrifuge tests were carried out at 40 g. The instrumentation included two displacement sensors, located at the section of the pile above the ground surface, and 20 pairs of strain gauges, positioned along the length of the pile so that the bending moment profile M(z) could be measured during the tests. The resultant earth pressure p = p(z), per unit length along the pile, was obtained by double differentiation of M(z) as established by Matlock and Reese (Reese and Van Impe, 2001). The strain gauges were spaced at 0.6 m in prototype scale starting from the ground level to the pile tip. This single pile was driven into the sand at 1 g before rotating of the centrifuge. In flight, the single pile was subjected quasi-statically to horizontal cyclic loading through a servo-jack connected to the pile with a cable. With such a configuration the pile head is not submitted to any parasitic bending moment. The test results were obtained in the form of horizontal force-displacement time histories at the head of the pile, as well as of bending moment, shear force, and soil reaction along the pile.
3-D beam element
imposed kinematic constraint
node
3-D solid elements
Figure 2. a) Finite element modeling of the centrifuge test configuration b) Pile modeling
FINITE ELEMENT MODELLING The above mentioned centrifuge tests were modeled numerically in 3D using the finite element code ABAQUS. The pile is assumed to be linear elastic while the cyclic soil behavior is described via a nonlinear constitutive law with kinematic hardening law and associated plastic flow rule. Figure 2a depicts the finite element discretization for the centrifuge tests. Approximately 43000 elements were used for each analysis. The soil is modeled with 8-node brick elements while the pile is modeled with 3D beam elements placed at its center and connected with appropriate kinematic restraints with the nodes at the perimeter of the pile in order to model the complete geometry of the pile (Figure 2b). The solid elements

5th International Conference on Earthquake Geotechnical Engineering January 2011, 10-13
Santiago, Chile inside the perimeter of the pile have no stiffness. In this way, each pile section behaves as a rigid disc: rotation is allowed on the condition that the disc remains always perpendicular to the beam axis, but stretching cannot occur.
CONSTITUTIVE SOIL MODEL Soil behavior is modeled through a constitutive model with nonlinear kinematic hardening and associated plastic flow rule. The evolution law of the model consists of two components: a nonlinear kinematic hardening component, which describes the translation of the yield surface in the stress space (defined through the back-stress α), and an isotropic hardening component, which defines the size of the yield surface σ0 at zero plastic deformation. The kinematic hardening component is defined as an additive combination of a purely kinematic term (linear Ziegler hardening law) and a relaxation term (the recall term), which introduces the nonlinearity. The model incorporates two hardening parameters C and γ that define the maximum transition of the yield surface, and the rate of transition, respectively. A user subroutine is imported in ABAQUS, which correlates the Young’s Modulus of the sand with the principal stresses and the Lode angle at every step of the loading. The sand behavior is defined for triaxial extension and triaxial compression conditions and linear interpolation is performed for the intermediate states. For this reason a parameter k was introduced for Lode angle that takes values from 0 to 1, where 0 is for triaxial extension conditions and 1 for triaxial compression conditions. Before the loading of the pile begins the triaxial compression conditions are given to the soil. The constitutive model used in the simulation is matched with the Coulomb criterion on the principal stresses plane for every apex of the hexagon with the smooth envelope that is shown in Figure 3. The distribution of Young’s Modulus varies parabolically with depth according to:
0 100
m
vC E E = =
σ (1)
where E0 is the reference Young’s Modulus, σv the vertical stress and m a parameter that defines the distribution of E with depth. The hardening parameter γ, which is a function of the internal friction angle, was calibrated to correspond to a critical-state friction angle φcv = 33ο.
σ’1
σ’3σ’2
σ’1
σ’3σ’2
Figure 3. Shape of yield criterion of the proposed constitutive model
5th International Conference on Earthquake Geotechnical Engineering January 2011, 10-13
Santiago, Chile
0
200
400
600
800
1000
1200
0 0.05 0.1 0.15 0.2
Displacement (m)
Fo
rce
at P
ile H
ead
(kN
)
Experiment Abaqus
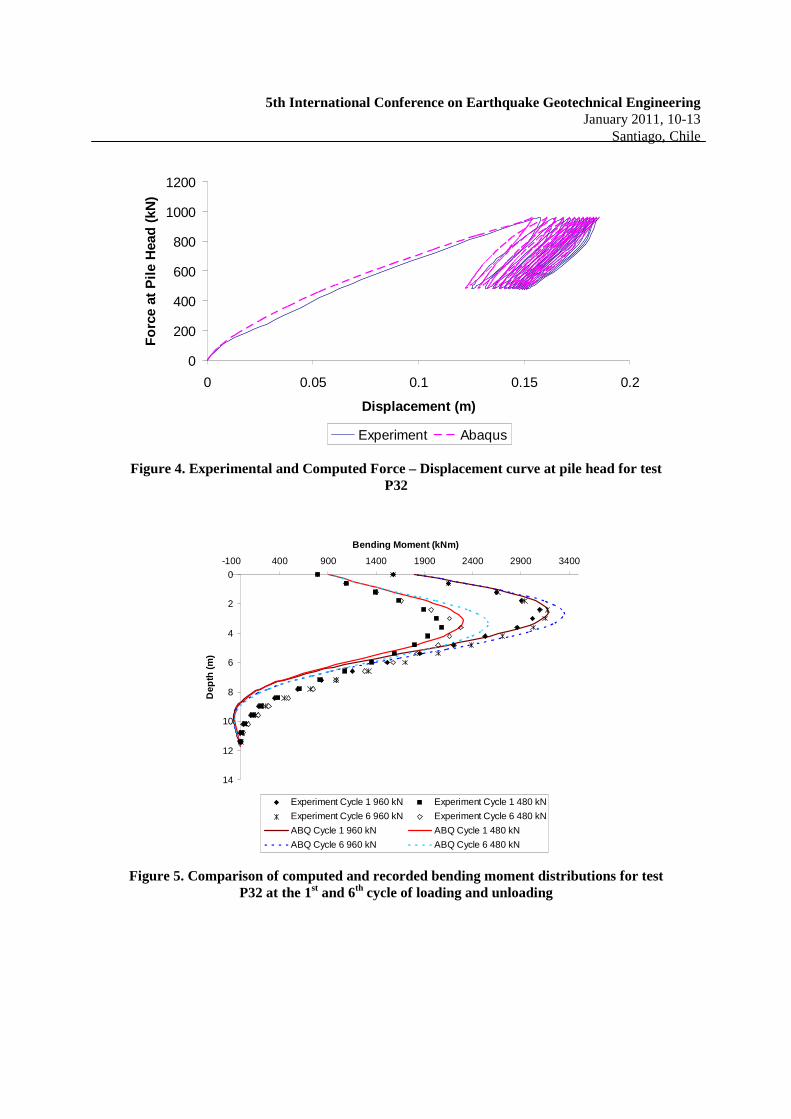
Figure 4. Experimental and Computed Force – Displacement curve at pile head for test P32
0
2
4
6
8
10
12
14
-100 400 900 1400 1900 2400 2900 3400
Bending Moment (kNm)
Dep
th (m
)
Experiment Cycle 1 960 kN Experiment Cycle 1 480 kN
Experiment Cycle 6 960 kN Experiment Cycle 6 480 kN
ABQ Cycle 1 960 kN ABQ Cycle 1 480 kN
ABQ Cycle 6 960 kN ABQ Cycle 6 480 kN
Figure 5. Comparison of computed and recorded bending moment distributions for test P32 at the 1st and 6th cycle of loading and unloading

5th International Conference on Earthquake Geotechnical Engineering January 2011, 10-13
Santiago, Chile
NUMERICAL ANALYSIS: RESULTS AND CONCLUSIONS Calibration with test P32 The model is calibrated against the one-way cyclic loading test with maximum horizontal force 960 kN and minimum horizontal force 480 kN (test P32). With appropriate calibration of the constitutive model parameters E0, m and γ, the curves predicted with the model described above are fitted to the recorded “force – displacement” curve at the head of the pile from the strain gauges (Figure 4). In one way cyclic loading, the pile displacement increases as the number of cycles increases. It can be observed from the shape of the force-displacement loops that even though interface nonlinearities between the soil and the pile have not been taken into consideration, the model is capable of predicting the plastic shakedown response of the pile. This plastic shakedown response is the resultant of the following two mechanisms: (a) Soil densification due to cyclic loading, and (b) “System densification” due to the gradual extension of the mobilizing soil mass, which resists the pile movement, to greater depths with each loading cycle. Only the second mechanism is captured by the proposed model. Bending moment, shear force and soil reaction profiles were compared, but due to lack of space, only the results for the bending moments are presented herein. In Figure 5 bending moment profiles at the first and sixth cycle of loading are compared. In general, the agreement between the measured and the computed curves is quite satisfactory. The model predicts well the shape of the moment distribution as well as the increase of the bending moments with the increase of the number of cycles both for loading and unloading of the pile. The model is also capable of simulating the depth of the maximum bending moment both for loading and unloading conditions as well as the shift of the maximum bending moment at a higher depth as the number of cycles increases in one way loading.
-200
0
200
400
600
800
1000
1200
0 0.05 0.1 0.15 0.2
Displacement (m)
Fo
rce
at P
ile H
ead
(kN
)
Experiment Abaqus
Figure 6. Experimental and Computed Force – Displacement curve at pile head for test P344

5th International Conference on Earthquake Geotechnical Engineering January 2011, 10-13
Santiago, Chile
0
2
4
6
8
10
12
14
-100 400 900 1400 1900 2400 2900 3400
Bending Moment (kNm)
Dep
th (m
)
Experiment Cycle 1 960 kN Experiment Cycle 1 0 kN
Experiment Cycle 6 960 kN Experiment Cycle 6 0 kN
ABQ Cycle 1 960 kN ABQ Cycle 1 0 kN
ABQ Cycle 6 960 kN ABQ Cycle 6 0 kN
Figure 7. Comparison of computed and recorded bending moment distributions for test P344 at the 1st and 6th cycle of loading and unloading
Comparison with one-way cyclic test P344 and two-way cyclic test P330 The calibrated model from test P32 is utilized to predict the results of the one-way cyclic loading test P344 and two-way cyclic loading test P330. Test P344 is an one-way cyclic loading test with maximum horizontal force 960 kN and minimum horizontal force 0 kN. The computed force-displacement curve at the pile head is compared to the experimental data in Figure 6 for the 12 cycles of loading. Bending moment profiles of the experiment and the simulation are compared in Figure 7. Even for this asymmetric cyclic loading condition, the agreement between the measured and the computed distribution curves is quite satisfactory for the bending moment. Finally, Figure 8 shows contours of the active and the passive stress state of the sand around the pile in terms of the state parameter k. Results are presented for the 1st and 12th cycle of loading. The red color stands for k = 1 (triaxial compression state, passive state), black for k = 0 (triaxial extension state, active state), while green sets the boundaries for the active or the passive zone k = 0.5. In Figure 8b must be observed that even though there is no lateral force acting on the pile (unloading phase), the pile has not returned at its initial position because of the resistance of the soil that has already moved with the pile during the cyclic loading phase and now has taken the part of the initial position of the pile. Test P330 is a complete cyclic loading test with maximum horizontal force 960 kN and minimum horizontal force -960 kN. The computed force-displacement curve at the pile head is compared to the experimental data in Figure 9 for the 6 cycles of loading. It is observed that the pile displacement at reversal decreases with decreasing rate (as the number of loading cycles increases by contrast to the previous experiments). This hardening effect is attributed to the extensive soil plastification that takes places around the pile, which leads to an increase of the soil pressure on the pile. In addition, Figure 10 depicts bending moment profiles at the first and sixth cycle of loading.

5th International Conference on Earthquake Geotechnical Engineering January 2011, 10-13
Santiago, Chile
a)
b)
c)
k = 0.0 k = 0.1 k = 0.3 k = 0.5 k = 0.7 k = 0.8 k = 1.0k = 0.0 k = 0.1 k = 0.3 k = 0.5 k = 0.7 k = 0.8 k = 1.0 Figure 8. Parameter k during at a) 1st cycle at 960 kN, b) 12th cycle at 480 kN, c) 12th cycle at 960 kN (Deformation Scale Factor = 5)

5th International Conference on Earthquake Geotechnical Engineering January 2011, 10-13
Santiago, Chile
-1500
-1000
-500
0
500
1000
1500
-0.2 -0.15 -0.1 -0.05 0 0.05 0.1 0.15 0.2
Displacement (m)
Fo
rce
at P
ile H
ead
(kN
)
Experiment Abaqus
Figure 9. Experimental and Computed Force – Displacement curve at pile head for test P330
0
2
4
6
8
10
12
14
-3500 -2500 -1500 -500 500 1500 2500 3500
Bending Moment (kNm)
Dep
th (m
)
Experiment Cycle 1 960 kN Experiment Cycle 1 -960 kN
Experiment Cycle 6 960 kN Experiment Cycle 6 -960 kN
ABQ Cycle 1 960 kN ABQ Cycle 1 -960 kN
ABQ Cycle 6 960 kN ABQ Cycle 6 -960 kN
Figure 10. Comparison of computed and recorded bending moment distributions for test P330 at the 1st and 6th cycle of loading and unloading
5th International Conference on Earthquake Geotechnical Engineering January 2011, 10-13
Santiago, Chile
a)
P344
0
5000
10000
15000
20000
25000
0 2 4 6 8 10 12
n Cycles
k tan
gen
t (kN
/m)
Experiment ABQ
b)
P344
8000
9000
10000
11000
12000
13000
0 2 4 6 8 10 12
n Cycles
k sec
ant
(kN
/m)
Experiment ABQ
c)
P344
0
0,2
0,4
0,6
0,8
1
0 2 4 6 8 10 12
n Cycles
∆u
/∆u
init
ial
Experiment ABQ
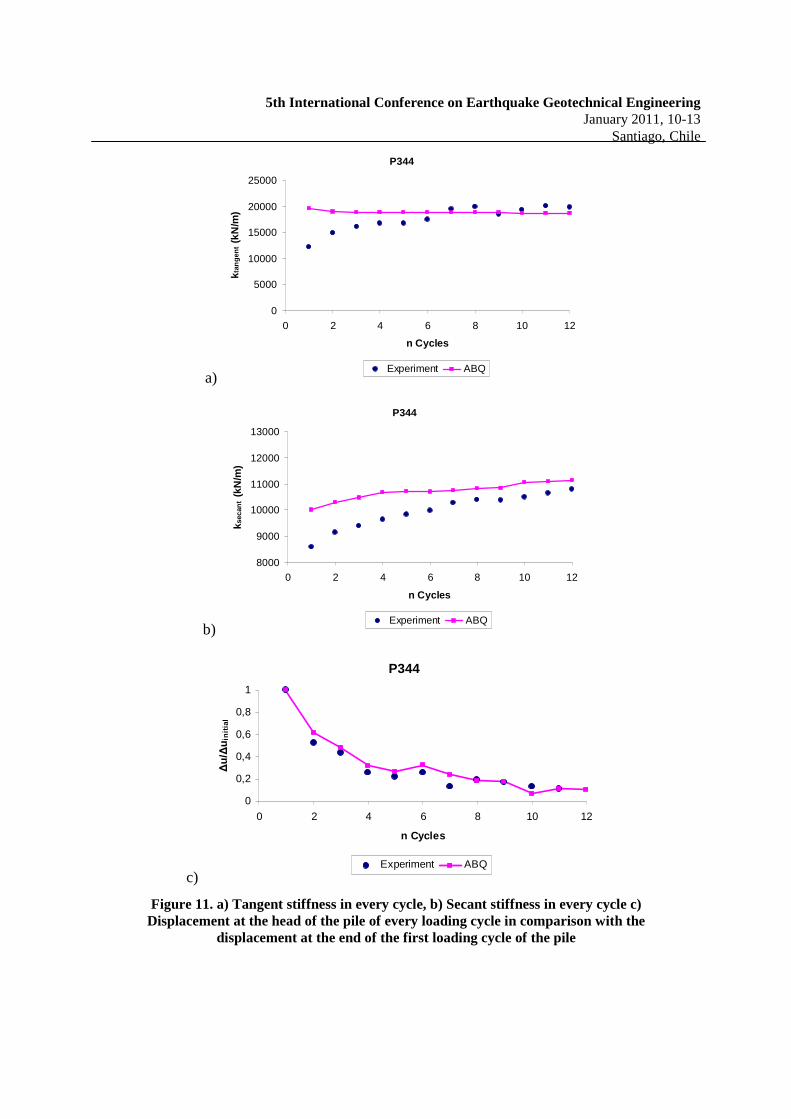
Figure 11. a) Tangent stiffness in every cycle, b) Secant stiffness in every cycle c) Displacement at the head of the pile of every loading cycle in comparison with the
displacement at the end of the first loading cycle of the pile
5th International Conference on Earthquake Geotechnical Engineering January 2011, 10-13
Santiago, Chile Three performance measure parameters where introduced to evaluate the overall response of the pile-soil system. Due to lack of space, only results for the asymmetric one-way cyclic loading test (P344) are presented herein. Figure 11a depicts the tangent stiffness at each unloading-reloading reversal point. It is interested to observe that the computed tangent stiffness remains constant, unaffected by cyclic loading, while the measured tangent stiffness increases. This increase in the measured tangent stiffness is attributed to soil (material) densification during cyclic loading, an effect that is not simulated by the utilized soil constitutive model. Figure 11b presents the secant stiffness between two sequential reversal points. It is worthy of note that both the computed and the measured secant stiffnesses increase with the number of cycles. Given that the system densification is reproduced numerically, the difference between measured and computed response is only attributed to soil densification. Figure 11c presents the pile head displacement at the reversal points normalized with the pivot displacement at virgin loading. The pile displacement at pivot points increases with a decreasing rate and the pile finally reaches a zero-plastic strain rate equilibrium. It is observed that the computed versus measured response is in well agreement, implying that the mechanism of “system densification” dominates upon soil densification.
AKNOWLEDGEMENTS This work forms part of the EU research project “DARE” (“Soil-Foundation-Structure Systems Beyond Conventional Seismic Failure Thresholds : Application to New or Existing Structures and Monuments”), which is funded through the 7th Framework Programme “Ideas”, Support for Frontier Research — Advanced Grant, under contract number ERC-2008-AdG 228254-DARE.
REFERENCES Achmus M., Kuo Y., Abdel-Rahman K., 2009, “Behavior of monopile foundations under cyclic lateral
load”, Computers and Geotechnics, 36, pp 725-735 Brown D.A, Reese L.C., O’Neill M.W., 1987, “Cyclic Lateral Loading of a large-scale pile group”,
Journal of Geotechnical Engineering, 113(11), pp 1326-1343 Chen W.F., Mizuno E., 1990, Nonlinear Analysis in Soil Mechanics: Theory and Implementation,
Elsevier, New York Dawson T.H., 1980, “Simplified analysis of offshore piles under cyclic lateral loads”, Ocean
Engineering, Vol 7., pp 553-562 Garnier J., 2002, “Properties of soil samples used in centrifuge models”, Invited Keynote Lecture,
International Conference on Physical Modelling in Geotechnics – ICPMG ‘02, R. Phillips et al. (Eds), published by A.A. Balkema, Rotterdam, 1, pp 5-19.
Gerolymos N., Escoffier S., Gazetas G., Garnier J., 2009, “Numerical Modeling of centrifuge cyclic lateral pile load experiments”, Earthquake Engineering and Engineering Vibration, 8, pp 61-76
Grashuls A.J., Dieterman H.A., Zorn N.F., 1990, “Calculation of Cyclic Response of Laterally Loaded Piles”, Computers and Geotechnics, 10, pp 287-305
Hardin B.O., 1978, “Nature of stress-strain behavior for soils”, Proceedings of the Specialty Conference on Earthquake Engineering and Soil Dynamics, ASCE, 1: 3-90

5th International Conference on Earthquake Geotechnical Engineering January 2011, 10-13
Santiago, Chile Hutchinson T.C., Chai Y.H., Boulanger R.W., 2005, “Simulation of full-scale cyclic lateral load tests on
piles”, Journal of Geotechnical and Geoenvironmental Engineering, Vol. 131, No. 9, pp 1172-1175 Lin S., Liao J., 1999, “Permanent strains of piles in sand due to cyclic lateral loads”, Journal of
Geotechnical and Geoenvironmental Engineering, Vol. 125, No 9., pp 798-802 Long J.H., Vanneste G., 1994, “Effects of cyclic lateral loads on piles in sand”, Journal of Geotechnical
Engineering, 120(1), pp 33-42 Poulos H.G., 1982, “Single pile response to cyclic lateral load”, Journal of Geotechnical and
Geoenvironmental Engineering, Vol 108, pp 355-375 Reese L.C., Van Impe W.F., 2001, Single Piles and Pile Groups under Lateral Loading, A.A.Balkema.
Rotterdam Rosquoët F., Garnier J., Thorel L., Canepa Y., 2004, “Horizontal cyclic loading of piles installed in sand :
Study of the pile head displacement and maximum bending moment”, Proceedings of the International Conference on Cyclic Behaviour of Soils and Liquefaction Phenomena, Bochum, T. Triantafyllidis (Ed.), Taylor & Francis, pp 363-368.
Tuladhar R., Maki T., Mutsuyoshi H., 2008, “Cyclic behavior of laterally loaded concrete piles embedded into cohesive soil”, Earthquake Engineering and Structural Dynamics, 37, pp 43-59
Verdure L., Garnier J., Levacher D., 2003, “Lateral cyclic loading of single piles in sand”, International Journal of Physical Modelling in Geotechnics, 3, pp17-28
Zhang F., Kimura M., Nakai T., Hoshikawa T., 2000, “Mechanical behavior of pile foundations subjected to cyclic lateral loading up to the ultimate state”, Soils and Foundations, Vol 40., No 5., pp 1-17