on the modelling of the phases in o-u-zr bo sundman mse, kth, sweden christine gueneau, delphine...
TRANSCRIPT

On the modelling of the phases in O-U-Zr
Bo SundmanMSE, KTH, Sweden
Christine Gueneau, Delphine Labroche,CEA, Saclay, France
Christian Chatillon, Mehdi Baichi,LTPCM, Grenoble, France

Thermodynamic Modelling
• Thermodynamics provide relations between many different materials properties like amount of phases and their compositions, heat of transformation, partial pressures etc.
• Experimental thermodynamics has proved its value for materials research for more than 100 years.
• Modern multicomponent materials would require very extensive experimental work in order to establish the relevant data for phase equilibria and thermodynamic properties.
• Modelling is the only possible technique to reduce experimental work and to increase the value of each new experiment by allowing accurate extrapolation.
• Thermodynamics provide the most important information for a phase transformation: the final equilibrium state

Hierarchically Structured Materials Design SystemHierarchy of computational design
models and experimental tools
SAM KGB()
Developed by Northwestern Univ, 1997
Thermo-Calc/DICTRA
SAMNS, XRDAPFIM, AEM, H
LM, TEMJIC, i
LM, TEMMQD, DSC
FLAPWDVM
TC/DICTRAABAQUS/EFG
ABAQUS/SPOTC, V
TC/MARTCASIS
QuantumDesign
NanoDesign
Micromech.Design
Transform.Design

All kinds of modelling and simulations depend heavily on the availability of cheap and fast computing power. A lot has happend since this picture from 1970 …
The CALPHAD technique uses thermodynamic models based on
• experimental information on phase diagrams (solubilties, invariant temperatures etc) and
• experimental data on thermochemistry (enthalpies, chemical potentials etc) and
• theoretical calculations like ab inito and• empirical rules using• physically realistic models with adjustable parameters
describing the Gibbs energy of each phase in the system.

Calculated binary and ternary phase diagram
for the systemAl-Cu-Mg-Zn
Using the CALPHAD technique thermodynamic assessments of more than 1000 binary, ternary and higher order systems have been made. This work can only be successful by joint international collaboration and requires international agreement of a number of important critical quantities:
• the thermodynamic model to use for the different phases, and
• the properties of elements in different metastable states (lattice stabilities), for example the properties of Zr in an FCC crystal lattice

With 30 years experience developing CALPHAD databases it has been clearly shown that with good models it is possible to calculate accurately the stable state of alloys with 8-12 components using carefully made assessments of the most important binary and ternary subsystems.

It is interesting to compare CALPHAD to a similar technique developed by materials physicists in close connection to ab initio calculation of materials properties. In these techniques very complex thermodynamic models are used to calculate the equilibrium of a system, for example Cluster Variation Method (CVM) or Monte Carlo (MC). The main differences with CALPHAD are:
• Systems calculated separately using CVM/MC techniques cannot be combined and extrapolated to higher order systems.
• In most cases the CVM/MC calculations use only ab inito data and the calculated results are far away from experimental data.

• One important feature with the ab initio calculations is that they can determine properties of a phase that is not stable, i.e. when it is not possible to measure its properties. But whenever possible calculations should be checked by experiments.
• The quantities from ab initio calculations can be combined with experimental data in a CALPHAD assessment to give an accurate and reliable thermodynamic description, rather than just compared with experiments as with usual CVM or MC calculations.

In CALPHAD the Gibbs energy for each phase is modelled separately and rather simple models are used
The gas phase is normally assumed to be an ideal mixing of the gas species i with constituent fraction yi:Gm = i yi
oGi + RT i yi ln( yi )
The liquid phase can be modelled in many different ways depending on the type of components. For metallic liquids one usually has a substitutional regular solution model with the mole fractions xi:Gm = i xi
oGi + RT i xi ln( xi ) + EGm

The excess Gibbs energy, EGm, takes interaction between the different constituents into account. A simple series in fraction is used:EGm = i j>i n xi xj (xi – xj)n Lijn + ternary…
More complicated models including associates, ions, quasichemical configurational entropy etc are used to describe molten salts, oxides and other liquids with a strong tendency for short range order.
An important feature is that different models should be compatible, for example it should be allowed in the model for a liquid that it gradually changes from metallic to ionic with temperature or composition.

The ionic liquid model has been developed to handle both metallic and ionic liquids. The Gibbs energy expression is
Gm = ij yi yjoGij + Q yVa i yi
oGi + Q k ykoGk +
RT(Pi yiln(yi) + Q(j yjln(yj)+yValn(yVa)+k ykln(yk))) +
EGm
Where i denotes cations like Fe+2, U+4 etc, j denotes anions like O-2, Cl-1 and k denotes constituents that are neutral in the liquid like C. The factors P and Q depend on composition to ensure that the liquid is always electrically neutral.
This model has successfully been applied to liquid in systems like Fe-Ca-Si-O as well as the U-O.

Solid phases are usually crystalline and the crystal structure must be taken into account in the modelling. This can be done using the sublattice model. This can handle interstitials like carbon in steels, oxides like spinels and defects in intermetallic phases like Laves, , L12 etc with 2 to 8 sublattices. The Gibbs energy for a two-sublattice phase can be written:
Gm=i j y’i y”j oGm + RT s as i y(s)i ln( y(s)
i) + EGm
where y’i and y”j are the site fractions on the two sublattices and as the number of sites on sublattice s. oGij is the Gibbs energy of formation of the compound ”ij” and EGm the excess Gibbs energy.

Sublattice model for UO2
(0)4OV
(+4)4VV
(+3)3VV
(+6)6VV
(+2)6OV
(-1)3OV
(-3)3OO
(-2)4OO
(+2)4VO
(0)6OO
(+4)6VO
(+1)3VO
(U+3,U+4,U+6)1(O-2,VA)2(O-2,VA)1
(3,4,6)1(O,V)2(O,V)1
=

Binary U-O
0
500
1000
1500
2000
2500
3000
3500
4000
4500
TE
MP
ER
AT
UR
E_K
EL
VIN
0 0.1 0.2 0.3 0.4 0.5 0.6 0.7 0.8 0.9 1.0
MOLE_FRACTION O
THERMO-CALC (2004.09.03:11.51) : DATABASE:USER
P=100000, N=1;
2004-09-03 11:51:37.40 output by user bosse from SNORKEN
The calculated U-O system using the ionic liquid model and a complex defect model for the UO2 phase.There is a wide miscibility gap in the liquid phase.
gasliquid

U-O with experiments
1200
1400
1600
1800
2000
2200
2400
2600
2800
3000
3200
TE
MP
ER
AT
UR
E_K
EL
VIN
0 0.1 0.2 0.3 0.4 0.5 0.6 0.7 0.8 0.9 1.0
MOLE_FRACTION O
THERMO-CALC (2004.09.03:12.13) : DATABASE:USER
P=100000, N=1;
MARTIN (1965) GARG (1980)
EDWARDS (1966)
GUINET (1966)
ACKERMANN (1969) BANNISTER (1967)
BATES (1966)
FRYXELL (1968)
LATTA (1970)
PATTORET (1969)
GUENEAU (1998)
2004-09-03 12:13:56.48 output by user bosse from SNORKEN
The same calculated diagram compared with experimental data
2 liquids
liquid + UO2
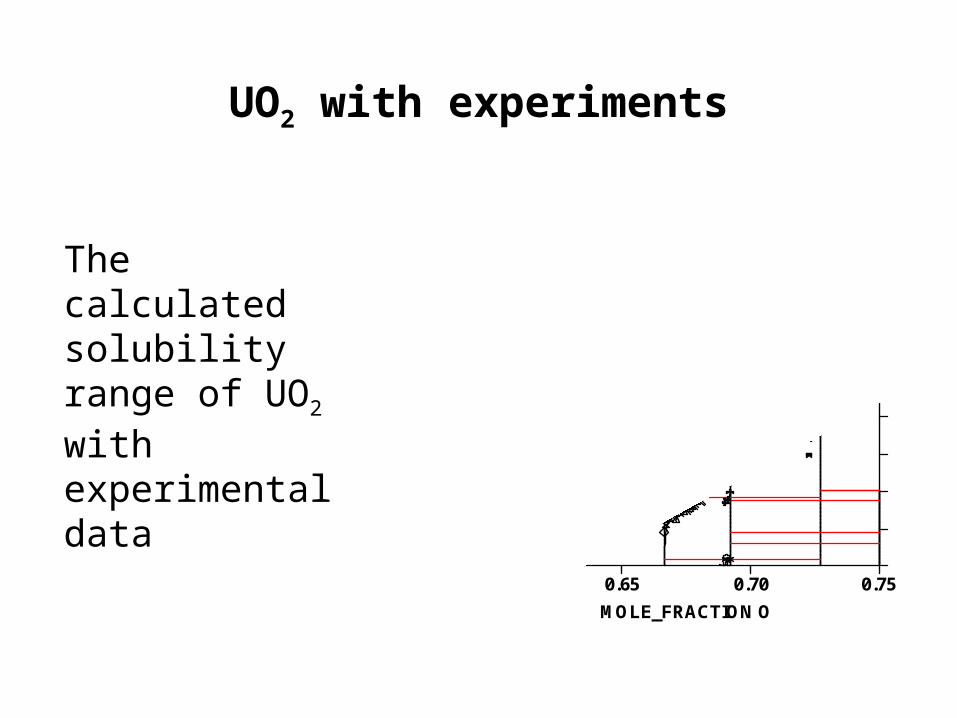
UO2 with experiments
300
600
900
1200
1500
1800
2100
2400
2700
3000
3300
TE
MP
ER
AT
UR
E_K
EL
VIN
0.60 0.65 0.70 0.75
MOLE_FRACTION O
THERMO-CALC (2004.09.03:12.15) : DATABASE:USER
P=100000, N=1;
MARTIN (1965) GARG (1980)
EDWARDS (1966)
GUINET (1966) ACKERMANN (1969) BANNISTER (1967)
BATES (1966)
FRYXELL (1968)
LATTA (1970)
PATTORET (1969)
GUENEAU (1998)
KOTLAR (1967)
HAGEMARK (1966)
KOTLAR (1968)
PERRON (1968)
BLACKBURN (1958)
ROBERTS (1961)
GERDANIAN (1981)
KIUKKOLA (1962)
MARKIN (1962)
SAITO (1974)
MARCHIDAN (1970.72.73.74.75)
GRONVOLD (1955)
SCHANER (1960)
ARONSON (1961)
ANTHONY (1962)
ROBERTS (1961)
BLACKBURN (1958)
PICARD (1981)
ACKERMAN (1973)
VAN LIERDE (1970)
NAITO (1973)
INABA (1973)
SCHANER (1960)
2004-09-03 12:15:36.99 output by user bosse from SNORKEN
The calculated solubility range of UO2 with experimental data

Enthalpy in UO2
0
10
20
30
40
50
60
70
80
90
100
En
thal
py
J/m
ol
0 500 1000 1500 2000 2500 3000 3500
T
THERMO-CALC (2004.09.03:12.23) : DATABASE:USER
P=100000, N(O)=2, N(U)=1;
2004-09-03 12:23:52.84 output by user bosse from SNORKEN
Calculated and experimental values of the heat content of UO2. This is calculatated from the same model as the phase diagram.
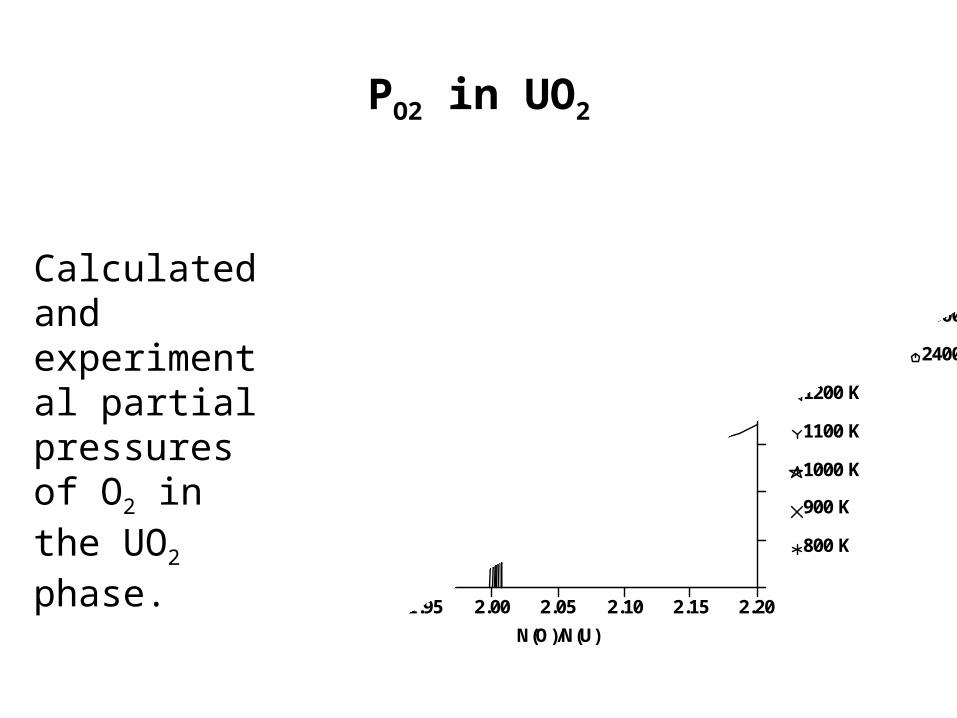
PO2 in UO2
10-20
10-18
10-16
10-14
10-12
10-10
10-8
10-6
10-4
Par
tial
pre
ssu
e O
2
1.90 1.95 2.00 2.05 2.10 2.15 2.20
N(O)/N(U)
THERMO-CALC (2004.09.03:12.32) : DATABASE:USER
T=2400, P=100000, N=1.;
800 K
900 K
1000 K
1100 K
1200 K
1300 K
1400 K
1500 K
1600 K
1700 K 2000
2100
2250
2300
2400
2004-09-03 12:32:12.54 output by user bosse from SNORKEN
Calculated and experimental partial pressures of O2 in the UO2 phase.

Metstable extrapolations
The CALPHAD models provide values of the Gibbs energy at temperatues and compositions outside the stable range of the phase and this is one of the key features of CALPHAD.In the 1980-ies there were fierce discussions between Calphadists and chemists if the Gibbs energy function outside the stable range of the phase was meaningful but eventually it was accepted.Still today it seems that some chemists and physicists doubt that the Gibbs energies calculated from a models for a phase are meaningful outside the stable range of the phase.

Congruent melting for UO2
.01
.1
1
10
P (
MP
a)
2.0 2.1 2.2 2.3 2.4 2.5 2.6 2.7 2.8 2.9 3.0
10000/T
THERMO-CALC (2004.09.03:12.47) : DATABASE:USER
N(O)=2, N(U)=1,FIXED PHASES: GAS=0;
87Bob
2004-09-03 12:47:51.59 output by user bosse from SNORKEN
A more unusual kind of experimental data, the total pressure at the congruent boiling temperature at various tempertures. The calculated line fits the experimetal data well.

Binary Zr-O
300
600
900
1200
1500
1800
2100
2400
2700
3000
3300
TE
MP
ER
AT
UR
E_K
EL
VIN
0 0.1 0.2 0.3 0.4 0.5 0.6 0.7 0.8 0.9 1.0
MOLE_FRACTION O
THERMO-CALC (2004.09.03:12.35) : DATABASE:USER
P=100000, N=1;
A1 2552.00
AG 2401.00 AG 2393.00 AG 2243.00 AG 2381.00 AG 2229.00 AM 2318.00 AG 1805.00 AG 2243.00 A2 2145.00 HD 673.00 RG 2170.00 GS 1580.00 AK 2243.00 GS 1530.00 DM 1171.15 CK 1478.00
2004-09-03 12:35:53.76 output by user bosse from SNORKENThe assessed phase
diagram for the Zr-O system. The high temperature ZrO2
phase is the same structure type, C1, as the UO2 phase.There is no miscibility gap in the liquid phase.
liquid
HCP

Binary U-Zr
200
400
600
800
1000
1200
1400
1600
1800
2000
2200
TE
MP
ER
AT
UR
E_K
EL
VIN
0 0.1 0.2 0.3 0.4 0.5 0.6 0.7 0.8 0.9 1.0
MOLE_FRACTION ZR
THERMO-CALC (2004.09.03:12.37) : DATABASE:USER
P=100000, N=1;
2004-09-03 12:37:06.82 output by user bosse from SNORKEN
In the metallic U-Zr system there is complete solubility in the liquid and the BCC phases.
liquid
BCC
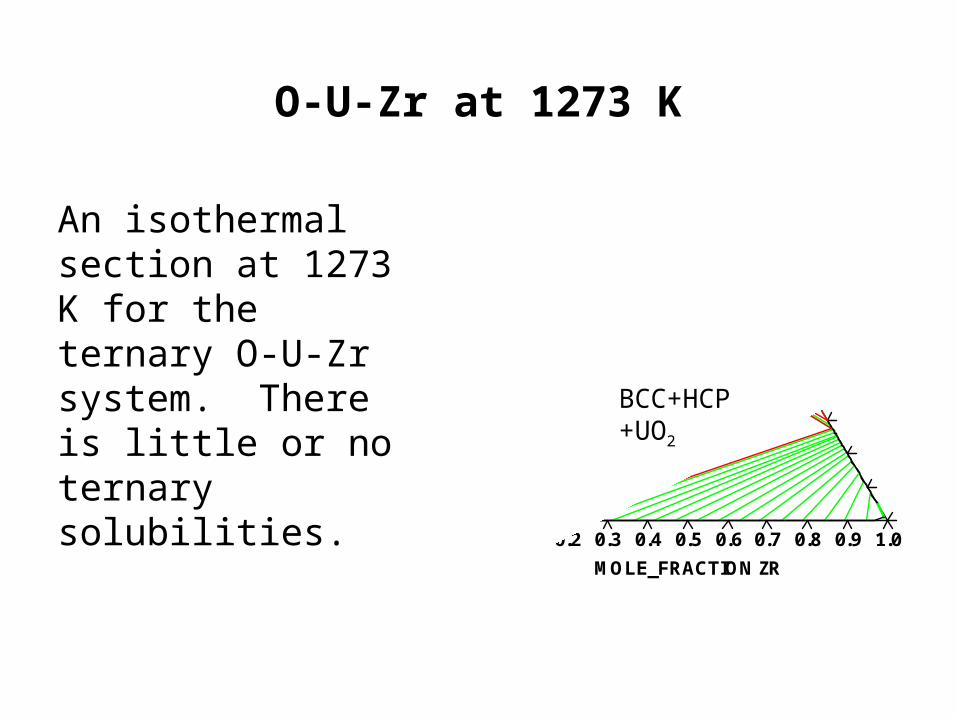
O-U-Zr at 1273 K
0
0.1
0.2
0.3
0.4
0.5
0.6
0.7
0.8
0.9
1.0
0 0.1 0.2 0.3 0.4 0.5 0.6 0.7 0.8 0.9 1.0
MOLE_FRACTION ZR
THERMO-CALC (2004.09.03:16.06) : DATABASE:USER
T=1273, P=100000, N=1.;
2004-09-03 16:06:05.07 output by user bosse from SNORKEN
An isothermal section at 1273 K for the ternary O-U-Zr system. There is little or no ternary solubilities.
BCC+HCP+UO2

O-U-Zr at 2273 K
0
0.1
0.2
0.3
0.4
0.5
0.6
0.7
0.8
0.9
1.0
0 0.1 0.2 0.3 0.4 0.5 0.6 0.7 0.8 0.9 1.0
MOLE_FRACTION ZR
THERMO-CALC (2004.09.03:14.16) : DATABASE:USER
T=2273, P=100000, N=1;
2004-09-03 14:16:22.37 output by user bosse from SNORKEN
liquid
At 2273 K the liquid phase extends far into the system on the Zr-O side. The C1 phase extends across the system but ZrO2_tetr is still stable. There is a miscibility gap in the C1 phase close to UO2

O-U-Zr at 2773 K
At 2773 K the liquid phase forms a closed miscibilty gap inside the ternary.

Top part of O-U-Zr at 2773 K
0.60
0.65
0.70
0.75
0.80
0.85
0.90
0.95
1.00
MO
LE_F
RA
CTI
ON
O0 0.05 0.10 0.15 0.20 0.25 0.30 0.35 0.40
MOLE_FRACTION ZR
THERMO-CALC (2004.09.03:20.56) : DATABASE:USER
T=2773, P=100000, N=1;
2004-09-03 20:56:02.29 output by user bosse from PLUTO
This is the high oxygen part of the same isothermal section. There is a liquid phase on both sides of the C1 phase and still a miscibility gap in the C1 phase for small Zr additions.
gas+liquid
liquid+C1

O-U-Zr at 2973 K
0
0.1
0.2
0.3
0.4
0.5
0.6
0.7
0.8
0.9
1.0
0 0.1 0.2 0.3 0.4 0.5 0.6 0.7 0.8 0.9 1.0
MOLE_FRACTION ZR
THERMO-CALC (2004.09.03:16.08) : DATABASE:USER
T=2973, P=100000, N=1;
2004-09-03 16:08:40.82 output by user bosse from SNORKEN
At 2973 K the C1 phase is no longer stable on the Zr-O side.

Section UO2-ZrO2
500
1000
1500
2000
2500
3000
3500
TE
MP
ER
AT
UR
E_K
EL
VIN
0 0.05 0.10 0.15 0.20 0.25 0.30
X(*,ZR)
THERMO-CALC (2004.09.03:13.36) : DATABASE:USER
N=1, P=100000,X(U)+X(ZR)=3.33333333E-1;
Baichi 2000 Paschoal 1987 Une 1983 Smith 1981 Romberger 1967 Baes 1963 Cohen 1963 Voronov 1958 Lambertson 1953b
2004-09-03 13:36:44.81 output by user bosse from SNORKEN
A calculated section from UO2 to ZrO2 together with experimental data showing the liquid, the C1 phase and the low temperature ZrO2
phases.
liquid
C1
T
C1+T
C1+M

The existing databases for steels, superalloys, aluminium, ceramics etc. can calculate thermodynamic properties for commercial alloys with up to 12 components and are used by industry.
Each such database represent typically 50-100 manyears of assessment work by scientists and graduate students.
More important, each database contain several 1000 manyears of experimental work and can save much more experimental work in the future as calculations make it possible to select critical experiments.
Development of CALPHAD databases

Conclusions
• Thermodynamic modelling of alloys and oxide systems provide a good estimate of the thermodynamic data for multicomponent systems.
• Models for liquids and solid with defects is complex and an important field of research in modelling, experimentally and ab initio.
• Thermodynamic data gives information on phase transformations from metastable states as they provide information on the stable state the system tries to reach.

End of lecture

That’s all