on the persistence of fingerprints
TRANSCRIPT

On the Persistence of Fingerprints
Soweon Yoon and Anil K. Jain
Michigan State University http://biometrics.cse.msu.edu
IBPC 2014
April 3, 2014
Research supported by NSF CITeR
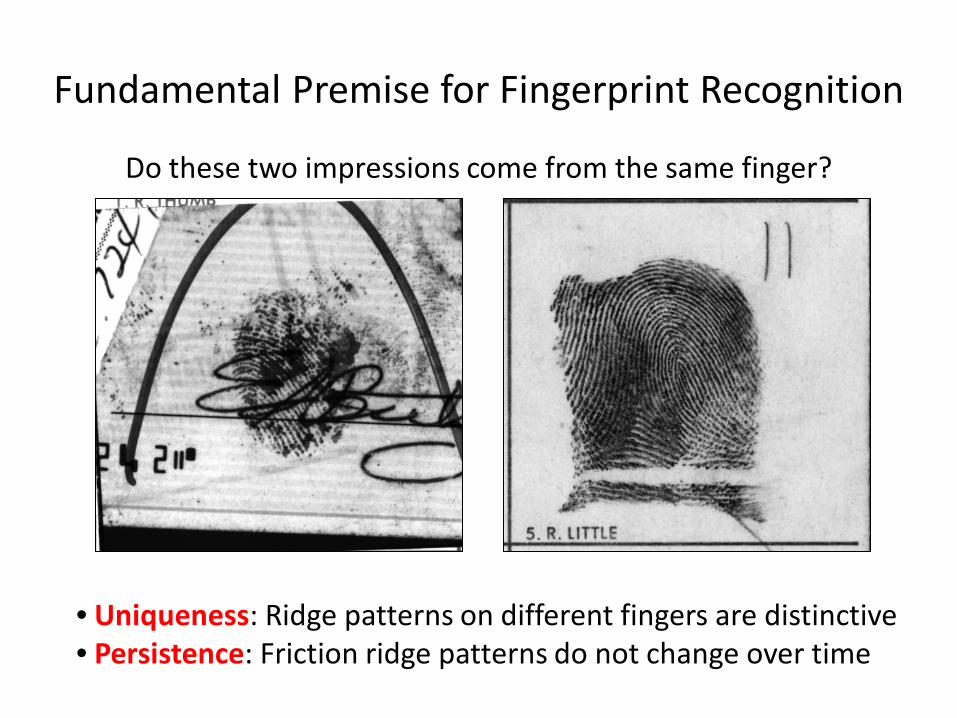
Fundamental Premise for Fingerprint Recognition
Do these two impressions come from the same finger?
• Uniqueness: Ridge patterns on different fingers are distinctive • Persistence: Friction ridge patterns do not change over time
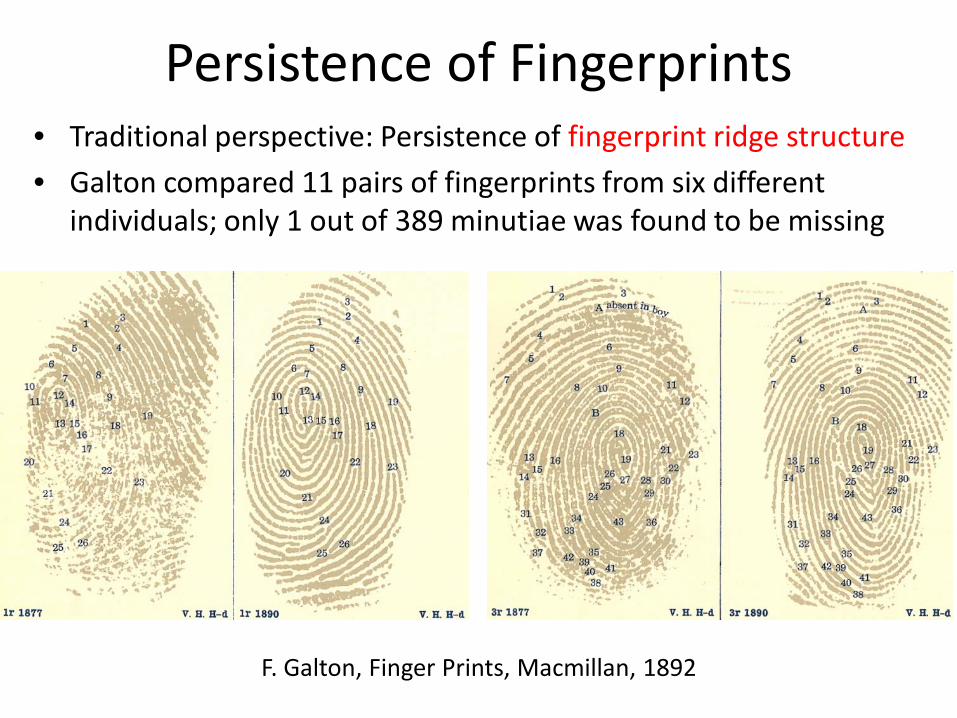
• Traditional perspective: Persistence of fingerprint ridge structure • Galton compared 11 pairs of fingerprints from six different
individuals; only 1 out of 389 minutiae was found to be missing
Persistence of Fingerprints
F. Galton, Finger Prints, Macmillan, 1892
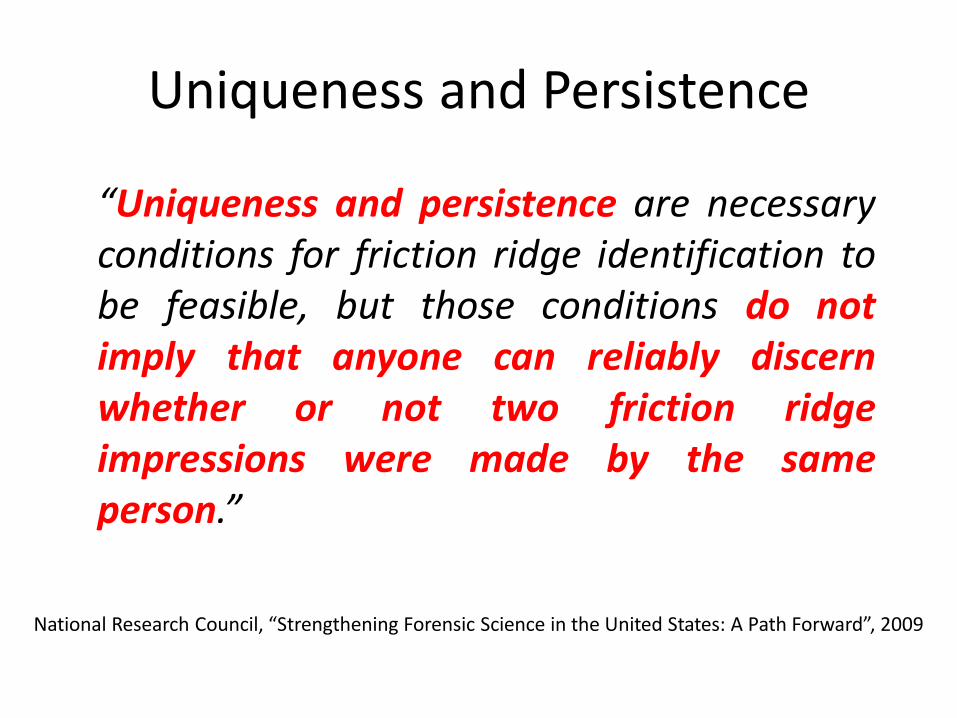
Uniqueness and Persistence
National Research Council, “Strengthening Forensic Science in the United States: A Path Forward”, 2009
“Uniqueness and persistence are necessary conditions for friction ridge identification to be feasible, but those conditions do not imply that anyone can reliably discern whether or not two friction ridge impressions were made by the same person.”

Problem Definition
∆T
Mat
ch S
core
Stable?
Trend of genuine match scores
∆T
Mat
ch S
core
False rejection
occurs
Decision threshold
Trend of matching accuracy
Determine the persistence of fingerprints w.r.t. AFIS accuracy

Data Type: Longitudinal vs. Cross-Sectional
Subject 1
Subject 2
Subject 3
Subject 5
Subject 6
Subject 4
Population
y1
y2
y4
y3
y
y6
5
Subject 1
Subject 2
Subject 3
Subject 5
Subject 6
Subject 4
Population
y11
y21
y41
y31
y51
y61
y12
y32
y33
y42
y62
y43
y44
Longitudinal data Repeated measurements on a collection of
individuals sampled from a population
Cross-sectional data A single measurement is made on each individual
sampled from a population
Longitudinal data are called • Balanced data : Every subject has the same number of measurements • Time-structured data: Repeated measurements follow an identical time schedule across individuals
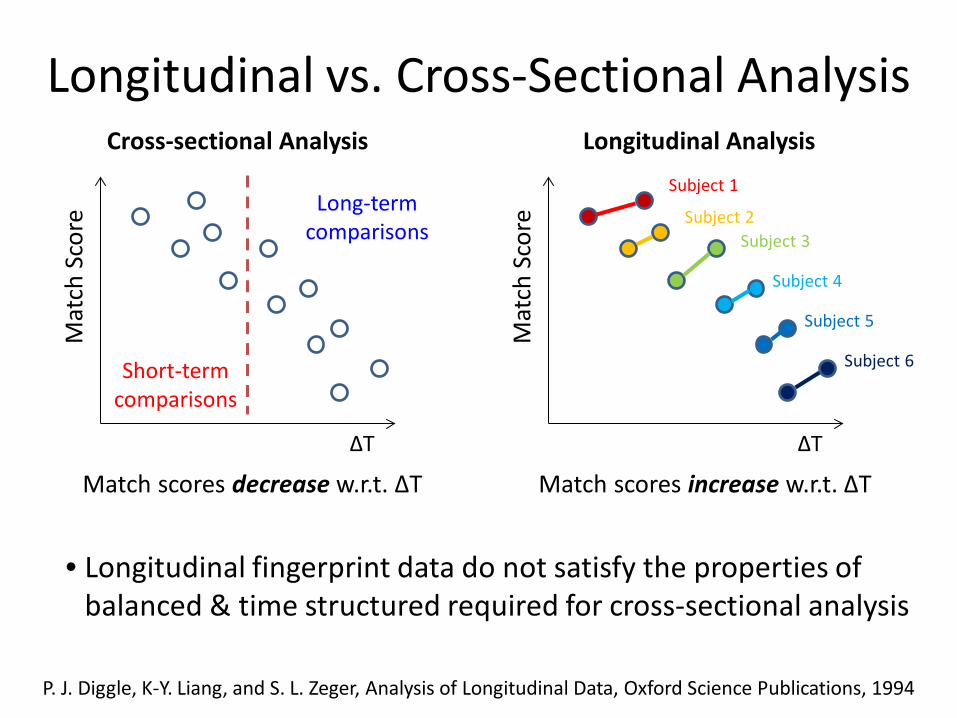
Longitudinal vs. Cross-Sectional Analysis
∆T
Mat
ch S
core
Short-term comparisons
Long-term comparisons
Cross-sectional Analysis
P. J. Diggle, K-Y. Liang, and S. L. Zeger, Analysis of Longitudinal Data, Oxford Science Publications, 1994
∆T
Mat
ch S
core
Subject 1
Subject 2 Subject 3
Subject 4
Subject 5
Subject 6
Longitudinal Analysis
Match scores decrease w.r.t. ∆T Match scores increase w.r.t. ∆T
• Longitudinal fingerprint data do not satisfy the properties of balanced & time structured required for cross-sectional analysis
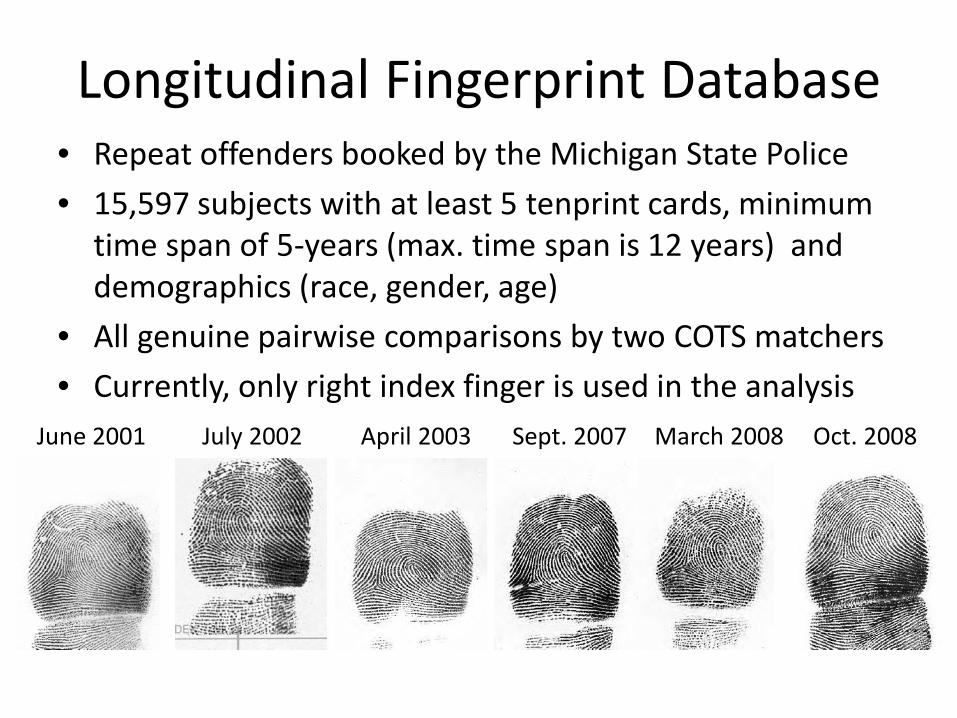
Longitudinal Fingerprint Database • Repeat offenders booked by the Michigan State Police • 15,597 subjects with at least 5 tenprint cards, minimum
time span of 5-years (max. time span is 12 years) and demographics (race, gender, age)
• All genuine pairwise comparisons by two COTS matchers • Currently, only right index finger is used in the analysis
June 2001 July 2002 April 2003 Sept. 2007 March 2008 Oct. 2008

Approach
• Fit and evaluate a multilevel statistical model with time gap as covariate to genuine match scores – Null hypothesis: Slope of linear model is 0
• Compare time gap with other possible covariates (i.e., subject’s age, fingerprint quality, race, and gender)
• Fit a multilevel model with time gap as covariate to binary match decisions
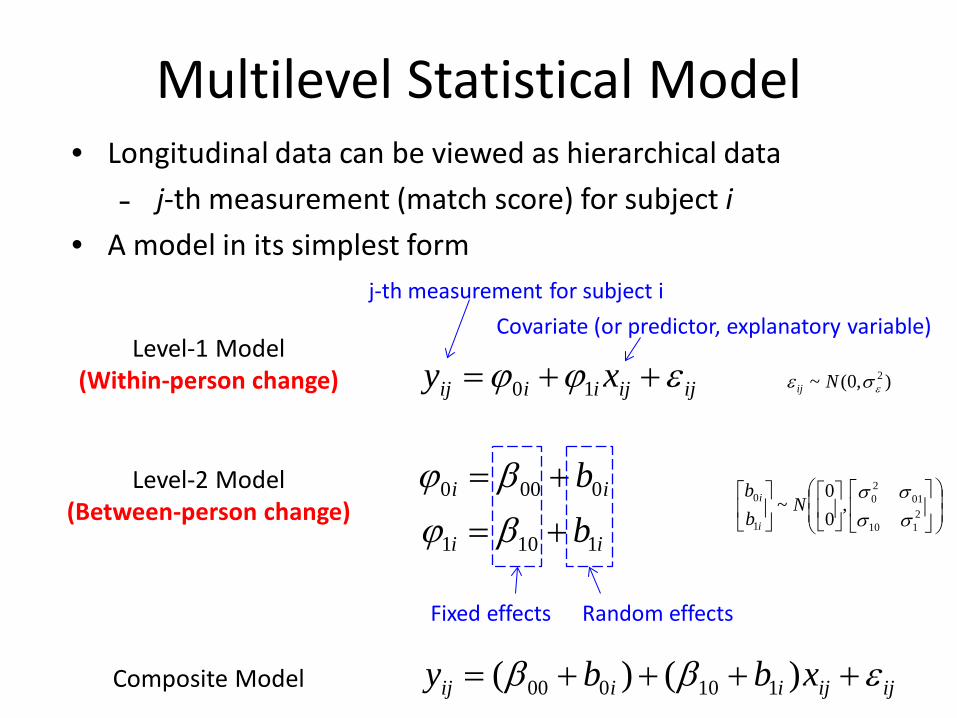
• Longitudinal data can be viewed as hierarchical data ˗ j-th measurement (match score) for subject i
• A model in its simplest form
ijijiiij xy εϕϕ ++= 10 ),0(~ 2εσε Nij
ii b0000 += βϕ
ii b1101 += βϕ
2110
0120
1
0 ,00
~σσσσ
Nbb
i
i
Level-1 Model (Within-person change)
Level-2 Model (Between-person change)
j-th measurement for subject i Covariate (or predictor, explanatory variable)
Fixed effects Random effects
Multilevel Statistical Model
ijijiiij xbby εββ ++++= )()( 110000Composite Model
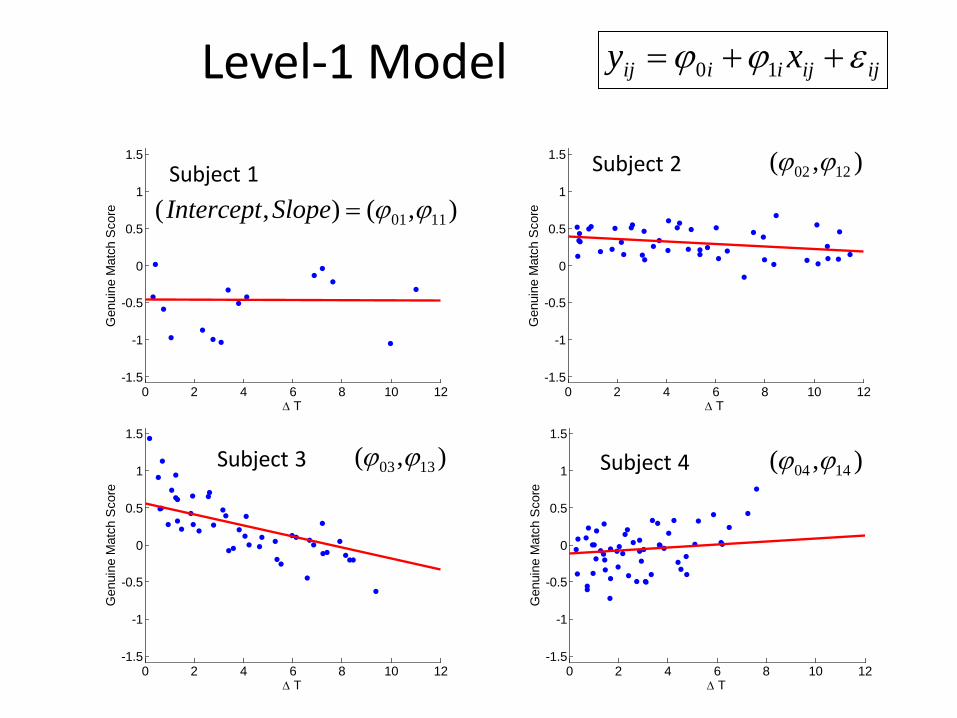
0 2 4 6 8 10 12-1.5
-1
-0.5
0
0.5
1
1.5
∆ T
Gen
uine
Mat
ch S
core
Subject 2 ),( 1202 ϕϕ
0 2 4 6 8 10 12-1.5
-1
-0.5
0
0.5
1
1.5
∆ T
Gen
uine
Mat
ch S
core
Subject 4 ),( 1404 ϕϕ
0 2 4 6 8 10 12-1.5
-1
-0.5
0
0.5
1
1.5
∆ T
Gen
uine
Mat
ch S
core
Subject 3 ),( 1303 ϕϕ
0 2 4 6 8 10 12-1.5
-1
-0.5
0
0.5
1
1.5
∆ T
Gen
uine
Mat
ch S
core
Subject 1 ),(),( 1101 ϕϕ=SlopeIntercept
Level-1 Model ijijiiij xy εϕϕ ++= 10
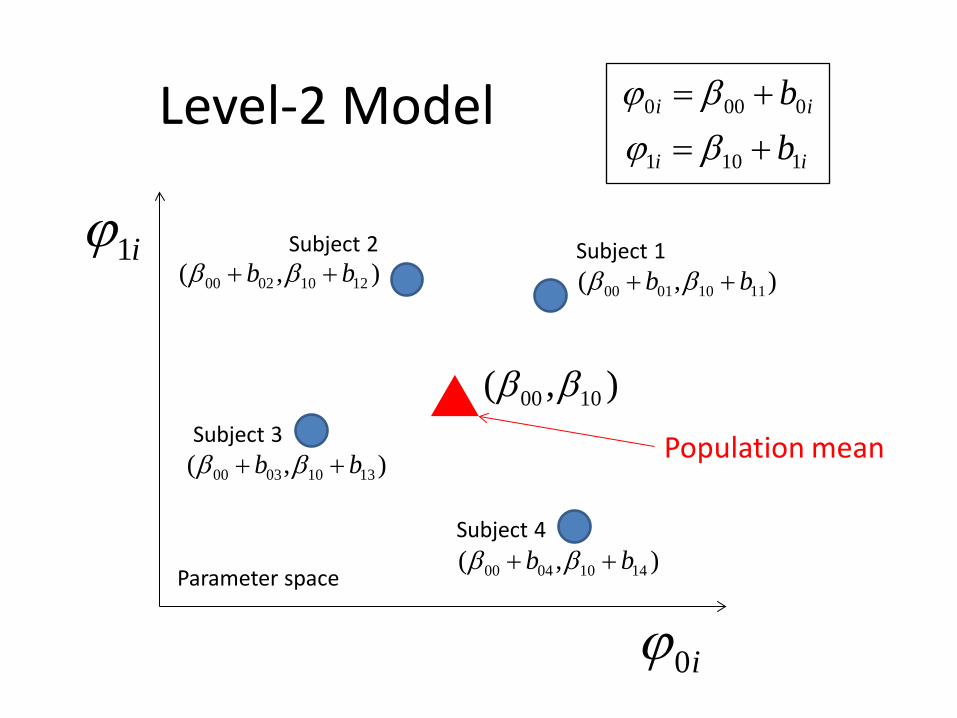
Level-2 Model ii b0000 += βϕ
ii b1101 += βϕ
i0ϕ
i1ϕ
),( 1000 ββ
Population mean
Parameter space
),( 11100100 bb ++ ββ),( 12100200 bb ++ ββ
),( 13100300 bb ++ ββ
),( 14100400 bb ++ ββ
Subject 1 Subject 2
Subject 3
Subject 4

Part I. Genuine Match Score Modeling
ijiijy εϕ += 0
ijijiiij xy εϕϕ ++= 10
Model A (Unconditional mean model)
Model B
ii b0000 += βϕ
ii b1101 += βϕ
Level-1 Level-2
Model C
ijijiiij Ty εϕϕ +∆+= 10
iii bC 001000 ++= ββϕ
iii bC 111101 ++= ββϕ
ijij Tx ∆=
ijij AGEx =
ijij Qx =
BT: Time interval
BA: Subject’s age
BQ: Max. of NFIQ of fingerprints in comparison
ii bMaleC =
ii bWhiteC =CG: Gender CR: Race
ii b0000 += βϕ
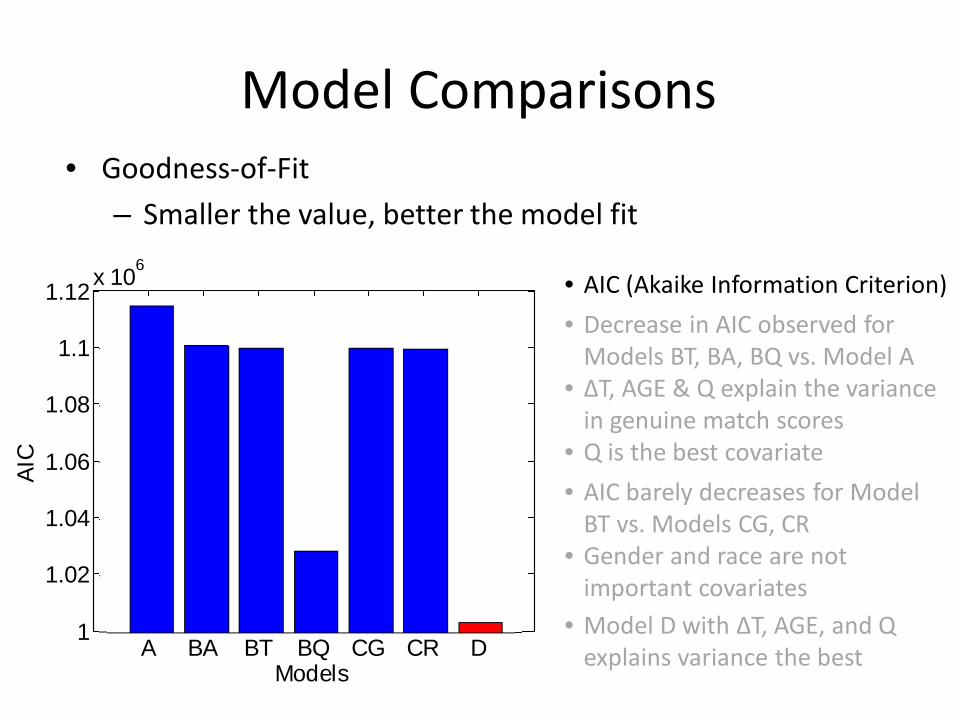
A BA BT BQ CG CR D1
1.02
1.04
1.06
1.08
1.1
1.12x 10⁶
Models
AIC
Model Comparisons • Goodness-of-Fit
– Smaller the value, better the model fit
• AIC (Akaike Information Criterion) • Decrease in AIC observed for
Models BT, BA, BQ vs. Model A • ΔT, AGE & Q explain the variance
in genuine match scores • Q is the best covariate • AIC barely decreases for Model
BT vs. Models CG, CR • Gender and race are not
important covariates • Model D with ΔT, AGE, and Q
explains variance the best

-4 -3 -2 -1 0 1 2 3 4
0.0010.0030.010.020.050.10
0.25
0.50
0.75
0.900.950.980.99
0.9970.999
Standardized Residuals
Prob
abilit
y
-3 -2 -1 0 1 2
0.0010.0030.010.020.050.10
0.25
0.50
0.75
0.900.950.980.99
0.9970.999
Standardized Residuals
Prob
abilit
y
-0.2 -0.15 -0.1 -0.05 0 0.05 0.1
0.0010.0030.010.020.050.10
0.25
0.50
0.75
0.900.950.980.99
0.9970.999
Standardized ResidualsPr
obab
ility
Validation of Model Assumptions • Normal probability plots
– If linear, the distribution is normal
),0(~ 2εσε Nij
2110
0120
1
0 ,00
~σσσσ
Nbb
i
i
Level-2 Level-1
• Departures from normality are observed at tails

0 20 40 60 80
-3
-2
-1
0
1
2
Age [Year]
Mat
ch S
core
Mean95% Confidence Interval
0 2 4 6 8 10 12
-3
-2
-1
0
1
2
Time Interval [Year]
Mat
ch S
core
Mean95% Confidence Interval
Parameter Estimates and Hypothesis Tests
• Genuine match scores decrease w.r.t. time interval, subject’s age, and NFIQ
• Bootstrap to obtain parameter estimates and confidence interval – Resample N (= 15,597) subjects with replacement; 1,000 bootstrap samples
• H0: β10 = 0 (slope of linear model is 0) – H0 is rejected at 0.05 level for Model BT, BA, and BQ
1 2 3 4 5
-3
-2
-1
0
1
2
NFIQ
Mat
ch S
core
Mean95% Confidence Interval
Time Interval Age Quality
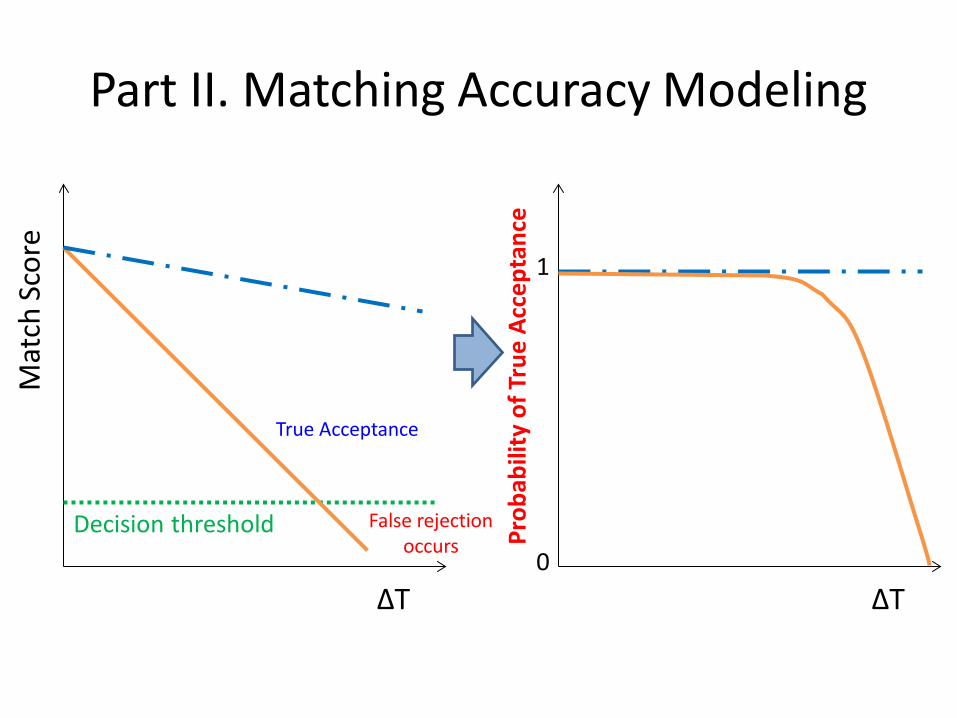
Part II. Matching Accuracy Modeling
∆T
Mat
ch S
core
False rejection occurs
Decision threshold
True Acceptance
Prob
abili
ty o
f Tru
e Ac
cept
ance
1
0 ∆T

Multilevel Model for Binary Responses (Generalized Linear Mixed-effects Model)
ijijiiij
ijij
ijij
xgBiny
Thyy
εϕϕπ
π
++=
>
=
10
*
*
)(),1(~
otherwise,0,1
ii b0000 += βϕ
ii b1101 += βϕ
),0(~ 2εσε Nij
2110
0120
1
0 ,00
~σσσσ
Nbb
i
i
Level-1
Level-2
functionlogit a is )g(, responsesfor binary
function;link a is )(
⋅
⋅g
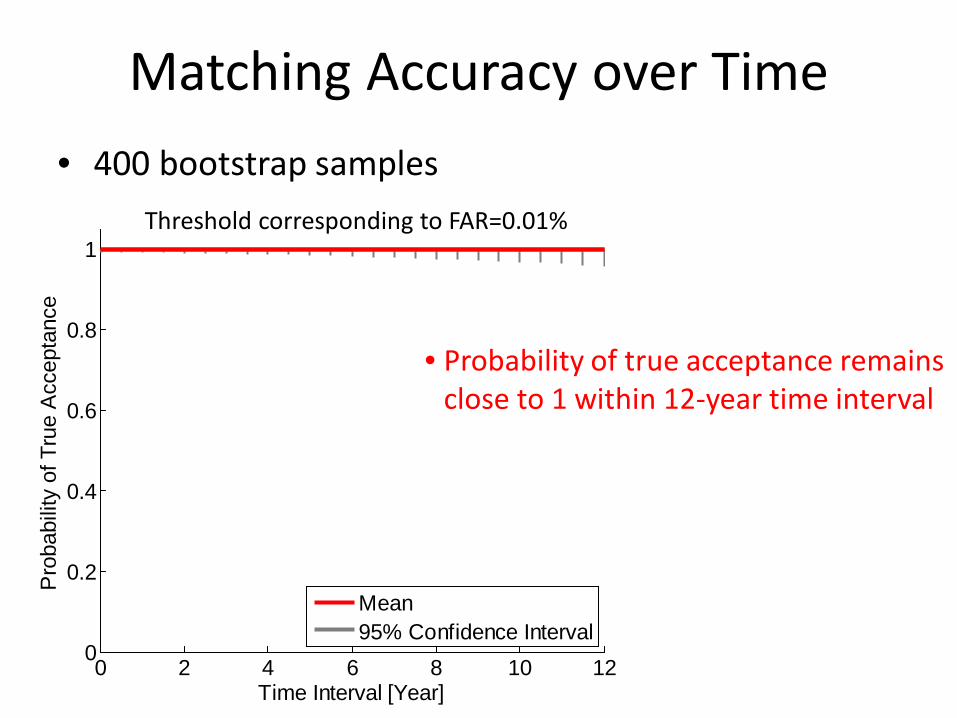
0 2 4 6 8 10 120
0.2
0.4
0.6
0.8
1
Time Interval [Year]
Prob
abilit
y of
Tru
e Ac
cept
ance
Mean95% Confidence Interval
Matching Accuracy over Time • 400 bootstrap samples
• Probability of true acceptance remains close to 1 within 12-year time interval
Threshold corresponding to FAR=0.01%
Summary and Conclusions • Statistical analysis with multilevel models for longitudinal
fingerprint data (15,597 subjects with 12-year time span)
• Based on the results of hypothesis test and bootstrap confidence interval, we can make following inferences
– Genuine match score tends to decrease over time
– Matching accuracy tends to remain stable over time with high confidence
• Future work
– Analyze longitudinal data with longer time span
– Explore nonlinear models and interaction terms

Thank you.