on the reliability of information retrieval metrics based on graded relevance
TRANSCRIPT
Information Processing and Management 43 (2007) 531–548
www.elsevier.com/locate/infoproman
On the reliability of information retrieval metrics basedon graded relevance
Tetsuya Sakai
Toshiba Corporate R&D Center, Knowledge Media Laboratory, 1 Komukai-Toshiba-cho, Saiwai-ku, Kawasaki 212-8582, Japan
Received 15 May 2006; accepted 25 July 2006Available online 11 October 2006
Abstract
This paper compares 14 information retrieval metrics based on graded relevance, together with 10 traditional metricsbased on binary relevance, in terms of stability, sensitivity and resemblance of system rankings. More specifically, we com-pare these metrics using the Buckley/Voorhees stability method, the Voorhees/Buckley swap method and Kendall’s rankcorrelation, with three data sets comprising test collections and submitted runs from NTCIR. Our experiments show that(Average) Normalised Discounted Cumulative Gain at document cut-off l are the best among the rank-based graded-relevance metrics, provided that l is large. On the other hand, if one requires a recall-based graded-relevance metric thatis highly correlated with Average Precision, then Q-measure is the best choice. Moreover, these best graded-relevancemetrics are at least as stable and sensitive as Average Precision, and are fairly robust to the choice of gain values.� 2006 Elsevier Ltd. All rights reserved.
Keywords: Evaluation; Reliability; Graded relevance; Q-measure; Cumulative gain
1. Introduction
After a decade of TREC evaluations based on binary relevance, the importance of information retrieval(IR) evaluation based on graded relevance has begun to receive attention (Jarvelin & Kekalainen, 2002;Kekalainen, 2005; Sakai, 2003, 2004; Voorhees, 2001). However, although several graded-relevance metricsexist for IR, none of them is as widely used as traditional binary-relevance metrics such as Average Precision(AveP) at present. For example, even though the NTCIR CLIR track series (Chen et al., 2003) have gradedrelevance (S, A and B in decreasing order of relevance), two versions of AveP are used for ranking the par-ticipating systems: ‘‘Relaxed’’ AveP which treats S-, A- and B-relevant documents as ‘‘relevant’’, and ‘‘Rigid’’AveP which treats only S- and A-relevant documents as ‘‘relevant’’.
0306-4573/$ - see front matter � 2006 Elsevier Ltd. All rights reserved.
doi:10.1016/j.ipm.2006.07.020
E-mail address: [email protected]

532 T. Sakai / Information Processing and Management 43 (2007) 531–548
The objective of this paper1 is to improve these situations by clarifying which of the graded-relevance metricsare reliable and useful. To this end, we use the stability method proposed by Buckley and Voorhees (2000), theswap method proposed by Voorhees and Buckley (2002) and Kendall’s rank correlation, with three data setscomprising test collections and submitted runs from NTCIR. We test 14 graded-relevance metrics plus 10 bin-ary-relevance ones, including both recall-based metrics and rank-based metrics (Hull, 1993). Our experimentsshow that (Average) Normalised Discounted Cumulative Gain at document cut-off l, proposed by Jarvelinand Kekalainen (2002), are the best among the rank-based graded-relevance metrics, provided that l is large.On the other hand, if one requires a recall-based graded-relevance metric that is highly correlated with AveragePrecision, then Q-measure, proposed by Sakai (2004), is the best choice. Moreover, these best graded-relevancemetrics are at least as stable and sensitive as Average Precision, and are fairly robust to the choice of gain values.
Section 2 formally defines all the metrics considered in this paper. Section 3 briefly describes the stabilitymethod, the swap method and Kendall’s rank correlation, and Section 4 discusses our experimental results.Section 5 discusses related work, and Section 6 concludes this paper.
2. Effectiveness metrics
2.1. Metrics based on binary relevance
Let R denote the number of relevant documents for a topic, and let L denote the size of a ranked output.Following the TREC/NTCIR traditions, we let L 6 L 0 = 1000 throughout this study. Let count(r) denote thenumber of relevant documents within top r (6L) of the ranked output, and let isrel(r) be 1 if the document atRank r is relevant and 0 otherwise. Clearly, Precision at Rank r is given by P(r) = count(r)/r. Then, AveragePrecision (AveP), R-Precision (R-Prec) and Precision at Document cut-off l (PDocl) can be expressed as
1 Anadditiocorrela
AveP ¼ 1
R
X
16r6L
isrelðrÞP ðrÞ; ð1Þ
R-Prec ¼ P ðRÞ; ð2ÞPDocl ¼ PðlÞ; ð3Þ
PDocl, a rank-based metric, does not average well especially if l is large, because its upperbound is less thanone for topics such that R < l. This paper examines PDocl with l = 10,100,1000. PDocl with large l is insen-sitive in that it cannot tell the difference between a system that has some relevant documents at the top of thelist and one that has the same number of relevant documents at the bottom of the list. On the other hand,PDocl with small l means that the systems are evaluated based on a small number of observations (i.e., doc-uments at the very top of the ranked list), which reduces its stability and sensitivity (Buckley & Voorhees,2000; Voorhees & Buckley, 2002).
Both AveP and R-Prec average well as they are recall-based metrics, and they are highly correlated witheach other (Buckley & Voorhees, 2000; Sakai, 2004), although R-Prec is expected to be less sensitive thanAveP as it cannot distinguish between a relevant document at Rank 1 and one at Rank R, and ignores all doc-uments below Rank R.
Since NTCIR officially uses two separate binary relevance assessment files, one including B-relevant docu-ments and one excluding them, we have both ‘‘Relaxed’’ and ‘‘Rigid’’ versions of each binary-relevance metric.
2.2. Metrics based on graded relevance
All the graded-relevance metrics considered in this paper are based on cumulative gain (Jarvelin & Kekalai-nen, 2002; Kekalainen, 2005), which in fact is very similar to the idea behind a graded-relevance metric calledthe sliding ratio proposed back in the 1960s (Korfhage, 1997).
early version of this paper was presented at Asia Information Retrieval Symposium 2005 (Sakai, 2005b). This paper contains annal set of experiments using the Japanese test collection and runs from the NTCIR-3 CLIR track. Moreover, some of the Kendall’stion values reported in the above publication were incorrect: this paper provides the correct results.

T. Sakai / Information Processing and Management 43 (2007) 531–548 533
Let R(X) denote the number of X-relevant documents, so thatP
X RðX Þ ¼ R, and let gain(X) denote the gain
value for retrieving an X-relevant document. By default, we use gain(S) = 3, gain(A) = 2, gain(B) = 1 for theNTCIR data. Let cgðrÞ ¼
P16i6rgðiÞ denote the cumulative gain at Rank r of the system’s output, where
g(i) = gain(X) if the document at Rank i is X-relevant and g(i) = 0 otherwise. In particular, consider an idealranked output, such that isrel(r) = 1 for 1 6 r 6 R and g(r) 6 g(r � 1) for r > 1, and let cgI(r) denote the idealcumulative gain at Rank r. For the NTCIR data, an ideal ranked output lists up all S-, A- and B-relevantdocuments exhaustively in this order.
For convenience, we first define weighted precision at Rank r as WP(r) = cg(r)/cgI(r). Then, (Average) norma-lised Cumulative Gain at document cut-off l, proposed by Jarvelin and Kekalainen (2002), can be expressed as
nCGl ¼ WPðlÞ; ð4Þ
AnCGl ¼1
l
X
16r6l
WPðlÞ: ð5Þ
However, any metric that is based on weighted precision cannot properly penalise ‘‘late arrival’’ of relevantdocuments, as an ideal ranked output runs out of relevant documents at Rank R (Sakai, 2004). There areat least two approaches to solving this problem.
The first approach is to use discounted cumulative gain dcgðrÞ ¼P
16i6rdgðiÞ where dg(i) = g(i)/logai fori > a and dg(i) = g(i) otherwise. If the discounted cumulative gain for an ideal ranked output is denoted bydcgI(r), then we can use discounted weighted precision DWP(r) = dcg(r)/dcgI(r) instead of WP(r). Thus, (Aver-age) normalised Discounted Cumulative Gain at document cut-off l, proposed by Jarvelin and Kekalainen(2002), can be expressed as
nDCGl ¼ DWP ðlÞ; ð6Þ
AnDCGl ¼1
l
X
16r6l
DWPðlÞ: ð7Þ
However, nDCGl with a large logarithm base a inherits the defect of nCGl, since discounting is not applied untilRank a. For example, if R = 3 and a = 10 6 l, it makes no difference whether a relevant document is retrieved atRank 3 or at Rank 10. For this reason, we let a = 2 throughout this paper. As (A)n(D)CGl are ranked-basedmetrics, we consider l = 10,100,1000 as with PDocl. We do not consider the unnormalised (discounted) cumu-lative gain, CGl = cg(l) and DCGl = dcg(l), as these metrics are not even bounded by one: they take arbitrarilylarge values for topics with many relevant documents and are not suitable for averaging across topics.
The second approach to penalising late arrival of relevant documents is to use the blended ratio
BR(r) = (cg(r) + count(r))/(cgI(r) + r) instead of WP(r) (Sakai, 2004, 2006c). Just like WP(r), BR(r) measuresthe deviation of the system output from the ideal output, but is free from the problem of WP(r) because itincludes r in the denominator. That is, late arrival of a relevant document is always penalised. The blendedratio can also be regarded as a generalisation of (binary) precision, since in a binary relevance environment,BR(r) = P(r) holds iff r 6 R and BR(r) > P(r) holds iff r > R.
Using the blended ratio, Sakai (2004) defined Q-measure and R-measure, which are exactly like AveP andR-Prec, respectively, except for their graded-relevance capability:
Q-measure ¼ 1
R
X
16r6L
isrelðrÞBRðrÞ; ð8Þ
R-measure ¼ BRðRÞ: ð9Þ
The following are some properties of Q-measure and R-measure:� Q-measure is equal to one iff a system output is an ideal one.� R-measure is equal to one iff all of the top R documents are (at least partially) relevant; That is, it cannot
tell the difference between an ideal ranked output and (say) an output that has all B-relevant documents atthe very top, followed by all A-relevant ones, followed by all S-relevant ones.� In a binary relevance environment, Q-measure = AveP holds iff there is no relevant document below Rank
R, and Q-measure > AveP holds otherwise.

534 T. Sakai / Information Processing and Management 43 (2007) 531–548
� In a binary relevance environment, R-measure = R-Prec.� With small gain values, Q-measure behaves like AveP.� With small gain values, R-measure behaves like R-prec.
Q-measure and R-measure are recall-based, while (A)n(D)CGl are rank-based. Although one may arguethat rank-based metrics better model user behaviour, the choice of l for (A)n(D)CGl is arbitrary, and thiscan affect the system ranking considerably, as we shall see later in this paper. This is somewhat similar tothe case of PDocl (Buckley & Voorhees, 2000).
3. Methods for comparing IR metrics
This section describes three methods we use for comparing IR metrics very briefly, due to the page limitannounced by the Special Issue Editors.
The first method is the stability method proposed by Buckley and Voorhees (2000). For a given IR metricand a constant c, this method generates 1000 topic sets Qi s.t. jQij = c from the original topic set Q, and yieldsa trade-off curve between the Minority Rate (MR), which represents lack of stability with respect to change inthe topic set, and the Proportion of Ties (PT), which represents lack of discriminative power. The exact algo-rithm we used can be found in Sakai (2005b).
The second method is the swap method proposed by Voorhees and Buckley (2002), which can be used toexamine the sensitivity of IR metrics. This method generates 1000 pairs of topic subsets Qi and Q0i s.t.j Qi j¼j Q0i j¼ c and Qi \ Q0i ¼ / (i.e., the two sets are disjoint), and estimates the overall absolute differencerequired to guarantee that the swap rate, the chance of obtaining a discrepancy between two topic sets asto whether a system is better than another, does not exceed a given threshold. Moreover, we can checkhow often system pairs actually satisfy this difference requirement among all comparisons performed duringthe experiment. This reflects the sensitivity of the IR metric being used. Again, the exact algorithm we used canbe found in Sakai (2005b).
Because Qi and Q0i must be disjoint, they can only be up to half the size of the original topic set Q. Voorheesand Buckley (2002) have used extrapolation for larger topic set sizes, but we stick to the statistics actually mea-sured in our study, since our goal is to compare different metrics under the same condition.
It should be noted that the above two methods sample topics without replacement. Sanderson and Zobel(2005) and Sakai (2005a) explored a few variations of the swap method, and the latter showed that sampling withand without replacement yield very similar results for comparing different metrics. This paper therefore discusseswithout-replacement results only: the corresponding with-replacement results can be found in Sakai (2005a).
The third method we use is to examine Kendall’s rank correlation between two system rankings according totwo different IR metrics (Kekalainen, 2005; Sakai, 2004; Voorhees, 2001). Sakai (2006a) describes a standardstatistical significance test for Kendall’s rank correlation: according to this test, Kendall’s rank correlationbased on ns = 45,33,24 runs (see Table 1) is statistically significant at a = 0.01 if it is over 0.27, 0.32, 0.38,respectively (two-tailed test).
4. Experiments
4.1. Data
We used three sets of test collections and submitted runs from the NTCIR-3 CLIR task (Chen et al., 2003),namely, the Chinese, Japanese and English data sets whose statistics are shown in Table 1. For example, for
Table 1Statistics of the NTCIR-3 CLIR data
Document language jQj (jQij) # Runs R(S) R(A) R(B) R
Chinese 42 (20) 45 (30) 21.0 24.9 32.3 78.2Japanese 42 (20) 33 (30) 7.9 31.5 21.0 60.4English 32 (15) 24 (20) 3.6 10.2 9.3 23.2
T. Sakai / Information Processing and Management 43 (2007) 531–548 535
the Chinese data, the entire topic set Q and the 45 runs were used for rank correlation computation. Whereas,for the stability and the swap methods, each Qi contained c = 20 (<jQj/2) resampled topics, and top 30 runs asmeasured by Relaxed-AveP were used. Note that the English data set is relatively small in terms of topic setsize, the number of relevant documents and the number of runs. Therefore, our English results may be lessreliable than others.
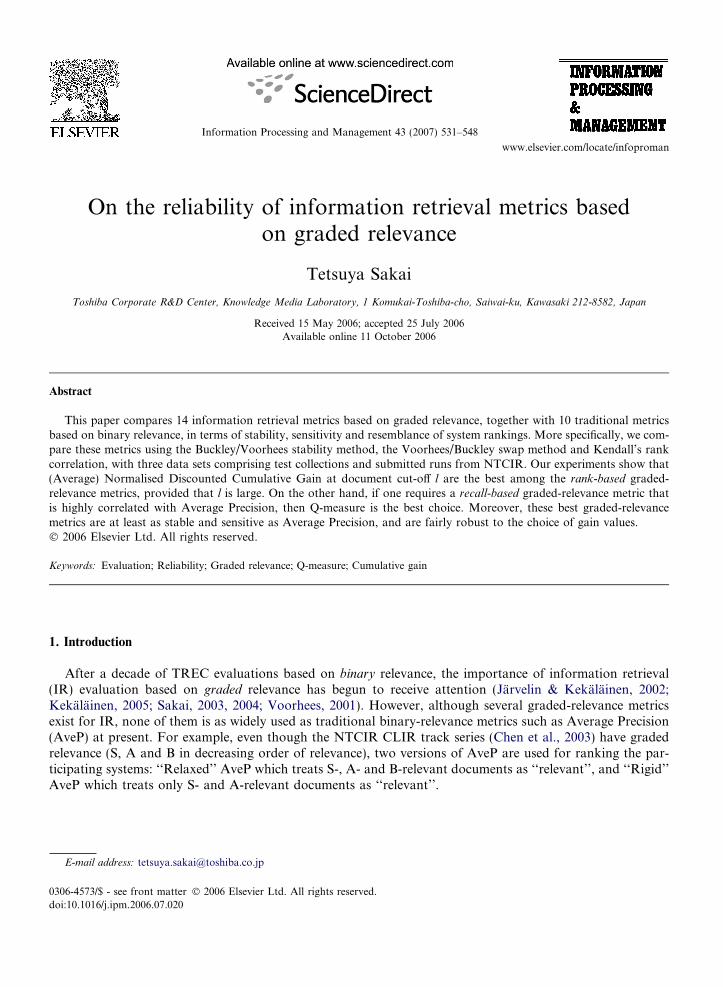
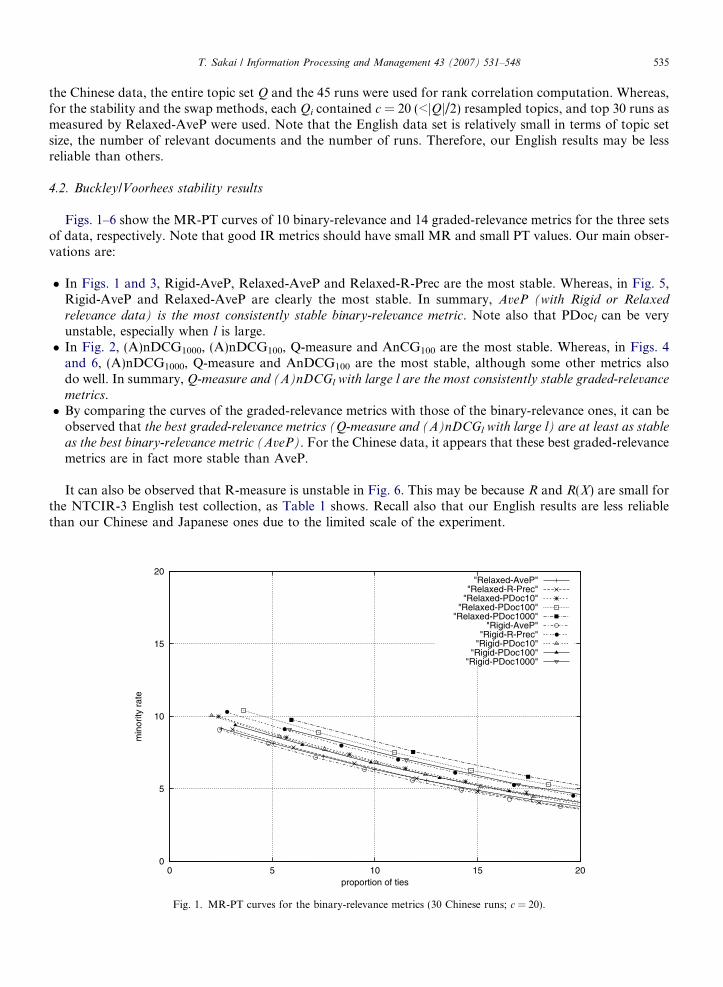
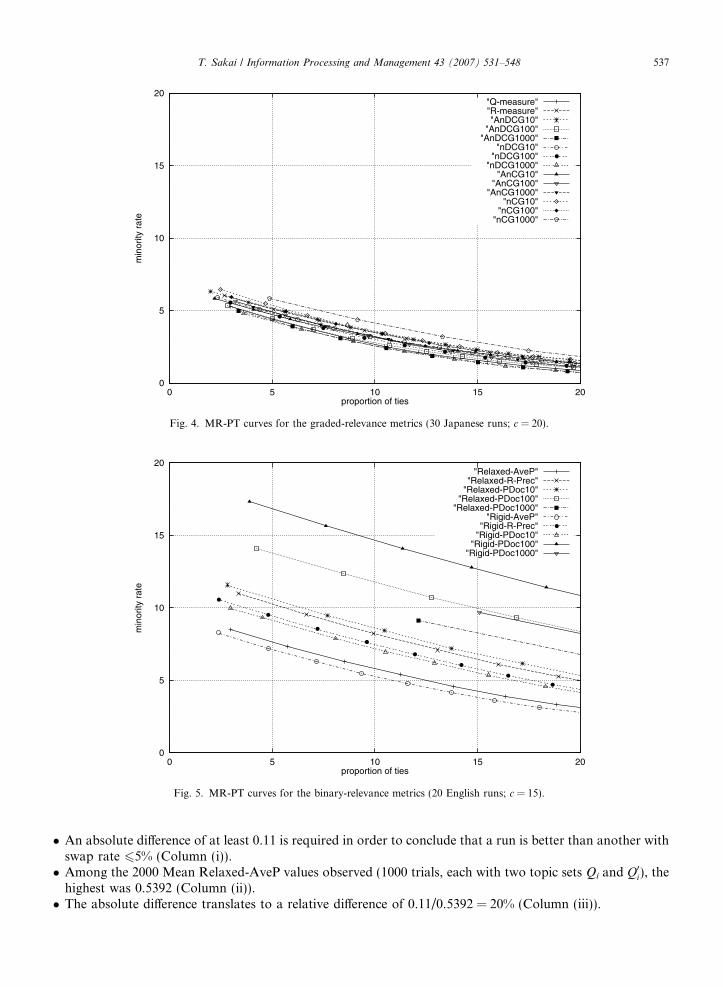
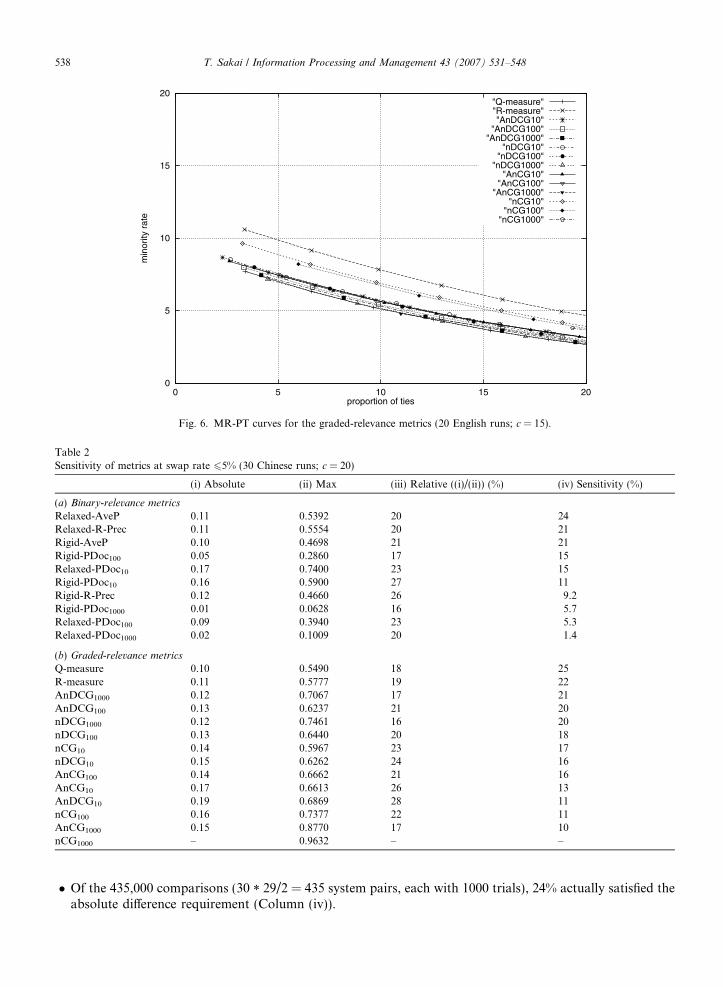
4.2. Buckley/Voorhees stability results
Figs. 1–6 show the MR-PT curves of 10 binary-relevance and 14 graded-relevance metrics for the three setsof data, respectively. Note that good IR metrics should have small MR and small PT values. Our main obser-vations are:
� In Figs. 1 and 3, Rigid-AveP, Relaxed-AveP and Relaxed-R-Prec are the most stable. Whereas, in Fig. 5,Rigid-AveP and Relaxed-AveP are clearly the most stable. In summary, AveP (with Rigid or Relaxed
relevance data) is the most consistently stable binary-relevance metric. Note also that PDocl can be veryunstable, especially when l is large.� In Fig. 2, (A)nDCG1000, (A)nDCG100, Q-measure and AnCG100 are the most stable. Whereas, in Figs. 4
and 6, (A)nDCG1000, Q-measure and AnDCG100 are the most stable, although some other metrics alsodo well. In summary, Q-measure and (A)nDCGl with large l are the most consistently stable graded-relevance
metrics.� By comparing the curves of the graded-relevance metrics with those of the binary-relevance ones, it can be
observed that the best graded-relevance metrics (Q-measure and (A)nDCGl with large l) are at least as stable
as the best binary-relevance metric (AveP). For the Chinese data, it appears that these best graded-relevancemetrics are in fact more stable than AveP.
It can also be observed that R-measure is unstable in Fig. 6. This may be because R and R(X) are small forthe NTCIR-3 English test collection, as Table 1 shows. Recall also that our English results are less reliablethan our Chinese and Japanese ones due to the limited scale of the experiment.
0
5
10
15
20
0 5 10 15 20
min
ority
rat
e
proportion of ties
"Relaxed-AveP""Relaxed-R-Prec"
"Relaxed-PDoc10""Relaxed-PDoc100"
"Relaxed-PDoc1000""Rigid-AveP"
"Rigid-R-Prec""Rigid-PDoc10"
"Rigid-PDoc100""Rigid-PDoc1000"
Fig. 1. MR-PT curves for the binary-relevance metrics (30 Chinese runs; c = 20).

0
5
10
15
20
0 5 10 15 20
min
ority
rat
e
proportion of ties
"Q-measure""R-measure""AnDCG10"
"AnDCG100""AnDCG1000"
"nDCG10""nDCG100"
"nDCG1000""AnCG10"
"AnCG100""AnCG1000"
"nCG10""nCG100"
"nCG1000"
Fig. 2. MR-PT curves for the graded-relevance metrics (30 Chinese runs; c = 20).
0
5
10
15
20
0 5 10 15 20
min
ority
rat
e
proportion of ties
"Relaxed-AveP""Relaxed-R-Prec"
"Relaxed-PDoc10""Relaxed-PDoc100"
"Relaxed-PDoc1000""Rigid-AveP"
"Rigid-R-Prec""Rigid-PDoc10"
"Rigid-PDoc100""Rigid-PDoc1000"
Fig. 3. MR-PT curves for the binary-relevance metrics (30 Japanese runs; c = 20).
536 T. Sakai / Information Processing and Management 43 (2007) 531–548
4.3. Voorhees/Buckley swap results
Based on the swap method, Tables 2–4 show the sensitivity of metrics at swap rate 65% for the Chinese,Japanese and English data, respectively. For example, Table 2(a) shows that, when 20 topics are used for rank-ing the 30 Chinese runs with Relaxed-AveP,
0
5
10
15
20
0 5 10 15 20
min
ority
rat
e
proportion of ties
"Q-measure""R-measure""AnDCG10"
"AnDCG100""AnDCG1000"
"nDCG10""nDCG100"
"nDCG1000""AnCG10"
"AnCG100""AnCG1000"
"nCG10""nCG100"
"nCG1000"
Fig. 4. MR-PT curves for the graded-relevance metrics (30 Japanese runs; c = 20).
0
5
10
15
20
0 5 10 15 20
min
ority
rat
e
proportion of ties
"Relaxed-AveP""Relaxed-R-Prec"
"Relaxed-PDoc10""Relaxed-PDoc100"
"Relaxed-PDoc1000""Rigid-AveP"
"Rigid-R-Prec""Rigid-PDoc10"
"Rigid-PDoc100""Rigid-PDoc1000"
Fig. 5. MR-PT curves for the binary-relevance metrics (20 English runs; c = 15).
T. Sakai / Information Processing and Management 43 (2007) 531–548 537
� An absolute difference of at least 0.11 is required in order to conclude that a run is better than another withswap rate 65% (Column (i)).� Among the 2000 Mean Relaxed-AveP values observed (1000 trials, each with two topic sets Qi and Q0i), the
highest was 0.5392 (Column (ii)).� The absolute difference translates to a relative difference of 0.11/0.5392 = 20% (Column (iii)).
0
5
10
15
20
0 5 10 15 20
min
ority
rat
e
proportion of ties
"Q-measure""R-measure""AnDCG10"
"AnDCG100""AnDCG1000"
"nDCG10""nDCG100"
"nDCG1000""AnCG10"
"AnCG100""AnCG1000"
"nCG10""nCG100"
"nCG1000"
Fig. 6. MR-PT curves for the graded-relevance metrics (20 English runs; c = 15).
Table 2Sensitivity of metrics at swap rate 65% (30 Chinese runs; c = 20)
(i) Absolute (ii) Max (iii) Relative ((i)/(ii)) (%) (iv) Sensitivity (%)
(a) Binary-relevance metrics
Relaxed-AveP 0.11 0.5392 20 24Relaxed-R-Prec 0.11 0.5554 20 21Rigid-AveP 0.10 0.4698 21 21Rigid-PDoc100 0.05 0.2860 17 15Relaxed-PDoc10 0.17 0.7400 23 15Rigid-PDoc10 0.16 0.5900 27 11Rigid-R-Prec 0.12 0.4660 26 9.2Rigid-PDoc1000 0.01 0.0628 16 5.7Relaxed-PDoc100 0.09 0.3940 23 5.3Relaxed-PDoc1000 0.02 0.1009 20 1.4
(b) Graded-relevance metrics
Q-measure 0.10 0.5490 18 25R-measure 0.11 0.5777 19 22AnDCG1000 0.12 0.7067 17 21AnDCG100 0.13 0.6237 21 20nDCG1000 0.12 0.7461 16 20nDCG100 0.13 0.6440 20 18nCG10 0.14 0.5967 23 17nDCG10 0.15 0.6262 24 16AnCG100 0.14 0.6662 21 16AnCG10 0.17 0.6613 26 13AnDCG10 0.19 0.6869 28 11nCG100 0.16 0.7377 22 11AnCG1000 0.15 0.8770 17 10nCG1000 – 0.9632 – –
538 T. Sakai / Information Processing and Management 43 (2007) 531–548
� Of the 435,000 comparisons (30 * 29/2 = 435 system pairs, each with 1000 trials), 24% actually satisfied theabsolute difference requirement (Column (iv)).

Table 3Sensitivity of metrics at swap rate 65% (30 Japanese runs; c = 20)
(i) Absolute (ii) Max (iii) Relative ((i)/(ii)) (%) (iv) Sensitivity (%)
(a) Binary-relevance metrics
Relaxed-AveP 0.11 0.6305 17 52Relaxed-R-Prec 0.12 0.5867 20 44Rigid-AveP 0.12 0.5340 22 42Rigid-PDoc10 0.14 0.6200 23 41Relaxed-PDoc100 0.07 0.3840 18 40Relaxed-PDoc10 0.18 0.7900 23 39Rigid-PDoc100 0.05 0.2725 18 39Rigid-R-Prec 0.12 0.5029 24 38Rigid-PDoc1000 0.01 0.0603 17 28Relaxed-PDoc1000 0.02 0.0874 23 19
(b) Graded-relevance metrics
AnDCG100 0.13 0.6939 19 50Q-measure 0.12 0.6354 19 49AnDCG1000 0.13 0.7761 17 49nDCG1000 0.13 0.8106 16 48nDCG100 0.14 0.7243 19 47AnCG10 0.15 0.6927 22 47AnCG100 0.15 0.7598 20 46nCG10 0.14 0.6858 20 46AnDCG10 0.16 0.7037 23 45nDCG10 0.15 0.6819 22 45R-measure 0.13 0.6105 21 43AnCG1000 0.16 0.9491 17 43nCG100 0.18 0.8607 21 42nCG1000 0.17 0.9949 17 38
Table 4Sensitivity of metrics at swap rate 65% (20 English runs; c = 15)
(i) Absolute (ii) Max (iii) Relative ((i)/(ii)) (%) (iv) Sensitivity (%)
(a) Binary-relevance metrics
Relaxed-AveP 0.14 0.6743 21 31Rigid-AveP 0.16 0.6591 24 27Rigid-R-Prec 0.15 0.6198 24 26Rigid-PDoc10 0.13 0.4933 26 16Relaxed-PDoc10 0.18 0.6533 28 12Relaxed-R-Prec 0.19 0.6378 30 9.4Relaxed-PDoc1000 0.01 0.0358 28 2.5Relaxed-PDoc100 0.15 0.2567 58 0.0Rigid-PDoc100 0.11 0.1700 65 0.0Rigid-PDoc1000 – 0.0228 – –
(b) Graded-relevance metrics
nDCG1000 0.12 0.8314 14 37AnDCG1000 0.13 0.8164 16 35AnDCG100 0.14 0.7689 18 35nDCG100 0.14 0.8009 17 34Q-measure 0.13 0.6865 19 33R-measure 0.13 0.6641 20 30AnCG100 0.13 0.8399 15 29nDCG10 0.17 0.7484 23 28AnDCG10 0.20 0.7747 26 25nCG10 0.16 0.7371 22 25AnCG10 0.19 0.7483 25 24AnCG1000 0.10 0.9647 10 23nCG100 0.16 0.9361 17 17nCG1000 0.12 1.0000 12 8.4
T. Sakai / Information Processing and Management 43 (2007) 531–548 539
540 T. Sakai / Information Processing and Management 43 (2007) 531–548
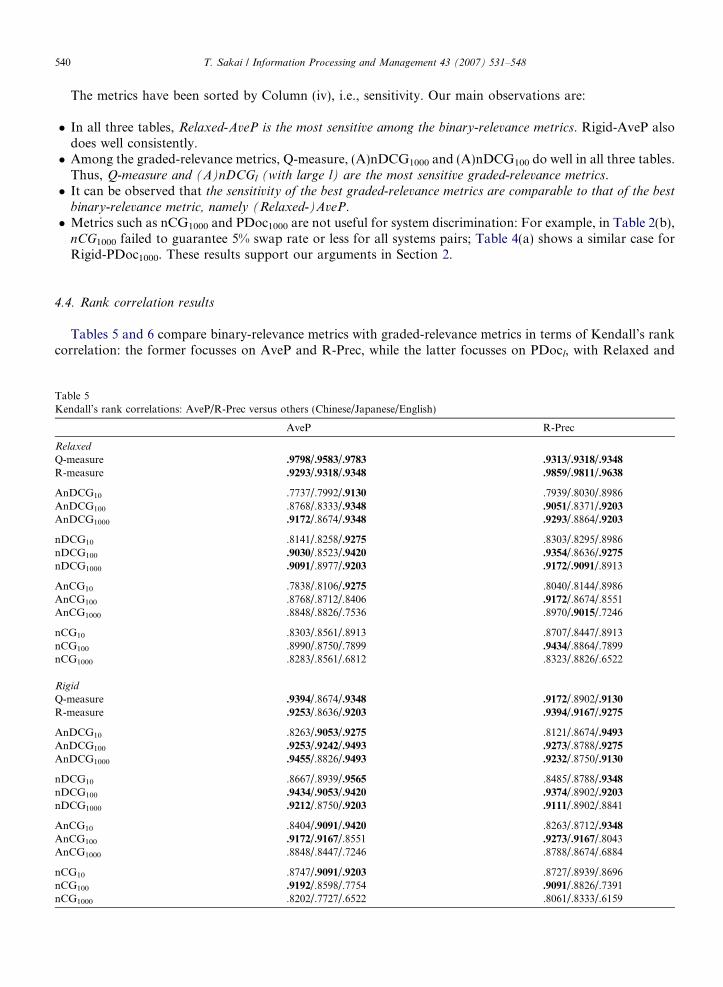
The metrics have been sorted by Column (iv), i.e., sensitivity. Our main observations are:
� In all three tables, Relaxed-AveP is the most sensitive among the binary-relevance metrics. Rigid-AveP alsodoes well consistently.� Among the graded-relevance metrics, Q-measure, (A)nDCG1000 and (A)nDCG100 do well in all three tables.
Thus, Q-measure and (A)nDCGl (with large l) are the most sensitive graded-relevance metrics.� It can be observed that the sensitivity of the best graded-relevance metrics are comparable to that of the best
binary-relevance metric, namely (Relaxed-)AveP.� Metrics such as nCG1000 and PDoc1000 are not useful for system discrimination: For example, in Table 2(b),
nCG1000 failed to guarantee 5% swap rate or less for all systems pairs; Table 4(a) shows a similar case forRigid-PDoc1000. These results support our arguments in Section 2.
4.4. Rank correlation results
Tables 5 and 6 compare binary-relevance metrics with graded-relevance metrics in terms of Kendall’s rankcorrelation: the former focusses on AveP and R-Prec, while the latter focusses on PDocl, with Relaxed and
Table 5Kendall’s rank correlations: AveP/R-Prec versus others (Chinese/Japanese/English)
AveP R-Prec
Relaxed
Q-measure .9798/.9583/.9783 .9313/.9318/.9348
R-measure .9293/.9318/.9348 .9859/.9811/.9638
AnDCG10 .7737/.7992/.9130 .7939/.8030/.8986AnDCG100 .8768/.8333/.9348 .9051/.8371/.9203
AnDCG1000 .9172/.8674/.9348 .9293/.8864/.9203
nDCG10 .8141/.8258/.9275 .8303/.8295/.8986nDCG100 .9030/.8523/.9420 .9354/.8636/.9275
nDCG1000 .9091/.8977/.9203 .9172/.9091/.8913
AnCG10 .7838/.8106/.9275 .8040/.8144/.8986AnCG100 .8768/.8712/.8406 .9172/.8674/.8551AnCG1000 .8848/.8826/.7536 .8970/.9015/.7246
nCG10 .8303/.8561/.8913 .8707/.8447/.8913nCG100 .8990/.8750/.7899 .9434/.8864/.7899nCG1000 .8283/.8561/.6812 .8323/.8826/.6522
Rigid
Q-measure .9394/.8674/.9348 .9172/.8902/.9130
R-measure .9253/.8636/.9203 .9394/.9167/.9275
AnDCG10 .8263/.9053/.9275 .8121/.8674/.9493
AnDCG100 .9253/.9242/.9493 .9273/.8788/.9275
AnDCG1000 .9455/.8826/.9493 .9232/.8750/.9130
nDCG10 .8667/.8939/.9565 .8485/.8788/.9348
nDCG100 .9434/.9053/.9420 .9374/.8902/.9203
nDCG1000 .9212/.8750/.9203 .9111/.8902/.8841
AnCG10 .8404/.9091/.9420 .8263/.8712/.9348
AnCG100 .9172/.9167/.8551 .9273/.9167/.8043AnCG1000 .8848/.8447/.7246 .8788/.8674/.6884
nCG10 .8747/.9091/.9203 .8727/.8939/.8696nCG100 .9192/.8598/.7754 .9091/.8826/.7391nCG1000 .8202/.7727/.6522 .8061/.8333/.6159

Table 6Kendall’s rank correlations: PDocl versus others (Chinese/Japanese/English)
PDoc10 PDoc100 PDoc1000
Relaxed
Q-measure .8525/.8674/.8116 .9091/.8636/.6522 .8424/.8598/.6159R-measure .8747/.8788/.7826 .8949/.8523/.5942 .8404/.8030/.5725
AnDCG10 .8485/.8977/.8478 .7313/.8939/.5580 .6848/.7235/.5072AnDCG100 .9232/.9318/.8551 .8384/.9205/.5797 .7758/.7500/.5435AnDCG1000 .9111/.9583/.8406 .8586/.9091/.5942 .8242/.8144/.5870
nDCG10 .9010/.9242/.8623 .7636/.9205/.5725 .7253/.7424/.5217nDCG100 .9172/.9508/.8478 .8606/.9394/.5870 .8061/.7765/.5652nDCG1000 .8949/.9356/.8406 .8545/.8939/.5797 .8444/.8447/.5870
AnCG10 .8707/.9091/.8623 .7455/.9053/.5725 .7030/.7273/.5217AnCG100 .9071/.9394/.8478 .8626/.9053/.6304 .8040/.7955/.6087AnCG1000 .8545/.9129/.6739 .8626/.8712/.7754 .8889/.8371/.8116
nCG10 .9495/.9545/.8986 .8081/.9053/.5797 .7616/.7727/.5435nCG100 .8768/.9205/.7826 .8848/.8939/.7101 .8384/.8068/.7029nCG1000 .7859/.8409/.6014 .8141/.7917/.8188 .9010/.8333/.8261
Rigid
Q-measure .8222/.8220/.8333 .8667/.8561/.6014 .8364/.8598/.5580R-measure .8566/.8258/.8188 .8889/.8447/.5475 .8384/.8106/.5000
AnDCG10 .8828/.9356/.8841 .7414/.9091/.5072 .6909/.7538/.4638AnDCG100 .9172/.9545/.8913 .8485/.9280/.5290 .7818/.7652/.5000AnDCG1000 .8929/.8826/.8768 .8646/.9091/.5435 .8303/.8220/.5145
nDCG10 .9232/.9318/.9130 .7778/.8977/.5217 .7313/.7727/.4783nDCG100 .8990/.9205/.8841 .8667/.9318/.5362 .8081/.7917/.5072nDCG1000 .8727/.8523/.8768 .8566/.8939/.5290 .8465/.8523/.5145
AnCG10 .8970/.9470/.9130 .7596/.9129/.5217 .7091/.7576/.4783AnCG100 .9091/.9015/.8841 .8687/.8977/.5797 .8141/.8030/.5217AnCG1000 .8323/.8371/.6812 .8687/.8712/.7246 .8909/.8447/.6957
nCG10 .9636/.9242/.9348 .8141/.8977/.5290 .7677/.7879/.4855nCG100 .8586/.8523/.7899 .8949/.8788/.6594 .8404/.8295/.6014nCG1000 .7717/.7652/.6232 .8202/.7992/.7681 .8828/.8561/.7681
T. Sakai / Information Processing and Management 43 (2007) 531–548 541
Rigid relevance data. We have arranged the tables to highlight the trends that are consistent across our threedata sets. For example, Table 5 shows that the correlation between Relaxed-AveP and Q-measure is .9798 forthe Chinese data, .9583 for the Japanese data and .9783 for the English data. While it is clear that all the cor-relation values are statistically highly significant (see Section 3), we indicate values higher than 0.9 just for con-venience (Voorhees, 2001). Our main findings from these two tables are:
� Q-measure is more highly correlated with Relaxed-AveP than any other metric. It is also consistently highlycorrelated with Relaxed-R-Prec.� R-measure is more highly correlated with Relaxed-R-Prec than any other metric. It is also consistently highly
correlated with Relaxed-AveP and with Rigid-R-Prec.
Tables 7–11 compare pairs of graded-relevance metrics in terms of Kendall’s rank correlation. Again, allcorrelation values are statistically highly significant, but we indicate values higher than 0.9 in bold. Our mainfindings from these five tables are:
� Q-measure, R-measure and nDCG1000 are consistently highly correlated with one another. Q-measure is alsoconsistently highly correlated with AnDCG1000 (Table 7).
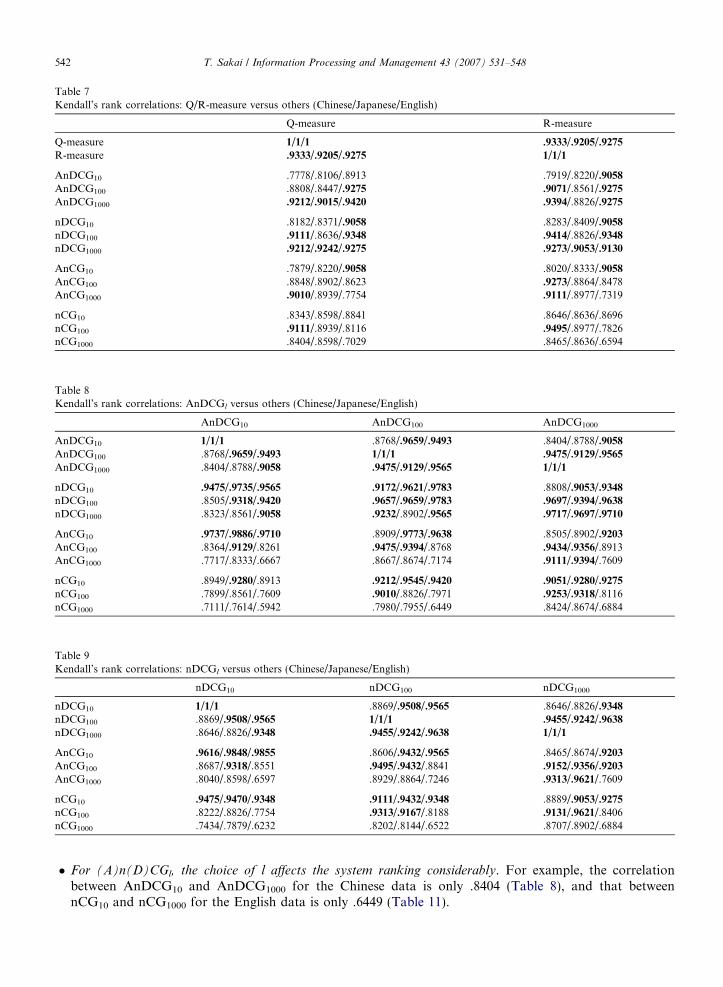
Table 7Kendall’s rank correlations: Q/R-measure versus others (Chinese/Japanese/English)
Q-measure R-measure
Q-measure 1/1/1 .9333/.9205/.9275
R-measure .9333/.9205/.9275 1/1/1
AnDCG10 .7778/.8106/.8913 .7919/.8220/.9058
AnDCG100 .8808/.8447/.9275 .9071/.8561/.9275
AnDCG1000 .9212/.9015/.9420 .9394/.8826/.9275
nDCG10 .8182/.8371/.9058 .8283/.8409/.9058
nDCG100 .9111/.8636/.9348 .9414/.8826/.9348
nDCG1000 .9212/.9242/.9275 .9273/.9053/.9130
AnCG10 .7879/.8220/.9058 .8020/.8333/.9058
AnCG100 .8848/.8902/.8623 .9273/.8864/.8478AnCG1000 .9010/.8939/.7754 .9111/.8977/.7319
nCG10 .8343/.8598/.8841 .8646/.8636/.8696nCG100 .9111/.8939/.8116 .9495/.8977/.7826nCG1000 .8404/.8598/.7029 .8465/.8636/.6594
Table 8Kendall’s rank correlations: AnDCGl versus others (Chinese/Japanese/English)
AnDCG10 AnDCG100 AnDCG1000
AnDCG10 1/1/1 .8768/.9659/.9493 .8404/.8788/.9058
AnDCG100 .8768/.9659/.9493 1/1/1 .9475/.9129/.9565
AnDCG1000 .8404/.8788/.9058 .9475/.9129/.9565 1/1/1
nDCG10 .9475/.9735/.9565 .9172/.9621/.9783 .8808/.9053/.9348
nDCG100 .8505/.9318/.9420 .9657/.9659/.9783 .9697/.9394/.9638
nDCG1000 .8323/.8561/.9058 .9232/.8902/.9565 .9717/.9697/.9710
AnCG10 .9737/.9886/.9710 .8909/.9773/.9638 .8505/.8902/.9203
AnCG100 .8364/.9129/.8261 .9475/.9394/.8768 .9434/.9356/.8913AnCG1000 .7717/.8333/.6667 .8667/.8674/.7174 .9111/.9394/.7609
nCG10 .8949/.9280/.8913 .9212/.9545/.9420 .9051/.9280/.9275
nCG100 .7899/.8561/.7609 .9010/.8826/.7971 .9253/.9318/.8116nCG1000 .7111/.7614/.5942 .7980/.7955/.6449 .8424/.8674/.6884
Table 9Kendall’s rank correlations: nDCGl versus others (Chinese/Japanese/English)
nDCG10 nDCG100 nDCG1000
nDCG10 1/1/1 .8869/.9508/.9565 .8646/.8826/.9348
nDCG100 .8869/.9508/.9565 1/1/1 .9455/.9242/.9638
nDCG1000 .8646/.8826/.9348 .9455/.9242/.9638 1/1/1
AnCG10 .9616/.9848/.9855 .8606/.9432/.9565 .8465/.8674/.9203
AnCG100 .8687/.9318/.8551 .9495/.9432/.8841 .9152/.9356/.9203
AnCG1000 .8040/.8598/.6597 .8929/.8864/.7246 .9313/.9621/.7609
nCG10 .9475/.9470/.9348 .9111/.9432/.9348 .8889/.9053/.9275
nCG100 .8222/.8826/.7754 .9313/.9167/.8188 .9131/.9621/.8406nCG1000 .7434/.7879/.6232 .8202/.8144/.6522 .8707/.8902/.6884
542 T. Sakai / Information Processing and Management 43 (2007) 531–548
� For (A)n(D)CGl, the choice of l affects the system ranking considerably. For example, the correlationbetween AnDCG10 and AnDCG1000 for the Chinese data is only .8404 (Table 8), and that betweennCG10 and nCG1000 for the English data is only .6449 (Table 11).
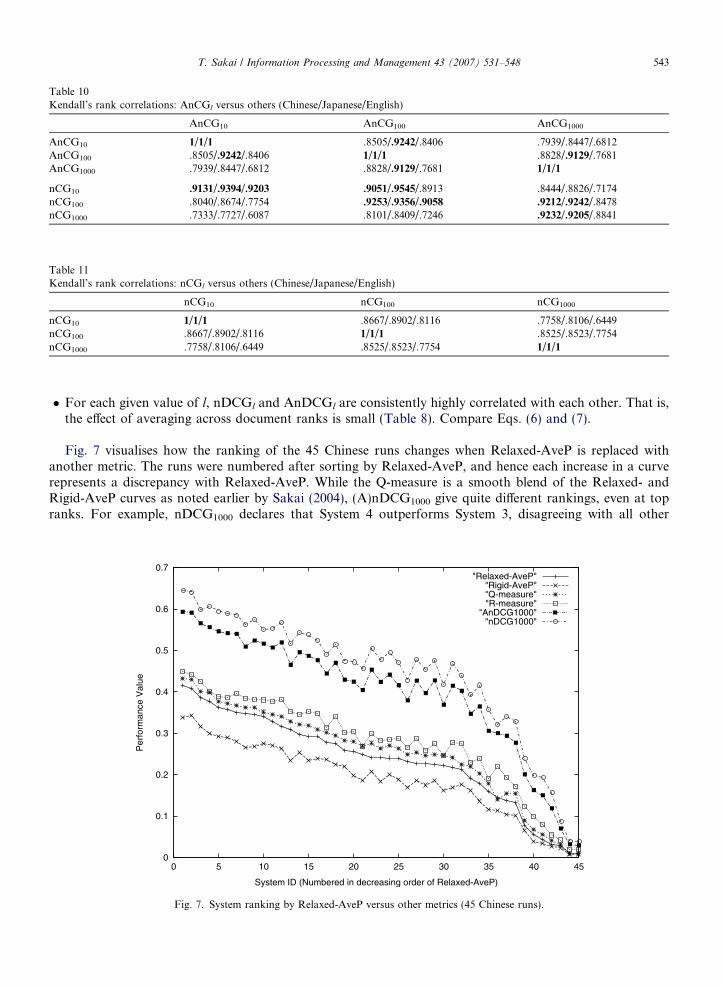
Table 10Kendall’s rank correlations: AnCGl versus others (Chinese/Japanese/English)
AnCG10 AnCG100 AnCG1000
AnCG10 1/1/1 .8505/.9242/.8406 .7939/.8447/.6812AnCG100 .8505/.9242/.8406 1/1/1 .8828/.9129/.7681AnCG1000 .7939/.8447/.6812 .8828/.9129/.7681 1/1/1
nCG10 .9131/.9394/.9203 .9051/.9545/.8913 .8444/.8826/.7174nCG100 .8040/.8674/.7754 .9253/.9356/.9058 .9212/.9242/.8478nCG1000 .7333/.7727/.6087 .8101/.8409/.7246 .9232/.9205/.8841
Table 11Kendall’s rank correlations: nCGl versus others (Chinese/Japanese/English)
nCG10 nCG100 nCG1000
nCG10 1/1/1 .8667/.8902/.8116 .7758/.8106/.6449nCG100 .8667/.8902/.8116 1/1/1 .8525/.8523/.7754nCG1000 .7758/.8106/.6449 .8525/.8523/.7754 1/1/1
T. Sakai / Information Processing and Management 43 (2007) 531–548 543
� For each given value of l, nDCGl and AnDCGl are consistently highly correlated with each other. That is,the effect of averaging across document ranks is small (Table 8). Compare Eqs. (6) and (7).
Fig. 7 visualises how the ranking of the 45 Chinese runs changes when Relaxed-AveP is replaced withanother metric. The runs were numbered after sorting by Relaxed-AveP, and hence each increase in a curverepresents a discrepancy with Relaxed-AveP. While the Q-measure is a smooth blend of the Relaxed- andRigid-AveP curves as noted earlier by Sakai (2004), (A)nDCG1000 give quite different rankings, even at topranks. For example, nDCG1000 declares that System 4 outperforms System 3, disagreeing with all other
0
0.1
0.2
0.3
0.4
0.5
0.6
0.7
0 5 10 15 20 25 30 35 40 45
Per
form
ance
Val
ue
System ID (Numbered in decreasing order of Relaxed-AveP)
"Relaxed-AveP""Rigid-AveP""Q-measure""R-measure"
"AnDCG1000""nDCG1000"
Fig. 7. System ranking by Relaxed-AveP versus other metrics (45 Chinese runs).

544 T. Sakai / Information Processing and Management 43 (2007) 531–548
metrics in this figure. This reflects the fact that (A)nDCG1000 are rank-based while AveP and Q-measure arerecall-based.
4.5. Changing gain values
The previous sections used the default gain values, namely, gain(S) = 3, gain(A) = 2 and gain(B) = 1, buthow to pre-determine the gain values appropriately for IR evaluation is currently an open question. Therefore,this section examines the effect of using different gain values with the graded-relevance metrics, using theChinese data set which is probably the most reliable. The ‘‘flat’’ gain value assignment uses gain(S) = gai-
n(A) = gain(B) = 1, i.e., binary relevance. The ‘‘steep’’ assignment uses gain(S) = 10, gain(A) = 5, gain(B) = 1,thereby emphasising the relevance levels. The third option, which we call ‘‘adjusted’’, uses the per-topic gainvalue adjustment proposed by Sakai (2003): Starting with the default assignment, the gain values are automat-ically modified for each topic according to the proportion of X-relevant documents in the entire set of relevantdocuments. Further details can be found in (Sakai, 2003, 2005b).
Figs. 8 and 9 show the MR-PT curves for Q-measure and nDCG1000 with default, flat, steep and adjustedgain values, respectively, where, for example, Q-measure with flat gain value assignment is denoted by‘‘Q_1:1:1’’. It can be observed that ‘‘flattening’’ the gains slightly hurts stability, but otherwise the alternativegain value assignments do not affect it significantly.
Table 12 shows the sensivitity of graded-relevance metrics with different gain value assignments at swap rate65%. The ‘‘default’’ column has been duplicated from Table 2(b). Values higher than 20% are shown in boldfor convenience. The table shows that Q-measure and AnDCG1000 are very sensitive regardless of the gainvalue assignment.
Table 13 compares the system rankings according to the flat, steep and adjusted gain value assignmentswith the default assignment for each graded-relevance metric in terms of Kendall’s rank correlation. It canbe observed that Q-measure, R-measure and (A)n(D)CG1000 are robust to the choice of gain values in termsof system ranking.
All of the above results suggest that the effect of a particular choice of gain values on system comparisons isin fact small.
0
5
10
15
20
0 5 10 15 20
min
ority
rat
e
proportion of ties
"Q-measure""Q_1:1:1"
"Q_10:5:1""Q_adjusted"
Fig. 8. MR-PT curves for Q-measure with different gain value assignments (30 Chinese runs; c = 20).

0
5
10
15
20
0 5 10 15 20
min
ority
rat
e
proportion of ties
"nDCG1000""nDCG1000_1:1:1"
"nDCG1000_10:5:1""nDCG1000_adjusted"
Fig. 9. MR-PT curves for nDCG1000 with different gain value assignments (30 Chinese runs; c = 20).
Table 12Sensitivity at swap rate 65% for different gain value assignments (30 Chinese runs; c = 20)
Default (3:2:1) Flat (1:1:1) Steep (10:5:1) Adjusted
Q-measure 25% 21% 23% 25%
R-measure 22% 21% 19% 22%
AnDCG10 11% – 7.7% 10%AnDCG100 20% 21% 18% 19%AnDCG1000 21% 20% 20% 21%
nDCG10 16% 12% 17% 19%nDCG100 18% 18% 17% 18%nDCG1000 20% 19% 19% 20%
AnCG10 13% 12% 14% 15%AnCG100 16% 18% 16% 16%AnCG1000 10% 12% 17% 16%
nCG10 17% 15% 14% 16%nCG100 11% 9.4% 15% 14%nCG1000 – – – –
T. Sakai / Information Processing and Management 43 (2007) 531–548 545
To sum up, our main findings on graded-relevance metrics are:
� According to the stability and the swap methods, Q-measure and (A)nDCGl (with large l) are the winners.These metrics are at least as stable and sensitive as AveP.� Q-measure is more highly correlated with AveP than any other metric. Q-measure, R-measure, (A)nDCGl
(with large l) are highly correlated with one another.� The above best graded-relevance metrics are fairly robust to the choice of gain values, in terms of stability,
sensitivity and rank correlation.

Table 13Kendall’s rank correlations with default metrics (45 Chinese runs)
Flat (1:1:1) Steep (10:5:1) Adjusted
Q-measure .9778 .9758 .9939
R-measure .9879 .9717 .9919
AnDCG10 .9354 .9596 .9697
AnDCG100 .8889 .9798 .9838
AnDCG1000 .9697 .9778 .9818
nDCG10 .9455 .9737 .9838
nDCG100 .9131 .9798 .9838
nDCG1000 .9677 .9737 .9758
AnCG10 .9414 .9616 .9758
AnCG100 .8646 .9818 .9899
AnCG1000 .9798 .9859 .9859
nCG10 .9636 .9596 .9737
nCG100 .8747 .9758 .9737
nCG1000 .9798 .9737 .9798
546 T. Sakai / Information Processing and Management 43 (2007) 531–548
4.6. Correlation with significance tests
The stability and the swap methods that we have used are based entirely on the mean over a given topic set,and never actually examine per-topic values of the metrics. Thus, these methods are not directly related to tra-ditional statistical signifinicance tests. The final question we address in this paper is: How are these methodsrelated to significance testing?
We address the above question as follows. A two-tailed sign test was conducted for each of the 435 pairs ofour Chinese runs, and the run pairs were sorted by the p-value. We chose the sign test as it is free from thenormality and symmetry assumptions (Hull, 1993). Then, we created two more sorted lists of the 435 pairs,one sorted based on the minority rate computation and the other sorted based on the swap rate computation.(More details can be found in Sakai (2005b).) Thus, the first list represents the confidence ranking in terms of asignificance test, which uses the entire topic set Q and counts the number of topics with which System x out-performed System y and vice versa. The second lists represents the confidence ranking in terms of the stabilitymethod, which uses 1000 topic subsets for comparing x and y. The third list represents that in terms of theswap method, which uses 1000 disjoint pairs of topic subsets, i.e., 2000 subsets. These ranked lists of run pairs
can also be compared using Kendall’s rank correlation. Since we have as many as 435 run pairs, the rank cor-relation is statistically significant at a = 0.01 if it is over 0.09 (two-tailed test).
Table 14 shows the Kendall’s rank correlations among the sign test, the stability and the swap methods forRelaxed-AveP, Q-measure and nDCG1000. Clearly, all the correlation values are statistically highly significant.However, while the correlations between the stability and the swap methods are moderately high, thosebetween the sign test and the other two methods are not as high. Moreover, the correlations between the signtest and the stability method are lower than those between the sign test and the swap method. It appears thatthe stability and the swap methods themselves require further studies (Sakai, 2005a, 2006a; Sanderson &Zobel, 2005).
Table 14Kendall’s rank correlations for the ranking of run pairs (435 Chinese run pairs)
Relaxed-AveP Q-measure nDCG1000
(a) Sign test versus stability .5178 .5043 .4283(b) Sign test versus swap .5927 .6031 .5636(c) Stability versus swap .8169 .7859 .6918
T. Sakai / Information Processing and Management 43 (2007) 531–548 547
5. Related work
Sakai (2006c, 2006b) conducted experiments similar to the ones reported in this paper, but focussed on IRmetrics for the task of retrieving one (highly) relevant document only, as opposed to the traditional task offinding as many relevant documents as possible. Other studies that used the stability and the swap method(e.g., Buckley & Voorhees, 2004; Voorhees, 2005) considered binary IR metrics only. As was mentioned in Sec-tion 3, Sanderson and Zobel (2005) and Sakai (2005a) explored a few variations of the swap method.
More recently, Sakai (2006a) proposed a method for comparing the sensitivity of IR metrics based on Boot-strap Hypothesis Tests. Unlike the swap method, the new method has a theoretical foundation, and is directlyrelated to significance testing. However, he also showed that the Bootstrap-based method and the swapmethod generally yield similar results.
Kekalainen (2005) investigated the rank correlations among (n)(D)CGl and PDocl using TREC data withtheir own graded relevance assessments. Sakai (2004) investigated the rank correlations among AveP, R-Prec,Q-measure and R-measure using NTCIR data. This paper extends these studies in that (a) It covers more met-rics. (b) It examines the stability and sensitivity of metrics in addition to resemblance among metrics.
Vu and Gallinari (2005) generalised AveP for handling graded relevance and compared it with Q-measurein the context of an INEX XML retrieval task, but, as they are well aware, their metric does not average well.Moreover, their metric cannot control how severely late arrival of a relevant document should be penalised:(A)nDCGl control it with the logarithm base, while Q-measure controls it by setting large or small gain valuesSakai (2004). Vu and Gallinari (2005) did not use the stability and the swap methods.
Della Mea and Mizzaro (2004) proposed the Average Distance Measure (ADM) for evaluation with con-
tinuous relevance as opposed to graded relevance. However, we argue that ADM is not suitable for traditionaldocument ranking tasks, as it simply accumulates the absolute differences between User Relevance Scores(URSs) and System Relevance Scores (SRSs). For example, suppose that the URSs for documents A, Band C are 0.3, 0.2 and 0.1 for a topic, and the SRSs for these documents are 0.5, 0.4 and 0.2 acccording toSystem x, and 0.1, 0.2 and 0.3 according to System y. In terms of document ranking, Systems x is perfect,while System y is not. However, in terms of ADM, System y (sum of differences: 0.2 + 0 + 0.2 = 0.4) outper-forms System x (sum of differences: 0.2 + 0.2 + 0.1 = 0.5).
6. Conclusions
This paper compared 14 metrics designed for IR evaluation with graded relevance, together with 10 tradi-tional metrics based on binary relevance, in terms of stability, sensitivity and resemblance of system rankingsusing three different data sets from NTCIR. Our results suggest that AnDCGl and nDCGl are the best amongthe rank-based graded-relevance metrics, provided that l is large. On the other hand, if one requires a recall-
based graded-relevance metric that is highly correlated with Average Precision, then Q-measure is the bestchoice. These best graded-relevance metrics are at least as stable and sensitive as Average Precision, andare fairly robust to the choice of gain values. However, it should be remembered that nDCGl inherits the prob-lem of nCGl if a large logarithm base is used.
Some may say, ‘‘If graded-relevance metrics are very highly correlated with Average Precision, then just useAverage Precision.’’ but it is possible that graded-relevance metrics are currently very highly correlated withAveP because reseachers keep evaluating their systems using binary relevance. If researchers really start usinggraded-relevance metrics, this enables them to build IR systems that can return highly relevant documents ontop of partially relevant ones. Hence, in the future, the correlation between the best graded-relevance metricsand Average Precision may decline.
References
Buckley, C., & Voorhees, E. M. (2000). Evaluating evaluation measure stability. In Proceedings of the 23rd annual international ACM
SIGIR conference on research and development in information retrieval (SIGIR 2000) (pp. 33–40).Buckley, C., & Voorhees, E. M. (2004). Retrieval evaluation with incomplete information. In Proceedings of the 27th annual international
ACM SIGIR conference on research and development in information retrieval (SIGIR 2004) (pp. 25–32).

548 T. Sakai / Information Processing and Management 43 (2007) 531–548
Chen, K.-H., Chen, H.-H., Kando, N., Kuriyama, K., Lee, S., Myaeng, S.-H., et al. (2003). Overview of CLIR task at the third NTCIRworkshop. In Proceedings of the 3rd NTCIR workshop on research in information retrieval, automatic text summarization and question
answering (NTCIR-3).Della Mea, V., & Mizzaro, S. (2004). Measuring retrieval effectiveness: a new proposal and a first experimental validation. Journal of the
American Society for Information Science and Technology, 55(6), 530–543.Hull, D. (1993). Using statistical testing in the evaluation of retrieval experiments. In Proceedings of the 16th annual international ACM
SIGIR conference on research and development in information retrieval (SIGIR ’93) (pp. 329–338).Jarvelin, K., & Kekalainen, J. (2002). Cumulated gain-based evaluation of IR techniques. ACM Transactions on Information Systems,
20(4), 422–446.Kekalainen, J. (2005). Binary and graded relevance in IR evaluations – comparison of the effects on ranking of IR systems. Information
Processing and Management, 41, 1019–1033.Korfhage, R. R. (1997). Information storage and retrieval. Wiley Computer Publishing.Sakai, T. (2003). Average gain ratio: a simple retrieval performance measure for evaluation with multiple relevance levels. In Proceedings
of the 26th annual international ACM SIGIR conference on research and development in information retrieval (SIGIR 2003) (pp. 417–418).
Sakai, T. (2004). Ranking the NTCIR systems based on multigrade relevance. In Proceedings of Asia information retrieval symposium 2004
(pp. 170–177).Sakai, T. (2005a). The effect of topic sampling on sensitivity comparisons of information retrieval metrics. In Proceedings of the 5th
NTCIR workshop on research in information access technologies (NTCIR-5).Sakai, T. (2005b). The reliability of metrics based on graded relevance. In Proceedings of Asia information retrieval symposium 2005.
Lecture notes in computer science: Vol. 3689 (pp. 1–16).Sakai, T. (2006a). Evaluating evaluation metrics based on the bootstrap. In Proceedings of the 29th annual international ACM SIGIR
conference on research and development in information retrieval (SIGIR 2006).Sakai, T. (2006b). Give me just one highly relevant document: P-measure. In Proceedings of the 29th annual international ACM SIGIR
conference on research and development in information retrieval (SIGIR 2006).Sakai, T. (2006c). On the task of finding one highly relevant document with high precision. Information Processing Society of Japan
Transactions on Databases 47 SIG4 (TOD29), 13–27.Sanderson, M., & Zobel, J. (2005). Information retrieval system evaluation: effort, sensitivity, and reliability. In Proceedings of the 28th
annual international ACM SIGIR conference on research and development in information retrieval (SIGIR 2005) (pp. 162–169).Voorhees, E. M., & Buckley, C. (2002). The effect of topic set size on retrieval experiment error. In Proceedings of the 25th annual
international ACM SIGIR conference on research and development in information retrieval (SIGIR 2002) (pp. 316–323).Voorhees, E. M. (2001). Evaluation by highly relevant documents. In Proceedings of the 24th annual international ACM SIGIR conference
on research and development in information retrieval (SIGIR 2001) (pp. 74–82).Voorhees, E. M. (2005). Overview of the TREC 2004 robust retrieval track. In Proceedings of the 13th text retrieval conference (TREC
2004).Vu, H.-T., & Gallinari, P. (2005). On effectiveness measures and relevance functions in ranking INEX systems. In Proceedings of Asia
information retrieval symposium 2005. Lecture notes in computer science: Vol. 3689 (pp. 312–327).