on the role of local blockchain network features in
TRANSCRIPT

The Canadian Journal of Statistics 561Vol. 48, No. 3, 2020, Pages 561–581La revue canadienne de statistique
On the role of local blockchain networkfeatures in cryptocurrency price formationAsim K. DEY1, Cuneyt G. AKCORA2, Yulia R. GEL1* , and Murat KANTARCIOGLU2
1Department of Mathematical Sciences, The University of Texas at Dallas, Dallas, TX, U.S.A.2Department of Computer Science, The University of Texas at Dallas, Dallas, TX, U.S.A.
Key words and phrases: Bitcoin; blockchain; complex networks; Litecoin; network motifs; time seriesand forecasting.
MSC 2010: Primary 62-09, 62M20; secondary 62P05, 62P20.
Abstract: Cryptocurrencies and the underpinning blockchain technology have gained unprecedentedpublic attention recently. In contrast to fiat currencies, transactions of cryptocurrencies, such as Bitcoinand Litecoin, are permanently recorded on distributed ledgers to be seen by the public. As a result,public availability of all cryptocurrency transactions allows us to create a complex network of financialinteractions that can be used to study not only the blockchain graph, but also the relationship betweenvarious blockchain network features and cryptocurrency risk investment. We introduce a novel concept ofchainlets, or blockchain motifs, to utilize this information. Chainlets allow us to evaluate the role of localtopological structure of the blockchain on the joint Bitcoin and Litecoin price formation and dynamics.We investigate the predictive Granger causality of chainlets and identify certain types of chainlets thatexhibit the highest predictive influence on cryptocurrency price and investment risk. More generally, whilestatistical aspects of blockchain data analytics remain virtually unexplored, the paper aims to highlightvarious emerging theoretical, methodological and applied research challenges of blockchain data analysisthat will be of interest to the broad statistical community. The Canadian Journal of Statistics 48: 561–581;2020 © 2020 Statistical Society of CanadaRésumé: Les cryptomonnaies et la technologie sous-jacente de chaınes de blocs ont récemment retenul’attention publique. Contrairement aux monnaies fiduciaires, les transactions de cryptomonnaie telles quele Bitcoin et le Litecoin sont enregistrées à perpétuité dans un grand livre distribué visible publiquement.Les auteurs profitent de cette visibilité publique afin de construire un réseau complexe des interactionsfinancières qui permet d’étudier le graphe des chaınes de blocs, mais également la relation entre plusieurscaractéristiques des réseaux de chaınes de blocs et les risques d’investissements en cryptomonnaie. Ilsproposent le concept novateur de chaınettes, ou motifs de chaınes de blocs, afin d’exploiter cette information.Ils utilisent les chaınettes afin d’évaluer la topologie locale des structures de chaınes de blocs sur la formationdes prix de Bitcoin et de Litecoin et leur dynamique. Ils étudient la causalité de Granger des chaınettespour la prévision et identifient certains types de chaınettes qui exhibent la plus forte influence prédictivesur le prix des cryptomonnaies et leur risque. De façon générale, même si de nombreux aspects de ce typede données demeurent inexplorés, les auteurs mettent en lumière divers défis théoriques, méthodologiqueset appliqués de l’analyse de données de chaınes de blocs qui sauront éveiller l’intérêt de la communautéstatistique. La revue canadienne de statistique 48: 561–581; 2020 © 2020 Société statistique du Canada
* Author to whom correspondence may be addressed.E-mail: [email protected]
© 2020 Statistical Society of Canada / Société statistique du Canada

562 DEY, AKCORA, GEL AND KANTARCIOGLU Vol. 48, No. 3
1. INTRODUCTION
Starting with Bitcoin in 2009 (Nakamoto, 2008), cryptocurrencies have seen tremendous interestand have achieved skyrocketing adoption over the last couple of years. The Bitcoin phenomenonis due not only to revolutionizing online payments but also to a high number of applicationsthe underlying blockchain technology has witnessed in various domains (Nakamoto, 2008;Tschorsch & Scheuermann, 2016).
In the last few years an increasing number of studies have been undertaken to evaluatedifferent statistical, machine learning and econometric approaches to modelling and forecastingprice and volatility of cryptocurrencies. However, most such studies appear either in econometricor in machine learning communities, and analysis of blockchain data and cryptocurrencies, inparticular, remain virtually unexplored in statistical literature. Among such recent econometricresults, Chu et al. (2015), Chan et al. (2017) and Luo et al. (2019) assess distributions oflog returns of different cryptocurrencies and their exchange rates in terms of goodness-of-fitcriteria, e.g., log-likelihood, information criteria and quantile plots. Hotz-Behofsits, Huber &Zörner (2018) use a sparse non-Gaussian state space model to predict different cryptocurrencies.In turn, Ciaian, Rajcaniova & Ancs (2016), Jang & Lee (2018) and Sovbetov (2018) studythe relationship between cryptocurrency price formation and traditional determinants such assupply, demand, exchange rates between major fiat currencies, S&P 500 and crude oil prices,as well more specific blockchain information, e.g., average block size, number of transactions,the number of unique coin addresses and the median time for each transaction to be accepted.Akcora et al. (2017) proposed a novel concept of chainlets, or blockchain motifs, and showedpredictive utility of chainlets in Bitcoin price dynamics; while in Akcora et al. (2018) and Abayet al. (2019), the authors focused on qualitative economic implications of Bitcoin chainlets andcomputationally efficient chainlet modelling strategies.
Furthermore, Moore & Christin (2013) evaluate risks related to Bitcoin exchanges using Coxproportional hazards model (Cox, 1972) considering different variables that may affect survivaltime of Bitcoin exchange. Volatility analysis of cryptocurrencies is addressed by Blau (2017),Cermak (2017), Chu et al. (2017), Dyhrberg (2016) and Katsiampa (2017) using generalizedautoregressive conditional heteroskedasticity (GARCH) family of models. Estrada (2017) studiescausality of different financial market measures, such as, the S&P 500 and the S&P 500 volatilityindex (VIX), on the realized variance of Bitcoin price. However, neither of these approachesemploys finer-grained local information on blockchain graph structure and associated cryptotransaction networks, availability of which constitutes a unique feature of cryptocurrencies.Glenski, Weninger & Volkova (2019) evaluate the prediction of cryptocurrency price usingsocial signals from social media platforms. Chen et al. (2019) assess the use of machinelearning and deep learning technologies in blockchain analysis, while Kurbucz (2019) employssingle-hidden layer feedforward neural networks to investigate the impact of the transactionnetwork’s most frequent edges on the future price of Bitcoin.
Indeed, one of the key aspects behind cryptocurrencies is that a distributed ledger (i.e.,blockchain) is maintained by all the participants to verify the authenticity of each transaction.Since we observe the graph of all cryptocurrency transactions, a natural question to ask iswhether the local graph structure impacts the price of an asset (e.g., Bitcoin and Litecoin). Inother domains, local higher-order structures of complex networks, or multiple-node subgraphs,are found to be an indispensable tool for analysis of network organization beyond the trivial scaleof individual vertices and edges. The role of small subgraphs, or network motifs and graphlets,in organization of complex systems has been first discussed in conjunction with the assessmentof stability and robustness of biological networks (Milo et al., 2002), and later have been studiedin a variety of contexts, from social networks to power grids (for overviews see Ahmed etal., 2016; Dey, Gel & Poor, 2017, 2019 Islambekov et al., 2018; Gorochowski, Grierson & diBernardo 2018, and references therein). Most recently, network motifs are shown to provide
The Canadian Journal of Statistics / La revue canadienne de statistique DOI: 10.1002/cjs

2020 LOCAL NETWORK FEATURES IN CRYPTOCURRENCY PRICE ANALYSIS 563
an invaluable insight into analysis of functionality and early warning stability indicators infinancial networks (Jiang, Chen & Zheng, 2014). However, compared to biological networks,motif-induced inference in financial systems is still an emerging field, while the analysis ofmotifs in cryptocurrency applications is yet in early infancy.
In this article, we introduce and formalize the notion of chainlet motifs to understand theimpact of local topological structures of cryptocurrency transaction network on their pricedynamics. We compare our techniques to the state-of-the-art time series analysis approachesand show that employing chainlets leads to more competitive price prediction mechanisms. Wealso define the concept of inter-coin causality of chainlets. That is, chainlet information in onecoin network can exhibit causality on the price of another coin. We empirically show that theoccurrence and amount of coin transfer by a particular chainlet in one cryptocurrency (e.g.,Bitcoin) can be used for better price prediction of other cryptocurrency (e.g., Litecoin).
Though the analysis and modelling blockchain and cryptocurrencies have witnessed animmense recent interest in economics, finance and machine learning communities, there existvirtually no statistical studies of blockchain data. Hence, the goal of this paper is twofold. First, tothe best of our knowledge, this is the first article to introduce chainlets into statistical analysis ofLitecoin and most importantly to study the joint interaction of Litecoin and Bitcoin chainlets andtheir impact on cryptocurrency prices and volatility. Second, in broader impact terms, the articleaims to highlight various emerging theoretical, methodological and applied research challengesof blockchain data analytics and cryptocurrencies, in particular, that will be of interest to thebroad statistical community.
The remainder of this paper is organized as follows. In Section 2, we define a graph modelbased on blockchains and introduce a notion of chainlets using a generalized heterogeneousgraph model. Section 3 is devoted to evaluation of the utility of chainlets for price andvolatility forecasting, and compares chainlet-based models with existing competing approaches.In Section 4, we conclude with the summary and future research directions. Finally, in theAppendix we provide a brief introduction to the blockchain data collection process and thestructure behind the blockchain data.
2. MODELLING BLOCKCHAIN WITH COMPLEX NETWORKS
In this section we provide background information on blockchain data, the proposed modellingapproaches in a form of complex networks and associated statistical and econometric blockchainproperties.
2.1. The Graph Model for UTXO based BlockchainsBlockchains can be categorized into two broad categories: unspent transaction output (UTXO)based (e.g., Bitcoin, Litecoin) and account based (e.g., Ethereum) blockchains. In UTXObased blockchains, an address cannot keep the balance; the remaining coins must be explicitlyforwarded to an address (which may be the same address, or a newly created address). In thispaper, we focus on UTXO based blockchains and we will use the terms Bitcoin and UTXObased cryptocurrency interchangeably. A UTXO based cryptocurrency graph has three maincomponents: addresses, transactions and blocks. A detailed description on UTXO based andaccount based blockchains data is presented in the Appendix.
We model the UTXO graph (e.g., Bitcoin and Litecoin) as the following heterogeneouscomplex network with two node types: addresses and transactions. That is, we consider adirected graph = (V ,E,B) where V is a set of vertices, and E ⊆ V × V is a set of edges.B = {Address,Transaction} represents the set of vertex types. For any vertex u ∈ V , it hasa vertex type 𝜙(u) ∈ B. For each edge eu,v ∈ E between adjacent nodes u and v, we have𝜙(u) ≠ 𝜙(v), and either 𝜙(u) = {Transaction} or 𝜙(v) = {Transaction}. That is, an edge e ∈ E
DOI: 10.1002/cjs The Canadian Journal of Statistics / La revue canadienne de statistique

564 DEY, AKCORA, GEL AND KANTARCIOGLU Vol. 48, No. 3
FIGURE 1: Merge (ℂ2→1), transition (ℂ1→1) and split (ℂ1→2) chainlets.
2010 2012 2014 2016 2018
Year
1
0
Ra
tio
Split
Trans.
Merge
FIGURE 2: Ratio of aggregate chainlets in weeks until 2018 January. Splits constitute around75% of all transactions.
represents a coin transfer between an address node and a transaction node. This heterogeneousgraph model subsumes the homogeneous case (i.e., |B| = 1), where only transaction or addressnodes are used, and edges link vertices of the same type. Here, we focus on the case where eachaddress node is linked (i.e., input or output address of a transaction) via a transaction node toanother address node.
2.2. The k-Chainlet ModelWe introduce the concept of k-chainlets to assess local higher-order topological structure of theblockchain graph. A UTXO subgraph ′ = (V ′,E′,B) is a subgraph of , if V ′ ⊆ V and E′ ⊆ E.If ′ = (V ′,E′,B) is a subgraph of and E′ contains all edges eu,v ∈ E such that (u, v) ∈ V ′,then G′ is called an induced subgraph of G. Two graphs ′ = (V ′,E′,B) and ′′ = (V ′′,E′′,B)are called isomorphic if there exists a bijection h ∶ V ′ → V ′′ such that all node pairs u, v of G′
are adjacent in G′ if and only if u and v are adjacent in G′′. Let k-chainlet k = (Vk,Ek,B) be asubgraph of with k nodes of type {Transaction}. If there exists an isomorphism between kand ′, ′ ∈ , we say that there exists an occurrence, or embedding of k in . If a k occursmore or less frequently than expected by chance, it is called a blockchain k-chainlet. A k-chainletsignature 𝑓(k) is a number of occurrences of k in .
We start by focusing on the 1-chainlet signatures and their properties. For simplicity, werefer to 1-chainlets as chainlets. A natural classification of chainlets can be made in terms ofthe number of inputs x and outputs y since there is only one transaction involved. For a chainlet,we denote ℂx→y if it has x inputs and y outputs. If the branch is merging with other branches,
The Canadian Journal of Statistics / La revue canadienne de statistique DOI: 10.1002/cjs

2020 LOCAL NETWORK FEATURES IN CRYPTOCURRENCY PRICE ANALYSIS 565
the corresponding chainlet will have a higher number of inputs, compared to outputs. We callthese merge chainlets, i.e., ℂx→y such that x > y, which show an aggregation of coins into feweraddresses. Two other classes of chainlets are transition and split chainlets with x = y and x < y,respectively, as shown in Figure 1. In what follows, we refer to these three chainlet types as theaggregate chainlets.
Figure 2 visualizes the percentage of aggregate chainlets in time. For example, the transitionchainlets are those ℂx→x for x ≥ 1. Figure 2 shows that starting as an unknown project, theBitcoin network stabilized only after the middle of 2011. From 2014 and onwards, the splitchainlets continued to steadily rise, compared to merge and transition chainlets.
2.3. Occurrence and Amount Information in ChainletsWe use a matrix representation to model a cryptocurrency network. For a given time granularity,such as one day, we take snapshots of the network and construct a graph. The Bitcoin andLitecoin protocols restrict the numbers of input and output addresses in a transaction by putting alimit on the block size (1 MB), but the number of inputs and outputs can still reach the thousands.As a result, we can have millions of distinct chainlets (e.g., ℂ1900→200, ℂ1901→200 or ℂ1900→201).To select a suitable value for the matrix dimension N, we analyzed the entire history for Bitcoinand Litecoin. We found that 91.38% of Bitcoin and 91.27% of Litecoin chainlets have N of 5 orless (i.e., ℂx→y s.t., x < 5 and y < 5) in average for daily snapshots. This value reaches 98.10%and 96.14% for N of 20, for the respective coins. The highest number of inputs is 20,000 forBitcoin and 821 for Litecoin. The highest number of outputs is 13,107 for Bitcoin and 5,094 forLitecoin. We chose N of 20, since it can distinguish a sufficiently large number (i.e., 400) ofchainlets, and still offers a dense matrix. From the coin network snapshot for a given granularity(e.g., daily), we extract two information for each chainlet type: amount to store volume of cointransfers by using the chainlet and occurrence to store instances (i.e., counts) of the chainlet.
We denote the total amount of coins transferred by a chainlet ℂx→y in a graph snapshotas 𝔸(ℂx→y). Amount of coins transferred by chainlets in the graph snapshot are stored as anN × N-matrix such that for i ≤ N, 𝑗 ≤ N
[i, 𝑗] =
⎧⎪⎪⎪⎨⎪⎪⎪⎩
𝔸(ℂi→𝑗) if i < N and 𝑗 < N,∑∞z=N 𝔸(ℂi→z) if i < N and 𝑗 = N,∑∞y=N 𝔸(ℂy→𝑗) if i = N and 𝑗 < N,∑∞y=N
∑∞z=n 𝔸(ℂy→z) if i = N and 𝑗 = N.
We denote the total number of chainletsℂx→y in a graph snapshot as𝕆(ℂx→y). Chainlet countsobtained from the graph snapshots are stored as an N × N-matrix such that for i ≤ N, 𝑗 ≤ N
[i, 𝑗] =
⎧⎪⎪⎪⎨⎪⎪⎪⎩
𝕆(ℂi→𝑗) if i < N and 𝑗 < N,∑∞z=N 𝕆(ℂi→z) if i < N and 𝑗 = N,∑∞y=N 𝕆(ℂy→𝑗) if i = N and 𝑗 < N,∑∞y=N
∑∞z=N 𝕆(ℂy→z) if i = N and 𝑗 = N.
In occurrence and amount matrices notation, choosing an N value, for example, N = 5, meansthat a chainlet with more than 5 inputs/outputs (i.e., ℂx→y s.t., x ≥ 5 or y ≥ 5) is recorded in the
DOI: 10.1002/cjs The Canadian Journal of Statistics / La revue canadienne de statistique

566 DEY, AKCORA, GEL AND KANTARCIOGLU Vol. 48, No. 3
FIGURE 3: Chainlet clusters with day and week granularities computed from the occurrencematrix of Bitcoin chainlets. A chainlet ℂx→y is the intersection cell of the xth row (i.e., chainlet
has x inputs) and yth column (i.e., chainlet has y outputs).
N-th row or column. That is, we aggregate chainlets with large dimensions that would otherwisefall outside matrix dimensions. In what follows we use the term extreme chainlets to refer tothese aggregated chainlets on the Nth row and column.
2.4. Clustering ChainletsWe hierarchically clustered chainlets by using cosine similarity over Bitcoin chainlet vectors.Chainlet data are sparse in nature and cosine similarity is a appropriate distance measures forsparse data. Cosine similarity of two vectors, x and y is defined as
sim(x, y) = cos 𝜃 =x.y
‖x‖‖y‖ ,where ‖ ‖ is the Euclidean norm, x.y is the dot product of the two vectors. A cosine value of0 implies two vectors have no match (90 degrees to each other). The closer the cosine valueto 1 (0 degrees to each other) means that there is a greater match between the two vectors(Bhattacharyya, 1946; Huang, 2008; Han, Kamber & Pei 2012). We used a similarity cutthreshold of 0.7 to create clusters from the hierarchical dendogram. Figure 3 shows the resultingclusters. Cluster memberships are shown with the same color. A white cell denotes a chainletthat constitutes a cluster of its own. In both Figure 3a and b, higher n values in the right lowcorner are clustered together, and in the daily clusters extreme chainlets (ℂ{x|x>8}→20) have theirown cluster. Some representative chainlets from daily clusters 7, 8, 16 and 35 are ℂ9→11, ℂ3→17,ℂ8→14 and ℂ1→1, respectively. An interesting result is that in both matrices extreme chainletsbelong to the same clusters with some considerably smaller chainlets such as ℂ2→3, ℂ3→3 andℂ2→6. In Section 3.2 we show that their similarity extends to their impact on price predictions.
3. STATISTICAL ASSESSMENT OF CHAINLET PREDICTIVE UTILITY IN LITECOINAND BITCOIN
Armed with the time series of chainlets, we now focus on evaluating the potential impact of localgraph structures on future cryptocurrencies price formation and investment risk. We refer to
The Canadian Journal of Statistics / La revue canadienne de statistique DOI: 10.1002/cjs

2020 LOCAL NETWORK FEATURES IN CRYPTOCURRENCY PRICE ANALYSIS 567
occurrences of chainlet ℂx→y in Bitcoin and Litecoin with 𝕆(ℂBx→y) and 𝕆(ℂL
x→y), respectively.Similarly, amounts of coins transferred by using ℂx→y in Bitcoin and Litecoin are given withwith 𝔸(ℂB
x→y) and 𝔸(ℂLx→y), respectively. We are primarily interested in the following three
interlinked questions:
• Do changes in chainlet characteristics exhibit any causal effect on future cryptocurrency priceand returns?
• Do chainlets convey some unique information about future cryptocurrency prices, given moreconventional economic variables and non-network blockchain characteristics?
• Do chainlet dynamics of one cryptocurrency have influence on price and volatility of othercrpytocurrencies?
3.1. Granger CausalityTo assess the potential predictive role of chainlets in coin price formation, we employ the widelyadopted econometric concept of Granger causality (Granger, 1969). The causality test assesseswhether one time series is useful in predicting another (see an overview in White, Chalak &Lu 2011). In particular, assume Yt, t ∈ Z+ is a p × 1-random vector (e.g., Bitcoin or Litecoinprice) and let t
(Y) = 𝜎{Ys ∶ s = 0, 1,… , t} denote a 𝜎-algebra generated from all observationsof Y in the market up to time t. Consider a sequence of (k + 2)-tuples of random vectors{Yt,Xt,Z
1t ,… ,Zk
t }. For example, in the context of this paper X can be chainlet occurrences andZ1,… ,Zk
t can be number of transactions. Suppose that for all h ∈ Z+
Ft+h(⋅ | t−1
(Y,X,Z1,…,Zk)
)= Ft+h
(⋅ | t−1
(Y,Z1,…,Zk)
), (1)
where Ft+h(⋅| t−1(Y,X,Z1,…,Zk)
) and Ft+h(⋅| t−1(Y,Z1,…,Zk)
) are conditional distributions of Yt+h, given
Yt−1,Xt−1,Z1t−1,… ,Zk
t−1 and Yt−1,Z1t−1,… ,Zk
t−1, respectively. Then, Xt−1 is said not to Grangercause (G-cause) Yt+h with respect to t−1
(Y,Z1,…,Zk). Otherwise, X is said to G-cause Y, which can
be denoted by GX↣Y, where ↣ represents the direction of causality. Hence, G-causality meansthat given information on the past of Y and Z1,… ,Zk, the past of X does not deliver any newinformation that can be used for predicting Yt+h.
In practice G-causality is typically performed by fitting two linear vector autoregressive(VAR) models of finite order d to Y, with and without X, respectively, and then testing forstatistical significance of model coefficients associated with X. Alternatively, we can comparepredictive performance of two models (i.e., with and without X), using an F-test, under the nullhypothesis of no explanatory power in X. For instance, consider a case of univariate time seriesyt, xt and zt. To test G-causality of xt, we compare the fit of the full model
yt = 𝛼0 +d∑
k=1
𝛼kyt−k +d∑
k=1
𝛽kxt−k +d∑
k=1
𝛾kzt−k + et, (2)
versus the fit of the reduced model
yt = 𝛼0 +d∑
k=1
𝛼kyt−k +d∑
k=1
𝛽kxt−k + et. (3)
That is, under the null hypothesis of no predictive effect in x onto y (i.e., x does not G-cause y),Var(et) = Var(et). If Var(et) is (statistically) significantly lower than Var(et), then we concludethat x contains additional information that can improve forecasting of y, i.e., Gx↣y.
DOI: 10.1002/cjs The Canadian Journal of Statistics / La revue canadienne de statistique
568 DEY, AKCORA, GEL AND KANTARCIOGLU Vol. 48, No. 3
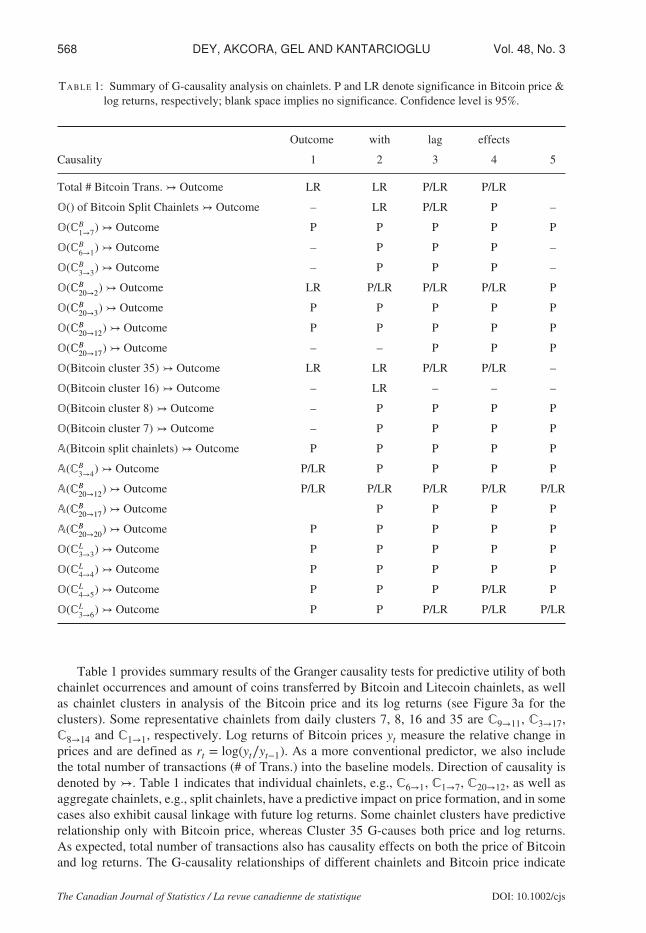
TABLE 1: Summary of G-causality analysis on chainlets. P and LR denote significance in Bitcoin price &log returns, respectively; blank space implies no significance. Confidence level is 95%.
Outcome with lag effects
Causality 1 2 3 4 5
Total # Bitcoin Trans. ↣ Outcome LR LR P/LR P/LR
𝕆() of Bitcoin Split Chainlets ↣ Outcome – LR P/LR P –
𝕆(ℂB1→7) ↣ Outcome P P P P P
𝕆(ℂB6→1) ↣ Outcome – P P P –
𝕆(ℂB3→3) ↣ Outcome – P P P –
𝕆(ℂB20→2) ↣ Outcome LR P/LR P/LR P/LR P
𝕆(ℂB20→3) ↣ Outcome P P P P P
𝕆(ℂB20→12) ↣ Outcome P P P P P
𝕆(ℂB20→17) ↣ Outcome – – P P P
𝕆(Bitcoin cluster 35) ↣ Outcome LR LR P/LR P/LR –
𝕆(Bitcoin cluster 16) ↣ Outcome – LR – – –
𝕆(Bitcoin cluster 8) ↣ Outcome – P P P P
𝕆(Bitcoin cluster 7) ↣ Outcome – P P P P
𝔸(Bitcoin split chainlets) ↣ Outcome P P P P P
𝔸(ℂB3→4) ↣ Outcome P/LR P P P P
𝔸(ℂB20→12) ↣ Outcome P/LR P/LR P/LR P/LR P/LR
𝔸(ℂB20→17) ↣ Outcome P P P P
𝔸(ℂB20→20) ↣ Outcome P P P P P
𝕆(ℂL3→3) ↣ Outcome P P P P P
𝕆(ℂL4→4) ↣ Outcome P P P P P
𝕆(ℂL4→5) ↣ Outcome P P P P/LR P
𝕆(ℂL3→6) ↣ Outcome P P P/LR P/LR P/LR
Table 1 provides summary results of the Granger causality tests for predictive utility of bothchainlet occurrences and amount of coins transferred by Bitcoin and Litecoin chainlets, as wellas chainlet clusters in analysis of the Bitcoin price and its log returns (see Figure 3a for theclusters). Some representative chainlets from daily clusters 7, 8, 16 and 35 are ℂ9→11, ℂ3→17,ℂ8→14 and ℂ1→1, respectively. Log returns of Bitcoin prices yt measure the relative change inprices and are defined as rt = log(yt∕yt−1). As a more conventional predictor, we also includethe total number of transactions (# of Trans.) into the baseline models. Direction of causality isdenoted by ↣. Table 1 indicates that individual chainlets, e.g., ℂ6→1, ℂ1→7, ℂ20→12, as well asaggregate chainlets, e.g., split chainlets, have a predictive impact on price formation, and in somecases also exhibit causal linkage with future log returns. Some chainlet clusters have predictiverelationship only with Bitcoin price, whereas Cluster 35 G-causes both price and log returns.As expected, total number of transactions also has causality effects on both the price of Bitcoinand log returns. The G-causality relationships of different chainlets and Bitcoin price indicate
The Canadian Journal of Statistics / La revue canadienne de statistique DOI: 10.1002/cjs

2020 LOCAL NETWORK FEATURES IN CRYPTOCURRENCY PRICE ANALYSIS 569
that they are likely to contain important predictive information on Bitcoin price formation andvolatility.
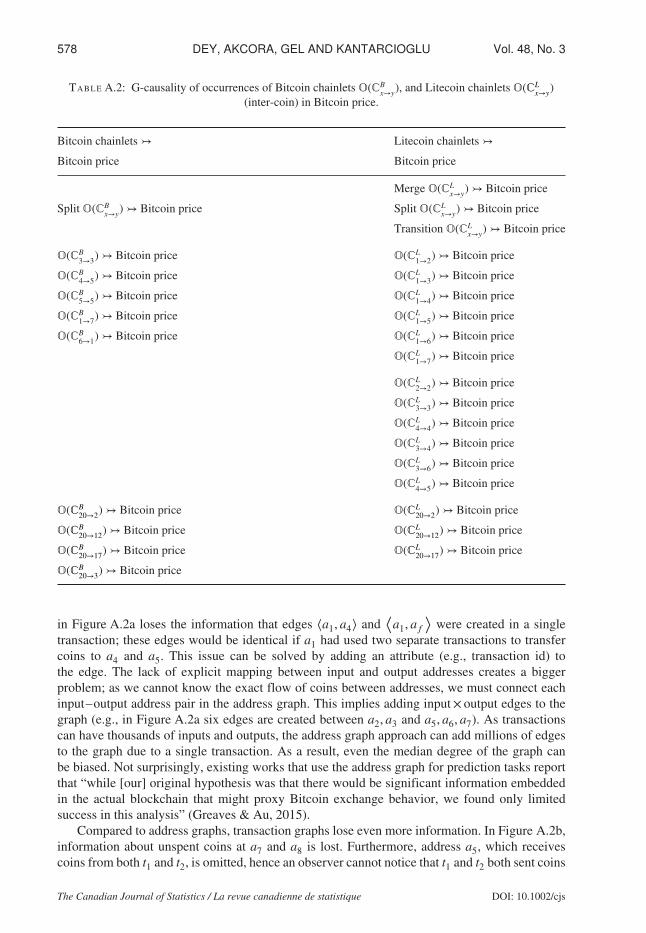
Armed with both Litecoin and Bitcoin chainlets, we define inter-coin causality of a chainletif its occurrence or amount information in one coin network has causality on the price of anothercoin. Multiple chainlets from Litecoin and Bitcoin exhibit inter-coin causality. A completeanalysis is presented in Tables A.1 and A.2 in the Appendix. Note that although 4 Bitcoinchainlets exhibit causality on the price of Litecoin, there exist 15 individual Litecoin chainletswhich G-cause Bitcoin price. Furthermore, only Litecoin aggregate chainlets (i.e., merge, splitand transition chainlets) have inter-coin causality; aggregate chainlets from Bitcoin network donot exhibit inter-coin causality.
Furthermore, 3 out of 15 Litecoin causal chainlets are extreme chainlets (i.e., ℂ20→2, ℂ20→12,ℂ20→17). When we analyze individual non-extreme Litecoin and Bitcoin chainlets (i.e., ℂx→y s.t.x < 20, y < 20) that exhibit inter-coin causality, we note that all of them are split or transitionchainlets within the first 7 × 7 block of the matrix (i.e., ℂx→y s.t. x ≤ 7, y ≤ 7). Surprisingly,ℂ1→1 and ℂ2→1, which make up to 9.4% and 9.8% of all chainlets in Litecoin and Bitcoinnetwork respectively, do not exhibit inter-coin causality. These findings suggest that rather thanthe occurrence, the type of a chainlet provides important information for inter-coin causality.
The findings give an insight on whether chainlets of one coin influence price and volatilityof another coin. As could be expected in global financial markets, Litecoin and Bitcoin overallshare similar transaction patterns and exhibit inter-coin causality of chainlets. However, moreLitecoin chainlets appear to G-cause Bitcoin prices then the reverse.
3.2. Cryptocurrency Price Prediction with ChainletsIn Section 3.1 we show that chainlets G-cause the cryptocurrency price and hence, exhibit apredictive impact on prices. We are now interested in quantifying the forecasting utility ofchainlets. To evaluate the chainlets’ predictive power, we can use any suitable forecasting modeland compare predictive performances with and without chainlets. Typically such a comparativeanalysis is performed based on the Box–Jenkins class of parametric linear models (Kane et al.,2014; Brockwell & Davis, 2016). However, for simplicity in our study we use a more flexiblerandom forest (RF) model. In our study each RF models used 500 trees, sampling all rows of thedata set is done with replacement. The number of variables used at each split is, for example, 2,3 and 4, for Model 1, Model 2 and Model 4, respectively (Hastie, Tibshirani & Friedman 2009;Efron and Hastie, 2016).
We performed experiments in forecasting Bitcoin price, where our interest is to quantifyforecasting utility of non-conventional predictors (i.e., chainlets), in addition to the conventionalpredictor of earlier observed price. That is, we assess whether lagged (earlier observed) Bitcoinand Litecoin chainlets provide any improvement in forecasting accuracy as exogenous predictors,when we have already accounted for earlier observed price. We chose to showcase five of theseRF models based on the delivered predictive accuracy (see Table 2).
The model B0, the baseline model, includes only the lagged (past period) values of theBitcoin price. The model B1 is comprised of lagged prices with the mean occurrence of splittype chainlets and mean of all chainlets in Cluster 8. The model B2 includes lagged prices andindividual chainlet occurrences, whereas, model B3 adds information on the amount of cointransfer by chainlets to the model B2. Finally, model B4 consists of lagged prices with occurrenceof individual Bitcoin chainlets as well as the occurrence of inter coin Litecoin chainlets.
The root mean squared error (RMSE) for Bitcoin price modelling can be defined as
RMSE =√
(1∕n)∑n
t=1(yt − yt)2, where yt is the test set of Bitcoin price and yt is the corre-sponding predicted value. In our study each RF model used 500 trees, and sampling all rows ofthe data set is done with replacement. We continuously change the training data using a sliding
DOI: 10.1002/cjs The Canadian Journal of Statistics / La revue canadienne de statistique

570 DEY, AKCORA, GEL AND KANTARCIOGLU Vol. 48, No. 3
TABLE 2: Model description for Bitcoin price (response) and varying predictors. 𝕆() and 𝔸() denoteoccurrence (count) and volume (coin amount) information of the chainlet, respectively. The inter-coin
causality Model 4 contains Litecoin chainlets (e.g., 𝕆(ℂL4→4)) in Bitcoin price prediction.
Model Predictors
Model B0 Price lag 1, Price lag 2, Price lag 3
Model B1 Price lag 1, Price lag 2, Price lag 3,
𝕆(Bitcoin Split Pattern) lag 1, 𝕆(Bitcoin Split Pattern) lag 2,
𝕆(Bitcoin Split Pattern) lag 3,𝕆(Bitcoin Cluster 8) lag 1,
𝕆(Bitcoin Cluster 8) lag 2, 𝕆(Bitcoin Cluster 8) lag 3
Price lag 1, Price lag 2, Price lag 3,
Model B2 𝕆(ℂB1→7) lag 1, 𝕆(ℂB
1→7) lag 2, 𝕆(ℂB1→7) lag 3, 𝕆(ℂB
6→1) lag 1,
𝕆(ℂB6→1) lag 2, 𝕆(ℂB
6→1) lag 3, 𝕆(ℂB3→3) lag 1, 𝕆(ℂB
3→3) lag 2,
𝕆(ℂB3→3) lag 3
Price lag 1, Price lag 2, Price lag 3,
𝕆(ℂB1→7) lag 1, 𝕆(ℂB
1→7) lag 2, 𝕆(ℂB1→7) lag 3, 𝕆(ℂB
6→1) lag 1,
Model B3 𝕆(ℂB6→1) lag 2, 𝕆(ℂB
6→1) lag 3, 𝕆(ℂB3→3) lag 1, 𝕆(ℂB
3→3) lag 2,
𝕆(ℂB3→3) lag 3, 𝔸(ℂB
3→4) lag 1, 𝔸(ℂB3→4) lag 2,
𝔸(ℂB3→4) lag 3, 𝔸(ℂB
20→12) lag 1, 𝔸(ℂB20→12) lag 2, 𝔸(ℂB
20→12) lag 3
Price lag 1, Price lag 2, Price lag 3,
𝕆(ℂB1→7) lag 1, 𝕆(ℂB
1→7) lag 2, 𝕆(ℂB1→7) lag 3, 𝕆(ℂB
6→1) lag 1,
Model B4 𝕆(ℂB6→1) lag 2, 𝕆(ℂB
6→1) lag 3, 𝕆(ℂB3→3) lag 1, 𝕆(ℂB
3→3) lag 2,
𝕆(ℂB3→3) lag 3, 𝕆(ℂL
3→3) lag 1, 𝕆(ℂL3→3) lag 2,
𝕆(ℂL3→3) lag 3, 𝕆(ℂL
4→4) lag 1, 𝕆(ℂL4→4) lag 2, 𝕆(ℂL
4→4) lag 3
window technique, where we choose the window size of 200. That is, at each time step we trainour model based on the past 200 values, and armed with this estimated model, we then constructan h-step-ahead forecast.
Predictive utilities of models in Table 2 over the baseline model can be measured as
Ψ(X↣Y) =𝜓(Bi)𝜓(B0)
, i = 1,… , 4,
where 𝜓 is a measure of prediction error, e.g., RMSE. Here 𝜓(B0) is the prediction error ofbaseline model, where lagged prices are the only predictor; and 𝜓(Bi) is the prediction errorof the i-th model, where predictors are lagged prices and other exogenous covariates (X). IfΨ(X→Y) < 1, the covariate (X) is said to improve prediction of Y . We also calculate the percentagechange in 𝜓 for a specific model w.r.t. B0 as
Δ =(1 − Ψ(X↣y)
)× 100%.
We compare the predictive errors for different models, calculated for varying predictionhorizons. Table 3 gives the RMSE of the baseline model and other four models in predicting
The Canadian Journal of Statistics / La revue canadienne de statistique DOI: 10.1002/cjs

2020 LOCAL NETWORK FEATURES IN CRYPTOCURRENCY PRICE ANALYSIS 571
TABLE 3: Prediction errors (RMSE) of baseline model (Model B0) and other four models for differentprediction horizons.
h Model B0 Model B1 Model B2 model B3 Model B4
1 18.85 20.73 22.40 23.13 22.89
5 33.99 33.52 33.94 34.28 34.21
7 40.66 39.01 38.26 38.50 38.44
10 49.79 47.23 44.87 44.94 44.87
15 59.29 56.01 52.89 52.90 52.74
20 65.66 62.02 58.59 58.97 58.38
05
10
15
Prediction horizon (h)
% D
ecre
ase in R
MS
E
5 10 15 20 25 30
Model B1Model B2Model B3Model B4
(a) Bitcoin.
05
10
15
Prediction horizon (h)
% D
ecre
ase in R
MS
E
5 10 15 20 25 30
Model L1Model L2Model L3
(b) Litecoin.
FIGURE 4: Change (decrease) in predictive RMSE in %, compared to the baseline models withno chainlets (Models B0 and L0, for Bitcoin and Litecoin, respectively).
Bitcoin price for different prediction horizons. For 5 or more steps ahead forecasting horizons,chainlets play an increasingly significant predictive role in cryptocurrency price formation, evenwhen other more conventional factors, such as historical price and number of transactions, arealready in the model. Figure 4a shows the percent decrease in predictive RMSE for differentmodels for Bitcoin price forecasts, calculated for varying prediction horizons h = 5,… , 30. Forshort to moderate term (up to 15 days ahead) forecasting horizons, model B2, solely based onon Bitcoin occurrences, yields more accurate performance, although closely followed by modelsB3 and B4. For longer term forecasting horizons, i.e., more than 15 days ahead, performances ofmodel B2, B3, and B4 are more distinguishable. In particular, model B4, containing informationfrom both Bitcoin and Litecoin, delivers the most competitive results, followed by model B2.
We now turn to similar analysis for Litecoin price modelling. Table A.3 in the Appendixlists the considered models, where model L0 includes only the lagged (past period) values of theLitecoin price. Models L1, L2 and L3 include lagged prices as well as different chainlet variables.A comparison of the models based on percent decrease in RMSE is depicted in Figure 4b. Forshort term (up to 7 days ahead) forecasting horizons, model L1, which only includes laggedprice and Litecoin occurrences, provides the most accurate prediction of Litecoin price, followedrelatively closely by model L3, which includes inter-coin Bitcoin chainlets. For moderate term(7-10 days ahead) forecasting horizons, model L1 and L3 yield almost indistinguishable results.Remarkably, for longer term (greater than 10 days ahead) forecasting horizons, model L3
DOI: 10.1002/cjs The Canadian Journal of Statistics / La revue canadienne de statistique

572 DEY, AKCORA, GEL AND KANTARCIOGLU Vol. 48, No. 3
400
500
600
700
2016
Bitcoin
Pri
ce in U
S D
olla
r
h=1
ObservedModel 0Model 1Model 2Model 3Model 4
Feb Apr Jun Aug Oct Dec
(a) h=1 day.
400
500
600
700
2016
Bitcoin
Pri
ce in U
S D
olla
r
h=7
ObservedModel 0Model 1Model 2Model 3Model 4
Feb Apr Jun Aug Oct Dec
(b) h=7 days.
FIGURE 5: A comparison of the Bitcoin observed data in 2016 with fitted values from baselinemodel and four other models, i.e., Models 1, 2, 3 and 4 for 1 and 7 day horizons.
substantially outperforms all other models. Generally, model L2, comprises lagged prices withindividual chainlet occurrences and chainlets volumes, delivers less competitive forecasts thanmodels L1 and L3, although for very long term (more than 20 days ahead) horizons, model L2somewhat outperforms model L1.
We find that, while as expected, the prediction performance of all models for both Bitcoin andLitecoin price prediction deteriorates as the forecasting horizon h → ∞, models with inter-coinchainlet variables yield a noticeably higher predictive accuracy than their competitors (forBitcoin price see Figure 5). One possible explanation of these findings is that integrated chainletinformation from both Bitcoin and Litecoin contains the strongest signal on yet possibly latentmarket sentiments. This phenomenon also implies that certain types of chainlets can be used inlieu of or in combination with traditional investor sentiment indicators and economic indexes.Notice that such potential crypto-indicators of market sentiment are unique for blockchain as noother economic sector allows public access to financial transactions with such a granularity.
3.3. Analyzing Price Volatility with ChainletsIn the previous section, we have found that the occurrences of chainlets and the correspondingtotal amount of coin tend to influence the cryptocurrency price dynamics. We are now interestedin evaluating whether volatility of chainlet occurrences and coin amounts transferred by chainletsexhibit predictive utility for both Bitcoin and Litecoin price volatilities. As a proxy for volatility,we use squared log returns (Brooks, 1998; Barndorff-Nielsen & Shephard, 2002).
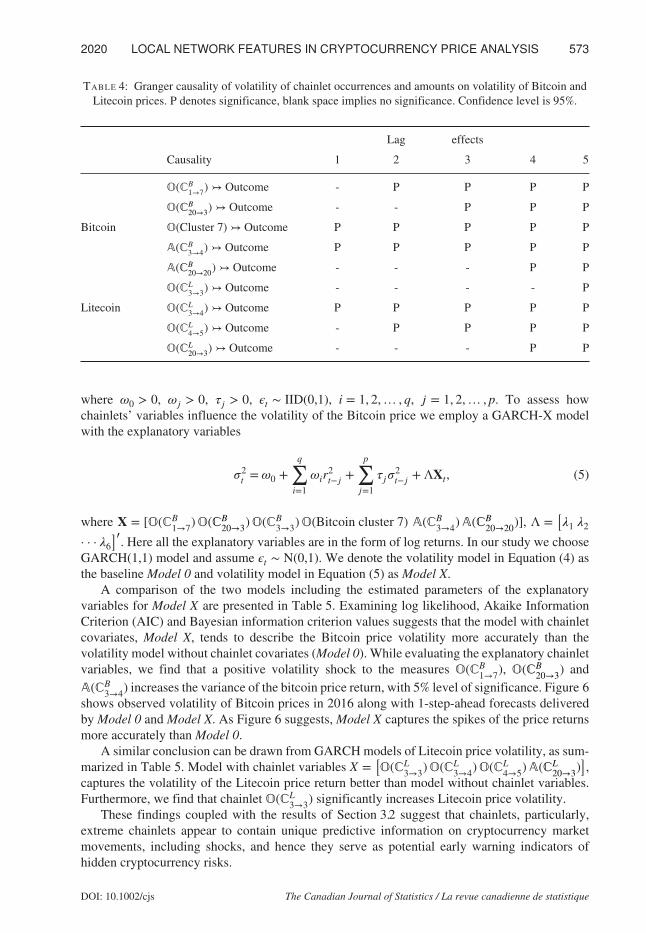
Table 4 provides illustrative subsets of the performed Granger-causality tests and suggestthat there exist chainlets which G-cause Bitcoin and Litecoin volatility. In particular, we findthat volatility of occurrences of extreme merge chainlets, such as ℂ20→3, consistently impactsvolatility of both Bitcoin and Litecoin prices. These chainlets are frequently used to buy largeamounts of coins by investors, and these investments, reported by the media, may impact themarket sentiment about cryptocurrencies.
We now turn to analysis of the utility of chainlets in predicting cryptocurrency volatilityusing the GARCH framework. The GARCH (p, q) model for a Bitcoin price return, rt, isdefined as
rt = 𝜎t𝜖t (4)
𝜎2t = 𝜔0 +
q∑i=1
𝜔ir2t−𝑗 +
p∑𝑗=1
𝜏𝑗𝜎2t−𝑗 ,
The Canadian Journal of Statistics / La revue canadienne de statistique DOI: 10.1002/cjs
2020 LOCAL NETWORK FEATURES IN CRYPTOCURRENCY PRICE ANALYSIS 573
TABLE 4: Granger causality of volatility of chainlet occurrences and amounts on volatility of Bitcoin andLitecoin prices. P denotes significance, blank space implies no significance. Confidence level is 95%.
Lag effects
Causality 1 2 3 4 5
𝕆(ℂB1→7)↣ Outcome - P P P P
𝕆(ℂB20→3) ↣ Outcome - - P P P
Bitcoin 𝕆(Cluster 7) ↣ Outcome P P P P P
𝔸(ℂB3→4) ↣ Outcome P P P P P
𝔸(ℂB20→20) ↣ Outcome - - - P P
𝕆(ℂL3→3)↣ Outcome - - - - P
Litecoin 𝕆(ℂL3→4)↣ Outcome P P P P P
𝕆(ℂL4→5)↣ Outcome - P P P P
𝕆(ℂL20→3) ↣ Outcome - - - P P
where 𝜔0 > 0, 𝜔𝑗 > 0, 𝜏𝑗 > 0, 𝜖t ∼ IID(0,1), i = 1, 2,… , q, 𝑗 = 1, 2,… , p. To assess howchainlets’ variables influence the volatility of the Bitcoin price we employ a GARCH-X modelwith the explanatory variables
𝜎2t = 𝜔0 +
q∑i=1
𝜔ir2t−𝑗 +
p∑𝑗=1
𝜏𝑗𝜎2t−𝑗 + ΛXt, (5)
where X = [𝕆(ℂB1→7)𝕆(ℂB
20→3)𝕆(ℂB3→3)𝕆(Bitcoin cluster 7) 𝔸(ℂB
3→4)𝔸(ℂB20→20)], Λ =
[𝜆1 𝜆2
· · · 𝜆6]′. Here all the explanatory variables are in the form of log returns. In our study we choose
GARCH(1,1) model and assume 𝜖t ∼ N(0,1). We denote the volatility model in Equation (4) asthe baseline Model 0 and volatility model in Equation (5) as Model X.
A comparison of the two models including the estimated parameters of the explanatoryvariables for Model X are presented in Table 5. Examining log likelihood, Akaike InformationCriterion (AIC) and Bayesian information criterion values suggests that the model with chainletcovariates, Model X, tends to describe the Bitcoin price volatility more accurately than thevolatility model without chainlet covariates (Model 0). While evaluating the explanatory chainletvariables, we find that a positive volatility shock to the measures 𝕆(ℂB
1→7), 𝕆(ℂB20→3) and
𝔸(ℂB3→4) increases the variance of the bitcoin price return, with 5% level of significance. Figure 6
shows observed volatility of Bitcoin prices in 2016 along with 1-step-ahead forecasts deliveredby Model 0 and Model X. As Figure 6 suggests, Model X captures the spikes of the price returnsmore accurately than Model 0.
A similar conclusion can be drawn from GARCH models of Litecoin price volatility, as sum-marized in Table 5. Model with chainlet variables X =
[𝕆(ℂL
3→3)𝕆(ℂL3→4)𝕆(ℂL
4→5)𝔸(ℂL20→3)
],
captures the volatility of the Litecoin price return better than model without chainlet variables.Furthermore, we find that chainlet 𝕆(ℂL
3→3) significantly increases Litecoin price volatility.These findings coupled with the results of Section 3.2 suggest that chainlets, particularly,
extreme chainlets appear to contain unique predictive information on cryptocurrency marketmovements, including shocks, and hence they serve as potential early warning indicators ofhidden cryptocurrency risks.
DOI: 10.1002/cjs The Canadian Journal of Statistics / La revue canadienne de statistique

574 DEY, AKCORA, GEL AND KANTARCIOGLU Vol. 48, No. 3
TABLE 5: Volatility of Bitcoin and Litecoin price: Model 0 versus Model X. Measures 𝕆(ℂB1→7), 𝕆(ℂB
20→3)and 𝔸(ℂB
3→4) significantly increase the Bitcoin price variance. Measure 𝕆(ℂL1→7) significantly increases the
Litecoin price variance, where a P-value of 0.05 or less determines significance.
Variables llh AIC BIC
Bitcoin Model 0 3891.27 −3.862 −3.847
Model X 3954.23 −3.906 −3.864
Litecoin Model 0 1889.774 −2.781 −2.769
Model X 1993.568 −2.922 −2.880
0.0
00.0
40.0
8
2016
Bitcoin
pri
ce v
ola
tilit
y
Observed volatility
Model 0
Model X
Feb Mar Apr May Jun Jul Aug
FIGURE 6: Out of sample Bitcoin price volatility forecast for 2016.
4. DISCUSSION AND FUTURE WORK
We have introduced a novel concept of k-chainlets, or blockchain motifs, for cryptocurrencypredictive analytics. The notion of chainlets further expands the ideas of network motifs andgraphlets to blockchain graphs. We have found that chainlet analysis provides a deeper insightinto local topological properties of the blockchain and the role of those local higher-ordertopologies in the cryptocurrency price formation. In particular, we have shown that chainletinformation, especially, extreme chainlets, exhibit an important role in Litecoin and Bitcoinprice and volatility prediction. Furthermore, we introduced a new concept of inter-coin chainlets.That is, we have studied whether chainlets of one coin exhibit a utility for understanding pricedynamics of another coin.
These findings have a number of important implications. First, it is important to emphasizethat until the launch of blockchain-based cryptocurrencies, no other economic sector has everpublicly provided such fine-grained information on financial transactions. With the advent ofthe distributed ledger technology, we now have a financial crypto market where all actors andactions can be tracked. In this project we have shown that these actions can be used as importantinput into financial predictive analytics. Second, trackable actions with one crypto coin appear tocontain valuable information not only on the price dynamics of this coin but also on other coins.The value of this inter-coin information increases with the increase of the forecasting horizon.This phenomenon implies that patterns (shape) of crypto transactions can be used not only asindicators of crypto market activity, but also more generally as financial and economic sentiment
The Canadian Journal of Statistics / La revue canadienne de statistique DOI: 10.1002/cjs

2020 LOCAL NETWORK FEATURES IN CRYPTOCURRENCY PRICE ANALYSIS 575
indexes. Furthermore, certain crypto coins, especially on the Ethereum blockchain, are known tobe traded largely by investors from certain industries. For example, the Ethereum Storj token isused to trade for data storage capacity, which is directly related to the storage hardware industry.Hence, patterns of crypto transactions for these coins could potentially be used as indicatorstailored for specific industry or sector.
The currently proposed methodology has a number of open research questions. First, wecurrently model information that a chainlet can store with occurrence (i.e., 𝕆()) and amount(i.e., 𝔸()) variables, separately. Hence, our analyses may lose information about their jointdistributions. However, we also provide first steps in using both variables; for example inTable 2, our prediction models use both amount and occurrence information in price prediction.Second, in our studies of Bitcoin and Litecoin we currently focus on 1-chainlets and hence donot implicitly account for higher-order relationships between chainlets. In our future work weplan to extend our methodology to the analysis of such higher-order k-chainlets, k > 1, as wellas inter-coin chainlet interactions.
APPENDIX
Background on Blockchain DataBroadly blockchains have two categories: blockchains based on unspent transaction output(UTXO) and blockchains based on account. In account-based blockchains, e.g., Ethereum, anaccount (i.e., address) can spend a fraction of its coins and keep the remaining balance. In theseblockchains, a transaction has exactly one input and one output address (i.e., a unique identifierfor each account). An address is used to receive and send coins multiple times.
On UTXO based blockchains (e.g., Bitcoin, Litecoin, etc.), as we described earlier, an addresscannot keep the remaining balance from a transaction; the remaining balance must be forwardedeither to the same address, or a newly created address.
The address in UTXO based cryptocurrency graph is a fixed-length unique identifier, suchas 1Pudc88gyFynBVZccRJeYyEV7ZnjfXnfKn, that is created by hashing the public encryption key of areal world user or entity. A user can have an extremely large number of addresses. A transactionis a transfer of coins from input addresses to output addresses. Input addresses of a transactiondo not have to belong to the same user; in this case each input address owner sings its own partof the transaction. Figure A.1 shows a network for 6 transactions and 11 addresses.
Our Bitcoin and Litecoin data were collected from their respective blockchains using theirofficial software; we installed the Bitcoin (https://bitcoin.org/en/download) and Litecoin (https://litecoin.com/) core wallets, and had the wallets download the entire Bitcoin blockchain datafrom 2009 to 2018 and Litecoin blockchain data from 2011 to 2018. Afterwards, we parsedthe blockchain data files, and extracted blocks, transactions and addresses. Both coins have thesame data structure; they can be parsed by our library by changing the data file path only. Forbrevity, we give our notation by using the Bitcoin graph. Our price data is downloaded fromCoinMarketCap at https://coinmarketcap.com/currencies/.
We emphasize three graph rules that shape the actual Bitcoin graph. These rules are due tothe Bitcoin design choices by Satoshi Nakamoto (Nakamoto, 2008).
• Source rule: Input coins from multiple transactions can be merged and spent in a singletransaction (e.g., the address a5 receives coins from t1 and t2 to spent in t4 in Figure A.1), orspent separately (e.g., in Figure A.1, a9 spends coins received from t3 and t4 in t5 and t6).
• Mapping rule: In a transaction the input–output address mappings are not explicitly recorded.For instance, consider the transaction t2 in Figure A.1. The output to address a6 may comefrom either a2 or a3. An analogy can be made with lakes where in-flowing rivers (inputs) andoutgoing emissions (outputs) regulate the water (coin) flow.
DOI: 10.1002/cjs The Canadian Journal of Statistics / La revue canadienne de statistique

576 DEY, AKCORA, GEL AND KANTARCIOGLU Vol. 48, No. 3
FIGURE A.1: A transaction-address graph representation of the Bitcoin network. Addresses andtransactions are shown with circles and rectangles, respectively. An edge indicates a transferof coins. Incoming edges to an address node denotes coins received by the address. Bitcoinaddresses may store coins and not spend them in future transactions. Colloquially, this is knownas “hodling.” For example, the coins at a7 and a8 are yet unspent at the time this toy graphis constructed. In the graph each transaction leaves the same transaction fee (input amounts− output amounts = 0.2 bitcoins) to be collected by the miner (miners are neutral parties thatcollect fees for disseminating transactions and maintaining the network). In Bitcoin and Litecoinnetworks the fee is not a fixed amount. If a transaction does not allocate any transaction fee, ablock miner can still choose to put the transaction in a new block, but overall, larger fees help a
transaction get mined sooner.
FIGURE A.2: Blockchain graph modelling with address and transaction graph approaches. Thegraphs contain the transactions and addresses from Figure A.1. Addresses a7 and a8 containcoins that are yet unspent. a10 and a11 are spent in future transactions not shown here. (a) Addressgraph representation. Nodes are blockchain addresses and two nodes ax and ay are connected ifax is an input and ay is an output to a transaction. (b) Transaction graph representation. Nodesare transactions and two nodes tx and ty are connected if tx sends coins to an address ax that
becomes an input to ty.
• Balance rule: Coins received from one transaction must all be spent in a single transaction.Any amount that is not sent to an output address is considered to be the transaction fee, andgets collected by the miner who creates the block. In order to keep the change, the coin spendercan create a new address and send the remaining balance to this new address. Another optionis to use the spender’s address as one of the output addresses, and re-direct the balance. Asa community practice, this reuse of the spender’s address (i.e., address reuse) is discouraged.As a result, most nodes appear in the graph two times; once when they receive coins and oncewhen they spend it.
The Canadian Journal of Statistics / La revue canadienne de statistique DOI: 10.1002/cjs

2020 LOCAL NETWORK FEATURES IN CRYPTOCURRENCY PRICE ANALYSIS 577
TABLE A.1: G-causality of Litecoin and Bitcoin (inter-coin) chainlet variables in Litecoin price, where𝕆(ℂL
x→y), 𝕆(ℂBx→y) and 𝔸(ℂL
x→y) refer to occurrences of Litecoin chainlets, occurrences of Bitcoin chainletsand amount transferred by Litecoin chainlets, respectively.
Litecoin chainlets ↣ Bitcoin chainlets ↣
Litecoin price Litecoin price
Merge 𝕆(ℂLx→y) ↣ Litecoin price
Split 𝕆(ℂLx→y) ↣ Litecoin price
Trans. 𝕆(ℂLx→y)↣ Litecoin price
𝕆(ℂL1→2) ↣ Litecoin price 𝕆(ℂB
1→3) ↣ Litecoin price
𝕆(ℂL1→3) ↣ Litecoin price 𝕆(ℂB
4→4) ↣ Litecoin price
𝕆(ℂL1→4) ↣ Litecoin price 𝕆(ℂB
4→5) ↣ Litecoin price
𝕆(ℂL1→5) ↣ Litecoin price 𝕆(ℂB
3→3) ↣ Litecoin price
𝕆(ℂL1→6) ↣ Litecoin price
𝕆(ℂL1→7) ↣ Litecoin price
𝕆(ℂL2→2) ↣ Litecoin price
𝕆(ℂL3→3) ↣ Litecoin price
𝕆(ℂL4→4) ↣ Litecoin price
𝕆(ℂL3→4) ↣ Litecoin price
𝕆(ℂL3→6) ↣ Litecoin price
𝕆(ℂL4→5) ↣ Litecoin price
𝕆(ℂL20→2) ↣ Litecoin price
𝕆(ℂL20→12) ↣ Litecoin price
𝕆(ℂL20→17) ↣ Litecoin price
𝔸(ℂL1→5) ↣ Litecoin price
𝔸(ℂL1→6) ↣ Litecoin price
𝔸(ℂL1→7) ↣ Litecoin price
𝔸(ℂL20→17)↣ Litecoin price
Previous works model a UTXO blockchain network by using transactions (Ron & Shamir,2013) or addresses (Miller et al. 2015) as nodes, and coin transfers as edges between nodes.Figure A.2 shows the networks created by using these two approaches. Both approaches areinfluenced by traditional social network analysis models which employ graphs with one nodetype only.
Address and transaction graph approaches fail to model the blockchain data faithfully; theyomit information about transactions and addresses, respectively. For example, the address graph
DOI: 10.1002/cjs The Canadian Journal of Statistics / La revue canadienne de statistique
578 DEY, AKCORA, GEL AND KANTARCIOGLU Vol. 48, No. 3
TABLE A.2: G-causality of occurrences of Bitcoin chainlets 𝕆(ℂBx→y), and Litecoin chainlets 𝕆(ℂL
x→y)(inter-coin) in Bitcoin price.
Bitcoin chainlets ↣ Litecoin chainlets ↣
Bitcoin price Bitcoin price
Merge 𝕆(ℂLx→y) ↣ Bitcoin price
Split 𝕆(ℂBx→y)↣ Bitcoin price Split 𝕆(ℂL
x→y) ↣ Bitcoin price
Transition 𝕆(ℂLx→y)↣ Bitcoin price
𝕆(ℂB3→3) ↣ Bitcoin price 𝕆(ℂL
1→2) ↣ Bitcoin price
𝕆(ℂB4→5) ↣ Bitcoin price 𝕆(ℂL
1→3) ↣ Bitcoin price
𝕆(ℂB5→5) ↣ Bitcoin price 𝕆(ℂL
1→4) ↣ Bitcoin price
𝕆(ℂB1→7) ↣ Bitcoin price 𝕆(ℂL
1→5) ↣ Bitcoin price
𝕆(ℂB6→1) ↣ Bitcoin price 𝕆(ℂL
1→6) ↣ Bitcoin price
𝕆(ℂL1→7) ↣ Bitcoin price
𝕆(ℂL2→2) ↣ Bitcoin price
𝕆(ℂL3→3) ↣ Bitcoin price
𝕆(ℂL4→4) ↣ Bitcoin price
𝕆(ℂL3→4) ↣ Bitcoin price
𝕆(ℂL3→6) ↣ Bitcoin price
𝕆(ℂL4→5) ↣ Bitcoin price
𝕆(ℂB20→2) ↣ Bitcoin price 𝕆(ℂL
20→2) ↣ Bitcoin price
𝕆(ℂB20→12) ↣ Bitcoin price 𝕆(ℂL
20→12) ↣ Bitcoin price
𝕆(ℂB20→17) ↣ Bitcoin price 𝕆(ℂL
20→17) ↣ Bitcoin price
𝕆(ℂB20→3) ↣ Bitcoin price
in Figure A.2a loses the information that edges ⟨a1, a4⟩ and⟨
a1, a𝑓⟩
were created in a singletransaction; these edges would be identical if a1 had used two separate transactions to transfercoins to a4 and a5. This issue can be solved by adding an attribute (e.g., transaction id) tothe edge. The lack of explicit mapping between input and output addresses creates a biggerproblem; as we cannot know the exact flow of coins between addresses, we must connect eachinput–output address pair in the address graph. This implies adding input× output edges to thegraph (e.g., in Figure A.2a six edges are created between a2, a3 and a5, a6, a7). As transactionscan have thousands of inputs and outputs, the address graph approach can add millions of edgesto the graph due to a single transaction. As a result, even the median degree of the graph canbe biased. Not surprisingly, existing works that use the address graph for prediction tasks reportthat “while [our] original hypothesis was that there would be significant information embeddedin the actual blockchain that might proxy Bitcoin exchange behavior, we found only limitedsuccess in this analysis” (Greaves & Au, 2015).
Compared to address graphs, transaction graphs lose even more information. In Figure A.2b,information about unspent coins at a7 and a8 is lost. Furthermore, address a5, which receivescoins from both t1 and t2, is omitted, hence an observer cannot notice that t1 and t2 both sent coins
The Canadian Journal of Statistics / La revue canadienne de statistique DOI: 10.1002/cjs

2020 LOCAL NETWORK FEATURES IN CRYPTOCURRENCY PRICE ANALYSIS 579
TABLE A.3: Model description for Litecoin price (response) and varying predictors. 𝕆() and 𝔸() denoteoccurrence (count) and volume (coin amount) information of the chainlet, respectively. The inter-coin
causality Model L3 contains Bitcoin chainlets (e.g., 𝕆(ℂB4→4)) in Litecoin price prediction.
Model Predictors
Model L0 Price lag 1, Price lag 2, Price lag 3
Price lag 1, Price lag 2, Price lag 3,
Model L1 𝕆(ℂL1→7) lag 1, 𝕆(ℂL
1→7) lag 2, 𝕆(ℂL1→7) lag 3,
𝕆(ℂL1→3) lag 1, 𝕆(ℂL
1→3) lag 2, 𝕆(ℂL1→3) lag 3,
𝕆(ℂL3→3) lag 1, 𝕆(ℂL
3→3) lag 2, 𝕆(ℂL3→3) lag 3,
𝕆(ℂL20→12) lag 1, 𝕆(ℂL
20→12) lag 2, 𝕆(ℂL20→12) lag 3
Price lag 1, Price lag 2, Price lag 3,
Model L2 𝕆(ℂL1→7) lag 1, 𝕆(ℂL
1→7) lag 2, 𝕆(ℂL1→7) lag 3,
𝕆(ℂL1→3) lag 1, 𝕆(ℂL
1→3) lag 2, 𝕆(ℂL1→3) lag 3,
𝕆(ℂL3→3) lag 1, 𝕆(ℂL
3→3) lag 2, 𝕆(ℂL3→3) lag 3,
𝕆(ℂL20→12) lag 1, 𝕆(ℂL
20→12) lag 2, 𝕆(ℂL20→12) lag 3,
𝔸(ℂL1→5) lag 1,𝔸(ℂL
1→5) lag 2, 𝔸(ℂL1→5) lag 3,
𝔸(ℂL20→17) lag 1, 𝔸(ℂL
20→17) lag 2, 𝔸(ℂL20→17) lag 3
Price lag 1, Price lag 2, Price lag 3,
Model L3 𝕆(ℂL1→7) lag 1, 𝕆(ℂL
1→7) lag 2, 𝕆(ℂL1→7) lag 3, 𝕆(ℂL
1→3) lag 1,
𝕆(ℂL1→3) lag 2, 𝕆(ℂL
1→3) lag 3, 𝕆(ℂL3→3) lag 1,
𝕆(ℂL3→3) lag 2, 𝕆(ℂL
3→3) lag 3, 𝕆(ℂB3→3) lag 1,
𝕆(ℂB3→3) lag 2, 𝕆(ℂB
3→3) lag 3
𝕆(ℂB4→4) lag 1, 𝕆(ℂB
4→4) lag 2, 𝕆(ℂB4→4) lag 3
to the same address. Losing this information may impact models that use common behaviourpatterns for applications such as fraud detection.
Blocks order transactions in time, whereas each transaction with its input and output nodesrepresents an immutable decision that is encoded as a subgraph on the coin network. Rather thanusing individual edges or nodes, we chose to use this subgraph as the building block in our coinanalysis. We use the term chainlet to refer to such subgraphs.
Our choice is due to two reasons. First, the subgraph can be taken as a single data unit becauseinclusion of nodes and edges in it is based on a single decision. As a transaction is immutable,joint inclusion of input/output nodes in its subgraph cannot be changed afterwards. This is unlikethe case on a social network where nodes can become closer on the graph because of actionsof their neighbours. Second, we argue and prove that subgraphs have distinct shapes that reflecttheir role in the network, and that we can aggregate these roles to analyze network dynamics.
ACKNOWLEDGEMENTS
Gel has been partially supported by NSF DMS 1736368, IIS 1633331 and ECCS 1824716.Kantarcioglu has been partially supported by NIH 1R01HG006844, NSF CICI-1547324, andIIS-1633331.
DOI: 10.1002/cjs The Canadian Journal of Statistics / La revue canadienne de statistique

580 DEY, AKCORA, GEL AND KANTARCIOGLU Vol. 48, No. 3
BIBLIOGRAPHYAbay, N. C., Akcora, C. G., Gel, Y. R., Islambekov, U. D., Kantarcioglu, M., Tian, Y., & Thuraisingham,
B. (2019). ChainNet: Learning on blockchain graphs with topological features. Proceedings of the 2019IEEE International Conference on Data Mining (ICDM). Beijing, China.
Ahmed, N. K., Neville, J., Rossi, R. A., Duffield, N., & Willke, T. L. (2016). Graphlet decomposition:Framework, algorithms, and applications. KAIS, 50, 1–32.
Akcora, C. G., Dey, A. K., Gel, Y. R., & Kantarcioglu, M. (2017). Forecasting Bitcoin price withgraph chainlets. The Pacific-Asia Conference on Knowledge Discovery and Data Mining (PAKDD).Melbourne, Australia; p. 1–12.
Akcora, C. G., Dixon, M., Gel, Y. R., & Kantarcioglu, M. (2018). Bitcoin risk modeling with blockchaingraphs. Economics Letters, 173, 138–142.
Barndorff-Nielsen, O. E. & Shephard, N. (2002). Econometric analysis of realized volatility and its use inestimating stochastic volatility models. Journal of the Royal Statistical Society: Series B (StatisticalMethodology), 64, 253–280.
Bhattacharyya, A. (1946). On a Measure of Divergence between Two Multinomial Populations. Sankhya:The Indian Journal of Statistics (1933–1960), 7, 401–406.
Blau, B. M. (2017). Price dynamics and speculative trading in Bitcoin. Research in International Businessand Finance, 41, 493–499.
Brooks, C. (1998). Predicting stock index volatility: Can market volume help?. Journal of Forecasting, 17,59–80.
Bukovina, J. & Marticek, M. (2016). Sentiment and Bitcoin Volatility. Mendel University in Brno, Facultyof Business and Economics.
Brockwell, P. J. & Davis, R. A. (2016). Introduction to Time Series and Forecasting. Springer InternationalPublishing.
Cermak, V. (2017). Can Bitcoin become a viable alternative to fiat currencies? An empirical analysis ofBitcoin’s volatility based on a GARCH model. SSRN Electronic Journal.
Chan, S., Chu, J., Nadarajah, S., & Osterrieder, J. (2017). A statistical analysis of cryptocurrencies. Journalof Risk and Financial Management, 10.
Chu, J., Nadarajah, S., & Chan, S. (2015). Statistical analysis of the exchange rate of Bitcoin. PLoS ONE,10.
Chu, J., Chan, S., Nadarajah, S., & Osterrieder, J. (2017). GARCH modelling of cryptocurrencies. Journalof Risk and Financial Management, 10.
Ciaian, P., Rajcaniova, M., & ancs d. (2016). The economics of BitCoin price formation. Applied Economics,48, 1799–1815.
Cox, D. R. (1972). Regression models and life-tables. Journal of the Royal Statistical Society. Series B, 34,187–220.
Dey, A. K., Gel, Y. R., & Poor, H. V. (2017). Motif-based analysis of power grid robustness under attacks.IEEE Global Conference on Signal and Information Processing (GlobalSIP); p. 1–11.
Dey, A. K., Gel, Y. R., & Poor, H. V. (2019). What Network Motifs Tell Us about Robustness andReliability of Complex Networks. Proceedings of the National Academy of Sciences of the UnitedStates of America, 116, 19368–19373.
Dyhrberg, A. H. (2016). Bitcoin, gold and the dollar – A GARCH volatility analysis. Finance ResearchLetters, 16, 85–92.
Efron, B. & Hastie, T. (2016). Computer Age Statistical Inference: Algorithms, Evidence, and Data Science.Cambridge University Press, New York.
Estrada, J. C. S. (2017). Analyzing Bitcoin Price Volatility. University of California, Berkeley. EconomicsHonors theses.
Glenski, M., Weninger, T., & Volkova, S. (2019). Improved Forecasting of Cryptocurrency Price usingSocial Signals, arXiv e-prints.
Gorochowski, T. E., Grierson, C. S., & di Bernardo, M. (2018). Organization of feed-forward loop motifsreveals architectural principles in natural and engineered networks. Science Advances, 4.
Chen, F., Wan, H., Cai, H., & Cheng, G. (2019). Machine Learning in/for Blockchain: Future andChallenges, arXiv e-prints.
The Canadian Journal of Statistics / La revue canadienne de statistique DOI: 10.1002/cjs
2020 LOCAL NETWORK FEATURES IN CRYPTOCURRENCY PRICE ANALYSIS 581
Granger, C. W. J. (1969). Investigating causal relations by econometric models and cross-spectral methods.Econometrica, 3, 424–438.
Greaves, A. & Au, B. (2015). Using the Bitcoin Transaction Graph to Predict the Price of Bitcoin.Han, J., Kamber, M., & Pei, J. (2012). Data Mining, 3rd ed., Morgan Kaufmann, Boston.Hastie, T. J., Tibshirani, R. J., & Friedman, J. H. (2009). The Elements of Statistical Learning: Data Mining,
Inference, and Prediction. Springer, New York.Hotz-Behofsits, C., Huber, F., & Zörner, T. O. (2018). Predicting crypto-currencies using sparse
non-Gaussian state space models. Journal of Forecasting, 37, 627–640.Huang, A. (2008). Similarity measures for text document clustering. Proceedings of the 6th New Zealand
Computer Science Research Student Conference; p. 49–56.Islambekov, U., Dey, A. K., Gel, Y. R., & Poor, H. V. (2018). Role of local geometry in robustness of
power grid networks. Proceedings of the 2018 IEEE Global Conference on Signal and InformationProcessing (GlobalSIP); p. 885–889.
Jang, H. & Lee, J. (2018). An Empirical Study on Modeling and Prediction of Bitcoin Prices With BayesianNeural Networks Based on Blockchain Information. IEEE Access, 6, 5427–5437.
Jiang, X. F., Chen, T. T., & Zheng, B. (2014). Structure of local interactions in complex financial dynamics.Scientific Reports, 4.
Kane, M. J., Price, N., Scotch, M., & Rabinowitz, P. (2014). Comparison of ARIMA and Random Foresttime series models for prediction of avian influenza H5N1 outbreaks. BMC Bioinformatics, 15, 276.
Katsiampa, P. (2017). Volatility estimation for Bitcoin: A comparison of GARCH models. EconomicsLetters, 158, 3–6.
Kurbucz, M. T. (2019). Predicting the price of Bitcoin by the most frequent edges of its transaction network.Economics Letters, 184, 108655.
Luo, M., Kontosakos, V. E., Pantelous, A. A., & Zhou, J. (2019). Cryptocurrencies: Dust in the wind?.Physica A: Statistical Mechanics and its Applications, 525, 1063–1079.
Moore, T. & Christin, N. (2013). Beware the middleman: Empirical analysis of Bitcoin-exchange risk.Financial Cryptography and Data Security: Springer Berlin Heidelberg; p. 25–33.
Milo, R., Shen-Orr, S., Itzkovitz, S., Kashtan, N., Chklovskii, D., & Alon, U. (2002). Network motifs:Simple building blocks of complex networks. Science, 298, 824–827. American Association for theAdvancement of Science.
Nakamoto, S. (2008). Bitcoin: A peer-to-peer electronic cash system (unpublished).Ofori-Boateng, D., Dey, A. K., Gel, Y. R., Li, B., Zhang, J., & Poor, H. V. (2019). Assessing the resilience
of the Texas power grid network. Proceedings of the 2019 IEEE Data Science Workshop (DSW);p. 280–284.
Sovbetov, Y. (2018). Factors influencing cryptocurrency prices: Evidence from Bitcoin, Ethereum, Dash,Litcoin, and Monero. Journal of Economics and Financial Analysis, 2, 1–27.
Tschorsch, F. & Scheuermann, B. (2016). Bitcoin and beyond: A technical survey on decentralized digitalcurrencies. IEEE Communications Surveys and Tutorials, 18, 2084–2123.
White, H., Chalak, K., & Lu, X. (2011). Linking Granger causality and the pearl causal model with settablesystems. JMLR, 12, 1–29.
Received 05 March 2019Accepted 06 November 2019
DOI: 10.1002/cjs The Canadian Journal of Statistics / La revue canadienne de statistique