on the room-temperature phase diagram of high pressure
TRANSCRIPT

On the room-temperature phase diagram of high pressure hydrogen: An ab initiomolecular dynamics perspective and a diffusion Monte Carlo studyJi Chen, Xinguo Ren, Xin-Zheng Li, Dario Alfè, and Enge Wang Citation: The Journal of Chemical Physics 141, 024501 (2014); doi: 10.1063/1.4886075 View online: http://dx.doi.org/10.1063/1.4886075 View Table of Contents: http://scitation.aip.org/content/aip/journal/jcp/141/2?ver=pdfcov Published by the AIP Publishing Articles you may be interested in Ab initio molecular dynamics simulation of liquid water by quantum Monte Carlo J. Chem. Phys. 142, 144111 (2015); 10.1063/1.4917171 Equation of state and phase diagram of ammonia at high pressures from ab initio simulations J. Chem. Phys. 138, 234504 (2013); 10.1063/1.4810883 Constant pressure ab initio molecular dynamics with discrete variable representation basis sets J. Chem. Phys. 133, 184110 (2010); 10.1063/1.3499812 Order-disorder phase transition and dissociation of hydrogen sulfide under high pressure: Ab initio moleculardynamics study J. Chem. Phys. 132, 164506 (2010); 10.1063/1.3392673 Ab initio molecular dynamics of hydrogen dissociation on metal surfaces using neural networks and noveltysampling J. Chem. Phys. 127, 154716 (2007); 10.1063/1.2794338
Reuse of AIP Publishing content is subject to the terms: https://publishing.aip.org/authors/rights-and-permissions. Downloaded to IP: 222.195.68.133 On: Fri, 24 Jun 2016
15:05:48
THE JOURNAL OF CHEMICAL PHYSICS 141, 024501 (2014)
On the room-temperature phase diagram of high pressure hydrogen:An ab initio molecular dynamics perspective and a diffusionMonte Carlo study
Ji Chen,1 Xinguo Ren,2 Xin-Zheng Li,3,4,a) Dario Alfè,5,6,7,b) and Enge Wang1,4,c)
1International Center for Quantum Materials, Peking University, Beijing 100871, People’s Republic of China2Key Laboratory of Quantum Information, University of Science and Technology of China, Hefei 230026,Anhui, People’s Republic of China3School of Physics, Peking University, Beijing 100871, People’s Republic of China4Collaborative Innovation Center of Quantum Matter, Beijing 100871, People’s Republic of China5London Centre for Nanotechnology, University College London, London WC1H 0AH, United Kingdom6Department of Physics and Astronomy, University College London, London WC1E6BT, United Kingdom7Department of Earth Sciences, University College London, London WC1E6BT, United Kingdom
(Received 26 November 2013; accepted 19 June 2014; published online 8 July 2014)
The finite-temperature phase diagram of hydrogen in the region of phase IV and its neighborhoodwas studied using the ab initio molecular dynamics (MD) and the ab initio path-integral molec-ular dynamics (PIMD). The electronic structures were analyzed using the density-functional theory(DFT), the random-phase approximation, and the diffusion Monte Carlo (DMC) methods. Taking thestate-of-the-art DMC results as benchmark, comparisons of the energy differences between structuresgenerated from the MD and PIMD simulations, with molecular and dissociated hydrogens, respec-tively, in the weak molecular layers of phase IV, indicate that standard functionals in DFT tend tounderestimate the dissociation barrier of the weak molecular layers in this mixed phase. Becauseof this underestimation, inclusion of the quantum nuclear effects (QNEs) in PIMD using electronicstructures generated with these functionals leads to artificially dissociated hydrogen layers in phaseIV and an error compensation between the neglect of QNEs and the deficiencies of these functionalsin standard ab initio MD simulations exists. This analysis partly rationalizes why earlier ab initioMD simulations complement so well the experimental observations. The temperature and pressuredependencies for the stability of phase IV were also studied in the end and compared with earlierresults. © 2014 AIP Publishing LLC. [http://dx.doi.org/10.1063/1.4886075]
I. INTRODUCTION
Ever since Wigner and Huntington’s prediction thatpressure-induced metallization might happen in solidhydrogen,1 understanding the hydrogen phase diagram atmegabar pressures has become one of the greatest challengesin condensed matter physics. Besides the possible high Tcsuperconductivity,2, 3 this hydrogen under high pressure alsoserves as a candidate model system for the existence ofmany interesting states of matter, e.g., the low-temperaturesuperfluid,4 and the low-temperature quantum liquid,4, 5 etc.Recent advances in static diamond anvil cell (DAC) exper-iments mean that now one can measure properties of hy-drogen at pressures of 360 GPa or even higher.6–9 Whencombined with theoretical simulation techniques, which al-low the atomic level structures of this matter to be specif-ically addressed, the low temperature (150 K and below)phase diagram of hydrogen has been established to a largeextend.6, 7, 10–17 Three molecular solid phases (labelled asphases I, II, and III in literature) have been identified inboth experimental and theoretical studies. Phase I is an in-sulating quantum crystal consisting of hydrogen molecules
a)Electronic mail: [email protected])Electronic mail: [email protected])Electronic mail: [email protected]
of disordered bond-vector directions with their centers sit-ting on a hexagonal close packed lattice.6 Although consen-sus has not been reached regarding the structures of phasesII and III, they are also both believed to be insulating.12–17
Metallic hydrogen, on the other hand, has only been ob-served at elevated temperatures in the dynamic shock waveexperiments.18–20 As a matter of fact, the high temperature(above 1000 K) phase diagram of hydrogen has largely beenestablished using this technique with assistance from theo-retical simulations.18–24 Upon increasing the temperature orpressure, a molecular-to-atomic liquid-liquid phase-transitionhas been well-characterized. Associated with this change ofthe nuclear configurations, the system also shows a transitionfrom an insulating to a metallic state for the electronic struc-tures. In between the low-temperature (below 150 K, wherethe phases are all insulating and molecular) and high tem-perature (above 1000 K, where the phase is either an insulat-ing or a metallic liquid) regions, experimental and theoreticalstudies of the hydrogen phase diagram mostly focus on pres-sures below 200 GPa.25–27 A molecular solid-to-liquid phase-transition with a negative slope of the melting curve has beenidentified between 100 and 200 GPa and phases on both sidesof the transition line are insulating.
During the trials of seeking for metallic hydrogen at mod-erate temperatures, evidence for the stabilization of a new
0021-9606/2014/141(2)/024501/9/$30.00 © 2014 AIP Publishing LLC141, 024501-1
Reuse of AIP Publishing content is subject to the terms: https://publishing.aip.org/authors/rights-and-permissions. Downloaded to IP: 222.195.68.133 On: Fri, 24 Jun 2016
15:05:48

024501-2 Chen et al. J. Chem. Phys. 141, 024501 (2014)
insulating solid phase (phase IV) has been observed above200 GPa in recent room temperature DAC experiments.28–32
Combining the Raman and Synchrotron Infrared Spec-troscopy, the boundaries between phase I, phase IV andthe low-temperature phase III were determined.30–32 Vibra-tional properties in these studies indicate that this newphase IV is composed by a mixture of strong and weakmolecules. Theoretically, ab initio structure searching andfinite-temperature molecular dynamics (MD) simulations be-yond it have separately reported structures with interpene-trating layers of strong and weak molecules.33–37 Within thegraphene-like weak molecular layer, proton transfer happensand its frequency increases with pressure.30 This is consis-tent with the experimental observation that the ν1 Ramanfull width at half maximum (FWHM) of phase IV is largerthan its value in other phases and this width increases withpressure.28, 29, 35
In spite of this consistence between theory and experi-ment concerning the properties of this phase IV, some ques-tions which are fundamentally important in its theoretical de-scription remain unanswered, including, e.g., (i) how accurateare the often used functionals within the density-functionaltheory (DFT) in describing the electronic structures of thisphase, and (ii) what will the impact of quantum nuclear ef-fects (QNEs) be? The first question is important because it iswell-known in studies of high pressure hydrogen that by go-ing beyond the often used functionals within DFT, the resultsobtained from the molecular simulations change.23, 24, 38 Andfor the second question, it has been known for a long time thatthe QNEs are important for descriptions of the high pressurehydrogen and therefore they should be included in the molec-ular simulations. This is true in descriptions of the structuresin phase III at low temperatures17 and the bond-vector direc-tions in phases I and II.6, 17 It is also true for the predictionof the low-temperature quantum liquid hydrogen above 500GPa, where upon neglecting the QNEs the low-temperatureliquid phase does not exist.5 An explicit answer to these ques-tions is clearly desirable. Plus, although the existence of thisphase IV at room temperature and its boundary with low-temperature phase III reaches a consensus now, the phase dia-gram of hydrogen at higher temperatures or pressures beyondphase IV is still unclear. This multi-phase co-existence regionof phase diagram is important to our understanding of themetallic transition, i.e., how is the insulator-to-metal liquid-liquid phase-transition at high temperatures connected to thesolid-solid phase-transitions at low temperatures. Therefore,a delicate study is highly desired.
In this work, we carry out a series of first-principle com-puter simulations for hydrogen at 200–450 GPa, starting fromanalysis on the accuracy of the often used ab initio meth-ods in describing the electronic structures and the impactof the QNEs on descriptions of the statistical nuclear con-figurations. Both ab initio MD and ab initio path-integralmolecular dynamics (PIMD) will be used. Using ab initioMD, bond making and bond breaking events as well as thethermal effects can be accounted for in a seamless mannerbased on the forces computed “on the fly” as the dynamicsof the system evolves. By going beyond this with ab ini-tio PIMD, the QNEs are also accounted for and by com-
paring the results obtained from MD and PIMD, the role ofthe QNEs can be examined in a very clean manner.5, 39–44
Concerning the electronic structures, the accuracy of the of-ten used local-density approximation (LDA), Perdew-Burke-Ernzerhof (PBE) exchange-correlation functional, van derWaals density-functional (labelled as vdW-DF in later discus-sions, using the optB88-vdW functional as an example),45–48
hybrid functional HSE0649 within DFT, and the random-phase approximation (RPA) method50–52 was analyzed, usingstructures of the system generated from the ab initio MD andPIMD simulations. Taking the state-of-the-art DMC resultsas benchmark,53, 54 comparisons of the energy differences be-tween structures generated from the MD and PIMD simula-tions, which give molecular and dissociated hydrogen, respec-tively, in the weak molecular layer of phase IV, indicate thatstandard functionals in DFT tend to underestimate the disso-ciation barrier of the weak molecular layer, with the hybridHSE06 functional and the RPA method underestimating theleast. Because of this underestimation, inclusion of the QNEsin PIMD using electronic structures obtained from function-als like PBE or vdW-DF leads to artificially dissociated hy-drogen layers, in clear discrepancy with the experimental ob-servations that this phase IV is a mixed phase composed byboth strong and weak molecules. An error cancellation be-tween the neglect of QNEs and the deficiencies of these func-tionals in standard ab initio MD simulations therefore exists,which partly explains why the ab initio MD simulations onphase IV reported so far agree so well with the experimen-tal results.34–36 In the end, we also analyzed the temperatureand pressure dependencies for the stability of phase IV andcompared our results with earlier studies.
The paper is organized as follows. In Sec. II, we intro-duce the methods we have used and the settings of the first-principle calculations. In Sec. III A, we show our results onthe structures of phase IV obtained from the ab initio MDand PIMD simulations. In Sec. III B, we analyze the accuracyof different ab initio electronic structure methods, taking theDMC results as benchmark. How the accuracy of the ab initioMD and PIMD simulations is related to the choice of theseunderlying electronic structures will also be discussed. InSec. III C, we present some further exploration of the hydro-gen phase diagram by focusing on the temperature and pres-sure dependencies for the stability of phase IV. The conclu-sions and perspectives are given in Sec. IV.
II. COMPUTATIONAL DETAILS
The first-principle MD and PIMD simulations of the“Born-Oppenheimer-type” were carried out using the planewave based DFT code VASP.55 Projector augmented wave(PAW) potentials along with a 500 eV cutoff energy was em-ployed for the expansion of the electronic wavefunctions. Inthe MD and PIMD simulations, both PBE56 and the optB88-vdW functional within the vdW-DF scheme45–48 were cho-sen. Based on the structures of the system generated fromthese MD and PIMD simulations, other electronic structurecalculations using LDA, hybrid HSE06 functionals withinDFT, and the RPA method were also performed with thispackage.49, 51, 52 A supercell containing 432 hydrogen atoms
Reuse of AIP Publishing content is subject to the terms: https://publishing.aip.org/authors/rights-and-permissions. Downloaded to IP: 222.195.68.133 On: Fri, 24 Jun 2016
15:05:48

024501-3 Chen et al. J. Chem. Phys. 141, 024501 (2014)
and a (3 × 3 × 3) Monkhorst-Pack grid were used to sam-ple Brillouin zone in the MD simulations, while in the PIMDand RPA calculations we used a 96 atom supercell and a(4 × 4 × 4) MP grid. For the representation of the imaginarytime path-integral in the PIMD simulations we have chosen 32beads per nucleus, whose convergence was seriously checkedby comparing with results obtained using 16 and 48 beads.The MD (PIMD) data reported were based on simulations of10 ps together with a NVT ensemble, whose temperature wascontrolled using the Nosé-Hoover Chain.57
The DMC calculations were performed with theCASINO code,53 using a Dirac-Fock pseudopotential58, 59
with a core radius of 0.26 Å. We used pseudopotentials tomake it simpler to obtain trial wavefunctions from plane wavecalculations, which guarantee systematic and unbiased ba-sis set convergence. The quality of this pseudopotential hasbeen systematically tested in our earlier studies, see, e.g.,Refs. 60–63. The trail wavefunctions were of the Slater-Jastrow type, with a single Slater determinant, and we usedthe fixed-node or the fixed-phase approximation. The singleparticle orbitals were obtained from LDA plane-wave calcu-lations with the PWSCF package,64 using a plane-wave cutoffof 300 Ryd, and were re-expanded in B-splines.65 The Jastrowfactor contains one-body and two-body (electron-electron, U,and electron-nucleus, χ ) terms, and is optimized by minimiz-ing the variance of the system with variational Monte Carlosimulations. We obtained a minimum variance of 12.7(2)eV2/electron. Adding a three-body term (electron-electron-nucleus, F) decreases the variance by only ∼3%. Both thelocality approximation (LA)66 and the “t-move” scheme dueto Casula67 were used. The locality approximation is non-variational and therefore can have errors on either side ofthe true energy. These errors are due, in both cases, to theuse of non-local pseudopotentials in combination with the im-perfect trial wavefunctions. The simulations with the t-movescheme used a Jastrow factor including the U, χ , and F terms,while for those with the LA we only included the U andχ terms. The Jastrow factor was optimized on one snapshotstructure, and then used for all the remaining structures. TheDMC time step tests were performed by monitoring the en-ergy difference between two snapshots obtained from the MDand PIMD simulations, respectively, using 96-atom and 768-atom super-cells, sampled with the zone boundary k-point L= (0.5, 0.5, 0.5). To address finite size errors we used themethod developed by Chiesa et al.68 One-body finite size ef-fects were addressed by averaging over different twists ki,
69
EtotM = ∑M
i=1 Ei/M , where Ei was the energy calculated at theki tests. Many-body finite size effects, due to long-range cor-relations, were addressed using the method based on the elec-tronic structure factor.68 To perform these tests we used 96-atom, 768-atom, 2592-atom, and 6144-atom super-cells. Outof interest, we also computed finite size corrections based onthe LDA, by evaluating EL + �ELDA, with EL the raw DMCenergy evaluated with the L point only and �ELDA = E∞− E111, where E∞ is the LDA energy fully converged withrespect to the number of k-points and E111 the LDA energyobtained with just the L point. This type of finite size cor-rection is common practice, and we found that in this case itproduced results that were only a few meV/atom away from
the fully converged DMC energy with respect to the numberof twists. Results of these tests are given in Sec. III B.
III. RESULTS
A. Structure of phase IV from the ab initio MDand PIMD simulations
We start our discussion by looking at the statistical nu-clear configurations of phase IV at the classical level. Usingthe mixed molecular structure with intercalating strong andweak molecular layers of both Pc and Cc symmetry as start-ing structures,33, 34 our ab initio MD simulations confirm thestability of this mixed molecular phase at 300 K from 210 to290 GPa (Fig. 1). The weak molecular layer is graphene-like.The centers of the molecules in the strong molecular layerform a slightly distorted hexagonal lattice. If we label thesestrong and weak molecular layers as G and B layers, respec-tively, the stacking follows a GBGB periodicity, which is con-sistent with Refs. 35 and 36. Concerning molecular rotation,in the weak molecular layer the in-plane interaction betweenneighboring molecules is strong so that the movement of nu-clei perpendicular to the layer is suppressed. The hydrogenmolecules in the strong layer, on the other hand, can rotate to-ward out of the plane more freely. The same results obtainedfrom simulations using Pc and Cc structures as starting pointsindicate that the statistical effects are essential to characterizethe finite-temperature structures, and it is these finite temper-ature properties, instead of the static ones, that should be usedto complement experiments.35, 36
To better characterize these structures, we plot the paircorrelation functions (PCFs) of the strong and weak molec-ular layers separately in Figs. 2(a) and 2(b), using the datagenerated from the ab initio MD simulations. In these MDsimulations, the H2 bond-length in the strong molecular layer(first peak in Fig. 2(a)) does not change with increasingpressures. In the weak molecular layer, the first two peaksin the PCFs (Fig. 2(b)), representing the intra-molecular
(a) (b)
(c)
FIG. 1. Snapshots of the ab initio MD simulations for the mixed molecularphase. Panel (a) shows the sideview of the simulation cell. Panel (b) showsthe topview of the strong molecular layer, as indicated yellow balls in panel(a). Panel (c) shows the topview of the weak molecular layer, as indicated byballs in gray in panel (a). The dashed lines are guide lines for the tetrahedraland honeycomb structures.
Reuse of AIP Publishing content is subject to the terms: https://publishing.aip.org/authors/rights-and-permissions. Downloaded to IP: 222.195.68.133 On: Fri, 24 Jun 2016
15:05:48
024501-4 Chen et al. J. Chem. Phys. 141, 024501 (2014)
0.5 1 1.5 2r (Å)
01234
PC
F
(a)
0.5 1 1.5 2r (Å)
0
1
2
3P
CF
210GPa250GPa290GPa
(b)
0.5 1 1.5 2r (Å)
0
1
2
3
PC
F
(c)
0.5 1 1.5 2r (Å)
0
1
2
3
PC
F
(d)
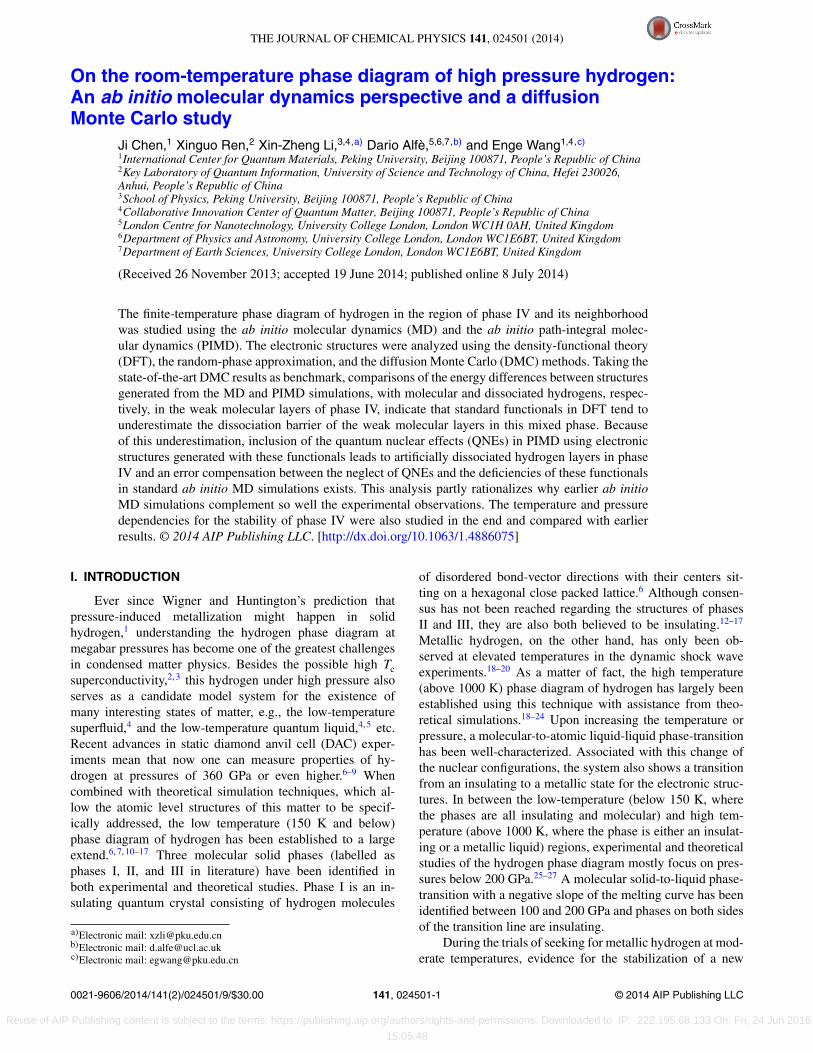
FIG. 2. PCFs of different molecular layers obtained from the ab initio MDand PIMD simulations of the mixed molecular phase IV at 300 K. Panel (a):strong molecular layer in the MD simulations. Panel (b): weak molecularlayer in the MD simulations. Panel (c): strong molecular layer in the PIMDsimulations. Panel (d): weak molecular layer in the PIMD simulations. Thelegend in panel (a) applies to other panels.
H2 bond-length and the shortest inter-molecular H–H dis-tance, respectively, are well separated. But they have a ten-dency to merge into one upon increasing pressures. This isdue to an increase of proton transfer rate within the layer,35, 36
from a few times during the whole simulation, to several timesper picosecond. The shift of the first peak to longer distance isconsistent with the redshift of the vibration frequency of theweak molecules with increasing pressures in the room tem-perature Raman experiments.29
Then we turn on the QNEs and look at the results ob-tained from the ab initio PIMD simulations, as shown by thelower two panels in Fig. 2. A fast increase in the H2 intra-molecular bond-length in the strong molecular layer, as re-flected by the shift of the first peak in Fig. 2(c) to longer dis-tances, can be observed. Besides this, the clear separation ofthe first two peaks in the MD simulation of the weak molecu-lar layer (Fig. 2(b)) becomes much less obvious in the PIMDsimulation with quantum nuclei at 210 GPa (Fig. 2(d)). Andthey completely merge into one single peak at 250 GPa and290 GPa (Fig. 2(d)). In other words, the molecular featureof the weak molecular layer is still kept at 210 GPa uponincluding the QNEs. At 250 and 290 GPa, however, due tothe fact that the protons are totally delocalized upon includ-ing the nuclear quantum fluctuations, the graphene-like weakmolecular layers become quasi-atomic. Earlier bandgap cal-culations using structures with these quasi-atomic graphene-like layers suggested that such a system was metallic.17, 38 Inexperiments, however, it is well-characterized that this roomtemperature mixed phase is insulating below 320 GPa.29–31 Aconflict between theory and experiment therefore exists.
B. Analysis of the electronic structures
To analyze the reason of the “artificial dissociation”of the weak molecules in the PIMD simulations as pre-sented above, we assess the accuracy of the PBE exchange-
0
10
20
30
40
ΔE/a
tom
(m
eV)
PBEHSE06LDAoptB88-vdWRPABenchmark DMC
MD1 MD2 MD3 PIMD2 PIMD3PIMD1Configuration
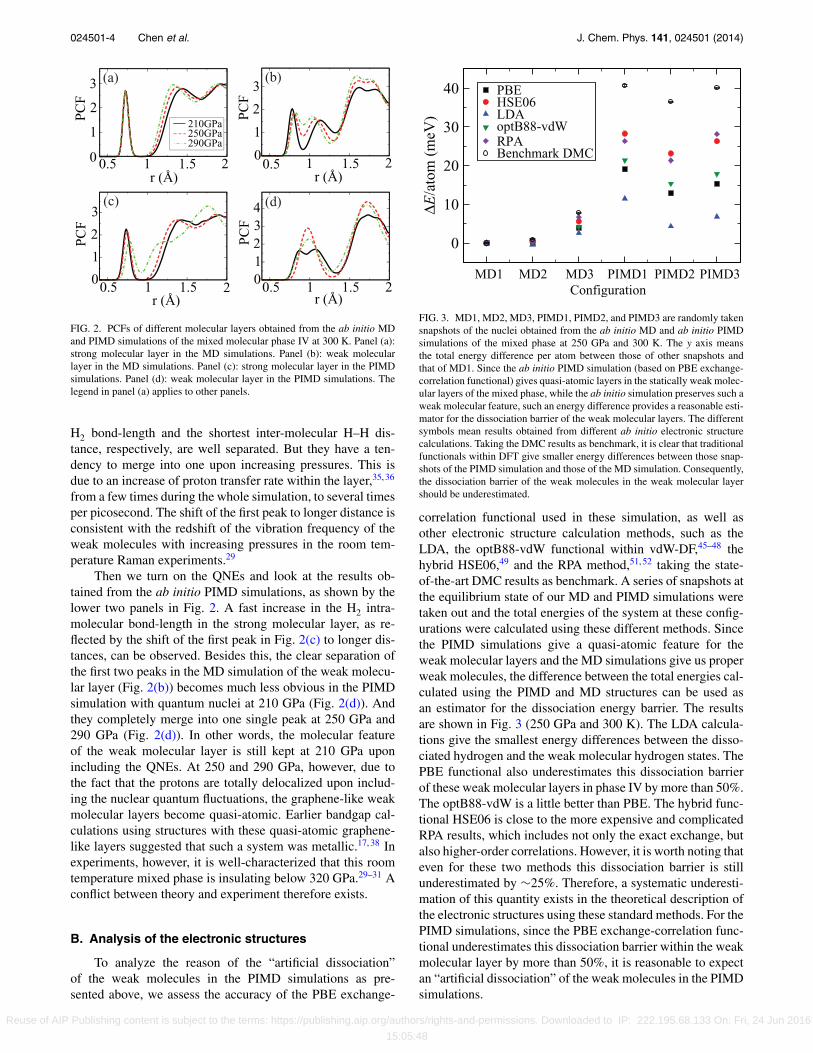
FIG. 3. MD1, MD2, MD3, PIMD1, PIMD2, and PIMD3 are randomly takensnapshots of the nuclei obtained from the ab initio MD and ab initio PIMDsimulations of the mixed phase at 250 GPa and 300 K. The y axis meansthe total energy difference per atom between those of other snapshots andthat of MD1. Since the ab initio PIMD simulation (based on PBE exchange-correlation functional) gives quasi-atomic layers in the statically weak molec-ular layers of the mixed phase, while the ab initio simulation preserves such aweak molecular feature, such an energy difference provides a reasonable esti-mator for the dissociation barrier of the weak molecular layers. The differentsymbols mean results obtained from different ab initio electronic structurecalculations. Taking the DMC results as benchmark, it is clear that traditionalfunctionals within DFT give smaller energy differences between those snap-shots of the PIMD simulation and those of the MD simulation. Consequently,the dissociation barrier of the weak molecules in the weak molecular layershould be underestimated.
correlation functional used in these simulation, as well asother electronic structure calculation methods, such as theLDA, the optB88-vdW functional within vdW-DF,45–48 thehybrid HSE06,49 and the RPA method,51, 52 taking the state-of-the-art DMC results as benchmark. A series of snapshots atthe equilibrium state of our MD and PIMD simulations weretaken out and the total energies of the system at these config-urations were calculated using these different methods. Sincethe PIMD simulations give a quasi-atomic feature for theweak molecular layers and the MD simulations give us properweak molecules, the difference between the total energies cal-culated using the PIMD and MD structures can be used asan estimator for the dissociation energy barrier. The resultsare shown in Fig. 3 (250 GPa and 300 K). The LDA calcula-tions give the smallest energy differences between the disso-ciated hydrogen and the weak molecular hydrogen states. ThePBE functional also underestimates this dissociation barrierof these weak molecular layers in phase IV by more than 50%.The optB88-vdW is a little better than PBE. The hybrid func-tional HSE06 is close to the more expensive and complicatedRPA results, which includes not only the exact exchange, butalso higher-order correlations. However, it is worth noting thateven for these two methods this dissociation barrier is stillunderestimated by ∼25%. Therefore, a systematic underesti-mation of this quantity exists in the theoretical description ofthe electronic structures using these standard methods. For thePIMD simulations, since the PBE exchange-correlation func-tional underestimates this dissociation barrier within the weakmolecular layer by more than 50%, it is reasonable to expectan “artificial dissociation” of the weak molecules in the PIMDsimulations.
Reuse of AIP Publishing content is subject to the terms: https://publishing.aip.org/authors/rights-and-permissions. Downloaded to IP: 222.195.68.133 On: Fri, 24 Jun 2016
15:05:48

024501-5 Chen et al. J. Chem. Phys. 141, 024501 (2014)
The rationalization as presented above is based onanalysis of the total energy associated with some snapshotsobtained from the ab initio MD and PIMD simulations. For amore rigorous confirmation of this mechanism from a statisti-cal perspective, we further performed ab initio PIMD simula-tion using electronic structures generated with optB88-vdWfunctional within the vdW-DF scheme.45–48 From Fig. 3, it isclear that this functional provides slightly larger dissociationbarrier for the weak molecular layer as compared with thePBE exchange-correlation functional used in the PIMDsimulations in Fig. 2. Therefore, if the mechanism we havementioned above is correct, i.e., underestimation of the dis-sociation barrier in the PBE exchange-correlation functionalresults in “artificial dissociation” of the weak molecular layer,ab initio PIMD simulation using electronic structures gener-ated by optB88-vdW should give structures with a differentdissociation behavior. A slight tendency toward undissociatedstate in the weak molecular layers should be expected uponusing this functional. As a matter of fact, this simulationconfirms exactly such a conjecture. This is shown in Fig. 4,where we compare the PCFs of the strong and weak molec-ular layers in phase IV obtained from the ab initio PIMDsimulations using the PBE and optB88-vdW electronic struc-tures. It is clear that when optB88-vdW is used, there wasa slight preference toward to the molecular state in layer G,especially at 230 GPa, where ab initio PIMD using the PBEexchange-correlation functional already gives a quasi-atomicstate. Therefore, the underestimation of proton transfer barrierwithin the weak molecular layer is responsible for the unre-alistic delocalization of proton at 250 GPa and 290 GPa inFig. 2. For the dissociation of the liquid hydrogen at higher
0
1
2
3
PC
F
PBEoptB88-vdW
012345
0
1
2
3
PC
F
012345
0.5 1 1.5 2r (Å)
0
1
2
3
PC
F
0.5 1 1.5 2r (Å)
012345
(a)
(b)
(c)
(d)
(e)
(f)
Layer-B Layer-G
210
GP
a23
0 G
Pa
250
GP
a
FIG. 4. (a)–(f) PCFs of the strong (labelled as B) and weak (labelled as G)molecular layer in mixed molecular phase from the ab initio PIMD simula-tions using PBE and optB88-vdW for the description of the electronic struc-tures. The temperature is 300 K. The three pressures shown are 210 GPa, 230GPa, and 250 GPa. The main difference is in the weak molecular layer. Whenthe electronic structures are calculated using optB88-vdW, the weak molec-ular layer has a slightly larger tendency to keep its molecular feature. This isespecially clear in panel (e) (230 GPa), where the molecular layer still keepsits molecular feature in the ab initio PIMD simulation using the optB88-vdWelectronic structures. While in the ab initio PIMD simulation using the PBEexchange-correlation functional, this layer basically becomes atomic.
0.001 0.01 0.1 1dt (a.u.)
28
30
32
ΔE/a
tom
(m
eV)
0.001 0.01 0.1 1
28
30
32
1x1x1 t-move1x1x1 LA2x2x2 t-move2x2x2 LA
FIG. 5. DMC energy differences (per atom) between two snapshots (MD1and PIMD3 in Fig. 3) as a function of time step, computed with both the LAand the t-move scheme, using the 1 × 1 × 1 or the 2 × 2 × 2 supercell andthe L point.
temperatures, a similar conclusion was drawn in Ref. 23.Here by comparing the total energy differences betweenthe molecular and quasi-atomic states to the benchmarkDMC results, we find that similar effects also exist in thetheoretical description of phase IV. An error compensationbetween the neglect of QNEs and the deficiencies of the PBEexchange-correlation functional should be present in the abinitio MD simulations as reported in earlier studies.34–36
Concerning the benchmark DMC results, we note that thenumbers shown in Fig. 3 are based on supercell simulationscontaining 768 atoms, 20 twists and a diffusion time step of0.05 a.u. We take the energy difference �E between the snap-shots MD1 and PIMD3 in Fig. 3 as an example to show howsuch parameters were chosen. For the time step tests, both thet-move and the LA schemes were used, and for these partic-ular tests we only used the L point. The results are shown inFig. 5. We observe that simulations with both the LA and t-move have the same value for �E in the limit of zero timestep, which indicates that the non-local pseudopotential erroris small. The time step dependency of �E calculated usingboth the t-move and the LA schemes is weak, and �E is con-verged within ∼1 meV/atom up to at least a time step of 0.1a.u. Then we test finite-size errors using the method devel-oped by Chiesa et al.68 In Fig. 6, we display �E as a function
1 10 100Number of twists
30
35
40
45
ΔE /a
tom
(m
eV)
1 10 100
30
35
40
45
1x1x1 supercell2x2x2 supercell3x3x3 supercell4x4x4 supercell
FIG. 6. DMC energy difference (per atom) between two snapshots (MD1and PIMD3 in Fig. 3) as function of number of twists for the 1 × 1 × 1, 2 ×2 × 2, 3 × 3 × 3, and 4 × 4 × 4 supercells.
Reuse of AIP Publishing content is subject to the terms: https://publishing.aip.org/authors/rights-and-permissions. Downloaded to IP: 222.195.68.133 On: Fri, 24 Jun 2016
15:05:48

024501-6 Chen et al. J. Chem. Phys. 141, 024501 (2014)
of the number of twists, also corrected for many-body sizeeffects. This many-body correction turns out to be the samefor the two structures within ∼1 meV/atom using the 1 × 1× 1 (96 atoms) supercell, and essentially identical for the twostructures for the larger system sizes we tested, and thereforehas negligible effects on �E. The simulations were performedusing 1 × 1 × 1, 2 × 2 × 2, 3 × 3 × 3, and 4 × 4 × 4supercells, with a time step of 0.05 a.u. The first twistis the L point, and the energy calculated with the fixed-phase approximation is the same (within a statistical error of0.2 meV/atom) as that computed with the fixed-node approx-imation, which provides a good cross-check of the internalconsistency of the DMC calculations. We note that, becauseof the different ways of treating moves for walkers near thenodal surface, the fixed-node approximation might have dif-ferent time step biases than the fixed-phase approximation. Inthis particular case, however, we have not observed any differ-ence between the two methods. Fig. 6 also shows that this en-ergy difference evaluated with the primitive cells is convergedto within a fraction of 1 meV if we use 60 or more twists. Theresults obtained using a 2 × 2 × 2 supercell show that the en-ergy is converged to well below 1 meV/atom using 20 twistsor more, and that this energy is only about 3 meV/atom higherthan that obtained with the 1 × 1 × 1 supercell. For the 3 × 3× 3 supercell, the energy is almost independent from the num-ber of twists, which shows that the energy obtained with the2 × 2 × 2 supercell is essentially converged. Finally, to com-plete our finite size tests, we performed one calculation witha 4 × 4 × 4 supercell. Given the very large computationalcost of this calculation, we only performed it with the L pointand the fixed-node approximation. Remaining finite-size er-rors with such a big simulation cell are expected to be verysmall, and indeed the the LDA k-point correction �ELDA isonly 0.1 meV/atom. In Fig. 6, we display the result from thiscalculation, which confirms that the results obtained with the2 × 2 × 2 supercell are converged to within 2 meV/atom.
C. Further exploration of the phase diagramand speculations
Now we investigate the temperature and pressure depen-dencies for the stability of the mixed phase. We first acknowl-edge that in order for this exploration of the phase diagramto be convincing, ab initio PIMD simulations based on veryaccurate electronic structures, better justified by the DMC cal-culations explicitly for the specific problem to be addressed,should be performed. In the mean time, when melting or thecompetition between the stability of two solid phases are ofinterest, some special treatment to get rid of the hysteresiseffects or explicit calculations of the free-energy (with anhar-monic contributions from both the thermal and the quantumnuclear effects included) must also be taken care. It is fair tosay that a rigorous treatment of all these issues is presentlybeyond the scope of most computational groups. Here, wehumbly explore this part of the phase diagram using meth-ods we can afford in our simulations, trying to present some“speculations” on how it is like, with limitations of our simu-lations explicitly pointed out.
(a)
0.5 1 1.5 2 2.5r (Å)
0
5
10
15
PC
F
300K400K500K600K
(b)
r (Å)
0
10
20
PC
F
1 2 3
FIG. 7. PCF of the mixed molecular phases at different temperatures withinthe strong molecular layer (panel (a)) and weak molecular layer (panel (b)).The pressure is ∼235 GPa. The legend in panel (a) applies to panel (b).
We start by looking at the temperature dependency forthe stability of phase IV. The method chosen is ab initioMD. When melting is addressed, the two-phase simulationtechnique is also taken in order to get rid of the hysteresiseffects.25, 70, 71 The limitations of these simulations are thatthey are based on PBE functional within DFT for descriptionsof the electronic structures and the classical mechanics forthe nuclear motion. However, we note that such a treatmentis widely used in practice to explore the phase diagram ofhydrogen in earlier studies,25, 34–37 due to a compensation be-tween computational cost and numerical accuracy. In our abinitio MD simulations at T ≥300 K, the structure of this mixedphase IV preserves quite well till melting. This is shown inFig. 7. As the temperature is raised up from 300 to 600 K,the system is solid, the molecular pair in the strong molecularlayer (Fig. 7(a)) persists, and the H–H bond-length does notchange. The only effect of raising the temperature is the incre-ment of the bond-length fluctuations. In the weak molecularlayer (Fig. 7(b)), however, more stories seem to happen. Theintra-molecular bonding of the weak H2 molecules becomesstronger and stronger as the temperature increases which isreflected by a shift of the first peak in the PCF to shorterdistances. In the meanwhile the second peak, correspondingto the shortest inter-molecular distance, starts to disappear,meaning that the graphene-like structure is being destroyedand the mixed molecular phase is likely to melt into a molec-ular liquid.
For a direct test of this indication, we heated up the sys-tem to 800 K. The system melted into a simple molecularliquid with the differences in the weak and strong molecularlayers of the mixed phase completely disappeared. We note,however, that this temperature should be much higher thanthe real melting point due to the existence of the hysteresiseffect. To avoid this, as mentioned, we performed two-phasesimulations,25, 70, 71 where different starting structures withhalf solid and half liquid in coexistence were carefully equili-brated (Fig. 8(a)). The principle is that simulations performedat temperatures above (below) the window of the meltingtemperature result in liquid (solid) phase (Fig. 8(b)). Takingthe simulations at 235 GPa as an example, the black line inFig. 8(b) is the angular integrated PCF of the solid phase(upper inset) at 625 K. This curve corresponds to a typicalmixed molecular solid. The red line is the radial distributionfunction (RDF) of the liquid phase when the same simula-tion is performed at 650 K, a temperature just above the melt-
Reuse of AIP Publishing content is subject to the terms: https://publishing.aip.org/authors/rights-and-permissions. Downloaded to IP: 222.195.68.133 On: Fri, 24 Jun 2016
15:05:48

024501-7 Chen et al. J. Chem. Phys. 141, 024501 (2014)
r (Å)
0
0.5
1
1.5
2
g(r)
(a) (b)
10 2 3 4
FIG. 8. Panel (a): a snapshot of the starting structure for a two-phase MDsimulation. Panel (b): radial distribution function (RDF) of the liquid phaseand angular integrated PCFs of the solid phase. The pressure is 235 GPa andtemperature is 625 K (black line) or 650 K (red line). The insets show thesnapshots of the solid phase (upper inset) and the liquid phase (lower inset)each simulation ended up with.
ing temperature (lower inset). The RDF is characteristic ofa liquid phase. A peak at ∼0.8 Å also suggests that the liq-uid phase is molecular. It is fair to say that this treatment fa-cilitates us to bracket the lower and upper boundaries of themelting temperature which are shown by the up and down tri-angles in the phase diagram in Fig. 9. The mixed phase IVmelts directly into molecular liquid.
In earlier studies, it was already known that the molecularliquid state arrived at after melting further dissociates into anatomic liquid at even higher pressures and temperatures.23, 25
As a step further to explore the neighborhood for the sta-bility of the solid phase IV, the molecular liquid, and thisatomic liquid states, we performed additional simulations forthe melting and the molecular-to-atomic liquid-liquid phase-transitions (LLPT). The melting line was established usingthe two-phase simulation method as described in the earlierparagraph. Then, we increase the temperature and the molec-ular liquid disappears and transforms into an atomic liquid.This is shown in Fig. 10(a), where it is clear that at 235GPa upon increasing the temperature the first peak associ-ated with the intra-molecular H–H bond-length disappears.To precisely locate the position of the dissociation point andidentify the feature of this phase-transition, we follow Ref.23 and simulate the isothermal compression at different tem-peratures. The RDFs obtained from the simulations at differ-ent pressures along the isothermal compression line at 800 K
600 800Pressure (GPa)
0
500
1000
Tem
pera
ture
(K
)
Our melting curveOur LLPTTamblyn et al. (2010)Morales et al. QMC (2010)Morales et al. PBE+MD (2010)Morales et al. vdW-DF2+PIMD (2013)Zha et al. (2013)Chen et al. (2013)
6Pressure (GP
Morales et al. Morales et al. Zha et al. (201
(Chen et al. (20
I
II
III
IVV
0 200 400
Molecularliquid
Molecularsolid
Metallic atomic liquid
Atomic solid
FIG. 9. Phase Diagram of Hydrogen below 950 GPa and 1400 K. Black lineand triangles show the melting temperatures and their lower and upper limitfrom our MD simulation. Red line with circles is the LLPT boundary fromour MD simulation. The point when they merge represents the critical point.Melting curve below 200 GPa (brown line) and above 500 GPa (blue line) arefrom Ref. 74 and Ref. 5. The violet lines show the LLPT transition using dif-ferent methods in Refs. 23 and 24. Phase boundaries separating I, II, III, andIV phases are from Ref. 31. Orange shadowed region indicates the tendencyto transfer from the mixed molecular phase (IV) and to a new one (phase V).
1.4 1.5 1.6 1.7 1.8
V (Å3/atom)
200
250
300
350
P(G
Pa)
500K600K800K
200 250 300Pressure (GPa)
0.2
0.4
0.6
0.8
1
mol
ecul
arfr
actio
n 500K600K800K
1 2 3r (Å)
0.5
1
RD
F
650K750K850K950K
1 2 3r (Å)
0
0.5
1
1.5
RD
F
185GPa210GPa-1210GPa-2235GPa
FIG. 10. Panel (a) is the RDF of the liquid phase at different temperatures at235 GPa. Panels (b)–(d) are results obtained from simulations of the isother-mal compression. Panel (b) shows the evolution of the RDFs with pressure at800 K. Panel (c) shows the isothermal compression curves at 500 K, 600 K,and 800 K. Panel (d) shows the evolution for the fraction of the molecules inthe liquid with compression at 500 K, 600 K, and 800 K. From panels (b)–(d),it is clear that the liquid-liquid phase-transition is first-order.
are plotted in Fig. 10(b). At 185 GPa, a sharp peak at ∼0.75Å indicates that the liquid is molecular. Upon increasing thepressure, at 210 GPa, two different simulations give a molec-ular phase (denoted as 210 GPa-1 in Fig. 10) and an atomicphase (denoted as 210 GPa-2 in Fig. 10), respectively. Thesimulation at 235 GPa gives a clear atomic phase. Therefore,the molecular-to-atomic LLPT is first-order and it happens at210 GPa when T = 800 K. For a more clear representationof this discontinuous feature, we further plot the isothermalcompression curves for T equals 500 K, 600 K, and 800 Kin Fig. 10(c). By monitoring the cliff of the isothermal com-pressibility (Fig. 10(c)), we locate the first-order LLPT at500 K to ∼305 GPa, at 600 K to ∼270 GPa, and at 800 Kto ∼210 GPa. This discontinuous feature and the transitionpoints are further confirmed by the evolutions for the frac-tion of the molecules in the liquid with compression in Fig.10(d). Such a treatment allows us to determine the molecular-to-atomic LLPT curve, as shown by the red curve in Fig. 9.From this figure, it is clear that the triple point between thesolid, molecular liquid, and atomic liquid phases is at 300GPa and 500 K. In Ref. 25, based on simulations of melt-ing and dissociation at P ≤200 GPa, a triple point has beenproposed at 300 GPa and 400 K using linear extrapolation.Here direct simulations for the phase diagram of this regionshow that this linear extrapolation presents a good estimation.We notice that one difference between our simulations andthose in Ref. 25 is that the melting line is simulated usingsolid phase of different structures. In our case it is the mixedphase IV and in their simulations it was a molecular solidon hexagonal close packed lattice. The most important fea-ture in common, however, is that both are based on ab initioMD using PBE functional within DFT for the description ofthe electronic structures. The similar result obtained indicatesthat a triple point around here should be present in theoreticalsimulations with similar methods. Whether this is still true
Reuse of AIP Publishing content is subject to the terms: https://publishing.aip.org/authors/rights-and-permissions. Downloaded to IP: 222.195.68.133 On: Fri, 24 Jun 2016
15:05:48

024501-8 Chen et al. J. Chem. Phys. 141, 024501 (2014)
0.5 1 1.5 2r (Å)
0
1
2
3
4
PC
F
310GPa;Layer 1310GPa;Layer 2330GPa;Layer 1330GPa;Layer 2
FIG. 11. PCFs of the different molecular layers in the ab initio PIMD sim-ulations at 300 K. Black lines: 310 GPa; Red lines: 330 GPa. Layers 1 and2 mean the originally strong and weak molecular layers, respectively. Fromthis figure, it is clear that the mixed phase IV transfers into a new phase atthese pressures with distinctions between the strong and weak molecular lay-ers completely disappear.
in theoretical descriptions using “the” recipe, i.e., ab initioPIMD based on very accurate electronic structures, should bea problem of fundamental importance for future studies.
In the end, we explore the pressure dependency for thestability of phase IV. Isothermally, starting from the mixedmolecular phase IV at 200 GPa and increasing the pressureto 350 GPa, a phase-transition from the mixed molecularphase (Pc) to a weak molecular phase (with Cmca symme-try and 4 atoms in the primitive cell) is observed directly inthe ab initio PIMD simulations. The phase-transition pressureis at ∼300 GPa, beyond which the strong molecular bonds inmixed phase become weaker, while the weak molecular bondsbecome stronger. The final structure at above 300 GPa is a lay-ered weak molecular phase (Cmca).72, 73 In Fig. 11, we showthe PCFs obtained from the ab initio PIMD simulations at310 GPa and 330 GPa. For clarity, we plot the PCFs from theintercalating layers as we have done in Fig. 2. In the mixedphase IV, these layers correspond to the strong and weakmolecular layers, respectively. Therefore, large difference ex-ists between their PCFs. In the equilibrated state we arrived atin these PIMD simulations, however, the difference betweeneven layers and odd layers almost disappears at 310 GPa and330 GPa. In above discussions, we have shown that the defi-ciency of the PBE exchange-correlation functional might un-derestimate the dissociation barrier for the weak molecularlayer. In this case, however, the situation is different in thesense that the resulting structure (Cmca) is weak molecularin both layers instead of being atomic in one of them. As al-ready mentioned, we completely acknowledge that a rigor-ous treatment of the phase-transition at this pressure rangeshould resort to ab initio PIMD simulations based on moreaccurate electronic structure calculations, better justified us-ing the DMC results, which is beyond the computational loadwe can afford nowadays. And in this specific case when thecompetition between the stability of two solid phases is ofinterest, explicit calculation of the free-energy (with anhar-monic contributions from both the thermal and the quantumnuclear effects included) should be performed. Here, we justspeculate that the instability of the mixed phase at increasingpressures indicates that there is a tendency for a solid-solidphase-transition at higher pressures.
IV. CONCLUDING REMARKS
In conclusion, we studied the finite-temperature phase di-agram of hydrogen in the region of phase IV and its neighbor-hood using ab initio MD and ab initio PIMD as the basic tech-niques in this paper. Based on the spatial configurations of thenuclei generated from these simulations, the electronic struc-tures were analyzed using methods like different functionalswithin DFT, the RPA method, and the DMC method. Takingthe state-of-the-art DMC results as benchmark, comparisonsof the energy differences between structures generated fromthe MD and PIMD simulations, with molecular and dissoci-ated hydrogens, respectively, in the weak molecular layers ofphase IV, indicate that standard functionals in DFT underesti-mate the dissociation barrier of the weak molecular layers inthis mixed phase. Because of this underestimation, inclusionof the QNEs in PIMD based on electronic structures gener-ated from these calculations leads to artificially dissociatedhydrogen layers in phase IV. Therefore, an error compensa-tion between the neglect of QNEs and the deficiencies of thesefunctionals in standard ab initio MD simulations should ex-ist. Partly because of this error compensation, ab initio MDsimulations complement the experimental observations of thisphase IV pretty well in the earlier studies. Using a combina-tion of these molecular simulation techniques, as well as thetwo-phase simulation method, the temperature and pressuredependencies for the stability of phase IV were also discussedin the end, with their results compared with those from earlierstudies.
ACKNOWLEDGMENTS
J.C., X.Z.L., and E.W. are supported by the NationalBasic Research Programs of China under Grant No.2013CB934600, the National Science Foundation ofChina under Grant Nos. 11275008, 91021007, 11274012,11174006, and the Open-Lab program (Project No. 12ZS01)of the Key Laboratory of Nanodevices and Applica-tions, Suzhou Institute of Nano-Tech and Nano- Bionics(SINANO), Chinese Academy of Sciences. X.Z.L. wouldlike to thank R. J. Needs, C. J. Pickard, M. I. J. Probert, andA. Michaelides for helpful discussions. The computationalresources were provided by the supercomputer TianHe-1Ain Tianjin, China. The QMC calculations were performed onthe U.K. national facility ARCHER.
1E. Wigner and H. B. Huntington, J. Chem. Phys. 3, 764 (1935).2N. W. Ashcroft, Phys. Rev. Lett. 21, 1748 (1968).3P. Cudazzo et al., Phys. Rev. Lett. 100, 257001 (2008).4E. Babaev, A. Sudbo, and N. W. Ashcroft, Nature (London) 431, 666(2004).
5J. Chen et al., Nature Commun. 4, 2064 (2013).6H. K. Mao and R. J. Hemley, Rev. Mod. Phys. 66, 671 (1994).7P. Loubeyre, F. Occelli, and R. LeToullec, Nature (London) 416, 613(2002).
8C. S. Zha, Z. X. Liu, and R. J. Hemley, Phys. Rev. Lett. 108, 146402 (2012).9L. Dubrovinsky, N. Dubrovinskaia, V. B. Prakapenka, and A. M. Abaku-mov, Nature Commun. 3, 1163 (2012).
10E. Goncharov, A. F. Gregoryanz, R. J. Hemley, and H. K. Mao, Proc. Natl.Acad. Sci. U.S.A. 98, 14234 (2001).
11M. Hanfland, R. J. Hemley, and H. K. Mao, Phys. Rev. Lett. 70, 3760(1993).
Reuse of AIP Publishing content is subject to the terms: https://publishing.aip.org/authors/rights-and-permissions. Downloaded to IP: 222.195.68.133 On: Fri, 24 Jun 2016
15:05:48

024501-9 Chen et al. J. Chem. Phys. 141, 024501 (2014)
12C. J. Pickard and R. J. Needs, Nat. Phys. 3, 473 (2007).13H. Kitamura, S. Tsuneyuki, T. Ogitsu, and T. Miyake, Nature (London)
404, 259 (2000).14P. Tolédano, H. Katzke, A. F. Goncharov, and R. J. Hemley, Phys. Rev.
Lett. 103, 105301 (2009).15J. Kohanoff, S. Scandolo, S. de Gironcoli, and E. Tosatti, Phys. Rev. Lett.
83, 4097 (1999).16M. Städele and R. M. Martin, Phys. Rev. Lett. 84, 6070 (2000).17X. Z. Li et al., J. Phys.: Condens. Matter 25, 085402 (2013).18S. T. Weir, A. C. Mitchell, and W. J. Nellis, Phys. Rev. Lett. 76, 1860
(1996).19W. J. Nellis, S. T. Weir, and A. C. Mitchell, Science 273, 936 (1996).20W. Nellis et al., Philos. Trans. Ser. A-Math. Phys. Eng. Sci. 356, 119
(1998).21S. Scandolo, Proc. Natl. Acad. Sci. U.S.A. 100, 3051 (2003).22K. T. Delaney, C. Pierleoni, and D. M. Ceperley, Phys. Rev. Lett. 97,
235702 (2006).23M. A. Morales, C. Pierleoni, E. Schwegler, and D. M. Ceperley, Proc. Natl.
Acad. Sci. U.S.A. 107, 12799 (2010).24M. A. Morales et al., Phys. Rev. Lett. 110, 065702 (2013).25S. A. Bonev, E. Schwegler, T. Ogitsu, and G. Galli, Nature (London) 431,
669 (2004).26S. A. Bonev, B. Militzer, and G. Galli, Phys. Rev. B 69, 014101
(2004).27S. Deemyad and I. F. Silvera, Phys. Rev. Lett. 100, 155701 (2008).28M. I. Eremets and I. A. Troyan, Nat. Mater. 10, 927 (2011).29R. T. Howie et al., Phys. Rev. Lett. 108, 125501 (2012).30M. I. Howie, T. Scheler, C. L. Guillaume, and E. Gregoryanz, Phys. Rev. B
86, 214104 (2012).31C. S. Zha et al., Phys. Rev. Lett. 110, 217402 (2013).32C. S. Zha, R. E. Cohen, H. K. Mao, and R. J. Hemley, Proc. Natl. Acad.
Sci. U.S.A. 111, 4792 (2014).33C. J. Pickard, M. Martinez-Canales, and R. J. Needs, Phys. Rev. B 85,
214114 (2012).34H. Y. Liu, L. Zhu, W. W. Cui, and Y. M. Ma, J. Chem. Phys. 137, 074501
(2012).35H. Y. Liu and Y. M. Ma, Phys. Rev. Lett. 110, 025903 (2013).36A. F. Goncharov et al., Phys. Rev. B 87, 024101 (2013).37I. B. Magdau and G. J. Ackland, Phys. Rev. B 87, 174110 (2013).38M. A. Morales et al., Phys. Rev. B 87, 184107 (2013).39D. Marx and M. Parrinello, Z. Phys. B 95, 143 (1994).40D. Marx and M. Parrinello, J. Chem. Phys. 104, 4077 (1996).41Q. F. Zhang et al., Phys. Rev. Lett. 101, 215902 (2008).42X. Z. Li, M. I. J. Probert, A. Alavi, and A. Michaelides, Phys. Rev. Lett.
104, 066102 (2010).
43X. Z. Li, B. Walker, and A. Michaelides, Proc. Natl. Acad. Sci. U.S.A. 108,6369 (2011).
44J. Chen et al., Phys. Chem. Chem. Phys. 15, 6344 (2013).45J. Klimés, D. R. Bowler, and A. Michaelides, J. Phys.: Condens. Matter 22,
022201 (2010).46J. Klimés, D. R. Bowler, and A. Michaelides, Phys. Rev. B 83, 195131
(2011).47J. Klimés and A. Michaelides, J. Chem. Phys. 137, 120901 (2012).48M. Dion et al., Phys. Rev. Lett. 92, 246401 (2004).49J. Heyd, G. E. Scuseria, and M. Ernzerhof, J. Chem. Phys. 124, 219906
(2006).50X. Ren, P. Rinke, C. Joas, and M. Scheffler, J. Mater. Sci. 47, 7447 (2012).51J. Harl and G. Kresse, Phys. Rev. B 77, 045136 (2008).52J. Harl and G. Kresse, Phys. Rev. Lett. 103, 056401 (2009).53R. J. Needs, M. D. Towler, N. D. Drummond, and R. López, J. Phys.: Con-
dens. Matter 22, 023201 (2010).54W. M. C. Foulkes, L. Mitáš, R. J. Needs, and G. Rajagopal, Rev. Mod.
Phys. 73, 33 (2001).55G. Kresse and J. Furthmuller, Phys. Rev. B 54, 11169 (1996).56J. P. Perdew, K. Burke, and M. Ernzerhof, Phys. Rev. Lett. 77, 3865 (1996).57G. J. Martyna, M. L. Klein, and M. Tuckerman, J. Chem. Phys. 97, 2635
(1992).58J. R. Trail and R. J. Needs, J. Chem. Phys. 122, 014112 (2005).59J. R. Trail and R. J. Needs, J. Chem. Phys. 122, 174109 (2005).60J. Ma, D. Alfè, A. Michaelides, and E. G. Wang, J. Chem. Phys. 130,
154303 (2009).61J. Ma, D. Alfè, and A. Michaelides, J. Chem. Phys. 134, 134701 (2011).62B. Santra et al., Phys. Rev. Lett. 107, 185701 (2011).63M. J. Gillan, F. R. Manby, M. D. Towler, and D. Alfè, J. Chem. Phys. 136,
244105 (2012).64P. Giannozzi et al., J. Phys.: Condens. Matter 21, 395502 (2009).65D. Alfè and M. J. Gillan, Phys. Rev. B 70, 161101(R) (2004).66L. Mitáš, E. L. Shirley, and D. M. Ceperley, J. Chem. Phys. 95, 3467
(1991).67M. Casula, Phys. Rev. B 74, 161102 (2006).68S. Chiesa, D. M. Ceperley, R. M. Martin, and M. Holtzmann, Phys. Rev.
Lett. 97, 076404 (2006).69C. Lin, F. H. Zong, and D. M. Ceperley, Phys. Rev. E 64, 016702 (2001).70T. Ogitsu, E. Schwegler, F. Gygi, and G. Galli, Phys. Rev. Lett. 91, 175502
(2003).71D. Alfe, Phys. Rev. B 68, 064423 (2003).72S. Azadi, W. M. C. Foulkes, and T. D. Kühne, New J. Phys. 15, 113005
(2013).73S. Azadi and W. M. C. Foulkes, Phys. Rev. B 88, 014115 (2013).74I. Tamblyn and S. A. Bonev, Phys. Rev. Lett. 104, 065702 (2010).
Reuse of AIP Publishing content is subject to the terms: https://publishing.aip.org/authors/rights-and-permissions. Downloaded to IP: 222.195.68.133 On: Fri, 24 Jun 2016
15:05:48