on the spectral evolution of cool, helium-atmosphere …astro-ph/0703758v1 29 mar 2007 on the...
TRANSCRIPT
arX
iv:a
stro
-ph/
0703
758v
1 2
9 M
ar 2
007
On the Spectral Evolution of Cool, Helium-Atmosphere
White Dwarfs: Detailed Spectroscopic and Photometric
Analysis of DZ Stars
P. Dufour1, P. Bergeron1, James Liebert2, H. C. Harris3, G.R. Knapp4, S.F. Anderson5,
Patrick B. Hall6, Michael A. Strauss4, Matthew J. Collinge4, and Matt C. Edwards4
ABSTRACT
We present a detailed analysis of a large spectroscopic and photometric sample
of DZ white dwarfs based on our latest model atmosphere calculations. We revise
the atmospheric parameters of the trigonometric parallax sample of Bergeron,
Leggett, & Ruiz (12 stars) and analyze 147 new DZ white dwarfs discovered
in the Sloan Digital Sky Survey. The inclusion of metals and hydrogen in our
model atmosphere calculations leads to different atmospheric parameters than
those derived from pure helium models. Calcium abundances are found in the
range from log (Ca/He) = −12 to −8. We also find that fits of the coolest
objects show peculiarities, suggesting that our physical models may not correctly
describe the conditions of high atmospheric pressure encountered in the coolest
DZ stars. We find that the mean mass of the 11 DZ stars with trigonometric
parallaxes, 〈M〉 = 0.63 M⊙, is significantly lower than that obtained from pure
helium models, 〈M〉 = 0.78 M⊙, and in much better agreement with the mean
mass of other types of white dwarfs. We determine hydrogen abundances for 27%
of the DZ stars in our sample, while only upper limits are obtained for objects
with low signal-to-noise ratio spectroscopic data. We confirm with a high level of
1Departement de Physique, Universite de Montreal, C.P. 6128, Succ. Centre-Ville, Montreal, Quebec,
Canada H3C 3J7; [email protected], [email protected]
2Steward Observatory, University of Arizona, 933 North Cherry Avenue, Tucson, AZ 85721;
3US Naval Observatory, P.O. Box 1149, Flagstaff, AZ 86002-1149; [email protected]
4Princeton Univ. Obs., Peyton Hall,Princeton, NJ 08544; [email protected]
5Department of Astronomy, University of Washington, Box 351580, Seattle, WA 98195; ander-
6Department of Physics and Astronomy, York University, 128 Petrie Science and Engineering Building,
4700 Keele Street, Toronto, ON M3J 1P3, Canada
– 2 –
confidence that the accretion rate of hydrogen is at least two orders of magnitude
smaller than that of metals (and up to five in some cases) to be compatible with
the observations. We find a correlation between the hydrogen abundance and
the effective temperature, suggesting for the first time empirical evidence of a
lower temperature boundary for the hydrogen screening mechanism. Finally, we
speculate on the possibility that the DZA white dwarfs could be the result of the
convective mixing of thin hydrogen-rich atmospheres with the underlying helium
convection zone.
Subject headings: stars: abundances – stars: atmospheres – stars: evolution –
white dwarfs
1. INTRODUCTION
Cool helium-rich white dwarfs showing traces of heavy elements (other than carbon) in
their optical spectra are collectively known as DZ stars (stars with Teff ≥ 12, 000 K show
He i lines and are thus classified DBZ stars). They are easily recognized by the presence of
the strong resonance Ca ii H & K doublet in the optical and sometimes Ca i λ4226, Mg i
λ3835 or Fe i λ3730 (see Sion et al. 1990a, Wesemael et al. 1993, and Harris et al. 2003 for
representative spectra).
Analyses of DZ white dwarfs were pioneered by Weidemann (1960), Wegner (1972), and
Grenfell (1974), who were the first to analyze the classical DZ stars vMa2, Ross 640, and
L745-46A using model atmosphere calculations to reproduce the optical spectrum. Other
important analyses of DZ stars relying on optical data only include those of Liebert (1977),
Wehrse & Liebert (1980), Kapranidis & Liebert (1986), Liebert et al. (1987), Sion et al. (1990b),
and Dufour et al. (2006). Further progress in our understanding of these stars has also
been achieved from ultraviolet observations with the International Ultraviolet Explorer (IUE)
by Cottrell & Greenstein (1980a), Cottrell & Greenstein (1980b), Zeidler-K.T. et al. (1986),
Weidemann & Koester (1989), and Koester et al. (1990), and with the Hubble Space Tele-
scope (HST) by Koester & Wolff (2000) and Wolff et al. (2002). The UV region of the energy
distribution is most useful for a detailed abundance analysis of elements with no strong res-
onance lines in the optical, and thus most of our current knowledge of DZ stars comes from
UV observations.
Since the heavy elements present in the atmospheric regions sink below the photosphere
in a timescale much shorter than the white dwarf cooling time (Paquette et al. 1986), the
presence of metals in DZ stars must be explained in terms of episodic accretion from the

– 3 –
interstellar medium, a model put on a more quantitative basis in a series of papers by
Dupuis et al. (1992, 1993a,b). Following the discussion by Koester & Wolff (2000), the most
notable problem with this scenario is the low hydrogen abundances observed in these objects.
Being the lightest element, hydrogen should only accumulate in the atmospheric regions of
the star over time, but the observed abundances (or limits in some cases) indicate that the
hydrogen accretion rate must be at least two orders of magnitude lower than that of metals
(Wolff et al. 2002; Dupuis et al. 1993b). This conclusion is based on a relatively small sample
of DBZ/DZ stars, albeit this was the largest homogeneous data set available at that time,
and the analysis of a larger sample is required to advance our understanding of the accretion
problem in cool DZ stars. Such a large sample has recently become available, thanks to
the discovery of hundreds of new DZ white dwarfs by the Sloan Digital Sky Survey (SDSS,
York et al. 2000; see Harris et al. 2003, for typical SDSS DZ spectra). Since these spectra
cover only the optical range, their analysis will be restricted to the determination of the
calcium and hydrogen abundances, since UV observations of these faint (17 ≤ g ≤ 21) SDSS
stars will not be possible in the near future. Nevertheless, the addition of these new objects
will allow a clear picture to be drawn of the chemical evolution of white dwarf stars and
to improve the statistical significance of earlier results since, to our knowledge, only 17 DZ
stars with both Teff and Ca/He measurements are found in the literature.
One of the goals of the theory of spectral evolution is to explain quantitatively the chem-
ical evolution of cool white dwarfs. For instance, the ratio of hydrogen- to helium-dominated
atmospheres is observed to vary significantly over the white dwarf cooling sequence, indi-
cating the existence of a physical mechanism to convert one type into another. Moreover,
the spectroscopic features observed in helium-rich white dwarfs vary quite significantly with
temperature from the DB spectral type to the cooler DQ, DC, and DZ types. The exact
reason for this evolution into either of these types is still not fully understood. To complicate
the picture even further, in a fraction of cool DA stars, the upper hydrogen layers is expected
to convectively mix with the underlying helium layers to form helium-rich atmosphere white
dwarf stars.
Recently, Bergeron, Ruiz, & Leggett (1997) and Bergeron, Leggett, & Ruiz (2001, here-
after referred to as BRL97 and BLR01, respectively) analyzed the energy distributions of
a large sample of cool white dwarfs with the aim of improving our understanding of their
chemical evolution. Among their sample, we find several DZ stars that were analyzed un-
der the assumption of pure helium compositions, the only models available at that time.
Dufour et al. (2005) showed that the analysis of the energy distribution of DQ stars based
on pure helium models overestimates the effective temperature compared to that obtained
from models including carbon. This effect is due to an increase of the He− free-free opacity
resulting from the additional free electrons from carbon. A similar effect is thus expected in

– 4 –
the case of DZ white dwarfs. In this paper, we first include explicitly the presence of metals
in our model atmosphere calculations and reanalyze the available photometric and spectro-
scopic data of DZ stars from BRL97 and BLR01. We then present a similar analysis of a much
larger sample of DZ stars discovered in the SDSS (Gunn et al. 1998, 2006; Pier et al. 2003;
Tucker et al. 2006; Stoughton et al. 2002; Abazajian et al. 2003; Adelman-McCarthy et al.
2006). In § 2, we describe the observations. Our theoretical framework including our model
atmosphere and synthetic spectrum calculations are presented in § 3. The detailed analysis
follows in § 4, and the results are interpreted and discussed in § 5. Our conclusions are
summarized in § 6.
2. OBSERVATIONS
The first sample used for this study is drawn from the BRL97 and BLR01 analyses,
which include 12 DZ stars with optical BV RI and infrared JHK photometry as well as
trigonometric parallax measurements, with the exception of ESO 445-271 (WD 1338−311),
for which the parallax and JHK measurements are not available. The photometric data
can be found in Tables 1 of BRL97 and BLR01. Our analysis also relies on spectroscopic
observations taken from various sources. New high signal-to-noise ratio (S/N) spectroscopic
observations at a resolution of ∼ 6 A FWHM, covering the Ca ii H & K doublet region
have been secured with the Mont Megantic Observatory 1.6 m telescope in 2004 September
(WD 0046+051, WD 0802+386, WD 1626−368, and WD 1705+030) and with the Steward
Observatory 2.3 m telescope in 2004 May (WD 2251−070 and WD 2312−024). Optical spec-
tra for the remaining stars were secured by BRL97 and BLR01 (details of the observations
are provided in these references).
Our second sample consists of DZ white dwarfs spectroscopically identified in the SDSS.
We selected all DZ stars from the First and Fourth Data Release white dwarf catalogs
(Kleinman et al. 2004; Eisenstein et al. 2006). These catalogs are not complete in any way
(see below) and several more DZ white dwarfs are certainly present in the SDSS archive.
Additional DZ stars have also been added to our list as they were discovered serendipitously
by examination of the SDSS spectroscopic archive. Our final sample consists of 147 SDSS
DZ stars with spectra covering the 3800−9200 A region at a resolution of ∼ 3 A FWHM.
Also available are SDSS photometric observations on the ugriz system (Fukugita et al. 1996;
Hogg et al. 2001; Smith et al. 2002; Ivezic et al. 2004). Combining the two data sets, we have
a large sample of 159 DZ white dwarfs that can be analyzed in a homogeneous fashion. This is
a considerably larger sample than the 17 DZ stars with both Teff and Ca/He determinations
analyzed by various groups in the last ∼50 years or so.

– 5 –
3. MODEL ATMOSPHERE AND SYNTHETIC SPECTRUM
CALCULATIONS
Our LTE model atmosphere code is similar to that described in Dufour et al. (2006)
for the study of the DZ white dwarf G165-7. It is based on a modified version of the code
described at length in Bergeron et al. (1995), which is appropriate for pure hydrogen and pure
helium atmospheric compositions, as well as mixed hydrogen and helium compositions, while
energy transport by convection is treated within the mixing-length theory. One important
modification is that metals and molecules are now included in the equation-of-state and
opacity calculations (see Dufour et al. 2005, 2006, for details). As was the case for DQ stars,
He− free-free absorption is found to be the dominant source of opacity in DZ stars. It is thus
important to account for all possible sources of electrons in the equation-of-state, and we have
included here all elements with Z ≤ 26. The chemical abundances cannot be determined
individually, however, since most of these elements are not observed spectroscopically. We
thus initially assume that the relative abundances are consistent with solar ratios; this is a
reasonable assumption, at least for the observed elements, according to our analysis of G165-
7 (Dufour et al. 2006) and that of Wolff et al. (2002) for several DZ stars (see their Fig. 7).
We show below that this assumption is not very critical for our atmospheric parameter
determinations.
More critical is the assumed hydrogen abundance for stars not showing Hα absorption.
To explore this issue, we calculated 4 grids with respectively log (H/He) = −3, −4, −5, and
−30 respectively. Our model grids cover a range of atmospheric parameters from Teff = 4000
to 12,000 K in steps of 500 K at a fixed value of log g = 8, and log (Ca/He) = −12 to −7
in steps of 0.5 dex, while the relative abundances of all elements heavier than helium are set
with respect to the calcium abundance in solar ratios. These assumptions will need to be
verified a posteriori. We also calculated a smaller grid with log (H/He) = −6, Teff = 9000 to
12,000 K, and log (Ca/He) = −11 to −8 (with identical steps as above). In order to assess the
influence of the Lyα line wing opacity, we calculated an additional grid with log (H/He) = −3
including the Lyα profile calculations described in Koester & Wolff (2000), kindly made
available to us by D. Koester (2005, private communication). To take into account, in an
approximate fashion, the non-ideal effects on heavy elements, we also calculated models at
log (H/He) = −5 with the occupation probability formalism of Hummer & Mihalas (1988).
This formalism may not be adequate for stars with extremely high atmospheric pressure,
however (see, e.g., Saumon et al. 1995), and it is used mainly to allow a better comparison
with other models in the literature (Koester & Wolff 2000; Wolff et al. 2002). Finally, we
computed additional models with different relative abundances of metals and values of log g,
to explore the sensitivity of our results to these assumptions.

– 6 –
In addition to the increased He− free-free continuum opacity, important metal absorp-
tion features in the ultraviolet may potentially affect the energy distributions and thus the
atmospheric structures compared to those obtained from pure helium models. Thus, over
4000 of the strongest metal lines — ∼ 2600 lines from Fe i alone — are included explic-
itly in both the model and synthetic spectrum calculations. These lines are selected by
taking all lines contributing more than one tenth of the He− free-free opacity in the range
τR = 0.1 − 1.0 from several models at log Ca/He = −7 and Teff between 5000 and 12,000
K. We are confident that this line list includes all the important contributors to the atomic
opacity, since spectra calculated by increasing the number of lines by an order of magnitude
did not have any detectable effect on the emergent spectrum. The line absorption coefficient
is calculated using a Voigt profile for every line at every depth point. The line broadening is
treated within the impact approximation with van der Waals broadening by neutral helium.
Central wavelengths of the transitions, gf values, energy levels, and damping constants are
extracted from the GFALL line list of R. L. Kurucz1.
Illustrative spectra from our model grid at log g = 8 are displayed in Figure 1 for various
values of the effective temperature, metal, and hydrogen abundances. We first notice that
large hydrogen abundances of log (H/He) ∼ −3 lead to a reduction of the width and depth of
the Ca ii H & K doublet compared to hydrogen-free models. This can be explained in terms
of the increased He− free-free opacity produced by the free electrons coming from hydrogen
when its abundance is sufficiently large, which actually outnumber the contribution from
metals. Since the pressure gradient is inversely proportional to the Rosseland mean opacity,
an increase in the opacity results in a drop of the atmospheric pressure and corresponding
pressure broadening of the atomic lines. The competition between metals and hydrogen
as electron donors is illustrated in Figure 1 by comparing spectra at Teff = 9000 K with
log (Ca/He) = −8.0 and −10.0. The effect of the presence of hydrogen in the latter case can
already be observed at log (H/He) = −5, while the contribution of hydrogen can only be
seen at much larger abundances in the log (Ca/He) = −8.0 model. At 12,000 K, the effect is
less pronounced since the contribution from helium to the free electrons becomes significant,
and models with log (H/He) = −5 are practically identical to those without hydrogen. At
log (H/He) = −3, hydrogen becomes the principal electron donor at 12,000 K (note also
the presence of Hδ at 4101 A). Of course, if one is interested in the determination of the
hydrogen abundance in this temperature range, direct observations at Hα are certainly more
useful since this line can be detected for hydrogen abundances as low as log (H/He) ∼ −5
at Teff = 10, 000 K (not shown here).
1see http://kurucz.harvard.edu/LINELISTS.html

– 7 –
At lower effective temperatures, the hydrogen abundance can be directly determined
through Hα only when the line is spectroscopically visible, which occurs at relatively large
abundances — approximately log (H/He) ∼ −3 at 6500 K and log (H/He) ∼ −6 near 10,000
K. However, in the intermediate temperature range between Teff = 6000 and 8500 K, the
hydrogen abundance can be determined indirectly from observations of the core depth and
wing profiles of the Ca ii H & K doublet, as demonstrated with the 7500 K spectra shown in
Figure 1. At lower temperatures, the effect of hydrogen on the synthetic spectrum becomes
less important since the low ionization potential of metals relative to hydrogen favors the
contribution of free electrons from metals rather than hydrogen. Finally, metallic absorption
features become very strong at low effective temperatures (Teff ∼ 6000 K) for abundances
typical of those found in hotter DZ stars, log(Ca/He) ∼ −8.0, producing objects similar to
the unique DZ star G165-7. Also at low effective temperatures, collision induced absorption
(CIA) by molecular hydrogen quickly dominates the infrared opacity, providing a severe
constraint on the presence of hydrogen (see below).
4. DETAILED ANALYSIS
4.1. Atmospheric Parameter Determination
The method used to fit the photometric and spectroscopic data is similar to that de-
scribed at length in Dufour et al. (2005) and Dufour et al. (2006). Briefly, we first estimate
the effective temperature of the star by fitting the global energy distribution as provided
by the BV RI and JHK (or ugriz for SDSS stars) photometric observations. The fitting
procedure relies on the nonlinear least-squares method of Levenberg-Marquardt (Press et al.
1992). Here, both Teff and the solid angle π(R/D)2, which relates the flux at the surface of
the star to that received at Earth, are considered free parameters (R is the radius of the star
and D its distance from Earth). Since the temperature obtained from the energy distribu-
tion depends on the assumed chemical composition, we use the spectroscopic observations to
constrain the metal abundances. We thus assume the Teff value obtained from the photome-
try and determine the chemical composition by fitting the Ca ii H & K doublet region with
our grid of synthetic spectra. We also measure the hydrogen abundance by fitting the Hα
absorption line if present; otherwise, we proceed at a fixed value of log (H/He) (see below).
A new estimate of the effective temperature is then obtained by fitting the photometric ob-
servations with models interpolated at the metal and hydrogen abundances determined from
the spectroscopic fit (all metal abundances are assumed solar with respect to calcium). The
procedure is then iterated until the atmospheric parameters have converged to a consistent
photometric and spectroscopic solution.

– 8 –
For 11 DZ stars with known distances obtained from trigonometric parallax measure-
ments, we can obtain the radius of the star from the solid angle from our modelling, which
in turn can be converted into log g (or mass) using evolutionary models similar to those
described in Fontaine et al. (2001) but with C/O cores, q(He) ≡ logMHe/M⋆ = 10−2, and
q(H) = 10−10, which are representative of helium-atmosphere white dwarfs2.
4.2. Reappraisal of the BRL97 and BLR01 analyses
We begin by re-evaluating the atmospheric parameters of the 12 DZ stars in the BRL97
and BLR01 samples using our new models that incorporate metals. In addition to the con-
tribution of metals as electron donors in the atmospheres of DZ stars, the contribution from
hydrogen also needs to be properly evaluated. Hydrogen abundances can be determined
directly from spectroscopic observations for only three stars in our sample, namely Ross 640,
L745-46A, and G165-7, which explicitly show Hα. For the remaining DZ stars, upper limits
on the hydrogen abundance can be obtained from the absence of a detectable Hα feature, or
for the coolest stars, from the infrared energy distribution, since the CIA opacity becomes
particularly important in a mixed H/He atmosphere due to the collisions of H2 with neutral
helium. The assumed hydrogen abundance for the analysis of DZ stars is more important
than it was for DQ stars (see Dufour et al. 2005) because the high carbon abundances (rel-
ative to hydrogen) in DQ stars make hydrogen a minor contributor to the total electron
population. The uncertainties of our atmospheric parameter determination introduced by
the use of models with various hydrogen abundances is discussed at length below.
For DZ stars showing Hα (the DZA stars), we use the observed line profile to determine
log (H/He), log (Ca/He), and Teff in a consistent manner as described above. When Hα
is not detected spectroscopically, we fit each star with log (H/He) fixed at −30, −5, −4,
and −3, and carefully examine each solution and reject those that predict a detectable Hα
absorption feature given the S/N of each spectrum. We also reject solutions that predict
an infrared flux deficiency due to the CIA opacity that is incompatible with the observed
photometry at JHK. As discussed above (see Fig. 1), we find some cases where the Ca ii
H & K lines (core and/or wings) are better reproduced with models including a trace of
hydrogen. This is a direct consequence of the increased opacity (more free electrons from
hydrogen), which reduces the atmospheric pressure, producing narrower line profiles. Note
that the surface gravity may also affect the atmospheric pressure, but models calculated at
log g = 8.0± 0.25 reveal that the Ca ii H & K line wings are not as strongly affected.
2see http://www.astro.umontreal.ca/∼bergeron/CoolingModels/

– 9 –
Figure 2 and 3 illustrate examples of solutions with various hydrogen abundances for the
DZ stars WD 1705+030 and WD 2312−024, where we can clearly see that the solutions with
log (H/He) = −3 and −4, respectively, provide a better match to the observed calcium lines
than do models without hydrogen. Such indirect hydrogen abundance determinations are
inherently more uncertain than a direct determination through the Hα line profile, however,
since it is possible for elements spectroscopically invisible to contribute to the number of
free electrons in a significant way. Thus for those particular stars with no detectable Hα, we
obtain new atmospheric parameters by fitting explicitly the Ca ii H & K profiles, but this
time by considering the hydrogen abundance as a free parameter in our fitting procedure.
We present in Table 1 our atmospheric parameter determinations (effective temperature,
surface gravity, stellar mass, and calcium abundance) for the BRL97 and BLR01 samples.
Quantities in parentheses represent the formal 1σ uncertainties of each parameter obtained
from our fitting procedure, with the exception of log g and the mass, for which the uncertain-
ties are obtained by propagating the error of the trigonometric parallax measurement. Note
that these formal errors are relatively small for some log (Ca/He) and log (H/He) values, and
this certainly does not reflect the true uncertainties. Indeed, the values given here represent
only the formal internal uncertainties of the fitted atmospheric parameters obtained from
the covariance matrix (see Press et al. 1992 for details). We find, from visual inspection,
that changing the abundance by about 0.2 dex still gives adequate fits. We thus estimate in-
stead that an uncertainty of ±0.2 dex is probably more realistic (except for the coolest stars,
see below). A similar conclusion was reached by Provencal et al. (2002, see their Fig. 6) in
the case of Procyon B. To bracket the possible range of solutions for stars whose hydrogen
abundance could not be determined directly or indirectly, we provide two solutions in Table
1, one with the maximum amount of hydrogen allowed by the photometric and spectroscopic
observations, and the other solution without any hydrogen (“no H” in Table 1). However,
Wolff et al. (2002) found, on the basis of their analysis of UV observations, that hydrogen
is present in virtually all white dwarfs in their sample. We thus believe that one should not
artificially separate the DZ stars showing traces of hydrogen (the DZA stars) from those
showing no hydrogen features, since this distinction is mostly due to the level of visibility of
hydrogen and the S/N of the spectra. Hence, our solutions that include hydrogen in Table
1 are probably more realistic.
The corresponding fits to the BV RI and JHK photometric observations and calcium
lines are displayed in Figures 4 and 5. To our knowledge, the calcium abundances for the DZ
stars WD 0552−041 (G99-44), WD 1313−198 (LHS 2710), WD 1338−311 (ESO 445-271),
WD 1705+030 (G139-13), and WD 2345−447 (ESO 292-43) are determined here for the first
time. Some stars deserve additional comments:

– 10 –
WD 0046+051 (vMa 2): Our solution, Teff = 6220 K, log (Ca/He) = −10, and log (H/He) =
−3.19, differs slightly from that obtained byWolff et al. (2002), Teff = 5700 K, log (Ca/He) =
−10.65, and log (H/He) = −5. Their solution requires a small trace of hydrogen in order
to reproduce the IUE flux level, which is reduced significantly by their improved Lyα line
profile calculations. Our hydrogen abundance determination, on the other hand, is obtained
indirectly from the Ca ii H & K profiles. If we assume instead a value of log (H/He) =
−5, we find Teff = 6010 K, log (Ca/He) = −10.65, closer to the Wolff et al. solution,
although our fits to the calcium line cores and wings are not as satisfactory with this smaller
hydrogen abundance. Note that Wolff et al. also include non-ideal effects using the Hummer-
Mihalas occupation probability formalism. To evaluate the effects of the different input
physics between the two sets of models, we calculated a single model with the Wolff et
al. atmospheric parameters by also including the Hummer-Mihalas formalism for metals
and the same Lyα theoretical profiles. Our best fit to this single model with our original
grid at log (H/He) = −3 yields Teff = 6147 K and log (Ca/He) = −10.48, close to our
original estimate of the effective temperature. In other words, had we calculated a full grid
with the Hummer-Mihalas occupation probability formalism, we would probably have found
atmospheric parameters close to that obtained by Wolff et al. (2002). Hence the differences
between both solutions can be partially explained in terms of the small differences in the
input physics.
WD 0552−041 (LP 658-2): Wolff et al. (2002) obtain a better match to Faint Object Spec-
trograph (FOS) observations by including a small trace of hydrogen of H/He= 5 × 10⁻⁴,
but they do this at Teff = 5050 K, the effective temperature obtained by BLR01 under
the assumption of a pure helium composition. Metals must have an influence on both the
temperature structure and UV absorptions that are not taken into account in the BLR01
solution. Our iterative procedure does indeed suggest a much lower effective temperature
for this object, Teff ∼ 4300 K. Note that at this temperature, JHK photometry would be
affected by the collision induced opacity (not included in Wolff et al. 2002) if log (H/He) is
higher than ∼ −5. Our metal abundance is obtained from the extremely weak Ca ii H & K
lines. However, our solution also predicts a strong Ca i λ4226 line that is not observed spec-
troscopically. We can only speculate at this point on the reason for this discrepancy. One
possibility is that neutral calcium could be pressure ionized under the extreme conditions
found in this star, although it is strange to see a strong Ca i λ4226 feature in WD 2251−070,
a DZ star with presumably even higher photospheric pressures. We were also not able to
achieve an acceptable fit using Koester’s Lyα profiles or the occupation probability formal-
ism in our model calculations. A good fit to both sets of lines is possible only by changing
the effective temperature in such a way that the photometric fit is no longer acceptable.
Clearly, more effort in the modeling of high atmospheric pressure white dwarfs is required.

– 11 –
WD 0738−172 (L745-46A), WD 1626+368 (Ross 640): Our solutions for these stars, Teff =
7590 K, log (Ca/He) = −10.91 and Teff = 8440 K, log (Ca/He) = −8.83, respectively, are
very close to those obtained by Koester & Wolff (2000), Teff = 7500 K, log (Ca/He) = −10.6
and Teff = 8500 K, log (Ca/He) = −8.65, respectively. The latter were obtained from fits to
the Ca ii lines and from FOS spectra. In order to reproduce the observed fluxes in the UV,
Wolff et al. had to include their improved Lyα theoretical calculations. Although our models
do not include this opacity and fail to reproduce the UV fluxes, our atmospheric parameters
do not differ significantly from those of Wolff et al. The reason for this result is that the
UV flux absorbed by the Lyα wings represents only a small fraction of the total flux, and
its redistribution to other wavelengths affects the thermodynamic structure only slightly. To
test this hypothesis, we calculated several models including the Lyα profile and fitted the
resulting synthetic spectra and energy distributions with our original grid. The differences
in Teff and log (Ca/He) are always smaller than ∼ 150 K and 0.20 dex, respectively, well
within the measurement uncertainties for these objects. Given that these differences are
small, we refrain from including systematically this Lyα profile in our model calculations
since the approach used by Wolff et al. has been successfully tested for only a few stars that
are relatively hot (7500 and 8500 K), and it is not clear whether this formalism remains valid
at lower temperatures.
WD 0802+386 (LP 257-28): This object is the hottest DZ star (Teff = 10, 980 K) in the
BRL97/BLR01 sample. At this temperature, helium-rich white dwarfs are expected to show
Hα even for hydrogen abundances as low as log (H/He) = −5.0. Our featureless spectrum
near Hα is thus extremely surprising considering that accretion of hydrogen with a rate as
low as 10−20 M⊙ yr−1 should provide enough hydrogen to be easily detected spectroscopically.
We postpone the discussion of this object after the analysis of the DZ stars from the SDSS,
which include several white dwarfs similar to LP 257-28.
WD 1328+307 (G165-7): This star has a magnetic field and has been analyzed separately by
Dufour et al. (2006). The atmospheric parameters given in Table 1 and the fit with magnetic
models displayed in Figure 4 are taken from that analysis.
WD 2251−070 (LP 701-29): The best fit obtained for this star by Kapranidis & Liebert
(1986) reproduces the Ca i λ4226 line but fails to provide an acceptable fit to the Ca ii lines.
The authors argue that pressure ionization probably affects the metal ionization equilibrium,
but an exact treatment was not available at that time and could not be tested further. We
find that the photometric and spectroscopic observations are fairly well reproduced by our
hydrogen-free models; note that our temperature estimate for this star, Teff = 4000 K, is at
the limit of our grid. In this temperature range, even though the Hα line is spectroscopically
invisible, the hydrogen abundance can be easily constrained from the infrared JHK pho-

– 12 –
tometry since the H2-He CIA opacity becomes important even for hydrogen abundances as
low as log (H/He) = −5. We note also that Kapranidis & Liebert (1986) used pure helium
stratifications for their synthetic spectrum calculations. Our models reveal significant dif-
ferences between the pressure and temperature structures of pure helium models and those
including metals. It is unclear, however, how this would translate in the models of Kaprani-
dis & Liebert calculated using a different theoretical framework based on a Thomas-Fermi
equation-of-state, which also includes electron thermal conduction as an energy transfer
mechanism. Although not perfect, our best fit reproduces the neutral calcium line well, and
shows a hint of ionized calcium. Our models fail, however, to reproduce the metallic blend
near 4500 A. It is clearly inconsistent to invoke pressure ionization to explain the absence of
Ca i λ4226 in WD 0552−041 when the same line is very strong in a star characterized with
even higher atmospheric pressures. This result suggests that the physics of cool helium-rich
models at high densities is not fully understood yet, and that significant improvements are
still required.
The mean mass for the 11 DZ stars with trigonometric parallax measurements analyzed
in this paper is 〈M〉 = 0.63 M⊙. As discussed above, however, the atmospheric parameters
of the five coolest stars are certainly more uncertain than those of the rest of the sample. If
we exclude these objects, the mean mass rise slightly to 〈M〉 = 0.66 M⊙, significantly lower
than the average mass obtained by BRL97/BLR01, 〈M〉 = 0.78 (or 〈M〉 = 0.82 M⊙ if we
exclude L745-46A and Ross 640 which were analyzed with mixed H/He models by BRL97
and BLR01). This difference in average mass can be readily explained in terms of the free
electrons provided by the metals as well as hydrogen, which both increase the opacity in our
model calculations.
Beauchamp (1995) found that the mass distribution of DBA stars significantly differs
from that of DB stars, with a higher fraction of massive white dwarfs above M ∼ 0.65 M⊙.
Moreover, the three most massive stars in their sample were DBA stars, suggesting a possible
link between the presence of hydrogen and the mass of the star. We do not find such a trend
in our sample of DZ stars, the possible descendents of DB white dwarfs. In fact, one of the
most massive stars in our sample, WD 0802+386, has an extremely small upper limit on its
hydrogen content. However, considering the limited size of our sample, we remain cautious
and will refrain from drawing any definitive conclusion on the interpretation of the mass
distribution of DZ white dwarfs.

– 13 –
4.3. Analysis of DZ Stars from the SDSS
Prior to this work, abundance analyses of DZ white dwarfs (Teff < 12, 000 K) had been
carried out for only 17 stars. Our SDSS sample alone contains 147 new DZ stars. These
additional objects discovered in the SDSS allow a significant improvement in the statistics of
DZ stars. The method we adopt to fit the SDSS data is similar to that described above, with
the exception that the SDSS ugriz photometry is used instead of the BV RI measurements.
These photometric bands cover the entire optical range from the UV atmospheric cutoff
(3200 A) to the red sensitivity cutoff of the detector (∼ 10, 000 A). Furthermore, since
trigonometric parallax measurements are not available for the SDSS stars, we assume a
value of log g = 8.0 for all objects. As was the case for the BRL97 and BLR01 samples, the
hydrogen abundance for most stars is unknown. We thus fit all stars with our model grids
with various hydrogen abundances, and then reject the solutions that are incompatible with
the observations at Hα, or determine directly the hydrogen abundances when Hα is visible,
or indirectly through the Ca ii H & K line profiles whenever possible (i.e. for spectra with
good enough S/N ratio).
Our adopted atmospheric parameters are presented in Table 2. We have not applied
any correction for Galactic extinction since the stars are relatively close, therefore only a
small fraction of the absorption should be applied (see Dufour et al. 2005, for more on this
issue). Figures 6 to 24 show our best fits to the energy distribution, to the Ca ii H & K lines,
and to the Hα region for the maximum hydrogen abundance allowed by the spectroscopic
observations, or for the hydrogen abundance obtained from fits to Hα when it is visible
spectroscopically.
There is another set of Ca ii lines available in the red portion of the SDSS spectra at
8498, 8542, and 8662 A (the “infrared triplet”) that can be used as an internal consistency
check. However, these lines are not as strong as the H & K lines, and they are detected
only at high calcium abundances above log (Ca/He) > −9 at the S/N typical of our spectra.
Our models predict the presence of these lines in several objects, but a direct comparison
could only be achieved for stars with good signal-to-noise ratio spectra. Figure 25 shows
the DZ stars with recognizable Ca ii lines together with our synthetic spectra interpolated
at the atmospheric parameter solution obtained from the Ca ii H & K lines. We find a
good internal consistency between the two sets of lines for three out of four stars with
sufficiently high S/N to allow a useful comparison (the bottom four objects). Higher S/N
spectroscopic observations would be required for the other DZ stars in our sample. For SDSS
J103809.19−003622.5, we observe a discrepancy between both sets of lines, the Ca ii lines
in the red favoring a higher effective temperature than that inferred from the photometry
(our photometric and spectroscopic fits shown in Fig. 15 are not very good for this object).

– 14 –
One possible solution is that this star is an unresolved degenerate binary. We also find
one peculiar object (SDSS J155852.59+031242.9) showing strong absorption features at the
position of the Ca ii lines that are at odds with the predicted profiles.
The calcium lines displayed in Figure 25 are also more sensitive to the presence of a
weak magnetic field since the separation of the Zeeman components is proportional to the
square of the central wavelength of the line, ∆λ = 9.34×10⁻¹³λ2
cgeffBs (see for instance the
analysis of G165-7 by Dufour et al. 2006). The absence of any line splitting translates into
an upper limit of ∼ 150 kG for the four stars shown in Figure 25. Higher S/N spectroscopic
observations of the other stars in our sample could potentially provide interesting limits on
the presence of magnetic fields in DZ white dwarfs.
4.4. Comments on the Assumed Solar Composition
Our synthetic spectrum calculations assume that the relative abundance of heavy el-
ements is solar; the metal content is thus fixed by our fit to the calcium lines. Is this a
reasonable assumption? Most heavy elements are not observed in the optical spectrum and
thus there is no way to determine individual abundances. As for the elements that are visi-
ble only occasionally (e.g., magnesium, iron), detailed abundance analyses in the optical are
extremely limited, and one has to rely on UV observations to obtain a reasonable estimate
of the metal content. Unfortunately, UV observations are available only for a small number
of DZ stars, the most complete analysis being that of Wolff et al. (2002). According to their
Figure 7, most cool stars exhibit metal-to-metal ratios that are compatible with solar ratios
within 1 dex. Our calculations indicate that small variations of metal abundances (other
than calcium) with respect to solar ratios do not have any significant effect on our atmo-
spheric parameter determinations. It thus seems reasonable to assume that the metals are
present in the atmospheres of DZ stars in solar ratios, or at least not too far from solar.
Also, models calculated with the abundances of all elements never observed in DZ stars set
to zero are practically identical to those calculated with solar values with respect to calcium.
This is not surprising in view of the fact that hydrogen, magnesium, and iron are always the
principal electron donors.
Our SDSS sample contains only a few objects showing elements other than calcium in
their optical spectrum (see, e.g., the Mg and Fe lines near ∼ 3850 A in Figs. 6 to 24). Al-
though the S/N ratio is relatively low, the predicted and observed metallic features for these
few stars are at least compatible with solar ratios. The DZ star SDSS J095645.15+591240.6
shown in Figures 13 (blue part) and 26 (red part) represents an extreme example of a DZ star
with metal abundances consistent with solar ratios based on an examination of the various

– 15 –
iron and magnesium lines. Also displayed in Figure 26 are white dwarf stars that exhibit the
Mg i “b” blend at ∼ 5175 A. The feature is strongest in SDSS J095645.15+591240.6, where
the famous asymmetry of the blue wing can clearly be seen. Dufour et al. (2006) argued that
the asymmetry in the magnetic DZ star G165-7 was possibly due to molecular absorption
by MgH. However, at Teff = 8230 K, SDSS J095645.15+591240.6 is too hot for this molecule
to be visible, and another explanation must be sought. Note that an increase of the mag-
nesium abundance would produce lines in the 3800 A region that would be incompatible
with the observations. SDSS J103809.19−003622.5, discussed in the previous section, is also
problematic here.
A metal-to-metal ratio analysis similar to those of Dupuis et al. (1993b) and Wolff et al.
(2002) is not possible here since our sample contains only a few objects with more than one
heavy element observed. However, our study can be used to identify the best candidates
for future UV observations (for abundance analyses) and IR observations (to find possible
debris disks or dust clouds around white dwarfs; see similar studies around DAZ stars in
Reach et al. 2005; Kilic et al. 2005; Becklin et al. 2005; Kilic et al. 2006). In conclusion,
models calculated with solar abundance ratios reproduce all features observed in the optical
(with the exception of the Mg i “b” blend), and they do not predict absorption features
that are not observed.
5. Results
5.1. Calcium Abundances
Our results are summarized in Figure 27 where the calcium abundance for all DZ stars
analyzed in this paper are shown as a function of effective temperature. The various symbols
are described in the figure caption. The two continuous curves correspond to the predicted
equilibrium abundances reached in the low and high phases of the two-phase accretion sce-
nario proposed by Dupuis et al. (1993b), which correspond to accretion rates of 5 × 10⁻²⁰
and 5 × 10⁻¹⁵ M⊙ yr−1, respectively. Whether the origin of metals is related to encounters
with interstellar clouds or attributed to comets or asteroids, it is comforting to find that
the accretion rates required to explain the calcium abundances in DZ stars are about the
same as for the DAZ stars (Koester & Wilken 2006), a result that suggests that the metals
observed in DZ and DAZ stars have the same origin.
We first notice that the atmospheric parameters of our DZ stars fill most of the Ca/He
– Teff plane between the two continuous curves, with the exception of some regions discussed
here. First and most obvious is the empty triangular region at high effective temperatures

– 16 –
and low calcium abundances. No stars are found in this region simply because the Ca ii H
& K transitions are not sufficiently excited to be detected spectroscopically. Stars in this
particular region would thus appear as DC white dwarfs, and only ultraviolet observations
would allow one to fill this part of the plane. The dashed line represents the detection
threshold for the Ca ii H & K lines calculated for a limit set at 5 A of total equivalent width
(a typical value for calcium lines observed in low S/N spectra).
We also find a region near ∼ 6500 K and high calcium abundances where the number of
stars is significantly reduced (the only star in this region is G165-7 discussed below). Figure
28 shows that cool DZ stars form a parabola in the (g − r, u − g) color-color diagram at
a given effective temperature, and that models with high calcium abundances overlap the
stellar locus region (highest density point region). Objects in the SDSS are selected for
follow-up spectroscopic observations mainly on the basis of their colors. High priority is
given to potential QSOs that have colors outside the stellar locus (Richards et al. 2002).
The paucity of stars in the regions of the Ca/He – Teff plane discussed above can thus be
explained in part as a selection effect in the SDSS targeting procedure. The absence of cool
stars can also be explained by the fact that most of our stars come from the DR4 catalog
of Eisenstein et al. (2006). As shown by their Figure 1, a color cut was made to eliminate
objects close or in the stellar locus before they search for white dwarfs candidates. Cool DZ
stars in these regions, if they exist, should be found by a more careful search of the SDSS
spectroscopic archive, or with the help of reduced proper motion surveys similar to that
undertaken by Kilic et al. (2006).
The only star in the upper-right corner of Figure 27 is G165-7. However, the low effective
temperature and high metallic content of G165-7 produce strong absorption features and
unusual colors that put it on the other side of the stellar locus, far to the right and outside
the color range displayed in Figure 28. Note that the parameters given in Table 1 suggest that
G165-7 would be near the stellar locus. However, these parameters were obtained partially
with BV RI and JHK photometry, and the fit to u and g in Figure 6 of Dufour et al. (2006)
is not very good.
Finally, we find no DZ stars between Teff ∼ 5000 and 6000 K. Note that vMa 2 should
probably be in that temperature range according to the analysis of Wolff et al. (2002) based
on models calculated with a non-ideal equation of state. As explained above, such cool stars
have colors that overlap the stellar locus, and it is therefore not surprising to not find any
DZ star in this particular range of temperature in the SDSS sample. There is also no DZ star
in the BRL97 and BLR01 samples in the same temperature range. However, a significant
deficiency of helium atmosphere white dwarfs has been observed, the so-called non DA gap,
in the (V −I, V −K) color-color diagram shown in Figure 9 of BLR01. But since our sample

– 17 –
contains only a few DZ stars in the vicinity of the gap, and since the physics in this high
pressure regime is not fully understood, the absence of DZ stars between ∼ 5000 and 6000 K
is not statistically significant, and no firm conclusion concerning the nature of the gap can
be reached from our results.
5.2. Hydrogen Abundances
Our SDSS sample contains 27 objects with a detectable Hα feature, while we achieve
a better fit to the Ca ii H & K lines for 10 additional objects if hydrogen is included,
for a total of 37/147 stars (or ∼ 25%) with hydrogen detected directly or indirectly. The
SDSS sample is nowhere complete in volume or magnitude, but since SDSS white dwarfs
are selected randomly and independently of the spectral type, stars with hydrogen should
not be preferentially chosen, so we believe that this ratio is representative of the entire DZ
population. For the BRL97 and BLR01 samples, there are three stars showing Hα, and
three more for which the hydrogen abundance could be determined indirectly. We thus have
a total of 43/159 stars (or 27%) with hydrogen abundances determined in our entire sample.
Figure 29 shows our hydrogen abundance determinations (or upper limits) as a function
of effective temperature for our full sample. Also indicated are the hydrogen-to-helium ratios
predicted from continuous accretion from the ISM in solar proportions at various rates, which
are needed to reproduce the amount of hydrogen measured (or constrained) if the accretion
starts at Teff=20,000 K. The exact choice for the starting temperature is not critical since
the cooling time scales increase rapidly with decreasing effective temperatures. We find that
most DZ stars in Figure 29 with hydrogen abundance determinations are consistent with
accretion rates in the range from 10−20 to 10−18 M⊙ yr−1. This is about two to four orders
of magnitude smaller than the average metal accretion rate of ∼ 10−16 M⊙ yr−1 used by
Dupuis et al. (1993b). Our results confirm the conclusions reached by Dupuis et al. (1993b)
and Wolff et al. (2002) that the hydrogen accretion rate must be at least two orders of
magnitude lower that that of metals.
The conclusion that the hydrogen accretion rate must be significantly lower than that of
metals is further demonstrated in Figure 30, where we show the Ca/H abundance ratios as
a function of effective temperature for our sample of DZ stars. The apparent correlation of
Ca/H with Teff is due in part to the fact that there are no stars with low calcium abundances
at high effective temperatures, since the Ca ii lines are not observable in this range of tem-
perature (see Fig. 27). The dotted line indicates the solar Ca/H abundance ratio. Because
hydrogen can only accumulate with time in the mixed H/He convection zone, the maximum
Ca/H abundance ratio can only become smaller with decreasing effective temperature. Thus,

– 18 –
the observed Ca/H abundance ratios that are close to the solar value in a few stars are only
coincidental; this does not necessarily imply accretion in solar proportions, but indicates
instead that the accretion of hydrogen was reduced relative to metals. The maximum value
of Ca/H that can be expected from accretion of material with solar composition is indicated
by the solid line (from equation 6 of Dupuis et al. 1993b).
5.3. Correlation with Effective Temperature
More importantly, the results shown in Figure 29 reveal for the first time a correlation
between the hydrogen abundances and the effective temperature. Such a correlation has
never been observed before because the number of known DZ stars was simply too small.
Moreover, as noted above, the absence of Hα in WD 0802+386 near Teff ∼ 11, 000 K implies
an unexpectedly low hydrogen abundance of log (H/He) < −6.0. We find seven additional
DZ stars in the SDSS sample with Teff > 9500 K and similar low hydrogen abundances.
Figure 29 indicates that the accretion rate for these stars must be as low as 10−21 M⊙ yr−1.
An accretion rate slightly above 10−20 M⊙ yr−1 would be sufficient to produce a detectable Hα
absorption feature at these temperatures. The presence of such small amounts of hydrogen is
very surprising, especially considering that several DZ stars in our sample do show Hα in the
same temperature range. It seems very unlikely that white dwarfs experience such a diversity
of average conditions while traveling large distances through the interstellar medium over
their lifetime.
The inverse problem occurs at the other end of the diagram, where cool DZ stars with
log (H/He) ∼ −3 can be accounted for with accretion rates around 10−19 M⊙ yr−1 and
above. However, DZ stars accreting hydrogen at such a high rate should be easily recog-
nized at higher effective temperatures if the accretion rate has remained constant during
the cooling of the star. Yet, our sample contains no hot (Teff > 10, 000 K) DZ star with
high hydrogen abundances around log (H/He) ∼ −4 expected from the high accretion rate
inferred from the cool DZ stars. Actually, the fact that the accretion rate required to explain
the hydrogen abundances in Figure 29 increases from ∼ 10−20 M⊙ yr−1 at Teff = 11, 000 K
up to ∼ 10−19 M⊙ yr−1 at Teff = 7000 K could be interpreted as evidence that the physical
mechanism that prevents hydrogen from being accreted onto the surface of these stars be-
comes less efficient with decreasing effective temperature. For instance, Wesemael & Truran
(1982) proposed a model where protons are prevented from accreting onto the surface of
the white dwarf by a rotating magnetic field, while metals, most probably in the form of
grains, are unaffected by this mechanism and thus reach the surface. Our results suggest
that this so-called propeller mechanism may become less effective below Teff ∼ 9000 K. If

– 19 –
this interpretation is correct, this would represent the first empirical evidence for a decrease
in efficiency with temperature of the hydrogen screening mechanism at work in cool helium
atmosphere white dwarfs. This mechanism is still operating quite efficiently, however, since
the inferred accretion rates at low effective temperatures remain several orders of magnitude
lower than those required to explain the presence of metals in DZ stars.
5.4. Connection with Hotter DB Stars
As mentioned above, 27% of the DZ stars in our sample contain hydrogen, a higher ratio
than the ∼ 16% found in DBA stars (Shipman et al. 1987 gives 6/32, but after removal of
the subdwarf PG 2224+034, we get 5/31, or 16%). It is generally believed that this is the
ratio among DB3 (Teff ∼ 12, 000− 19, 000 K) white dwarfs. However, these statistics for DB
stars are based on the detection of Hβ and Hγ only.
As part of a campaign undertaken by the Montreal group (see, e.g., Hunter et al. 2001),
nearly 80 bright northern DB white dwarfs have been spectroscopically observed at medium
and high resolutions. This sample also includes all known DB2 stars with spectra obtained
at Hα, a more sensitive line to study the ratio of DBA to DB stars. Hα is found in 7/18 stars
(or 38%), more than twice the ratio obtained by Shipman et al. (1987) for the cooler DB3
stars. If this fraction for DB2 stars extends to the cooler DB3 stars, a systematic search for
Hα in these objects is expected to perhaps double the number of DBA3 stars. Indeed, the
atmospheres of DB stars become increasingly transparent with lower effective temperatures,
which makes Hα easier to detect spectroscopically, even if the mass of the helium convection
zone has significantly increased and further diluted the amount of hydrogen present in the
photospheric regions.
We thus argue that the canonical 20% ratio of DBA to DB white dwarfs is certainly
underestimated. Some authors have speculated that all DB stars must contain at least some
traces of hydrogen, although explicit spectroscopic determinations are difficult (from obser-
vations of Lyα, see Koester & Weidemann 1989; Provencal et al. 2000), if not impossible,
because the amounts of hydrogen expected are below the visibility limit. At the cooler end
of the white dwarf sequence, Wolff et al. (2002) detected hydrogen in nearly all the DBZ
and DZ stars in their sample. Several studies now favor the accretion of hydrogen from the
ISM (as opposed to primordial origin) to explain the DBA phenomenon, since the amount of
hydrogen found in cool DBA stars is incompatible with the scenario that involves the trans-
formation of DA stars into DB stars near the red edge of the DB gap at Teff ∼ 30, 000 K.
However, a measure of the hydrogen accretion rate in DB stars is complicated by the fact
that the mass of the helium convection zone varies rapidly with decreasing effective tem-

– 20 –
perature, and also by the lack of accurate determinations of hydrogen abundances for large
samples of DB and DBA stars.
Depending on the evolutionary models used, the total mass of hydrogen present in DBA
stars ranges from about 10−14 to 10−11 M⊙. Such small amounts of hydrogen imply that
cool helium-rich white dwarfs below Teff ∼ 12, 000 K must have completely forgotten their
past hydrogen history as they become DC, DZ or DQ stars, since the increasing depth of the
helium convection zone with decreasing effective temperature (see Fig. 10 of Tassoul et al.
1990) will dilute hydrogen to extremely small abundances, typically to log (H/He) < −5.
Thus the evidence to date is that a large fraction — probably larger than 35% — of DB stars
do accrete hydrogen at a rate we cannot yet estimate precisely, but which probably lies in the
range from 10−22 to 10−19 M⊙ yr−1, and that ∼ 27% of DZ stars have hydrogen abundances
that can only be accounted for by invoking unusually low hydrogen accretion rates (this ratio
for DZ stars will eventually go up when higher S/N ratio spectroscopy around Hα becomes
available for SDSS stars).
5.5. Speculations on Spectral Evolution
We discuss here an alternative, and very speculative scenario aimed at explaining various
problems related to the abundance patterns observed in helium-rich white dwarfs. Koester
(1976) argued that the accretion rate from the ISM should be lower than the fluid rate
obtained from the Bondi-Hoyle equation since the physical conditions required for the hy-
drodynamic treatment are perhaps not met in a low interacting medium. If we assume that
the accretion rate is indeed much lower than the fluid rate (M < 10−21 M⊙ yr−1), we could
naturally explain the low hydrogen abundances of log (H/He) < −6 determined for the hot
DZ stars in our study. Such a low hydrogen accretion rate would also be compatible with
the hydrogen abundance pattern observed in the hotter DB white dwarfs. The presence of
metals in DZ stars would then have to be explained by other means than accretion from the
ISM, such as cometary material or tidal disruption of planets or asteroids, models that are
growing in popularity since the recent discoveries of infrared excesses in DAZ white dwarfs
(see, e.g., Kilic et al. 2006, and references therein).
In Figure 31, we show the results already displayed in Figure 29 in a different way by
plotting as a function of effective temperature the total mass of hydrogen present in each
star, obtained by combining the mass of the helium convection zone at a given effective
temperature with our determinations of the H/He abundance ratios. Also reproduced in
Figure 31 are the hydrogen layer masses predicted for continuous accretion from the ISM in
solar proportions at various rates needed to account for the amount of hydrogen measured

– 21 –
(or constrained) if the accretion starts at Teff = 20, 000 K.
We speculate here that the high hydrogen abundances, log (H/He) = −5 to −3, observed
in a fraction of our DZA stars could be explained in terms of convectively mixed DA stars
at low effective temperatures. This process is believed to occur when the bottom of the
thin hydrogen convection zone in a hydrogen-atmosphere white dwarf penetrates the deeper
and more massive underlying helium layer. Figure 32 illustrates the extent of the hydrogen
convection zone as a function of effective temperature in a 0.6 M⊙ DA white dwarf. A
DA star with a very thin hydrogen layer of q(H) ≡ ∆M/M⋆ = 10−11 would thus mix at
an effective temperature near 10,000 K, while a DA star with a much thicker hydrogen
layer of q(H) = 10−8 would mix at a lower temperature of ∼ 6500 K. The mixing process,
although not yet well understood, would presumably turn a hydrogen-atmosphere white
dwarf into a helium-dominated atmosphere with only small traces of hydrogen, since the
mass of the helium convection zone is much larger than the hydrogen layer mass. Although
there are no detailed quantitative calculations available in the literature, the expected H/He
abundance ratios as a function of effective temperature would follow, at least qualitatively,
the abundance pattern observed in Figures 29 and 31.
If the convective mixing scenario proposed here to explain the hydrogen abundances
observed in cool DZ stars survives closer examination, it could also naturally explain the
absence of a correlation between the position and motion of DZ stars with the distribution
of local interstellar matter, as discussed by Aannestad et al. (1993). The mixing scenario
could also provide an explanation for another fact that has not received much attention in
the literature: the lack of DQ white dwarfs with hydrogen abundances comparable to those
observed in DZ stars. If we combine the 40 new DQ stars analyzed by Koester & Knist (2006)
with the 56 analyzed by Dufour et al. (2005) (and other DQ stars from the literature), we
have a sample of over a hundred DQ stars, none of which show Hα. We note that the increased
opacity provided by carbon affects the detection limit of hydrogen features compared to DZA
stars, especially for DQ stars with high carbon abundances (log (C/He) > −4), but according
to our models, Hα should still be easily detected in DQ stars with log (H/He) ∼ −4 to −3 at
Teff = 7000 – 9000 K. In fact, only one DQ star is known to contain hydrogen, G99-37, and
it is only indirectly detected from the presence of a CH molecular band. If accretion from
the interstellar medium is responsible for the presence of hydrogen in DZ white dwarfs, we
would then expect at least a few DQ stars to show Hα. We propose instead that DQ white
dwarfs do not show large amounts of hydrogen in their atmospheres simply because they are
the direct descendants of the DB and DBA stars, while DZ and DZA white dwarfs originate
respectively from two separate populations of white dwarfs, namely DB stars that have not
accreted a detectable quantity of hydrogen and convectively mixed DA stars. This scenario
also predicts that the proportion of DZA stars should increase with decreasing effective

– 22 –
temperature. However, it is premature to test this idea with our sample since too many
stars may have small traces of hydrogen that will become detectable only through higher
S/N ratio spectroscopy.
6. SUMMARY AND CONCLUSIONS
We presented a detailed photometric and spectroscopic analysis of 159 DZ white dwarfs
drawn from two samples (12 stars from BRL97 and BLR01, and 147 from the SDSS). This
is more than a ninefold increase in the number of DZ stars ever analyzed and represents the
largest set analyzed in a homogeneous fashion.
Our reanalysis of the DZ stars from the BRL97/BLR01 sample reveals that the effective
temperatures and stellar masses derived with models including hydrogen and metals are
significantly different from the values obtained from pure helium models. For instance, our
mean mass for the 11 DZ stars with trigonometric parallax measurements, 〈M〉 = 0.63 M⊙,
is significantly lower than the average mass obtained by BRL97/BLR01, 〈M〉 = 0.78 M⊙,
and closer to the mean mass of other types of white dwarfs. The atmospheric parameter
determinations for the coolest DZ stars in our sample are more uncertain due to possible
pressure effects in white dwarf atmospheres below Teff ∼ 6000 K. As such, the coolest DZ
stars represent a useful probe of non-ideal effects at high gas densities.
Hydrogen is present in 43 of the 159 DZ stars (or 27%) in our complete sample, a
fraction that will most certainly rise when higher signal-to-noise follow-up spectroscopy near
Hα becomes available for SDSS objects. Our analysis also revealed for the first time a
correlation between the hydrogen abundance and the effective temperature of DZ stars. The
amount of hydrogen measured in the photospheric regions of DZ stars can be explained
from accretion from the ISM only if the accretion rate is at least two (and possibly up to
five) orders of magnitude lower than the corresponding rate for metals. Also, the hydrogen
accretion rate inferred from the results of our analysis suggests an increase in the rate of
about one order of magnitude when the effective temperature decreases, providing perhaps
the first empirical evidence of a lower temperature boundary for the hydrogen screening
mechanism. We finally speculated about an alternative scenario where the hydrogen pattern
in DZA white dwarfs could be explained as the result of the convective mixing of the thin
hydrogen layer in DA stars with the more massive underlying helium convective zone.
We wish to thank D. Koester for providing us with his theoretical Lyα line profile
calculations, A. Gianninas for a careful reading of our manuscript, and an anonymous referee
for many constructive comments. We would also like to thank the director and staff of

– 23 –
Steward Observatory for the use of their facilities. This work was supported in part by the
NSERC Canada. P. Bergeron is a Cottrell Scholar of Research Corporation.
Funding for the SDSS and SDSS-II has been provided by the Alfred P. Sloan Foundation,
the Participating Institutions, the National Science Foundation, the U.S. Department of
Energy, the National Aeronautics and Space Administration, the Japanese Monbukagakusho,
the Max Planck Society, and the Higher Education Funding Council for England.
The SDSS is managed by the Astrophysical Research Consortium for the Participating
Institutions. The Participating Institutions are the American Museum of Natural History,
Astrophysical Institute Potsdam, University of Basel, Cambridge University, Case Western
Reserve University, University of Chicago, Drexel University, Fermilab, the Institute for Ad-
vanced Study, the Japan Participation Group, Johns Hopkins University, the Joint Institute
for Nuclear Astrophysics, the Kavli Institute for Particle Astrophysics and Cosmology, the
Korean Scientist Group, the Chinese Academy of Sciences (LAMOST), Los Alamos National
Laboratory, the Max-Planck-Institute for Astronomy (MPIA), the Max-Planck-Institute for
Astrophysics (MPA), New Mexico State University, Ohio State University, University of
Pittsburgh, University of Portsmouth, Princeton University, the United States Naval Obser-
vatory, and the University of Washington.
REFERENCES
Aannestad, P. A., Kenyon, S. J., Hammond, G. L., & Sion, E. M. 1993, AJ, 105, 1033
Abazajian, K., et al. 2003, AJ, 126, 2081
Adelman-McCarthy, J. K., et al. 2006, ApJS, 162, 38
Beauchamp, A. 1995, Ph.D. Thesis, Universite de Montreal
Becklin, E. E., Farihi, J., Jura, M., Song, I., Weinberger, A. J., & Zuckerman, B. 2005, ApJ,
632, L119
Bergeron, P., Leggett, S. K., & Ruiz, M. T. 2001, ApJS, 133, 413 (BLR01)
Bergeron, P., Ruiz, M. T., & Leggett, S. K. 1997, ApJS, 108, 339 (BRL97)
Bergeron, P., Saumon, D., & Wesemael, F. 1995, ApJ, 443, 764
Cottrell, P. L., & Greenstein, J. L. 1980a, ApJ, 238, 941
Cottrell, P. L., & Greenstein, J. L. 1980b, ApJ, 242, 195

– 24 –
Dufour, P., Bergeron, P., & Fontaine, G. 2005, ApJ, 627, 404
Dufour, P., Bergeron, P., Schmidt, G. D., Liebert, J., Harris, H. C., Knapp, G. R., Anderson,
S. F., & Schneider, D. P. 2006, ApJ, 651, 1112
Dupuis, J., Fontaine, G., Pelletier, C., & Wesemael, F. 1992, ApJS, 82, 505
Dupuis, J., Fontaine, G., Pelletier, C., & Wesemael, F. 1993a, ApJS, 84, 73
Dupuis, J., Fontaine, G., & Wesemael, F. 1993b, ApJS, 87, 345
Eisenstein, D. J., et al. 2006, ApJS, 167, 40
Fontaine, G., Brassard, P., & Bergeron, P. 2001, PASP, 113, 409
Fukugita, M., Ichikawa, T., Gunn, J. E., Doi, M., Shimasaku, K., & Schneider, D. P. 1996,
AJ, 111, 1748
Grenfell, T. C. 1974, A&A, 31, 303
Gunn, J. E., et al. 1998, AJ, 116, 3040
Gunn, J. E., et al. 2006, AJ, 131, 2332
Harris, H. C., et al. 2003, AJ, 126, 1023
Hogg, D. W., Finkbeiner, D. P., Schlegel, D.J., & Gunn, J. E., 2001, AJ, 122, 2129
Hummer, D. G., & Mihalas, D. 1988, ApJ, 331, 794
Hunter, C., Wesemael, F., Saffer, R. A., Bergeron, P., & Beauchamp, A. 2001, in ASP Conf.
Ser. Vol. 226, 12th European Workshop on White Dwarf Stars, eds. J. L. Provencal,
H. L. Shipman, J. MacDonald, & S. Goodchild, 153
Ivezic, Z., et al. 2004, Astron. Nachr., 325, 583
Kapranidis, S., & Liebert, J. 1986, ApJ, 305, 863
Kilic, M., von Hippel, T., Leggett, S. K., & Winget, D. E. 2005, ApJ, 632, L115
Kilic, M., et al. 2006a, AJ, 131, 582
Kilic, M., von Hippel, T., Leggett, S. K., & Winget, D. E. 2006b, ApJ, 646, 474
Kleinman, S. J., et al. 2004, ApJ, 607, 426
– 25 –
Koester, D. 1976, A&A, 52, 415
Koester, D., & Knist, S. 2006, A&A, 454, 951
Koester, D., Wegner, G., & Kilkenny, D. 1990, ApJ, 350, 329
Koester, D., & Weidemann, V. 1989, A&A, 219, 276
Koester, D., & Wilken, D. 2006, A&A, 453, 1051
Koester, D., & Wolff, B. 2000, A&A, 357, 587
Liebert, J. 1977, A&A, 60, 101
Liebert, J., Wehrse, R., & Green, R. F. 1987, A&A, 175, 173
Paquette, C., Pelletier, C., Fontaine, G., & Michaud, G. 1986, ApJS, 61, 197
Pier, J. R., Munn, J. A., Hindsley, R. B., Hennessy, G. S., Kent, S. M., Lupton, R. H., &
Ivezic, Z. 2003, AJ, 125, 1559
Press, W. H., Teukolsky, S. A., Vetterling, W. T., & Flannery, B. P. 1992, Numerical Recipes
in FORTRAN, 2nd edition (Cambridge: Cambridge University Press), 644
Provencal, J. L., Shipman, H. L., Koester, D., Wesemael, F., & Bergeron, P. 2002, ApJ, 568,
324
Provencal, J. L., Shipman, H. L., Thejll, P., & Vennes, S. 2000, ApJ, 542, 1041
Reach, W. T., Kuchner, M. J., von Hippel, T., Burrows, A., Mullally, F., Kilic, M., &
Winget, D. E. 2005, ApJ, 635, L161
Richards, G. T., et al. 2002, AJ, 123, 2945
Saumon, D., Chabrier, G., & Van Horn, H. M. 1995, ApJS, 99, 713
Shipman, H. L., Liebert, J., & Green, R. F. 1987, ApJ, 315, 239
Sion, E. M., Hammond, G. L., Wagner, R. M., Starrfield, S. G., & Liebert, J. 1990, ApJ,
362, 691
Sion, E. M., Kenyon, S. J., & Aannestad, P. A. 1990, ApJS, 72, 707
Smith, J. A., et al. 2002, AJ, 123, 2121
Stoughton, C., et al. 2002, AJ, 123, 485

– 26 –
Tassoul, M., Fontaine, G., & Winget, D.E. 1990, ApJS, 72, 335
Tucker, D. L., et al. 2006, Astronomische Nachrichten, 327, 821
Wegner, G. 1972, ApJ, 172, 451
Wehrse, R., & Liebert, J. 1980, A&A, 86, 139
Weidemann, V. 1960, ApJ, 131, 638
Weidemann, V., & Koester, D. 1989, A&A, 210, 311
Wesemael, F., Greenstein, J. L., Liebert, J., Lamontagne, R., Fontaine, G., Bergeron, P., &
Glaspey, J. W. 1993, PASP, 105, 761
Wesemael, F., & Truran, J. W. 1982, ApJ, 260, 807
Wolff, B., Koester, D., & Liebert, J. 2002, A&A, 385, 995
York, D. G., et al. 2000, AJ, 120, 1579
Zeidler-K.T., E.-M., Weidemann, V., & Koester, D. 1986, A&A, 155, 356
This preprint was prepared with the AAS LATEX macros v5.2.

– 27 –
Table 1. Atmospheric Parameters of DZ Stars from the BRL97 and BLR01 Samples
WD Name Teff(K) log g M/M⊙ log (Ca/He) log (H/He)
0046+051 vMa 2 6220 (240) 8.19 (0.04) 0.69 (0.02) −10.00 (0.05) −3.19 (0.18)a
0552−041 LP 658-2 4270 ( 70) 7.80 (0.02) 0.45 (0.01) −10.92 (0.04) < −5.0
4350 ( 60) 7.87 (0.02) 0.49 (0.01) −10.99 (0.03) no H
0738−172 L745-46A 7590 (220) 8.07 (0.03) 0.62 (0.02) −10.91 (0.03) −3.41 (0.03)
0802+386 LP 257-28 10980 (490) 8.31 (0.19) 0.78 (0.12) − 9.76 (0.09) < −6.0
1313−198 LHS 2710 4520 (160) 7.86 (0.08) 0.48 (0.04) −11.18 (0.03) < −5.0
4570 ( 90) 7.89 (0.08) 0.50 (0.04) −11.23 (0.04) no H
1328+307 G165-7 6440 (210) 7.99 (0.29) 0.57 (0.17) − 8.10 (0.15) −3.0 (0.20)
1338−311 ESO 445-271 8210 (460) 8.00 0.58 −10.03 (0.02) < −4.0
8560 (600) 8.00 0.58 −10.43 (0.02) no H
1626+368 Ross 640 8440 (320) 8.02 (0.05) 0.59 (0.03) − 8.83 (0.04) −3.63 (0.05)
1705+030 G139-13 6580 (200) 8.20 (0.15) 0.70 (0.09) −10.05 (0.05) −3.55 (0.14)a
2251−070 LP 701-29 4000 (200) 8.01 (0.06) 0.58 (0.04) −10.45 (0.02) < −6.0
2312−024 LHS 3917 6220 (190) 8.19 (0.26) 0.69 (0.16) −10.55 (0.05) −4.90 (0.30)a
2345−447 ESO 292-43 4620 (110) 8.35 (0.09) 0.80 (0.06) −11.35 (0.04) < −5.0
4650 ( 70) 8.36 (0.08) 0.81 (0.06) −11.43 (0.04) no H
aHydrogen abundance determined indirectly from the Ca ii H & K profiles.

– 28 –
Table 2. Atmospheric Parameters of DZ Stars from the SDSS
Name Plate MJD Fiber Teff(K) log (Ca/He) D (pc) log (H/He)
SDSS J000557.20+001833.3 388 51793 394 7970 (190) −9.62 (0.07) 136 < −4.0
SDSS J001849.43+001204.7 1491 52996 27 9600 (170) −9.83 (0.07) 157 < −5.0
SDSS J003601.38−111214.0 655 52162 300 7280 ( 70) −9.26 (0.04) 55 < −4.0
SDSS J004123.58+151109.0 419 51868 395 7770 (170) −10.72 (0.16) 177 < −4.0
SDSS J004646.16+002430.9 691 52199 503 8770 (220) −8.57 (0.09) 225 < −4.0
SDSS J005906.77+001725.2 395 51783 508 10400 (420) −9.80 (0.19) 248 < −5.0
SDSS J010629.85−010344.2 396 51816 55 10240 (350) −9.21 (0.09) 192 −4.30 (0.13)
SDSS J011338.35+000632.7 694 52209 24 7840 (160) −9.79 (0.09) 179 < −4.0
SDSS J011358.98−095913.3 660 52177 277 10610 (290) −8.87 (0.05) 130 −5.06 (0.06)
SDSS J012339.77+132433.4 424 51893 132 7300 (270) −9.44 (0.22) 223 < −3.0
SDSS J013831.12+003101.6 698 52203 500 9060 (270) −10.34 (0.11) 225 < −5.0
SDSS J020001.99+004018.4 701 52179 430 9860 (170) −9.90 (0.09) 173 < −5.0
SDSS J020132.24−003932.0 404 51812 303 9650 (210) −8.33 (0.05) 110 < −5.0
SDSS J021836.70−091945.0 668 52162 138 9560 (300) −10.63 (0.07) 97 < −5.0
SDSS J022851.97−000938.8 406 51869 31 8310 (310) −8.08 (0.22) 279 < −3.0
SDSS J030800.40−065659.9 459 51924 345 8520 (400) −8.81 (0.23) 285 < −3.0
SDSS J031448.24−082755.2 459 51924 46 10290 (610) −9.51 (0.31) 358 < −5.0
SDSS J041145.90−054848.5 465 51910 52 9320 (580) −8.95 (0.32) 359 < −3.0
SDSS J073835.97+384438.2 431 51877 601 9530 (360) −8.36 (0.13) 271 −4.42 (0.35)
SDSS J074743.56+400110.1 432 51884 36 8520 (200) −10.87 (0.17) 161 < −4.0
SDSS J074751.39+373217.0 433 51873 13 9600 (390) −10.00 (0.14) 269 < −5.0
SDSS J074821.86+350648.7 542 51993 515 10130 (430) −10.43 (0.18) 356 < −5.0
SDSS J074942.87+312424.6 890 52583 268 6910 ( 80) −9.86 (0.13) 102 −3.14 (0.23)a
SDSS J074958.26+434306.0 434 51885 401 8950 (470) −9.62 (0.18) 350 < −5.0
SDSS J075846.90+322523.3 890 52583 588 10090 (460) −10.24 (0.20) 336 < −5.0
SDSS J080211.42+301256.7 860 52319 388 9400 (470) −9.17 (0.19) 385 < −4.0
SDSS J080331.46+450257.8 439 51877 351 9290 (320) −9.53 (0.23) 276 −3.85 (0.28)
SDSS J080537.64+383212.4 758 52253 383 10660 ( 40) −10.03 (0.03) 49 < −6.0
SDSS J080602.91+374720.6 758 52253 122 9430 (280) −8.38 (0.14) 244 < −5.0
SDSS J080615.25+364018.1 758 52253 80 10130 (570) −9.23 (0.24) 389 < −5.0

– 29 –
Table 2—Continued
Name Plate MJD Fiber Teff(K) log (Ca/He) D (pc) log (H/He)
SDSS J082720.59+330437.9 932 52620 372 7870 (210) −8.97 (0.12) 221 < −5.0
SDSS J082927.85+075911.4 1758 53084 154 9670 (180) −8.68 (0.07) 176 < −5.0
SDSS J083434.68+464130.6 549 51981 560 6610 (100) −9.85 (0.06) 110 < −5.0
SDSS J083556.31+090619.4 1759 53081 338 8390 (150) −9.35 (0.09) 165 < −4.0
SDSS J084200.24+362540.0 864 52320 101 10320 (240) −9.08 (0.08) 218 −4.78 (0.13)
SDSS J084502.70+411547.6 829 52296 367 8300 (220) −8.55 (0.11) 218 < −4.0
SDSS J084525.00+535208.8 446 51899 176 7180 (160) −10.71 (0.13) 144 < −3.0
SDSS J084709.11+450734.8 763 52235 146 8520 (350) −9.47 (0.18) 267 < −4.0
SDSS J084828.00+521422.5 447 51877 499 8330 (190) −10.83 (0.05) 110 < −5.0
SDSS J084849.42+354857.8 934 52672 553 8090 ( 80) −10.46 (0.04) 105 < −4.0
SDSS J084857.88+002834.9 467 51901 150 11950 (320) −8.25 (0.13) 221 < −6.0
SDSS J084906.69+071030.0 1298 52964 29 8320 (260) −8.37 (0.14) 237 −3.36 (0.25)
SDSS J084911.86+403649.7 830 52293 253 9230 (140) −10.35 (0.07) 134 < −5.0
SDSS J085141.72+053852.1 1189 52668 139 7480 (240) −9.03 (0.14) 212 < −4.0
SDSS J090517.71+013307.6 471 51924 221 8180 (190) −10.21 (0.11) 193 < −4.0
SDSS J090556.22+523533.1 553 51999 380 7510 (180) −9.15 (0.09) 151 < −4.0
SDSS J091643.07+010531.5 472 51955 577 7500 (340) −9.77 (0.24) 240 < −3.0
SDSS J092801.78+612434.1 485 51909 527 8570 (340) −8.71 (0.21) 288 < −4.0
SDSS J093210.54+485601.7 901 52641 259 8210 (250) −8.71 (0.19) 262 < −4.0
SDSS J093423.17+082225.3 1304 52993 222 9130 (110) −9.82 (0.03) 117 < −5.0
SDSS J093545.45+003750.9 476 52314 417 9030 (470) −8.67 (0.22) 369 < −4.0
SDSS J093704.99+364647.2 1275 52996 114 11190 (430) −9.94 (0.26) 263 −4.89 (0.18)
SDSS J093942.30+555048.7 556 51991 167 8680 ( 80) −8.51 (0.02) 65 −4.20 (0.05)
SDSS J094148.75+502214.5 901 52641 590 10940 (420) −9.12 (0.17) 294 < −5.0
SDSS J094206.21+575556.0 452 51911 32 11430 (400) −8.54 (0.23) 312 < −6.0
SDSS J094210.50+074354.7 1234 52724 220 9140 (190) −9.32 (0.09) 190 < −5.0
SDSS J094415.33+393943.0 1215 52725 576 11190 (560) −8.97 (0.14) 314 < −6.0
SDSS J094451.59+440856.7 941 52709 326 10460 (470) −9.35 (0.22) 288 < −5.0
SDSS J094530.20+084624.8 1234 52724 514 10550 (220) −10.03 (0.15) 227 < −6.0
SDSS J094743.09+423841.3 941 52709 131 9680 (320) −8.50 (0.14) 270 < −4.0

– 30 –
Table 2—Continued
Name Plate MJD Fiber Teff(K) log (Ca/He) D (pc) log (H/He)
SDSS J095119.85+403322.4 1216 52709 141 8370 ( 60) −10.27 (0.04) 84 −4.16 (0.13)
SDSS J095435.86+563518.2 557 52253 105 8940 (260) −9.79 (0.13) 219 < −5.0
SDSS J095645.15+591240.6 453 51915 621 8230 ( 80) −7.54 (0.06) 128 −3.20 (0.09)
SDSS J100237.36+031325.5 573 52325 291 9800 (200) −9.19 (0.12) 212 < −5.0
SDSS J100406.64+423151.3 1217 52672 577 8270 (340) −9.98 (0.14) 242 < −4.0
SDSS J100421.25+045117.2 573 52325 363 7910 (180) −9.21 (0.13) 193 < −4.0
SDSS J100823.75+024840.0 502 51957 325 7940 (220) −11.26 (0.12) 120 < −4.0
SDSS J101007.84+394852.2 1356 53033 640 8470 ( 90) −8.66 (0.05) 128 −3.94 (0.16)
SDSS J101558.21+414131.7 1357 53034 523 9390 (200) −8.90 (0.10) 206 −4.66 (0.25)
SDSS J101805.17+034435.6 574 52355 104 8690 (370) −8.62 (0.17) 275 < −4.0
SDSS J103126.19+120340.4 1599 53089 455 8350 ( 70) −8.62 (0.04) 102 < −4.0
SDSS J103300.11+624747.8 772 52375 542 7590 (120) −9.92 (0.45) 137 −3.71 (0.89)a
SDSS J103651.09+483754.0 875 52354 122 11460 (330) −9.02 (0.20) 292 −5.21 (0.26)
SDSS J103809.19−003622.5 274 51913 265 6770 ( 30) −9.44 (0.06) 49 < −5.0
SDSS J103941.86+461224.3 962 52620 132 6770 (120) −10.05 (0.17) 109 −5.62 (0.55)a
SDSS J104511.21+625442.2 773 52376 554 9020 (470) −9.77 (0.32) 340 < −4.0
SDSS J104911.53+515423.5 1010 52649 84 6680 ( 40) −9.43 (0.05) 72 −4.41 (0.24)a
SDSS J104915.06−000706.2 275 51910 111 8680 (160) −8.53 (0.05) 171 −3.91 (0.14)
SDSS J105221.56+065915.4 1001 52670 557 11000 (440) −9.60 (0.32) 317 < −5.0
SDSS J105601.50+012825.0 507 52353 14 10200 (240) −9.24 (0.06) 122 −4.76 (0.08)
SDSS J105616.90−000449.4 277 51908 311 10950 (460) −9.17 (0.25) 355 −4.63 (0.32)
SDSS J105641.71+571448.9 949 52427 99 7420 ( 70) −10.70 (0.08) 99 < −4.0
SDSS J105853.70+604136.8 774 52286 262 8870 (460) −8.96 (0.32) 316 < −4.0
SDSS J110438.38+071129.8 1003 52641 172 10910 (160) −10.45 (0.15) 169 < −6.0
SDSS J111215.05+070052.3 1004 52723 111 6890 (120) −9.02 (0.08) 142 < −3.0
SDSS J112258.34+504146.7 879 52365 289 8740 (200) −7.93 (0.12) 217 −4.40 (0.34)
SDSS J112617.16+524155.1 879 52365 407 9460 (150) −9.50 (0.06) 159 −4.86 (0.16)
SDSS J112956.98−015229.5 326 52375 590 8480 (190) −9.04 (0.10) 192 −3.33 (0.17)
SDSS J113001.61+103614.8 1223 52781 570 8620 (170) −8.59 (0.08) 168 < −4.0
SDSS J113711.28+034324.7 838 52378 292 7120 ( 60) −10.91 (0.08) 73 < −3.0

– 31 –
Table 2—Continued
Name Plate MJD Fiber Teff(K) log (Ca/He) D (pc) log (H/He)
SDSS J114054.87+532827.4 1015 52734 95 9860 (250) −8.54 (0.12) 232 −4.51 (0.23)
SDSS J114712.18+492801.0 967 52636 28 7810 ( 80) −9.70 (0.05) 111 < −4.0
SDSS J115547.42+432751.4 1447 53120 538 8390 (120) −10.46 (0.07) 125 −4.00 (0.00)a
SDSS J121218.69+540938.7 1019 52707 293 8710 (140) −9.41 (0.08) 142 < −5.0
SDSS J121837.12+002304.0 288 52000 423 6090 (100) −9.92 (0.10) 122 < −4.0
SDSS J122204.48+634354.5 780 52370 367 8790 (340) −10.11 (0.17) 247 < −4.0
SDSS J122733.45+633029.5 780 52370 443 7270 ( 60) −8.71 (0.04) 95 < −4.0
SDSS J122929.04+425414.4 1452 53112 541 11090 (690) −9.48 (0.33) 429 < −5.0
SDSS J122953.17+512925.2 884 52374 94 9230 (250) −9.60 (0.16) 218 < −4.0
SDSS J123455.96−033047.1 335 52000 247 8860 (180) −10.83 (0.06) 114 < −5.0
SDSS J124006.36−003700.9 290 51941 24 8370 (170) −9.23 (0.09) 118 < −5.0
SDSS J125413.79−023608.5 337 51997 153 6960 (120) −10.45 (0.19) 89 −3.34 (0.50)a
SDSS J130746.34+030742.0 524 52027 589 8170 (180) −9.64 (0.06) 130 −3.55 (0.10)
SDSS J130905.26+491359.7 1281 52753 439 8620 ( 60) −10.16 (0.03) 83 < −5.0
SDSS J131336.96+573800.5 1319 52791 409 8900 ( 50) −9.39 (0.02) 68 −4.70 (0.09)
SDSS J132506.96+652132.2 603 52056 401 11650 (370) −8.97 (0.19) 262 −4.41 (0.21)
SDSS J133824.97−013017.1 912 52427 457 10730 (120) −9.44 (0.06) 147 < −6.0
SDSS J134144.10−011238.4 299 51671 137 8090 (220) −8.73 (0.11) 222 < −4.0
SDSS J134226.93+052248.6 854 52373 371 7960 (110) −8.97 (0.10) 146 < −4.0
SDSS J134459.35+650512.5 497 51989 124 10010 (450) −9.65 (0.20) 320 < −5.0
SDSS J135118.47+425316.0 1345 52814 32 6770 (120) −11.35 (0.08) 45 < −3.0
SDSS J135137.07+613607.0 786 52319 571 7190 (150) −10.26 (0.14) 166 < −3.0
SDSS J135637.78+404703.4 1378 53061 444 7100 ( 70) −8.89 (0.05) 125 < −3.0
SDSS J140316.91−002450.0 301 51942 30 4660 (110) −10.92 (0.08) 67 < −4.0
SDSS J140445.10−023237.2 915 52443 114 7620 (150) −9.36 (0.11) 143 < −4.0
SDSS J141426.55−011354.7 303 51615 124 8940 (200) −10.75 (0.06) 109 < −5.0
SDSS J142516.43−005048.7 305 51613 197 7220 ( 90) −11.42 (0.11) 81 < −4.0
SDSS J142931.17+583927.9 789 52342 93 9220 (310) −8.52 (0.15) 235 < −4.0
SDSS J143235.82+035423.3 585 52027 143 10760 (430) −8.91 (0.13) 233 −4.35 (0.18)
SDSS J144022.52−023222.2 919 52409 36 6860 ( 80) −10.44 (0.20) 100 −3.25 (0.50)a

– 32 –
Table 2—Continued
Name Plate MJD Fiber Teff(K) log (Ca/He) D (pc) log (H/He)
SDSS J144453.67+574147.2 791 52435 419 9120 (400) −7.44 (0.36) 360 < −4.0
SDSS J144516.24−020849.6 920 52411 197 6530 ( 80) −10.71 (0.17) 94 −3.53 (0.58)a
SDSS J151054.84+381450.0 1399 53172 198 9130 (240) −8.55 (0.13) 229 −4.17 (0.26)
SDSS J151441.87+501209.7 1330 52822 533 9930 (510) −9.40 (0.36) 377 < −4.0
SDSS J153129.26+424015.7 1052 52466 291 7130 ( 80) −10.36 (0.04) 88 < −5.0
SDSS J154025.18+514921.6 796 52401 397 8070 (250) −9.45 (0.17) 238 < −4.0
SDSS J154540.22+492145.3 796 52401 77 9130 (510) −8.79 (0.35) 334 < −4.0
SDSS J154623.07+392723.6 1680 53171 588 8680 (220) −8.92 (0.10) 192 < −5.0
SDSS J154953.26+023929.7 594 52045 65 7990 (380) −9.07 (0.31) 286 < −3.0
SDSS J155852.59+031242.9 595 52023 484 7170 (110) −9.30 (0.08) 136 < −4.0
SDSS J161801.34+445220.8 814 52443 152 9560 (290) −7.98 (0.11) 226 < −5.0
SDSS J164026.65+315453.9 1340 52781 484 6840 (100) −9.89 (0.08) 110 < −3.0
SDSS J165741.59+373824.2 820 52433 443 7650 (160) −9.79 (0.11) 182 < −4.0
SDSS J165741.59+373824.2 820 52438 448 7660 (160) −9.87 (0.10) 182 < −4.0
SDSS J171139.82+220152.9 1689 53177 33 9160 (350) −8.93 (0.16) 286 < −4.0
SDSS J171436.43+550112.4 367 51997 304 9190 (510) −9.52 (0.23) 377 < −4.0
SDSS J171513.64+280403.8 980 52431 351 8240 (150) −10.83 (0.11) 139 < −4.0
SDSS J171900.63+562350.5 367 51997 402 9300 (210) −9.29 (0.05) 192 < −5.0
SDSS J205059.11−011021.9 1115 52914 281 9560 (290) −7.59 (0.15) 291 < −5.0
SDSS J210303.47−010842.5 1114 53179 4 8140 (170) −8.88 (0.16) 182 < −4.0
SDSS J210733.93+005557.7 985 52431 100 7510 (100) −10.19 (0.10) 124 −3.10 (0.18)
SDSS J212424.69−011452.5 987 52523 74 7690 (110) −9.18 (0.08) 125 < −4.0
SDSS J222802.05+120733.3 737 52518 9 6760 ( 20) −9.96 (0.02) 34 < −4.0
SDSS J223222.32+010920.7 376 52143 565 6900 (140) −10.46 (0.14) 133 < −3.0
SDSS J223841.05+010150.3 674 52201 531 7140 (140) −10.30 (0.25) 132 −4.97 (0.79)a
SDSS J234245.90+000632.4 682 52525 27 8570 (410) −9.15 (0.15) 316 −3.20 (0.18)
SDSS J235516.61+143136.1 749 52226 119 6940 (110) −10.80 (0.25) 129 −3.67 (0.89)a
aHydrogen abundance determined indirectly from the Ca ii H & K profiles.

– 33 –
Fig. 1.— Representative synthetic spectra of DZ white dwarfs taken from our model grid
at log g = 8.0 for various metal and hydrogen abundances. The spectra are normalized to
unity at 4170 A and offset by an arbitrary factor for clarity. The labels indicate the effective
temperature and the calcium abundance, log(Ca/He), while the color of each spectrum
corresponds to a different hydrogen abundance, as indicated in the lower right corner.
Fig. 2.— Fits to the Ca ii H & K lines with various hydrogen abundances for the DZ star
G139-13 (WD 1705+030). [See the electronic version of the Journal for a color version of
this figure.]
Fig. 3.— Fits to the Ca ii H & K lines with various hydrogen abundances for the DZ star
G157-35 (WD 2312−024). [See the electronic version of the Journal for a color version of
this figure.]
Fig. 4.— Fits to the energy distribution (left panels) and calcium lines (right panels) with
helium-rich models including traces of metals and hydrogen (the abundances are indicated
in each panel). The BV RI and JHK photometric observations are represented by error
bars, while the average model fluxes are shown by filled circles. [See the electronic version
of the Journal for a color version of this figure.]
Fig. 5.— Same as Fig. 4.
Fig. 6.— Fits to the energy distribution, calcium lines, and Hα profile (from left to right)
for all DZ stars in our SDSS sample. The ugriz photometric observations are represented
by error bars, while the average model fluxes are shown by filled circles. The atmospheric
parameters are indicated in each panel. Since some of the spectroscopic observations have
low signal-to-noise ratios, we have applied for clarity a three-point average window to the
data displayed here. [See the electronic version of the Journal for a color version of this
figure.]
Fig. 7.— Same as Fig. 6.
Fig. 8.— Same as Fig. 6.
Fig. 9.— Same as Fig. 6.
Fig. 10.— Same as Fig. 6.
Fig. 11.— Same as Fig. 6.
Fig. 12.— Same as Fig. 6.

– 34 –
Fig. 13.— Same as Fig. 6.
Fig. 14.— Same as Fig. 6.
Fig. 15.— Same as Fig. 6.
Fig. 16.— Same as Fig. 6.
Fig. 17.— Same as Fig. 6.
Fig. 18.— Same as Fig. 6.
Fig. 19.— Same as Fig. 6.
Fig. 20.— Same as Fig. 6.
Fig. 21.— Same as Fig. 6.
Fig. 22.— Same as Fig. 6.
Fig. 23.— Same as Fig. 6.
Fig. 24.— Same as Fig. 6.
Fig. 25.— SDSS spectra with observed Ca ii triplets compared with synthetic spectra
interpolated at the atmospheric parameter solution obtained from the Ca ii H & K lines.
[See the electronic version of the Journal for a color version of this figure.]
Fig. 26.— SDSS spectra of DZ stars showing the Mg i “b” blend at ∼ 5175 A compared
with synthetic spectra interpolated at the atmospheric parameter solution obtained from the
Ca ii H & K lines. The feature at ∼ 4860 A is Hβ. [See the electronic version of the Journal
for a color version of this figure.]
Fig. 27.— Relative abundance of calcium with respect to helium as a function of effective
temperature for the BRL97/BLR01 and SDSS samples. The two continuous curves define the
range of expected abundances for a low accretion rate in solar proportion of 5 × 10⁻²⁰ M⊙
yr−1 (lower curve) and a high rate of 5 × 10⁻¹⁵M⊙ yr−1 (upper curve). The dashed line
indicates the detection limit of the Ca ii H & K lines (taken as 5 A of total equivalent
width). The error bars in the bottom left corner represent the average uncertainties of Teff
(∼ 240 K) and log (Ca/He) (∼ 0.15 dex). Filled symbols correspond to DZ stars with
hydrogen abundances determined directly from Hα or indirectly from the Ca ii lines (these
are marked with an additional + sign), while open symbols correspond to objects with only
upper limits. The approximate hydrogen abundance for each object (or upper limits) can

– 35 –
be deduced from the number of sides of the polygon (triangles: log (H/He) ∼ −3, squares:
log (H/He) ∼ −4, pentagons: log (H/He) ∼ −5; circles represent pure helium solutions).
Fig. 28.— The (g − r, u− g) color-color diagram. Small dots represent objects with stellar
images while filled triangles correspond to the SDSS DZ stars from Table 2. The curves show
our DZ photometric sequences at log g = 8, log (H/He) = −30, for Teff = 12, 000 K (bottom
left parabola) down to 5000 K (upper right parabola) by steps of 500 K, and for calcium
abundances of log (Ca/He) = −7 (bottom sequence) down to −12 by steps of 0.5 dex. The
uppermost sequence corresponds to the pure helium models.
Fig. 29.— Hydrogen-to-helium abundance ratios as a function of effective temperature for the
BRL/BLR and SDSS samples. Filled circles correspond to objects with hydrogen abundance
determinations; objects with abundances measured indirectly from the calcium lines are
marked with an additional + sign. The crosses indicate white dwarfs with only upper limit
determinations. Solid lines represent the expected abundances for continuous accretion of
material from the ISM with a solar composition and accretion rates of 10−21 to 10−18 M⊙
yr−1.
Fig. 30.— Calcium-to-hydrogen abundance ratios as a function of effective temperature for
the BRL/BLR and SDSS samples. The horizontal dashed line indicates the solar Ca/H
abundance ratio, while the solid line corresponds to the maximum value expected from
accretion of material with solar compositions. The various symbols are explained in the
caption of Figure 27.
Fig. 31.— Total mass of hydrogen present in the helium convection zone as a function
of effective temperature. The symbols are the same as in Figure 29. The solid curves
indicate the amount of hydrogen expected from continuous accretion of material with solar
composition and accretion rates of 10−21 to 10−18 M⊙ yr−1.
Fig. 32.— Location of the hydrogen convection zone (hatched area) as a function of Teff in
a 0.6 M⊙ DA white dwarf. The y-axis expresses on a logarithmic scale the mass fraction
∆M above a certain point with respect to the total mass of the star M⋆. The thick solid
line indicates the location of the photosphere.

– 36 –
Figure 1

– 37 –
Figure 2

– 38 –
Figure 3

– 39 –
Figure 4
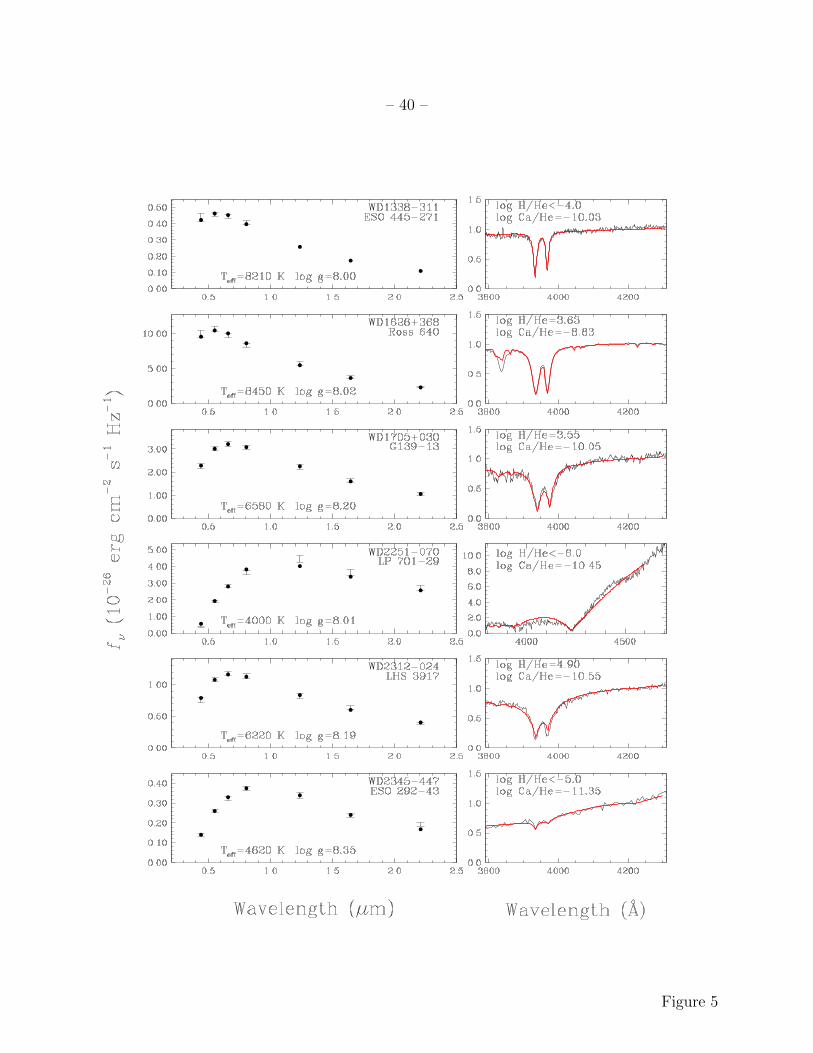
– 40 –
Figure 5

– 41 –
Figure 6

– 42 –
Figure 7
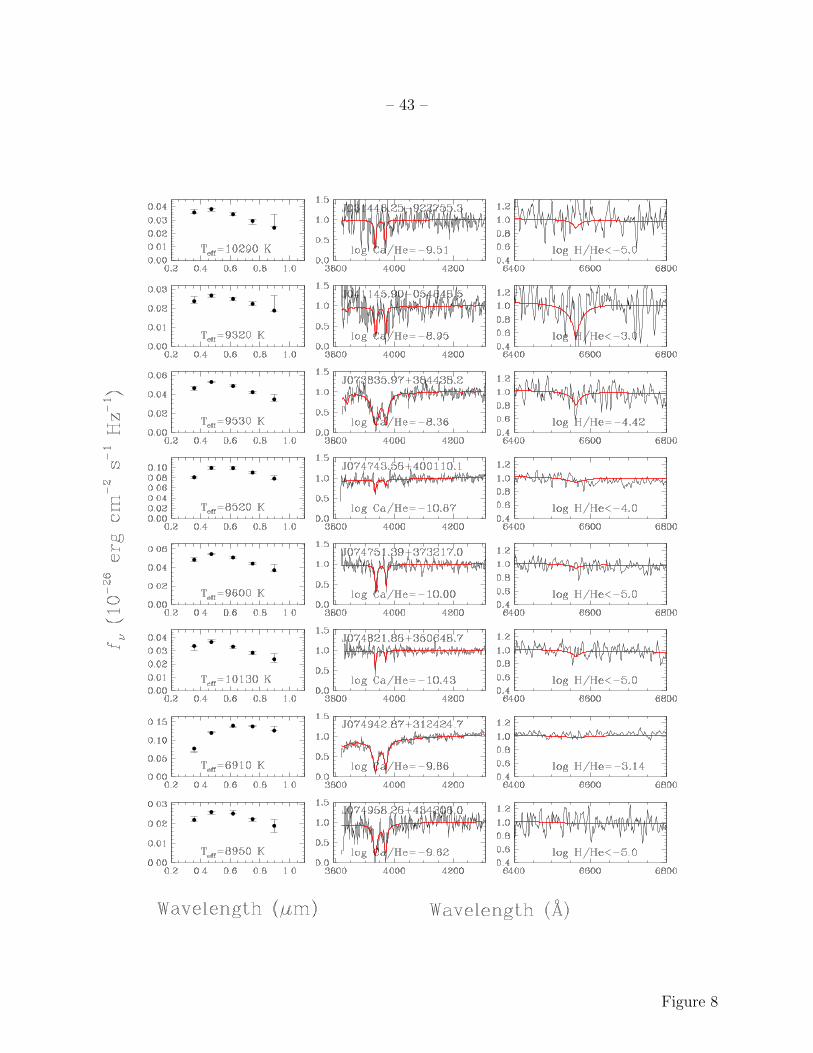
– 43 –
Figure 8

– 44 –
Figure 9

– 45 –
Figure 10

– 46 –
Figure 11

– 47 –
Figure 12

– 48 –
Figure 13

– 49 –
Figure 14

– 50 –
Figure 15

– 51 –
Figure 16

– 52 –
Figure 17

– 53 –
Figure 18

– 54 –
Figure 19

– 55 –
Figure 20

– 56 –
Figure 21

– 57 –
Figure 22

– 58 –
Figure 23

– 59 –
Figure 24

– 60 –
Figure 25

– 61 –
Figure 26

– 62 –
Figure 27

– 63 –
Figure 28

– 64 –
Figure 29

– 65 –
Figure 30

– 66 –
Figure 31

– 67 –
Figure 32