on the united states agricultural sector - the voice of ... · on the united states agricultural...
TRANSCRIPT

Comments Regarding Effects of
Trans-Pacific ParTnershiPon the United States Agricultural Sector

conTenTs
Executive Summary .......... 1
The Big Picture ................. 3
Model Description ........... 4
Country Profiles ............... 6
Commodities ..................... 8
Chapter Summaries ....... 22

1
TR
AN
S-PA
CIF
IC PA
RT
NE
RS
HIP
| UN
ITE
D S
TAT
ES
AG
RIC
ULT
UR
AL
SE
CT
OR
The Trans-Pacific Partnership (TPP) trade and investment agreement concluded
in October 2015 by the United States and 11 other countries in the Pacific Rim has
the potential to have a significant, positive impact on U.S. agriculture. Analysis by the
American Farm Bureau Federation indicates congressional passage of the agreement would boost net farm income by $4.4 billion over levels expected if Congress fails
to ratify TPP.
This report assesses the effects of reducing agricultural tariffs, adjusting tariff-rate
quotas (TRQs) and reducing non-tariff barriers to trade (as agreed upon by Australia,
Brunei Darussalam, Canada, Chile, Japan, Malaysia, Mexico, New Zealand, Peru,
Singapore, Vietnam and the United States in the TPP agreement) on U.S. agriculture in
2026—the assumed end date of the pact’s implementation. While legally the TPP only
goes into full effect if the United States ratifies the agreement, literally all of the other
member countries would—and indeed are—already implementing the various bilateral
provisions of the agreement without waiting for the United States to complete action.
Consequently, the comparison scenario here is the implication of Congress failing
to pass the agreement while the remaining member countries proceed apace.
While the United States already has trade agreements with Australia, Canada, Chile,
Mexico, Singapore and Peru, the TPP agreement substantially lowers tariffs and other
trade barriers with other member countries. It also updates some of the previous
agreements.
TPP is a multi-lateral agreement. All 12 members are signing agreements with each
other. This means that Vietnam, for example, gets improved terms of trade with Mexico.
Similarly, Canada gains added access to Japan’s markets. In short, other countries will
move forward with their trade capabilities regardless of whether the United States
decides to ratify the agreement. Failure on the part of the United States to enact TPP
will not see our trade situation maintain the status quo, but will actually see losses
in market share and declines in the value of our agricultural trade.
ExEcutivE Summary

2
n Livestock receipts with implementation are $5.8 billion higher with approval than without. for the crops sector—including fruits and vegetables—receipts are $2.7 billion higher. net farm income is also $4.4 billion higher.
n U.s. beef and pork exports are expected to be $1 billion and $940 million higher, respectively.
n Farm prices for corn, soybeans, wheat, rice, cotton, fed steers,
feeder steers, barrows and gilts, wholesale poultry and milk
are all projected to be marginally higher with the agreement
in place than without.
n Net trade rises for rice, cotton, beef, pork, poultry, butter,
cheese and non-fat dry milk.
n Net trade of corn declines slightly, but overall use increases
and corn revenue rises as higher feed use is needed to provide
for the added beef and pork exports rather than being
exported as raw commodities.
Some key reSultS

3
TR
AN
S-PA
CIF
IC PA
RT
NE
RS
HIP
| UN
ITE
D S
TAT
ES
AG
RIC
ULT
UR
AL
SE
CT
OR
The Big PicTUre
Individual commodity breakouts are in the report, but it is beneficial to understand
the overall story. from agriculture’s perspective, the major short-term shifts in trade derive from increased access to the animal protein markets in Japan. Longer term, economic growth in Vietnam along with much better entry terms into that market should also result in an improved trade picture there. Recall that several TPP signatory
countries already have trade agreements with the United States and, as such, will see
only limited trade gains under this multilateral deal.
Japan already operates with only limited barriers to the import of U.S. feed grains and
oilseeds for feed use by its livestock sector, so there will be essentially no direct market
improvements from the deal for these goods. Reduction in Japan’s livestock herds due
to production cutbacks, driven by lower animal product prices, may actually reduce that
country’s feed needs, lowering its feedgrain and oilseed import requirements.
As Japan increases its animal protein imports, however, the United States increases
livestock herds to satisfy Japan’s higher demand levels. Those animals need to be fed
and processed here, boosting feed use and feedgrain and oilseed production, as well
as adding to domestic processing demand.
The analysis indicates beef and pork production rises with U.S. ratification. While
relatively small in the grand scheme (1 percent and 3 percent, respectively), the price
increase associated with more demand is spread across all beef and pork production, translating to a rise of $5.8 billion in livestock cash receipts at full implementation when compared to a failure-to-implement scenario.
On the crops side, the agreement leads to a small reduction in corn exports, but higher
feed use. A nickel rise in the price of corn does not seem like much, but together with
other crop price increases (13 cents for soybeans and 16 cents for rice, for example)
crop cash receipts increase $2.7 billion with implementation when combined with gains
for the fruit and vegetable sector.
after adjusting for the higher production costs associated with increased output, after full implementation net income should be $4.4 billion higher with U.s. ratification than without.
4
TR
AN
S-P
AC
IFIC
PA
RT
NE
RS
HIP
|
UN
ITE
D S
TAT
ES
AG
RIC
ULT
UR
AL
SE
CT
OR
ModeL descriPTion
The model utilized in this paper captures the dynamic interrelationships among the
variables affecting supply and demand in the main agricultural sectors of the United
States, TPP partners and major competitors outside of TPP. The model consists of a
system of equations covering the corn, soybean, wheat, rice, cotton, beef, pork, poultry
and dairy sectors. The system provides a systematic framework that takes account of
interactions among the agricultural sectors both in U.S. and world markets.
The model estimates and forecasts three measures of income and returns for the U.S.
farm economy: (1) net farm income, the portion of net value added earned by farm
operators and others who share the risks of production; (2) net exports; and (3) net cash
income, the cash earned from sales of production and conversion of assets into cash.
The model assumes full implementation of tariff reductions. It assumes the added
economic growth derived by participating countries is consistent with the same
macroeconomic assumptions as the USDA Economic Research Service’s October 2014
report “Agriculture in the Trans-Pacific Partnership.”
The model generates a 10-year baseline for all major agricultural commodity prices,
production levels and net exports. First, the modeling system is adjusted to simulate
changes to tariffs and other factors affecting trade in the TPP assuming full U.S.
participation. Second, the modeling system is adjusted to simulate changes to tariffs
and other factors affecting trade in the TPP assuming the U.S. does not ratify the
agreement, but that other bilateral and multi-lateral agreements involving TPP members
continue. The results between the two TPP scenarios are compared to isolate the policy
effects associated with congressional action on the agreement.
The second scenario—the one in which the U.S. does not participate in TPP—requires
additional explanation.
The World Trade Organization has reported that as of Feb. 1, 2016, it received 625
notifications of regional trade agreements (RTAs). Of these, 419 are in force, with the
overall number of RTAs in force increasing steadily. This puts additional pressure on
countries to negotiate and pass their own RTAs in order to ensure their country’s
businesses are on an even footing with competitors.
5
TR
AN
S-PA
CIF
IC PA
RT
NE
RS
HIP
| UN
ITE
D S
TAT
ES
AG
RIC
ULT
UR
AL
SE
CT
OR
The members of TPP are no exception. As has been previously noted, the United
States already has trade agreements in place with six of the TPP member countries:
Australia, Canada, Chile, Mexico, Peru and Singapore. But the U.S. isn’t the only TPP
member that has been aggressively negotiating trade agreements; all TPP members are
currently negotiating RTAs outside of TPP. For example, Japan has signed 12 regional
and bilateral free trade agreements. Partners include Singapore, Mexico, Malaysia, Chile,
Thailand, Indonesia, Brunei, the Association of Southeast Asian Nations (ASEAN), the
Philippines, Switzerland, Vietnam, India, Peru, Australia and Mongolia. In addition, Japan
is negotiating agreements with Canada, Colombia, China, the European Union, Regional
Comprehensive Economic Partnership (RCEP) nations and Turkey.
It is important to include these changes, as they can quickly impact U.S. competitiveness
and market share. For example, in January 2016, the USDA Economic Research Service
released a paper that examined the effect—on the Japanese beef market—of market
access reform through the Japan-Australia Economic Partnership Agreement (JAEPA).
The JAEPA was finalized in July 2014 and went into effect Jan. 15, 2015. As a result
of JAEPA, beef imports into Japan from Australia are facing lower tariffs than similar
beef imports from the U.S. The ERS study projects that if these conditions continue
“JAEPA could lead to significant gains for Australian beef at the expense of U.S. beef
in Japan.” This is just one example among thousands, when competitor countries are
able to secure better access for their exports as compared to competing U.S. products.
The second modeled scenario attempts to incorporate the impacts that these auxiliary
agreements have on U.S. competitiveness.
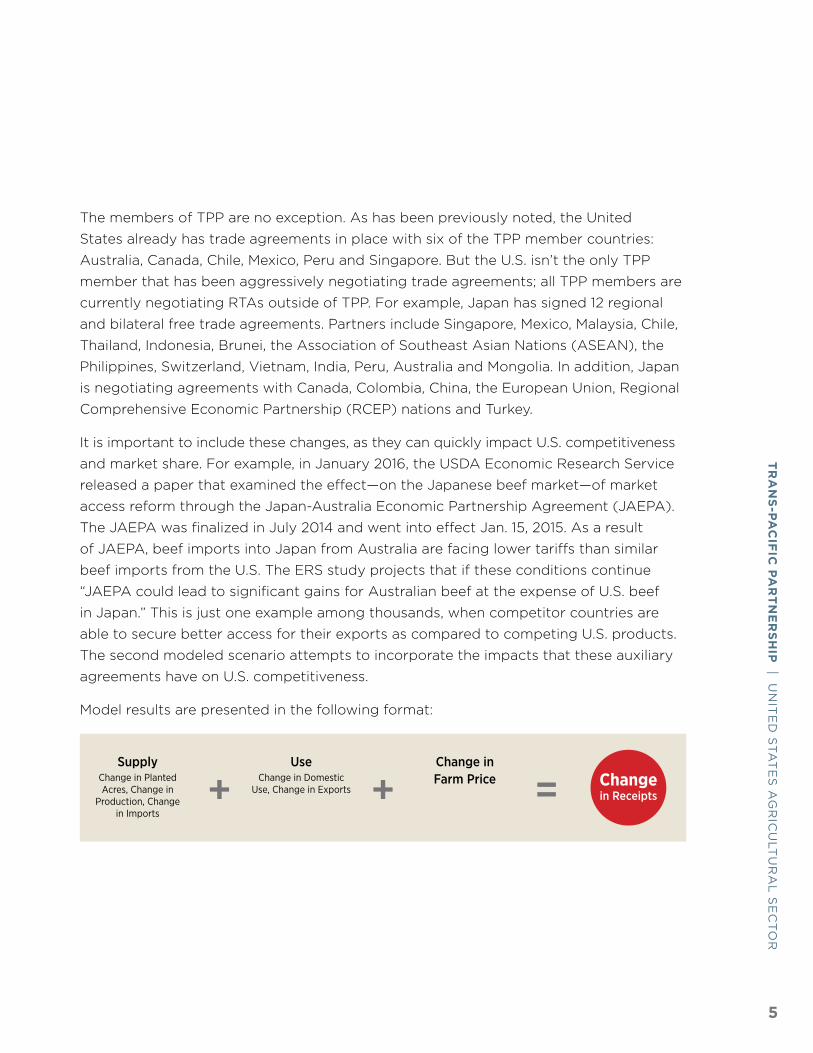
Model results are presented in the following format:
+ + = Changein Receipts
SupplyChange in Planted Acres, Change in
Production, Change in Imports
UseChange in Domestic
Use, Change in Exports
Change in Farm Price

6
TR
AN
S-P
AC
IFIC
PA
RT
NE
RS
HIP
|
UN
ITE
D S
TAT
ES
AG
RIC
ULT
UR
AL
SE
CT
OR
coUnTry ProfiLes
australiaThe United States-Australia Free Trade Agreement (FTA) entered into force Jan. 1, 2005. As a result of the agreement, the U.S. has duty-free access to Australia’s market. In 2014, Australia was the 16th-largest export destination for U.S. agricultural products with an export value of more than $1.5 billion.
In 2014, Australia had a population of 23.5 million, a GDP growth rate of 2.7 percent and GDP per capita (purchasing power parity—PPP) of $47,915. These figures are expected to grow 25 percent by 2020.
BruneiAlthough the U.S. does not have a trade agreement with Brunei, U.S. exports to Brunei are climbing. In 2014, the United States exported $5.4 million in agricultural products to Brunei. Brunei’s simple average MFN bound tariff for agricultural products is 32 percent, with maximum duties of over 1,000 percent.
In 2014, Brunei had a population of 420,000, a GDP growth rate of -0.7 percent and GDP per capita PPP of $71,896. By 2020, it is expected that GDP growth will be positive, per capita GDP will grow 38 percent and population will grow to 440,000.
canadaThe U.S. signed a bilateral trade agreement with Canada in 1987, and that agreement was later superseded by the North American Free Trade Agreement, which came into force in 1994. As a result of these deals, the U.S. has mainly duty-free access, with the exception of the dairy and poultry sectors. In 2014, Canada was the second-largest export destination for U.S. agricultural products with an export value of more than $21.9 billion.
In 2014, Canada had a population of 35.3 million, a GDP growth rate of 2.5 percent and GDP per capita PPP of $45,000. Expectations are, by 2020, GDP growth will be 1.8 percent,
per capita GDP will grow 20 percent and population will grow to 36.8 million.
chileThe U.S. has duty-free access to Chile’s market due to a bilateral trade agreement signed in 2004. In 2014, U.S. agricultural exports to Chile topped $850 million, making it the United States’ 27th-largest export destination.
In 2014, Chile had a population of 17.7 million, a GDP growth rate of 1.8 percent and GDP per capita PPP of $23,100. It is expected that by 2020, GDP growth will be 3.9 percent, per capita GDP will grow 32 percent and population will grow to 18.2 million.
JapanThe U.S. does not currently have a trade agreement with Japan. In 2014, Japan was the fourth-largest export market for U.S. agricultural products with an export value of more than $13.1 billion. Japan’s trade-weighted average most favored nation applied tariff for agricultural products is 2.8 percent, with maximum applied duties of 586 percent.
In 2014, Japan had a population of 126 million, a GDP growth rate of -0.06 percent and GDP per capita PPP of $37,615. It is expected that GDP growth will be 0.65 percent, per capita GDP will grow 19 percent and population will fall to 123 million by 2020.
MalaysiaThe U.S. does not currently have a trade agreement with Malaysia. In 2014, U.S. agricultural exports to Malaysia topped $950 million, making it the 25th-largest export destination. Malaysia’s trade-weighted average most favored nation applied tariff for agricultural products is 14 percent, with maximum applied duties of 90 percent.
In 2014, Malaysia had a population of 29.9 million, a GDP growth rate of 6 percent and GDP per capita PPP of $24,912. It is expected

7
TR
AN
S-PA
CIF
IC PA
RT
NE
RS
HIP
| UN
ITE
D S
TAT
ES
AG
RIC
ULT
UR
AL
SE
CT
OR
that by 2020 GDP growth will be 5 percent, per capita GDP will grow 39 percent and population will grow to 32 million.
MexicoIn 1994, the North American Free Trade Agreement (NAFTA) between the U.S., Mexico and Canada came into effect. Due to NAFTA, the U.S. has duty-free access to the Mexico market. In 2014, Mexico was the third-largest export market for U.S. agricultural products with an export value of nearly $19.4 billion.
In 2014, Mexico had a population of 123 million, a GDP growth rate of 2.13 percent and GDP per capita PPP of $17,421. It is expected that, by 2020, GDP growth will be 3.77 percent, per capita GDP will grow 31 percent and population will grow to 129 million.
new ZealandThe U.S. does not currently have a trade agreement with New Zealand. In 2014, U.S. agricultural exports to New Zealand were nearly $0.5 billion, making it the 35th-largest export destination. New Zealand’s trade-weighted average most favored nation applied tariff for agricultural products is 2.3 percent, with maximum applied duties of 5 percent.
In 2014, New Zealand had a population of 4.5 million, a GDP growth rate of 3.2 percent and GDP per capita PPP of $35,118. It is expected that, by 2020, GDP growth will be 2.3 percent, per capita GDP will grow 24 percent and population will grow to 4.7 million.
PeruDue to the bilateral trade agreement the U.S. signed with Peru in 2009, tariffs on most U.S. farm products will be phased out within 15 years, with all tariffs eliminated in 17 years. In 2014, Peru was the 22nd-largest export market for U.S. agricultural products with an export value of nearly $1.2 billion.
In 2014, Peru had a population of 30.5 million, a GDP growth rate of 2.35 percent and GDP per capita PPP of $12,156. It is expected that by 2020 GDP growth will be 4.5 percent, per capita GDP will grow 38 percent and population will grow to 32.3 million.
singaporeThe U.S. signed a bilateral trade agreement with Singapore in 2004. In 2014, U.S. agricultural exports to Singapore were nearly $800 million, making it the United States’ 29th-largest export destination.
In 2014, Singapore had a population of 5.5 million, a GDP growth rate of 2.9 percent and GDP per capita PPP of $82,618. It is expected that by 2020 GDP growth will be 3.2 percent, per capita GDP will grow 24 percent and population will grow to 5.9 million.
VietnamThe U.S. does not currently have a trade agreement with Vietnam. In 2014, Vietnam was the 12th-largest export destination for U.S. agricultural products with an export value of more than $2.3 billion. Vietnam’s trade-weighted most favored nation applied tariff for agricultural products is 7.3 percent, with maximum applied duties of 40 percent.
In 2014, Vietnam had a population of 91.7 million, a GDP growth rate of 5.98 percent and GDP per capita PPP of $5,570. It is expected that by 2020 GDP growth will be 6 percent, per capita GDP will grow 53 percent and population will grow to 94.4 million.

8
TR
AN
S-P
AC
IFIC
PA
RT
NE
RS
HIP
|
UN
ITE
D S
TAT
ES
AG
RIC
ULT
UR
AL
SE
CT
OR
cornIn 2014, corn accounted for 13 percent of total U.S. agricultural exports to TPP countries.
Corn is purchased as a feed for importing countries’ domestic livestock industries. Of
the member countries, Japan and Mexico represent our two largest corn markets. In the
2014/15 marketing year, Japan took 11.9 million metric tons from the United States with
Mexico bringing in 11.2 MMT. The U.S. supplied 81 percent of all of Japan’s corn imports
and 99 percent of Mexico’s corn import supply.
U.S. corn exporters enjoy zero duties in existing FTA markets. Even in non-FTA markets,
U.S. corn faces relatively low tariffs given corn’s role as a feedstock for trade partners’
domestic livestock industries. In Japan, the U.S. faces a trade-weighted tariff of
0 percent. In Vietnam, a country with a growing livestock industry, Vietnamese
importers of U.S. corn pay an 8 percent tariff.
2014–2015 My corn: imports as share of Total consumption
As a result of TPP, duties paid by U.S. exporters will fall to zero. This will lead to
additional exports of corn into countries with growing livestock industries. However,
it is expected that exports of corn as a raw commodity will decline into the important
Japanese market as Japan’s livestock industry modernizes and shrinks in size. Due
to TPP, net exports of corn are projected to decline by 45.3 million bushels. Despite
a reduction in exports, corn production is expected to grow by 7.1 million bushels on
an additional planted acreage of 46,000 acres. Production is expected to increase to
fulfill additional domestic feed and food demand of 52.7 million bushels. Additional feed
demand results from an expected increase in U.S. beef and pork exports. As a result of
increased domestic demand, corn prices are projected to increase by $0.05 per bushel,
leading to an increase in cash receipts of over $680 million.
n Total Consumptionn Imports
0
5000
10000
15000
20000
25000
30000
35000
HolderHolderHolderVietnamN. ZealandMexicoMalaysiaJapanChileCanadaAustralia
MT

9
TR
AN
S-PA
CIF
IC PA
RT
NE
RS
HIP
| UN
ITE
D S
TAT
ES
AG
RIC
ULT
UR
AL
SE
CT
OR
soybeans and soybean ProductsIn 2014, soybeans and products accounted for more than 8 percent of total U.S.
agricultural exports to TPP countries. Like corn, soybeans and products are purchased
as a feedstuff for importing countries’ domestic livestock industries. Purchases were
dominated by Mexico and Japan, which accounted for 80 percent of soybean exports
to the region.
Given the important role that soybeans, soybean meal and oil play as inputs, U.S.
soybean and soybean products already face low tariffs in TPP markets. U.S. soybeans
enter all markets duty free prior to TPP. Tariffs on soybean meal are also low at
8 percent in Vietnam and 4.2 percent in Japan, with other markets duty free. Among
soybean products, soybean oil has the highest tariffs. Soybean oil into Australia
and Malaysia faces a tariff of 5 percent. In Vietnam, tariffs range from 5 percent to
15 percent. Into Japan, soybean oil is taxed at 13.2 yen/kg. In all TPP markets except
Canada, imports account for more than 75 percent of total domestic consumption.
2014–2015 My soybean: imports as share of Total consumption
n Total Domestic Consumptionn Imports
0
1000
2000
3000
4000
5000
HolderHolderVietnamSingaporePeruMexicoMalaysiaJapanChileCanadaAustralia
MT
+ + =+46,000 ac+7.1 mil buNo Change
+54.2 mil bu-45.3 mil bu
+$0.05 per bushel
+$680million

10
TR
AN
S-P
AC
IFIC
PA
RT
NE
RS
HIP
|
UN
ITE
D S
TAT
ES
AG
RIC
ULT
UR
AL
SE
CT
OR
While Japanese market shifts will lower Japan’s demand for soybean and bean
products, there is expected to be enough of an increase in demand from other countries
with the tariff reductions that the overall demand and supply situation is essentially
unchanged. However, with domestic land competition, soybean prices are projected to
rise by 12 cents per bushel relative to the baseline, translating into nearly a $530 million
rise in the value of the soybean crop.
WheatIn 2014, wheat accounted for nearly 4 percent of total U.S. agricultural exports
to TPP countries. Wheat is mainly a food ingredient but is also used as feed. Japan
is the largest wheat importer among TPP partners, importing more than 95 percent
of domestic consumption.
U.S. wheat exports face fairly significant tariffs in several TPP countries. In Vietnam,
wheat tariffs are 5 percent, while tariffs on wheat products range from zero to
20 percent. In New Zealand, wheat enters duty free, but wheat flour is taxed at
5 percent. In Japan, the Ministry of Agriculture controls international purchases
through tariff rate quotas and manages domestic sales of wheat.
2014–2015 My Wheat: imports as share of Total consumption
n Total Consumptionn Imports
0
2000
4000
6000
8000
10000
HolderVietnamSingaporePeruN. ZealandMexicoMalaysiaJapanChileCanadaAustralia
MT
+ + =+80,000 ac+3.6 mil buNo Change
+3.0 mil bu+0.6 mil bu
+$0.12 per bushel
+$530million

11
TR
AN
S-PA
CIF
IC PA
RT
NE
RS
HIP
| UN
ITE
D S
TAT
ES
AG
RIC
ULT
UR
AL
SE
CT
OR
Given the relative price of corn and soybeans, U.S. wheat acreage is expected to fall by
40,000 acres as a result of TPP. Domestic production is forecast to decline by 1.4 million
bushels. Domestic demand for wheat is expected to increase by 5.6 million bushels
on greater feed demand from the livestock industries. Exports are expected to fall by
6.7 million bushels as large wheat producing TPP partners like Australia gain better
access and the tariff advantage the U.S. has enjoyed in markets like Mexico erodes.
The net result is that the overall demand and supply situation is essentially unchanged.
However, with domestic land competition, wheat prices are projected to rise by 2 cents
per bushel relative to the U.S. non-participation in TPP scenario. Cash receipts are
projected to increase by $37,000,000.
riceIn 2014, rice accounted for about 1 percent of total U.S. agricultural exports to TPP
countries. Rice is an important part of consumers’ diets in many TPP countries, though
imports remain a small share of total domestic consumption. Opportunities exist for
U.S. rice exporters to increase sales of rice varieties favored by different TPP markets.
U.S. rice exports face significant tariffs in several TPP countries. In Vietnam and
Malaysia, rice tariffs are 40 percent. In Japan, the Ministry of Agriculture tightly controls
international purchases through tariff rate quotas, with out-of-quota duties that are
prohibitive, some at more than 400 percent. As a result of TPP, duties will be eliminated
immediately in Vietnam and eliminated over the course of 11 years in Malaysia. In Japan,
the U.S. gained a country-specific TRQ. The quota initially will be set at 50,000 tons and
will grow to 70,000 in 13 years. Additionally, Japan will make important modifications
to its quota administration, changes designed to enhance the transparency and the
operational efficiency and effectiveness of the new quota access for U.S. rice.
+ + =-40,000 ac-1.4 mil buNo Change
+5.6 mil bu-6.7 mil bu
+$0.02 per bushel
+$37million

12
TR
AN
S-P
AC
IFIC
PA
RT
NE
RS
HIP
|
UN
ITE
D S
TAT
ES
AG
RIC
ULT
UR
AL
SE
CT
OR
2014–2015 My rice: imports as share of Total consumption
U.S. rice acreage is expected to increase marginally (8,800 acres) as a result of
U.S. passage of the TPP. Domestic production is forecast to grow by 0.7 million cwt.
Meanwhile imports are forecast to increase by 1.7 million cwt as U.S. rice tariffs are
eliminated, making certain varieties from major rice producers like Vietnam more
competitive, while U.S. production seeks higher yield in export markets. Domestic
demand for rice is expected to decline by 0.3 million cwt as a result of higher prices.
Exports are expected to increase by 2.7 million cwt. It should be noted that U.S. exports
would be higher if bilateral trade between TPP partners was not considered. As a
result of TPP, tariff advantages the U.S. has enjoyed in markets like Mexico will erode
as other large rice producing TPP partners like Vietnam gain better access. Rice prices
are projected to rise by 16 cents per cwt relative to the U.S. non-participation scenario,
leading to an increase in cash receipts of over $45 million.
0
5000
10000
15000
20000
25000
VietnamSingaporePeruN. ZealandMexicoMalaysiaJapanChileCanadaBruneiAustralia
1,000
CW
T
+ + =+8,800 ac
+0.7 mil cwt+1.7 mil cwt
-0.3 mil cwt+2.7 mil cwt
+$0.16 per bushel
+$45million
n Consumption and Residual (MT)n Imports

13
TR
AN
S-PA
CIF
IC PA
RT
NE
RS
HIP
| UN
ITE
D S
TAT
ES
AG
RIC
ULT
UR
AL
SE
CT
OR
cottonIn 2014, cotton accounted for more than 2 percent of total U.S. agricultural exports
to TPP countries. Vietnam is a major cotton importing country, feeding its large and
growing textile industry. Vietnam imports all of the cotton it uses domestically.
Given the important role cotton plays as an input in the textile industry, U.S. cotton
faces low barriers in TPP partner countries. Tariffs on cotton are zero in most countries.
However, in the important Vietnamese market, cotton products face duties between
0 and 25 percent, all of which will be eliminated within eight years of the agreement
coming into force.
2014–2015 My cotton: imports as share of Total consumption
U.S. cotton production is forecast to grow by 13,000 bales, on an additional 9,600
acres as a result of the U.S. passing TPP. Cotton imports are not expected to change
as there are no other major cotton producers within TPP. Domestic demand for cotton
is expected to decline by 9,500 bales as more textile production moves elsewhere.
Exports are expected to increase by 22,500 bales on growing textile industries in
countries such as Vietnam. Cotton prices are not projected to change, but cash receipts
are projected to increase by $21 million on higher export demand, relative to U.S.
non-participation in TPP.
n Total Domestic Consumptionn Imports
0
1000
2000
3000
4000
5000
HolderHolderHolderHolderHolderHolderHolderVietnamMexicoMalaysiaJapan
1,000
480
-lb. B
ales
+ + =+9,600 ac
+13,000 balesNo Change
-9,500 bales+22,500 bales
+No Change +$21million

14
TR
AN
S-P
AC
IFIC
PA
RT
NE
RS
HIP
|
UN
ITE
D S
TAT
ES
AG
RIC
ULT
UR
AL
SE
CT
OR
BeefIn 2014, beef sales accounted for nearly 6 percent of total U.S. agricultural exports to
TPP countries. Japan is already the United States’ top export market for beef and beef
products, despite significant tariffs. The TPP agreement will dramatically reduce tariffs
on U.S. beef. Japan will reduce its tariff on fresh, chilled and frozen beef cuts from the
current applied tariff of 38.5 percent to 9 percent in 16 years. Tariffs on co-products and
processed beef products, currently as high as 50 percent, will be eliminated in six to 16
years. Importantly, the TPP agreement, if enacted within two years after the signing of the
agreement, will allow U.S. beef to face the same tariff rates as Australia. Australia currently
has preferential tariff access to Japan as a result of a prior FTA between Australia and
Japan. Failure to enact the agreement until after 2017 will result in Australian beef
producers always having better access than U.S. producers to Japan’s markets.
Significant tariffs on U.S. beef into Vietnam also will be reduced as a result of TPP.
Currently, fresh, chilled beef faces tariffs of 15 percent to 31 percent. Tariffs on frozen
beef are 15 percent to 20 percent, with tariffs on offals at 10 percent.
2015 Beef and Veal: imports as share of Total consumption
U.S. beef production is forecast to grow by 324 million pounds as a result of TPP.
Beef imports are also expected to grow by 29 million pounds, with additional sales
expected from Australia and even specialty beef from Japan. Domestic demand for
beef is expected to decline by 92 million pounds as a result of higher prices and slightly
lower per capita consumption. Exports are expected to increase by 444 million pounds,
predominantly as a result of increased sales to Japan and Vietnam. Increased exports
will put upward pressure on prices, leading to a $2.66 per cwt increase in fed steer
prices and larger cash receipts of $1.14 billion.
0
500
1000
1500
2000
HolderVietnamSingaporePeruN. ZealandMexicoMalaysiaJapanChileCanadaAustralia
1,000
MT
CWE
n Total Domestic Consumptionn Imports

15
TR
AN
S-PA
CIF
IC PA
RT
NE
RS
HIP
| UN
ITE
D S
TAT
ES
AG
RIC
ULT
UR
AL
SE
CT
OR
PorkIn 2014, pork accounted for nearly 6 percent of total U.S. agricultural exports
to TPP countries.
Japan is a top market for U.S. pork and pork products, despite significant tariffs.
Japan manages pork trade for a number of products (the U.S. would otherwise be
very competitive in the trade of many of them) via the Gate Price system. The Gate
Price system ensures that pork imports meet a specified threshold equivalent to the
domestic pork price. Any shipments that don’t meet that threshold are charged a duty
amount that brings the price of Japan’s pork imports up to the higher domestic price.
For products outside of the Gate Price system, significant tariffs exist. Under the TPP
agreement, Japan will eliminate tariffs on more than 65 percent of its pork and pork
product tariff lines within 11 years and on nearly 80 percent of tariff lines within 16 years.
The Gate Price system will remain, but Japan will immediately reduce the specific duty
on pork cuts from its previous maximum charge of 482 yen per kilogram to 125 yen per
kilogram, with a further reduction to 50 yen per kilogram by year 10. As a result of these
changes, the U.S. should be able to gain significantly better access to the Japanese
market at the expense of competitors without FTAs, such as the European Union.
The large Vietnamese market is currently supplied primarily from domestic sources.
However, as a result of TPP this could change. Today, U.S. fresh, chilled pork faces tariffs
of 27 percent, while a 15 percent tariff is applied to frozen pork. Most of these tariffs, as
well as significant tariffs on offals and pork products, will be eliminated within 10 years.
+ + =+324 mil lbs+29 mil lbs
-92 mil lbs+444 mil lbs
+$2.66 per cwt
+$1.14billion

16
TR
AN
S-P
AC
IFIC
PA
RT
NE
RS
HIP
|
UN
ITE
D S
TAT
ES
AG
RIC
ULT
UR
AL
SE
CT
OR
2015 Pork: imports as share of Total consumption
U.S. pork production is forecast to grow by 794 million pounds as a result of TPP. Pork
imports also are expected to grow slightly, by 0.7 million pounds, with additional sales
expected from Canada. Domestic demand for pork is expected to decline by 346 million
pounds as a result of higher prices and slightly lower per capita consumption. Exports
are expected to increase by 1.1 billion pounds, predominantly as a result of increased
sales to Japan and Vietnam. Increased exports will put upward pressure on prices,
leading to a $2.45 per cwt increase in barrow and gilt prices and larger cash receipts
of $1.1 billion relative to U.S. non-participation in TPP.
This analysis assumes the Japanese pork industry is allowed to rationalize in response
to lower domestic prices. There has been discussion regarding a support program
for Japanese pork producers that would be trade distorting and that might therefore
reduce the import needs and thus the U.S. gains. While a program of this type would
limit the benefits, failure to enact the agreement would essentially concede the market
to competitors such as Canada and possibly the European Union.
n Total Domestic Consumptionn Imports
0
500
1000
1500
2000
2500
3000
HolderHolderHolderVietnamSingaporeN. ZealandMexicoJapanChileCanadaAustralia
1,000
MT
CWE
+ + =+794 mil lbs+0.7 mil lbs
-346 mil lbs+1,104 mil lbs
+2.45 per cwt
+$1.1billion

17
TR
AN
S-PA
CIF
IC PA
RT
NE
RS
HIP
| UN
ITE
D S
TAT
ES
AG
RIC
ULT
UR
AL
SE
CT
OR
PoultryIn 2014, poultry accounted for more than 3 percent of total U.S. agricultural exports
to TPP countries. Unlike the beef and pork industries, most TPP partners produce a
significant portion of their domestic consumption of poultry. Malaysia, Vietnam and
Japan are all large poultry consuming countries and present opportunities for U.S.
poultry exports.
Today, U.S. fresh and frozen poultry not cut into parts faces tariffs of 40 percent, while a
20 percent tariff is applied to fresh and frozen poultry parts. Most of these tariffs, as well
as significant tariffs on offals and pork products, will be eliminated in 11-13 years. Japan’s
tariffs on poultry range from 3 percent to 11.9 percent depending on cut and fresh or
frozen delivery. These tariffs will all be eliminated within 11 years.
2015 Poultry: imports as share of Total consumption
U.S. poultry production is forecast to be essentially unchanged under TPP (a decline
of 8.4 million pounds—the U.S. produced over 40 billion pounds of broilers in 2015).
Exports are expected to increase by 188.9 million pounds as exporters see opportunities
to sell chicken parts less favored by U.S. consumers to those consumers in TPP
countries for which those parts are premium products. Domestic demand for poultry
is expected to decline by 196.3 million pounds as a result of higher prices. The increase
in exports will put upward pressure on prices, leading to a $1.40 per cwt increase
in wholesale broiler prices, and to larger cash receipts of more than $625 million.
n Total Domestic Consumptionn Imports
0
500
1000
1500
2000
2500
3000
3500
4000
HolderHolderVietnamSingaporePeruMexicoMalaysiaJapanChileCanadaAustralia
1,000
MT
+ + =-8.4 mil lbs+1.8 mil lbs
-196.3 mil lbs+188.9 mil lbs
+$1.40 per cwt
+$625million

18
TR
AN
S-P
AC
IFIC
PA
RT
NE
RS
HIP
|
UN
ITE
D S
TAT
ES
AG
RIC
ULT
UR
AL
SE
CT
OR
dairyIn 2014, dairy products accounted for 5 percent of total U.S. agricultural exports to TPP
countries. Dairy trade is primarily in major manufactured dairy products—butter, cheese
and dry milk powders—with some trade in fluid milk products, ice cream, yogurt and
dry whey products. The United States, along with many other dairy-trading countries in
TPP—New Zealand, Canada and Australia and major dairy importing countries in TPP,
including Japan—all maintain a system of tariff rate quotas for dairy products. The TRQs
allow imports at very low tariffs up to fixed amounts. Any additional imports are subject
to very high tariffs. Most additional market access that will be achieved through TPP
comes as a result of expanded and newly created TRQs.
2014 Butter: imports as 2014 cheese: imports as share of Total consumption share of Total consumption
2014 Whole Milk Powder: imports as share of Total consumption
n Total Domestic Consumptionn Imports
0
50
100
150
200
250
HolderHolderHolderHolderHolderHolderN. ZealandMexicoJapanCanadaAustralia
1,000
MT
0
50
100
150
200
HolderHolderHolderHolderHolderHolderHolderN. ZealandMexicoChileAustralia
1,000
MT
0
100
200
300
400
500
HolderHolderHolderHolderHolderHolderN. ZealandMexicoJapanCanadaAustralia
1,000
MT

19
TR
AN
S-PA
CIF
IC PA
RT
NE
RS
HIP
| UN
ITE
D S
TAT
ES
AG
RIC
ULT
UR
AL
SE
CT
OR
U.S. milk production is forecast to increase by 320,000 million tons as a result of TPP,
driven by increased net exports and increasing domestic consumption. These factors
combine to put upward pressure on prices, leading to a $2.80, $1.68, $1.29 and $0.21 per
cwt increase in butter, cheese, non-fat dry milk and all milk prices, respectively. Cash
receipts see an increase of $28 million.
TPP scenario
fruits, Vegetables and nutsIn 2014, fruits and nuts accounted for more than 9 percent of total U.S. agricultural
exports to TPP countries. In the same year, vegetables accounted for 4 percent of
total U.S. agricultural exports to TPP countries. U.S. fruit, vegetable and nut exports
enjoy near-free access to the markets of TPP members with which FTAs already exist.
However, tariff rates can be significant among TPP partners with no existing agreement.
Tariff rates on fruits, Vegetables and Plants
Final bound tariff rates MFN applied tariff rates (Percentages) (Percentages)
AVG Duty-free in % Max AVG Duty-free in % Max
Brunei 26.4 0.0 50 0.0 100.0 0
Japan 9.3 19.6 268 10.1 19.4 268
Malaysia 109.5 11.0 >1000 3.0 74.2 90
New Zealand 5.8 51.9 35 1.1 77.3 5
Vietnam 21.2 8.1 40 20.1 8.0 40
U.S. Non-Participation U.S. Participation Change
U.S. Production (Thousand MT)
Milk 104,800 105,119 320
U.S. Prices (Dollars per cwt)
Butter 193.61 196.41 2.81
Cheese 178.15 179.83 1.68
Nonfat dry milk 135.71 137.00 1.29
All milk 19.42 19.64 0.21
U.S. Net Trade (Thousand MT)
Butter 44 48 4.01
Cheese 244 261 17.58
Nonfat dry milk 680 689 9.15
Cash Receipts (Billion Dollars) 16.68 16.96 0.28

20
TR
AN
S-P
AC
IFIC
PA
RT
NE
RS
HIP
|
UN
ITE
D S
TAT
ES
AG
RIC
ULT
UR
AL
SE
CT
OR
Per capita consumption of fruits, vegetables and tree nuts is largely expanding among
TPP member countries. This trend is expected to continue among all members and
further increase in Vietnam, Malaysia and Brunei as per capita GDP increases, driving
consumers toward more-diversified diets.
fruit consumption Per capita
Tree nut consumption Per capita
Vegetable consumption Per capita
n Australian Brunein Canadan Chilen Japann Malaysian Mexicon New Zealandn Perun Vietnam
n Australian Brunein Canadan Chilen Japann Malaysian Mexicon New Zealandn Perun Vietnam
n Australian Brunein Canadan Chilen Japann Malaysian Mexicon New Zealandn Perun Vietnam
0
20
40
60
80
100
120
140
160
180
200Vietnam
Peru
New Zealand
Mexico
Malaysia
Japan
Chile
Canada2010200520001995199019851980
kg P
er C
apita
0
5
10
15
20
25
30
35
40
45
50Vietnam
Peru
New Zealand
Mexico
Malaysia
Japan
Chile
Canada2010200520001995199019851980
kg p
er c
apita
0
20
40
60
80
100
120
140
160
180
200Vietnam
Peru
New Zealand
Mexico
Malaysia
Japan
Chile
Canada2010200520001995199019851980
kg P
er C
apita

21
TR
AN
S-PA
CIF
IC PA
RT
NE
RS
HIP
| UN
ITE
D S
TAT
ES
AG
RIC
ULT
UR
AL
SE
CT
OR
As a result of TPP, fruit and nut cash receipts are projected to increase by $825 million,
led by almonds, walnuts, pistachios, apples and oranges. Vegetable cash receipts are
projected to increase $471 million.
Processed food and food ManufacturingIn 2014, the United States exported $25.5 billion worth of processed foods to TPP
countries, which accounted for more than 20 percent of total agricultural exports to
the region. Processed foods include a wide variety of products. A non-exhaustive list of
products includes pastas, cookies, cookie mixes and doughs, breads, beverages, sugar
products, chewing gum, prepared foods, dog and cat food, and cocoa products.
Despite significant exports, U.S. food manufacturers face significant tariff and non-tariff
barriers in TPP countries. As a result of TPP, tariffs on processed foods are set to decrease
quickly, providing additional opportunities for increased sales. The value of these
increased export opportunities are largely outside of this model. The model estimates
additional demand for commodities as ingredients in processed foods; however, only
17.4 percent of the total cost of processed food is attributable to ingredients. The result
is that our analysis only captures the farm value of increased processed food sales with
the total value of increased exports expected to be significantly larger.
Tariffs on processed foods and beverages range widely. In Japan, the simple average
tariffs on processed foods and beverages are 37 percent and 12 percent, respectively.
Tariffs as high as 26 percent on biscuits, cookies, crackers and other bread will be
eliminated in six years. In Vietnam, the simple average tariffs on processed foods and
beverages are 18 percent and 51 percent, respectively. The important products of
cookies, crackers, biscuits, breads and starches face tariffs as high as 55 percent, which
will be eliminated in eight years. Finally, in Malaysia, the simple average processed food
tariff is fairly low at 5 percent, yet many products face tariffs as high as 25 percent.
The most important element of increased processed food exports will be the impact
on employment. According to the 2012 Census, more than 1.4 million Americans were
employed in food manufacturing facilities. Increased market access for U.S. processed
food and beverage products will increase U.S. employment opportunities.

22
TR
AN
S-P
AC
IFIC
PA
RT
NE
RS
HIP
|
UN
ITE
D S
TAT
ES
AG
RIC
ULT
UR
AL
SE
CT
OR
Beyond discussions of tariffs, U.S. agricultural trade will benefit significantly from robust rules and standards agreed to under TPP. High-quality standards ensure that current and future TPP partners compete under the same set of rules. Below we have summarized the TPP chapters relevant to U.S. agriculture.
The complete text, as well as chapter summaries completed by USTR can be read here: https://ustr.gov/trade-agreements/free-trade-agreements/trans-pacific-partnership/tpp-full-text.
Chapter 2—National Treatment and Market Access for GoodsThis chapter covers tariffs and other trade barriers.
Biotechnology—TPP partners commit to provide transparency on government measures on biotechnology trade. Information sharing and procedural measures are outlined when a low-level presence of biotech material is detected in a shipment of agricultural commodities. TPP partners agree to promote the timely authorization of biotechnology products and to create a working group to address matters related to trade in agricultural biotechnology products.
export subsidies—TPP parties commit to eliminate agricultural export subsidies on goods sold in TPP markets. The U.S. no longer uses agricultural export subsidies.
export credits—The parties will work together in the WTO to reform export credit programs.
export restrictions—Limits to six months with advance notification to other TPP parties. If restrictions stay in place more than 12 months, consultation with interested TPP partners is required.
Farm Bureau supported the provisions on biotechnology during the negotiations.
chapter 2 (full text)
Chapter 3—Rules of OriginThis chapter defines what it means for a product to be originating from a TPP partner country and thereby eligible for TPP benefits.
Wholly Produced—Goods grown, harvested or fished in TPP countries are defined as TPP originating and eligible to receive TPP tariff benefits.
chapter 3 (full text)
Chapter 4—Textiles and ApparelThis chapter includes the yarn-forward approach that requires use of yarns and fabrics from TPP countries in end products in order to receive preferential treatment under TPP. Customs enforcement rules and temporary relief for import surges also is included.
chapter 4 (full text)
Chapter 5—Customs Administration and Trade FacilitationThis chapter ensures that goods traded among the TPP countries move quickly across borders by trade facilitation procedures.
release of goods—TPP countries commit to ensure that goods move through customs within 48 hours of arrival. Where a delay is due to a customs fee or duties dispute, the goods can be released on bond, subject to an appeal.
chapter 5 (full text)
TPP chaPTer sUMMaries

23
TR
AN
S-PA
CIF
IC PA
RT
NE
RS
HIP
| UN
ITE
D S
TAT
ES
AG
RIC
ULT
UR
AL
SE
CT
OR
Chapter 6—Trade RemediesThis chapter ensures that U.S. producers are able to use all trade remedy law, including anti-dumping measures, countervailing duties and safeguards. These measures are used to address injury to a domestic industry from sales below cost, subsidies to producers of exported products and injury resulting from a sudden surge of imports. U.S. exporters facing trade remedy measures from other TPP countries are provided procedural due process and transparency. The TPP agreement will not affect the rights and obligations of TPP parties under the WTO agreements covering anti-dumping, countervailing duty and safeguards.
chapter 6 (full text)
Chapter 7—Sanitary and Phytosanitary MeasuresThe TPP Sanitary and Phytosanitary (SPS) chapter includes enforceable obligations that go beyond the WTO SPS Agreement on matters such as risk assessment, risk management, transparency and border checks and laboratory testing. These measures, as well as the inclusion of a rapid response tool, will help to resolve shipment-specific issues.
science and risk analysis—The chapter establishes rules for identifying and managing SPS risks. It provides that SPS measures are based on science, conform to relevant international standards or are based on objective scientific evidence. Risk management measures must not be more trade restrictive than necessary to achieve appropriate protection levels.
import checks—TPP parties must ensure that import checks for SPS requirements are based on the actual potential risk of the imported product. Importers or exporters must be informed within seven days if a shipment is being prohibited from entry due to food safety or animal or plant health concerns.
cooperative Technical consultations (cTc)—A consultative mechanism will allow agencies to find science-based solutions to SPS issues in a timely manner—most beneficial to perishable products.
dispute settlement—For issues that cannot be resolved by the CTC approach, the TPP dispute settlement mechanism can be used. The WTO-SPS provisions, which are the basis for the SPS commitments in this chapter, remain subject to WTO dispute settlement procedures.
Farm Bureau supported the SPS provisions, including improvements to science-based standards and the rapid response mechanism for disputes, during the negotiations. USTR maintains that the SPS provisions are compliant with the Food Safety Modernization Act (FSMA).
chapter 7 (full text)
Chapter 8—Technical Barriers to Trade (TBT)The TBT chapter covers technical standards setting and conformity assessment procedures for particular products. For agriculture, standards for wines and spirits, food product formulas and organics are included. For countries that have not yet established standards, TPP will allow for participation in the standards process.
Wines and spirits—Establishes common definitions and parameters for wine and spirits labeling. In order to facilitate trade, these are now applied to the non-producing countries in the TPP.
organic Products—Standards for the labeling of organic products and equivalence between countries of production and processing requirements are intended to expand and facilitate trade in organic products.
chapter 8 (full text)

24
TR
AN
S-P
AC
IFIC
PA
RT
NE
RS
HIP
|
UN
ITE
D S
TAT
ES
AG
RIC
ULT
UR
AL
SE
CT
OR
Chapter 9—InvestmentInvestment protections have been used to guard against the nationalization of assets and against forced localization policies that are used to deter the import of goods from the United States by requiring the purchase of only local goods and services.
This chapter includes provisions for the adoption of specific tobacco control measures.
chapter 9 (full text)
Chapter 16—Competition PolicyThis chapter requires TPP partners to maintain or establish legal regimes that prohibit anticompetitive business conduct and provide open and competitive markets. These provisions establish a common approach to anti-trust law and consumer protection.
chapter 16 (full text)
Chapter 17—State-Owned EnterprisesThis chapter includes enforceable rules addressing the activities of State-Owned Enterprises (SOEs) as well as entities that have significant state-controlled activities. These rules are intended to make SOEs compete on quality and price and not be protected by discriminatory regulation and government subsidies. The activities of the SOEs of TPP partners are to be based on commercial considerations.
chapter 17 (full text)
Chapter 18—Intellectual Propertygeographic indications—This chapter includes guidelines for TPP partners on how to determine whether a term is generic in its market as well as safeguards for owners of pre-existing trademarks. The provisions are intended to be protections against the use of geographical indications in ways that discriminate against U.S. agricultural and food products. These rules governing the adoption and use of geographical indications (GIs) will help avoid their application to generic names, maintaining the free flow of trade in many U.S. products.
Farm Bureau supported rules governing the use of geographic indications during the negotiations.
chapter 18 (full text)
Chapter 19—LaborThis chapter requires TPP partners to adopt and maintain, if they do not already do so, fundamental labor rights as recognized by the International Labor Organization (ILO), including freedom of association and right to collective bargaining, elimination of forced labor, abolition of child labor and the elimination of employment discrimination. The U.S. has already adopted these fundamental labor rights.
TPP partners, if they have not already done so, will adopt laws for wages, hours of work and occupational safety.
chapter 19 (full text)
Chapter 20—EnvironmentThis chapter includes trade-related environmental matters. Specific measures are addressed to fisheries management, illegal fishing, illegal wildlife trade and illegal logging trade. TPP partners commit to eliminate tariff and non-tariff barriers on environmental goods and services. It includes measures for the enforcement of multilateral environmental agreements.
chapter 20 (full text)

Chapter 24—Small and Medium-Sized EnterprisesThis chapter requires all TPP countries to maintain a publicly accessible website that includes specific information for SMEs regarding regulations applicable to imported goods, including customs procedures and fees.
chapter 24 (full text)
Chapter 29—Exceptions and General ProvisionsThis chapter ensures that exceptions to TPP obligations are available for public interest regulation.
Tobacco—A claim challenging a tobacco-control measure shall not be subject to the investor state dispute settlement (ISDS) procedures in TPP if a TPP partner country elects to deny that benefit to a claimant. A tobacco-control measure is defined as a measure adopted or maintained by a TPP country related to the production or consumption of manufactured tobacco products. This includes the distribution, labeling, packaging, advertising, marketing, promotion, sale, purchase or use of the product. Enforcement measures such as inspection, recordkeeping and reporting requirements are also included.
This measure does not include tobacco leaf when it is not in the possession of a manufacturer of tobacco products.
Tobacco is the only product in TPP where the use of ISDS is denied to a company.
During the negotiations, Farm Bureau opposed treating tobacco differently than other commodities. There are concerns about the effect of this provision on tobacco sales internationally and whether this provision will set a precedent for countries using health concerns to restrict access for other U.S. agricultural products.
chapter 29 (full text)
