on the use minor and non-destructive methods for the
TRANSCRIPT
39th IABSE Symposium – Engineering the Future September 21-23 2017, Vancouver, Canada
1
On the use minor and non-destructive methods for the safety evaluation of an historic RC bridge: the Bôco Bridge
Luis Javier Sánchez-Aparicio, Álvaro Bautista-De Castro
Department of Land and Cartographic Engineering, University of Salamanca, High Polytechnic School of Avila, Hornos Caleros, 50, 05003 Avila, Spain
Luís F. Ramos, José Sena-Cruz
ISISE, Department of Civil Engineering, University of Minho, Campus de Azurém, 4800-058
Guimarães, Portugal
Contact: [email protected]
Abstract
Currently in use, the Bôco Reinforced Concrete (RC) Bridge, built in the early of 20th century, is one of the oldest RC bridges in Portugal. Its initial structural system, erected following the Hennebique system, was retrofitted in the 1960s to support heavy traffic, increasing the section of its structural components. However, the low quality of implemented retrofitting solution has promoted the presence of pathological processes, mainly concrete spalling and steel corrosion. In this context, the present paper shows the first results obtained during the second experimental campaign carried out on the bridge. This campaign comprised the use of several minor and non-destructive methods (laser scanning, operational modal analysis, and laboratory material characterization and mechanical tests), with the aim of improving the knowledge of the bridge and create an accurate numerical simulation (by means of Finite Element Model) to evaluate the safety level of this bridge. Results derived from this campaign, show a bridge with high load capacity, verifying the Ultimate Limit State.
Keywords: Historical construction; Reinforced concrete; Laser Scanning; Ambient Vibration Tests; Finite Element Model Updating; Safety analysis.
1 Introduction
Nowadays, transportation networks are one of the most important infrastructures of a development country. Inside the wide structural typologies presented on these networks, bridges are the most expensive and vulnerable elements [1], for which one of the most used and extended materials is the Reinforced Concrete (RC) [2].
This vulnerability, in the case of RC bridges, arises from the combination of multiple factors [3]: (i) aggressive environments, with high presence of humidity and melting salts; (ii) the concrete´s porosity; and (iii) the volumetric expansion experimented during the corrosion of the steel bars, promoting the cracking of concrete as well as the losing of mechanical adherence between it and the steel bars [4], thereby reducing the service life and structural capacity of these structures.

39th IABSE Symposium – Engineering the Future September 21-23 2017, Vancouver, Canada
2
Figure 1. The Bôco Bridge in the north part of Portugal
In addition to this, the limited knowledge of the construction technology, the theoretical background of the engineering analysis or the adoption of semi-empirical rules, such as for example the Hennebique [5] or Monier [6] systems, makes the study and preservation of historical RC bridges a challenging topic. Therefore, it is necessary the use of a multidisciplinary approach to diagnose these structures [7] [8].
The present work shows the first results obtained on the analysis of one of the oldest RC bridges in Portugal: the Bôco Bridge (Fig. 1). The bridge was retrofitted in the 1960s to support heavy traffic. However, the low quality of implemented retrofitting solution (concrete jacketing of all the frame elements and concrete overlay of the slab) has promoted the presence of pathological processes (especially on the arch girders).
According with this, the paper is organized as follows: Section 1 is the introduction; Section 2 briefly describes the bridge; Section 3 presents the methods used during the experimental campaign; Section 4 shows an evaluation of the experimental data obtained; Section 4 is devoted to the numerical simulation and its robust calibration; and finally, in Section 5 the conclusions are resented.
2 Bridge description
Located along the road EM595-1, Bôco Bridge is considered one of the oldest reinforcement concrete bridges in use in Portugal. Being built
between the years 1909 and 1910, under the supervision of Sebastião Lopes and following the Hennenbique system [5]. This initial structure was later retrofitted in 1962 to support heavy traffic, increasing the sections (average increase of 47%) (Table 1) of its structural components [8].
Table 1. Sections of the different structural
components before and after the major
rehabilitation.
Structural component
Before (m2)
After (m2)
% increase
Arch mid-span
0.15 0.30 50.0
Arch at the abutments
0.21 0.43 50.6
Columns 0.06 0.11 44.2
Longitudinal girders
0.10 0.17 39.4
Transversal girders
0.07 0.17 57.6
Central girders
0.06 0.11 42.9
However, the poor quality of the new concrete layer has promoted on the bridge the presence of concrete´s spalling as well as corrosion of the steel bars [8]. Pathological processes specially presented on the supports of the arch girders (Fig. 2).

39th IABSE Symposium – Engineering the Future September 21-23 2017, Vancouver, Canada
3
Figure 2. Detail of one of the damaged arch girders
3 Experimental campaign
Carried out in 2012, the first experimental campaign was focused on the mechanical and chemical characterization of the RC used in the bridge [8]. Considering this, the present campaign was focused on the accurate geometrical and dynamical characterization of the bridge, with the aim of creating an accurate numerical model of the bridge.
3.1 3D recording: The Terrestrial Laser Scanner
Due to the complex situation and size of the bridge, a lightweight Terrestrial Laser Scanner (TLS) system: the Faro Focus 3D 120, was used (Fig. 3). This TLS is based on the phase sift physical principle, allowing fast data acquisition (from 122 000 to 976 000 points/sec) in a range comprised between 0.6 and 120 m with a nominal accuracy of 2 mm at 25 m.
Figure 3. Recording system during the geometrical
characterization of the bridge
Additionally to this sensor, 10 registration spheres were used to register the different scan stations. On one hand 5 registration spheres, with 100 mm of radius, were used to link the upper with the
lower part of the bridge. Meanwhile, 5 spheres with 72.5 mm of radius were used to register the rest of the scans.
3.2 Ambient Vibration Tests
Complementary to the geometrical characterization of the structure, an Ambient Vibration Test (AVT) was carried out to evaluate the dynamic properties of the bridge and calibrate the numerical model used to evaluate the safety conditions of the structure.
With the aim of setting up the AVT, a preliminary modal evaluation was carried out to select and optimize sensor number and configuration (Fig. 4).
Figure 4. Results of the preliminary modal
identification analysis
Regarding the variables used during the numerical simulation, identical values that those used in the simulation of the Luiz Bandeira Bridge (erected following the same construction system) were considered [7].
According with the results obtained, 14 uniaxial piezo electric accelerometers (10 V/g sensitivity, range of ± 0.5 g and 8 µg rms broadband resolution) were distributed along the deck in a total of 2 setups (Fig. 5). Complementary to this, times series of 20 mins were used to capture the data in each setup, with a sampling frequency of 256 Hz.

39th IABSE Symposium – Engineering the Future September 21-23 2017, Vancouver, Canada
4
Figure 5. Setups used during the AVT
3.3 Additional Material tests
As mentioned before, previous tests were carried out to analysis de material properties, namely chemical composition, and physical properties of the concrete and steel. Porosity and carbonation depth was also analysed after Young’s modulus and compressive strength tests.
4 Experimental results
4.1 From point clouds to the CAD model
To capture the whole structure a total of 16 scan stations were required: (i) 7 scans to record the lower part of the bridge; and (ii) 9 scans to capture its upper part. It is worth mentioning that each scan station is placed into a local coordinate system, requiring the use of an alignment procedure to place them into a common coordinate system. Considering this, as well as the registration spheres used during the data acquisition, a target-based registration approach was follow [9]. Obtaining as a results a complete, dense and accurate 3D representation of the bridge, composed by 672 316 191 points with a registration error of 3.30 ± 1.49 mm.
Due to the large amount of data capture, especially on the overlap areas, a density filter with a threshold of 1 cm was applied. As a result, a homogenous point cloud was obtained, composed by 9 853 819 points (1.47% of the original point cloud) (Fig. 6).
Figure 6. Point cloud after the optimization
Finally, several orthogonal views and sections were extracted, following the approach proposed by (10), with the aim of create an accurate beam model of the bridge. Taking into account the AVT configurations (on which the x axis corresponds with the longitudinal axis of the bridge and the y axis with the transversal one) a rotation of the CAD model was carried out to align it with the axis considered during the dynamic identification test.
4.2 Dynamic identification
Regarding the AVT processing, the Enhanced Frequency Domain Decomposition (EFFD) algorithm, available from extractor software ARTeMIS [11], was used. In this technique each mode is estimated as a decomposition of the system´s response spectral densities into several single degree of freedom systems [12]. As a result, 12 vibration modes were identified, with frequencies that ranges from 4.15 Hz for the first one to 11.75 Hz for the fifth mode (Table 2).
Table 2. Modal parameters obtained from the AVT
Mode shape
Frequency (Hz)
Freq. CoV (%)
Damping ratio (%)
Freq. CoV (%)
1 4.15 0.02 1.91 1.70
2 6.51 <0.01 2.13 2.60
3 9.88 0.01 0.62 1.75
4 11.53 0.02 1.54 2.57
5 11.75 0.02 1.36 2.99
4.3 Material properties
Twelve cylindrical core samples and four steel samples were taken from the bridge. It was found that the average binder to aggregate ratio was 1:6.3 in weight. Scanning electron microscopy (SEM) was used to find the chemical composition of the concrete. The binder was Portland cement and contains approximately 60% CaO, 36% SiO2, and 3% Al2O3. The aggregate used was approximately 84% SiO2, 8% Al2O3, and 5% K2O. The granulometric grading of the sand showed 83% of insoluble fraction, with 80% of sand particle diameter greater than 1.4 mm [8].
39th IABSE Symposium – Engineering the Future September 21-23 2017, Vancouver, Canada
5
The new concrete used during the rehabilitation work carried out in the year 1962 has a significantly lower value of density and higher porosity when compared to the original concrete. The average porosity index for the original concrete was 3.2%, whereas the new concrete has an average porosity index of 9.8%. On the other hand, the average specific mass of the original concrete was found to be 2 418 kg/m3, whereas the new concrete has an average specific mass of 2 144 kg/m3 [8].
Furthermore, the carbonation depth of different structural members was analysed for the old as well as the new concrete. It was found that the new concrete was completely carbonized [8].
Finally, very high compressive strength of the old concrete, with an average compressive strength of 52.1 MPa was observed (compressive strength class C35/45). In comparison, the new concrete has significantly lower average compressive strength of 21.1 MPa. The average value for the modulus of elasticity of the old concrete was 41.3 MPa [8].
In case of the steel samples, chemical test were performed on the sample of steel taken from the bridge using X-ray fluorescence spectrometer and carbon element test. The test showed mild steel with low level of carbon. The average yield strength of four samples was found to be 361.79 MPa with a coefficient of variation (CoV) of 11.68%, and the average ultimate tensile strength was equal to 436.23 MPa with a coefficient of variation (CoV) of 7.9%. More results can be found elsewhere [8].
5 Numerical simulation and model updating
5.1 Numerical model
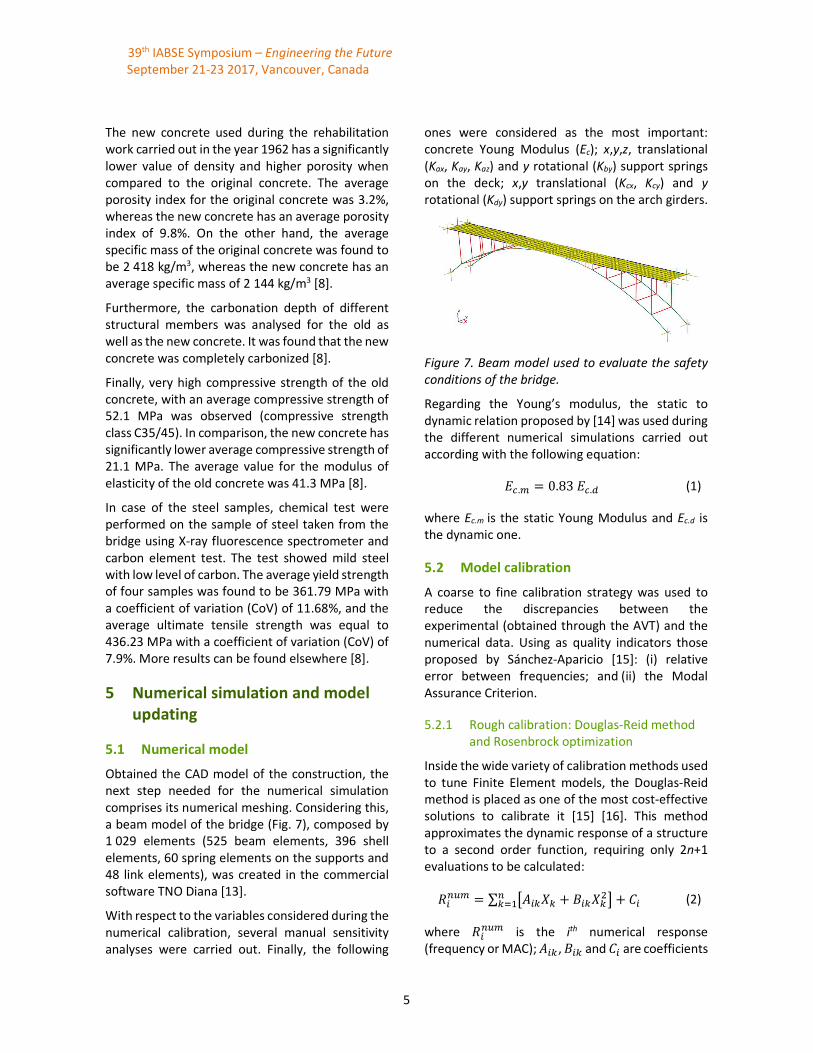
Obtained the CAD model of the construction, the next step needed for the numerical simulation comprises its numerical meshing. Considering this, a beam model of the bridge (Fig. 7), composed by 1 029 elements (525 beam elements, 396 shell elements, 60 spring elements on the supports and 48 link elements), was created in the commercial software TNO Diana [13].
With respect to the variables considered during the numerical calibration, several manual sensitivity analyses were carried out. Finally, the following
ones were considered as the most important: concrete Young Modulus (Ec); x,y,z, translational (Kax, Kay, Kaz) and y rotational (Kby) support springs on the deck; x,y translational (Kcx, Kcy) and y
rotational (Kdy) support springs on the arch girders.
Figure 7. Beam model used to evaluate the safety
conditions of the bridge.
Regarding the Young’s modulus, the static to dynamic relation proposed by [14] was used during the different numerical simulations carried out according with the following equation:
��.� � 0.83��. (1)
where Ec.m is the static Young Modulus and Ec.d is the dynamic one.
5.2 Model calibration
A coarse to fine calibration strategy was used to reduce the discrepancies between the experimental (obtained through the AVT) and the numerical data. Using as quality indicators those proposed by Sánchez-Aparicio [15]: (i) relative error between frequencies; and (ii) the Modal Assurance Criterion.
5.2.1 Rough calibration: Douglas-Reid method and Rosenbrock optimization
Inside the wide variety of calibration methods used to tune Finite Element models, the Douglas-Reid method is placed as one of the most cost-effective solutions to calibrate it [15] [16]. This method approximates the dynamic response of a structure to a second order function, requiring only 2n+1 evaluations to be calculated:
�� �� � ∑ ������ � �����
�� � �� ��� (2)
where �� �� is the ith numerical response
(frequency or MAC); ��� , ��� and �� are coefficients

39th IABSE Symposium – Engineering the Future September 21-23 2017, Vancouver, Canada
6
of the second order function; and �� the k numerical variable used during the calibration.
For the case of the Young’s modulus, a static value of 33.5 GPa (C35/45 concrete) was considered with an upper and a lower bound of ± 20% (acceptable values taking into account the deviation values obtained during the mechanical tests, as well as the current state of the bridge). Regarding the spring used to simulate the interaction between the structure and the supports, upper and lower bounds were extracted from the literature [17][18][19].
Taking into account the approach previously defined, the first fifth modes (frequencies and modal shapes) were considered for the calibration of the numerical model. Fitted the second order response curve, the Rosenbrock optimization algorithm [20] was used to estimate the minimum of the cost function considered, such as:
� � ��
(∑ ����,���
��� � ∑ �!"#�!"#,���
��� ) (3)
��,� �%&'(,� − % ��,�
%&'(,� (4)
�!"#,� � 1 − +��� (5)
where � represents the cost function; %&'(,� and
% ��,�,the ith experimental and numerical frequencies; +��� the ith modal assurance
criterion; and ��,� and �!"#,� its residuals. As a
result, a calibrated numerical model was obtained (Table 3). Showing a mean error of 6.23% in frequencies and an average MAC value of 0.93.
Table 3. Discrepancies obtained during the robust
calibration
Vibration mode
fexp(Hz) fnum(Hz) ferror(%) MAC
1 4.15 3.90 6.02 0.97
2 6.51 6.10 6.30 0.95
3 9.88 9.12 7.69 0.97
4 11.53 12.10 −4.94 0.81
5 11.75 12.48 −6.21 0.93
5.2.2 Robust updating: Non-Linear Least Squares
Finally, and considering as a start point the minimum obtained during the rough calibration, a robust calibration stage was carried out. During this calibration stage a deterministic gradient-based procedure, based on Gauss-Newton search and the Trust Region method [21], was used to find the minimum of the cost function previously defined [2]. After 14 iterations, the cost function � converges in a minimum, throwing the following results (Table 4).
Table 4. Discrepancies obtained during the robust
calibration.
Vibration mode
fexp (Hz) fnum
(Hz) ferror (%) MAC
1 4.15 4.04 2.65 0.97
2 6.51 6.60 −1.38 0.95
3 9.88 9.45 4.35 0.97
4 11.53 11.94 −3.56 0.84
5 11.75 12.14 3.32 0.86
Taking into account the complexity of the model, the matching between the experimental and the numerical results (with a relative error in frequencies of 3.05 % and an average MAC value of 0.92) was considered acceptable.
5.3 Safety evaluation
Considering the results obtained from the robust calibration strategy, a safety evaluation was carried out. This evaluation compared the maximum flexural capacity of each structural element with those flexural moments obtained in the numerical simulation (Fig. 7).
Figure 8. Structural elements evaluated
39th IABSE Symposium – Engineering the Future September 21-23 2017, Vancouver, Canada
7
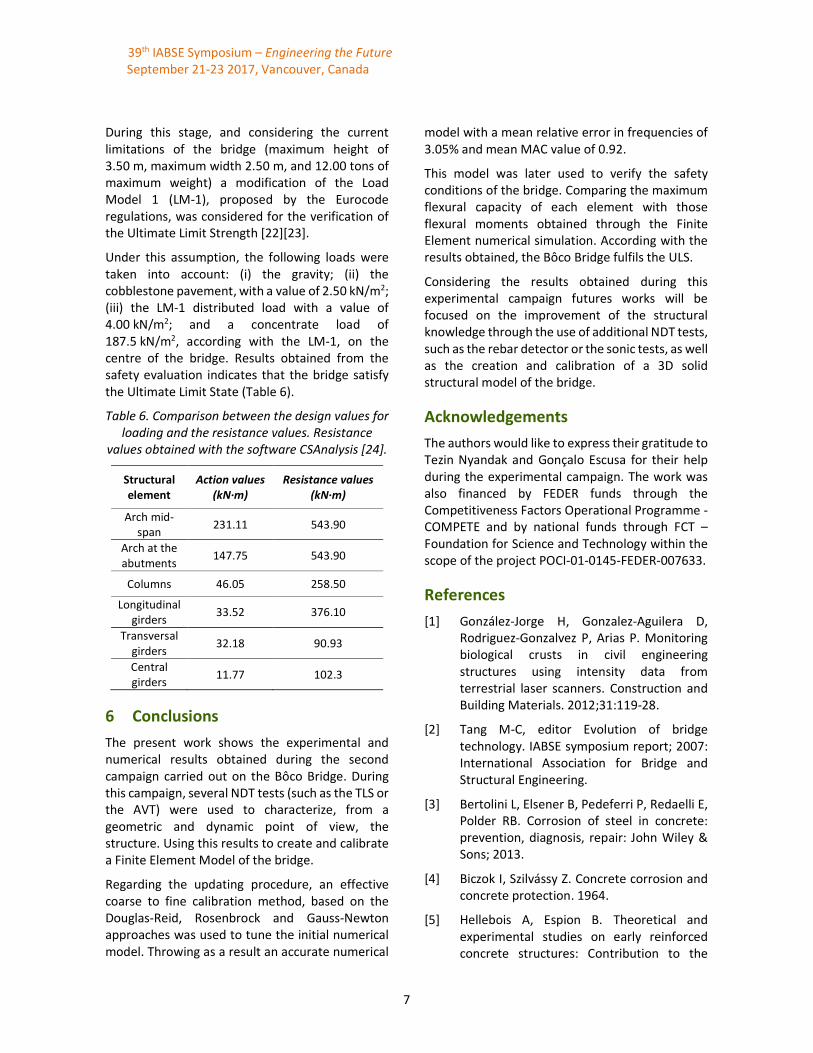
During this stage, and considering the current limitations of the bridge (maximum height of 3.50 m, maximum width 2.50 m, and 12.00 tons of maximum weight) a modification of the Load Model 1 (LM-1), proposed by the Eurocode regulations, was considered for the verification of the Ultimate Limit Strength [22][23].
Under this assumption, the following loads were taken into account: (i) the gravity; (ii) the cobblestone pavement, with a value of 2.50 kN/m2; (iii) the LM-1 distributed load with a value of 4.00 kN/m2; and a concentrate load of 187.5 kN/m2, according with the LM-1, on the centre of the bridge. Results obtained from the safety evaluation indicates that the bridge satisfy the Ultimate Limit State (Table 6).
Table 6. Comparison between the design values for
loading and the resistance values. Resistance
values obtained with the software CSAnalysis [24].
Structural element
Action values
(kN·m)
Resistance values
(kN·m)
Arch mid-span
231.11 543.90
Arch at the abutments
147.75 543.90
Columns 46.05 258.50
Longitudinal girders
33.52 376.10
Transversal girders
32.18 90.93
Central girders
11.77 102.3
6 Conclusions
The present work shows the experimental and numerical results obtained during the second campaign carried out on the Bôco Bridge. During this campaign, several NDT tests (such as the TLS or the AVT) were used to characterize, from a geometric and dynamic point of view, the structure. Using this results to create and calibrate a Finite Element Model of the bridge.
Regarding the updating procedure, an effective coarse to fine calibration method, based on the Douglas-Reid, Rosenbrock and Gauss-Newton approaches was used to tune the initial numerical model. Throwing as a result an accurate numerical
model with a mean relative error in frequencies of 3.05% and mean MAC value of 0.92.
This model was later used to verify the safety conditions of the bridge. Comparing the maximum flexural capacity of each element with those flexural moments obtained through the Finite Element numerical simulation. According with the results obtained, the Bôco Bridge fulfils the ULS.
Considering the results obtained during this experimental campaign futures works will be focused on the improvement of the structural knowledge through the use of additional NDT tests, such as the rebar detector or the sonic tests, as well as the creation and calibration of a 3D solid structural model of the bridge.
Acknowledgements
The authors would like to express their gratitude to Tezin Nyandak and Gonçalo Escusa for their help during the experimental campaign. The work was also financed by FEDER funds through the Competitiveness Factors Operational Programme - COMPETE and by national funds through FCT – Foundation for Science and Technology within the scope of the project POCI-01-0145-FEDER-007633.
References
[1] González-Jorge H, Gonzalez-Aguilera D, Rodriguez-Gonzalvez P, Arias P. Monitoring biological crusts in civil engineering structures using intensity data from terrestrial laser scanners. Construction and Building Materials. 2012;31:119-28.
[2] Tang M-C, editor Evolution of bridge technology. IABSE symposium report; 2007: International Association for Bridge and Structural Engineering.
[3] Bertolini L, Elsener B, Pedeferri P, Redaelli E, Polder RB. Corrosion of steel in concrete: prevention, diagnosis, repair: John Wiley & Sons; 2013.
[4] Biczok I, Szilvássy Z. Concrete corrosion and concrete protection. 1964.
[5] Hellebois A, Espion B. Theoretical and experimental studies on early reinforced concrete structures: Contribution to the
39th IABSE Symposium – Engineering the Future September 21-23 2017, Vancouver, Canada
8
analysis of the bearing capacity of the Hennebique system. 2013.
[6] Bosc J-L, Chauveau J-M, Clément J, Degenne J, Marrey B, Paulin M. Joseph Monier et la naissance du ciment armé: Ed. du Linteau; 2001.
[7] Sena-Cruz J, Ferreira RM, Ramos LF, Fernandes F, Miranda T, Castro F. Luiz Bandeira Bridge: Assessment of a Historical Reinforced Concrete (RC) Bridge. International Journal of Architectural Heritage. 2013;7(6):628-52.
[8] Sena-Cruz J, Araújo JC, Castro F, Jorge M. Assessment of the bôco historical RC bridge. SAHC2012–Structural Analysis of Historical Constructions. 2012:2214-21.
[9] Yun D, Kim S, Heo H, Ko KH. Automated registration of multi-view point clouds using sphere targets. Advanced Engineering Informatics. 2015;29(4):930-9.
[10] TOGNACCINI R. La chiesa di Santa Maria del Mar a Barcellona: dal rilievo tridimensionale all'analisi strutturale. 2009.
[11] Solutions SV. ARTeMIS Extractor: Ambient Response Testing and Modal Identification Software, User’s Manual. Demark; 2001.
[12] Brincker R, Zhang L, Andersen P, editors. Modal identification from ambient responses using frequency domain decomposition. Proc of the 18*‘International Modal Analysis Conference (IMAC), San Antonio, Texas; 2000.
[13] Diana T. DIANA-finite element analysis. The Netherlands. 2005.
[14] Neville AM. Properties of concrete1995.
[15] Sánchez-Aparicio LJ, Riveiro B, Gonzalez-Aguilera D, Ramos LF. The combination of geomatic approaches and operational modal analysis to improve calibration of finite element models: A case of study in Saint Torcato Church (Guimarães, Portugal). Construction and Building Materials. 2014;70:118-29.
[16] Ramos LF, Aguilar R, Lourenço PB, Moreira S. Dynamic structural health monitoring of Saint Torcato church. Mechanical Systems and Signal Processing. 2013;35(1–2):1-15.
[17] Chen X, Omenzetter P, Beskhyroun S, editors. Calibration of the Finite Element Model of a Twelve-Span Prestressed Concrete Bridge Using Ambient Vibration Data. EWSHM-7th European Workshop on Structural Health Monitoring; 2014.
[18] Zordan T, Briseghella B, Liu T. Finite element model updating of a tied-arch bridge using Douglas-Reid method and Rosenbrock optimization algorithm. Journal of Traffic and Transportation Engineering (English Edition). 2014;1(4):280-92.
[19] Jung D-S, Kim C-Y. Finite element model updating on small-scale bridge model using the hybrid genetic algorithm. Structure and Infrastructure engineering. 2013;9(5):481-95.
[20] Rosenbrock H. An automatic method for finding the greatest or least value of a function. The Computer Journal. 1960;3(3):175-84.
[21] Sánchez-Aparicio LJ, Ramos LF, Sena-Cruz J, Barros JO, Riveiro B. Experimental and numerical approaches for structural assessment in new footbridge designs (SFRSCC–GFPR hybrid structure). Composite Structures. 2015;134:95-105.
[22] Gulvanessian H, Calgaro J-A, Holický M. Designer's guide to EN 1990: eurocode: basis of structural design: Thomas Telford; 2002.
[23] CEN E. 2 Eurocode 1: Actions on structures-Part 2: Traffic loads on bridges, 2003. Paris; 1991.
[24] Miranda H, Azevedo ÁF, Sena-Cruz J. Cálculo orgânico de secções quaisquer em flexão desviada segundo o Eurocódigo 2. Encontro Nacional Betão Estrutural 2008: actas. 2008:1-10.