on the use of base choice strategy for …1241066/fulltext01.pdf · investigate the quality of...
TRANSCRIPT
Malardalen UniversitySchool of Innovation Design and Engineering
Vasteras, Sweden
Thesis for the Degree of Bachelor of Science in Computer Science15.0 credits
ON THE USE OF BASE CHOICESTRATEGY FOR TESTING
INDUSTRIAL CONTROL SOFTWARE
Simon [email protected]
Examiner: Daniel SundmarkMalardalen University, Vasteras, Sweden
Supervisor: Eduard Paul EnoiuMalardalen University, Vasteras, Sweden
May 25, 2016
Malardalen University Bachelor Thesis
Abstract
Testing is one of the most important parts of software development. It is used to ensure that thesoftware is of a certain quality. In many situations it is a time consuming task that is manuallyperformed and error prone. In the last couple of years a wide range of techniques for automatedtest generation have been explored with the goal of performing more efficient testing both in termsof cost and time. Many of these techniques are using combinatorial methods to explore differentcombinations of test inputs. Base Choice (BC) is a combinatorial method that has been shown tobe efficient and effective at detecting faults. However, it is not very well studied how BC comparesto manual testing performed by industrial engineers with experience in software testing.
This thesis presents the results of a case study comparing BC testing with manual testing. Weinvestigate the quality of manual tests and tests created using BC strategy in terms of decisioncoverage, fault detection capability and cost efficiency (in terms of number of test cases). Weused recently developed industrial programs written in the IEC 61131-3 FBD language, a popularprogramming language for embedded software using programmable logic controllers. For generatingtests using BC we used the Combinatorial Testing Tool (CTT) developed at Malardalen University.
The results of this thesis show that manual tests performed significantly better than BC generatedtests in terms of achieved decision coverage and fault detection. In average manually written testsachieved 97.38% decision coverage while BC tests suites only achieved 83.10% decision coverage. Infault detection capabilities, manual test suites found in average 88.90% of injected faults comparedto 69.53% fault detection by BC generated test suites. We also found that manual tests are slightlyshorter in terms of number of tests compared to BC testing. We found that the use of BC is heavilyaffected by the choice of the base values chosen by the tester. By using more precise base choicevalues in BC testing may have yielded different results in terms of decision coverage and faultdetection.
1

Table of Contents
1 Introduction 5
2 Background 62.1 Programmable Logic Controllers . . . . . . . . . . . . . . . . . . . . . . . . . . . . 62.2 Combinatorial Testing . . . . . . . . . . . . . . . . . . . . . . . . . . . . . . . . . . 82.3 Base Choice Criteria . . . . . . . . . . . . . . . . . . . . . . . . . . . . . . . . . . . 8
3 Methodology 103.1 Problem Formulation . . . . . . . . . . . . . . . . . . . . . . . . . . . . . . . . . . . 103.2 Case Study Process . . . . . . . . . . . . . . . . . . . . . . . . . . . . . . . . . . . . 10
3.2.1 Selection of Programs . . . . . . . . . . . . . . . . . . . . . . . . . . . . . . 113.2.2 Combinatorial Testing Tool . . . . . . . . . . . . . . . . . . . . . . . . . . . 123.2.3 Test Generation . . . . . . . . . . . . . . . . . . . . . . . . . . . . . . . . . 123.2.4 Metrics . . . . . . . . . . . . . . . . . . . . . . . . . . . . . . . . . . . . . . 133.2.5 Descriptive Statistics . . . . . . . . . . . . . . . . . . . . . . . . . . . . . . . 15
3.3 Execution Framework . . . . . . . . . . . . . . . . . . . . . . . . . . . . . . . . . . 15
4 Results and Analysis 164.1 Decision Coverage . . . . . . . . . . . . . . . . . . . . . . . . . . . . . . . . . . . . 164.2 Fault Detection . . . . . . . . . . . . . . . . . . . . . . . . . . . . . . . . . . . . . . 184.3 Number of Test Cases . . . . . . . . . . . . . . . . . . . . . . . . . . . . . . . . . . 19
5 Discussion and Validity Threats 215.1 Discussion . . . . . . . . . . . . . . . . . . . . . . . . . . . . . . . . . . . . . . . . . 215.2 Threats to Validity . . . . . . . . . . . . . . . . . . . . . . . . . . . . . . . . . . . . 22
6 Related Work 23
7 Conclusion 24
8 Future Work 25Bibliography . . . . . . . . . . . . . . . . . . . . . . . . . . . . . . . . . . . . . . . . . . 27
2

List of Figures
2.1 PLC hardware. . . . . . . . . . . . . . . . . . . . . . . . . . . . . . . . . . . . . . . 72.2 An example of program running on a PLC. . . . . . . . . . . . . . . . . . . . . . . 7
3.1 Research methodology. . . . . . . . . . . . . . . . . . . . . . . . . . . . . . . . . . . 113.2 Experiment methodology. . . . . . . . . . . . . . . . . . . . . . . . . . . . . . . . . 123.3 Functionality of CTT. . . . . . . . . . . . . . . . . . . . . . . . . . . . . . . . . . . 13
4.1 Decision coverage achieved by each testing approach. . . . . . . . . . . . . . . . . . 174.2 Decision coverage comparison. . . . . . . . . . . . . . . . . . . . . . . . . . . . . . . 184.3 Mutation score achieved by each testing approach. . . . . . . . . . . . . . . . . . . 194.4 Mutation score comparison. . . . . . . . . . . . . . . . . . . . . . . . . . . . . . . . 194.5 Number of test cases created for each testing approach. . . . . . . . . . . . . . . . 204.6 Number of test cases comparison . . . . . . . . . . . . . . . . . . . . . . . . . . . . 20
3

List of Tables
2.1 Example of test executed on a PLC program . . . . . . . . . . . . . . . . . . . . . 82.2 Example of generated test using BC . . . . . . . . . . . . . . . . . . . . . . . . . . 8
3.1 Supported variable types in CTT. . . . . . . . . . . . . . . . . . . . . . . . . . . . 123.2 Generation time in milliseconds using CTT. . . . . . . . . . . . . . . . . . . . . . . 143.3 Number of mutants created for each program used in the experiment. . . . . . . . 15
4.1 Experiment Results. . . . . . . . . . . . . . . . . . . . . . . . . . . . . . . . . . . . 16
5.1 Test Suite for BC using the base choice provided by the test engineer. . . . . . . . 225.2 Test Suite for BC using the base choice selected by the author of this thesis. . . . . 225.3 Comparison between two BC test suites each with different base values. . . . . . . 22
4

Chapter 1
Introduction
Software development contains several phases which are important to ensure the quality of theprogram. One of the most important parts is the testing of the software to make sure that theprogram works as intended. Testing can consume much time for the developers and therefore itis of interest to make this phase as efficient as possible. There are industrial companies wheremanual testing is a popular method of testing software, such as Bombardier Transportation AB inSweden. This company is testing software on a regular basis for their Train Control ManagementSystem (TCMS) which runs on Programmable Logic Controllers (PLC). However, there are severalmethods for automatic test generation which can be more cost efficient such as combinatorialtesting strategies. Some of these techniques include: All Combination (AC), Each Choice (EC),Orthogonal Array (OA), Base Choice (BC), and Advanced Combinatorial Testing System (ACTS).Several recent empirical studies [1, 2] showed the value of BC in fault detection capabilities, costefficiency in terms of test cases used but also decision coverage to some extent. Therefore, wewere interested to investigate the use of base choice strategy for testing industrial PLC softwarein comparison with manually written tests. To our knowledge, no studies have been conductedregarding the comparison between BC and manual testing.
In this thesis, results from an empirical case study are presented. The quality of the testingstrategies will be measured in terms of decision coverage, fault detection capabilities and cost (interms of test cases used). Fault detection was measured using mutation analysis which means thatfaults were created and injected into the programs. Besides manual and BC tests, tests generatedusing a Random strategy was also used as a baseline. The number of test cases used for Randomwas equal to the amount used for BC tests. The results were then analyzed using descriptivestatistics. All programs used were written in FBD which is a IEC 61131-3 [3] language for PLCprograms. For the generation of tests used in the thesis, a tool developed at Malardalen Universitywas used. This tool was chosen due to its support for BC and Random test generation and thecapability to use this tool with PLC programs in their native format.
The results of this thesis showed that manually written tests performed far better than testscreated using BC. In decision coverage and fault detection, manual tests were significantly betterthan both Random and BC tests, while the number of test cases used for all tests were similar inaverage (12.84 test cases for manual tests and 15.13 test cases for BC and Random). The differencein number of faults found was found to be in average approximately 19% for manual test and BCtest. There are several factors which could have influenced the thesis results that might explainthe cause for the low fault detection and coverage criteria for BC.
In Chapter 2 we present an overview of PLC hardware and software, combinatorial testingand the base choice criteria. Chapter 3 describes the methodology used throughout the research.Chapter 4 presents the results and the analysis of the conducted experiment in terms of decisioncoverage, fault detection and number of tests. In Chapter 5 we discuss the results in order to tryand explain the yielded results, clarify the limitations and describe the validity threats. Chapter6 describes related work. Chapter 7 we present our conclusions. In Chapter 8 we suggest possiblefuture research and work.
5
Chapter 2
Background
Software testing is one of the most important aspects of software development to ensure thatsoftware works as intended is crucial in certain application domains, for example in the railwaytransportation. The software needs to be able to control different train functions. ProgrammableLogic Controllers (PLC) which are real-time controllers used in numerous industrial domains, areintensely used in the train domain. Software faults can be catastrophic, especially in railwaytransportation, and therefore the software is developed to follow certain safety standards (i.e.,according to CENELEC 50128 [4]). These standards are mandating that testing of the PLCsoftware should show evidence of achieved software testing.
2.1 Programmable Logic Controllers
A programmable logic controller is type of microprocessor-based controller [5]. It manages processesand controls machines using a programmable memory which is designed to be operated by engineerswith limited knowledge programming languages. The modularization of the PLC allows changesin the control system just by using new instructions without any hardware changes, which makesPLCs cost efficient and flexible [5]. This makes PLCs highly customizable and allows mixed typesof I/O devices according to applications requirements and is often used in different industrialenvironments [6]. However, due to its flexibility, PLCs lack standardization and cannot fulfillthe standard set by the International Electrotechnical Commission (IEC) within the IEC 61131-3[3] standard entirely. Each PLC usually provides a document describing which parts of the IEC61131-3 standard are implemented and which parts of the IEC 61131-3 standard are not covered[6].
A PLC usually consists of the following constituent parts (mirrored in Figure 2.1) [5]:
• A central processing unit (CPU)
• A power supply
• A programming device
• A memory unit
• A input and output sections
• A communications interface
The CPU which contains the microprocessor interprets the input signals and carries out controlactions accordingly. The program and signals which the CPU has to interpret are developed inthe programming device where users can enter the necessary program into the memory unit. Thememory unit contains the control actions which the CPU can carry out when needed. It also storesinput and output information. The input interface receives information from external devices (e.g.temperature sensors or flow sensors) and communicates through either discrete, digital or analogsignals. The output interface also communicates through discrete, digital or analog signals but
6

Malardalen University Bachelor Thesis
instead of receiving information from external devices it delivers signals to external devices. Tocommunicate with other PLCs [5], the communication interface is used to receive and transmitdata.
Figure 2.1: PLC hardware.
A program running on a PLC usually executes in a cyclic loop. Each loop has three phaseswhich begins with a reading phase where all inputs are read and stored accordingly. This phaseis followed by an execution phase where all computations are performed and are then passed tothe last writing phase which updates the outputs. The processor primarily interprets logic andswitching operations to control input devices. The program that the CPU executes must be writtenin one of the five languages defined by the International Electrotechnical Commission (IEC) withinthe IEC 61131-3 standard [3]. An FBD program for a PLC could look as shown in Figure 2.1.This program is used to handle the train functionality of calculating the sum of the available breakeffort and achieved brake effort. It also determines if output shall be set and distributed to allparts of the train.
Figure 2.2: An example of program running on a PLC.
In the program shown in Figure 2.1, the DIV block divides input 2 with constant 1 and sendsthe result forward to the next block. GT checks if the user input is greater than the constant inputand it outputs a signal of value 1 if the input is greater and 0 if it is less than the constant. TheAND block outputs a signal of value 1 if both inputs are equal to 1 and outputs 0 if either of theinputs are 0. An example of the generated outputs using certain test cases are shown in Table 2.1.
7

Malardalen University Bachelor Thesis
Input 1 Input 2 Input 3 Input 4 Output 1 Output 20 2 3 0 0 01 0 3 0 1 01 2 0 0 0 01 2 3 1 1 11 2 3 0 1 0
Table 2.1: Example of test executed on a PLC program
2.2 Combinatorial Testing
Numerous techniques have been developed to help software testers in automatically generatingtests [7]. In the last two decades different combinatorial testing techniques were proposed in orderto automate the test generation process. Combination strategies generate test cases that coversall the interactions of variables at some level of interaction by allowing the selection of values andtheir combination according to a certain algorithm to produce a complete test case [1]. Some ofthese combination strategies include: All Combination (AC), Each Choice (EC), Orthogonal Array(OA), Automatic Efficient Test Generator (AETG) and Base Choice (BC). The result of using acombination strategy is a test case, a combination of variable values that are chosen depending onvariable ranges and the strategy used. Each test case is executed one at a time on the programunder test. A collection of test cases defines a test suite.
2.3 Base Choice Criteria
Base Choice (BC) [8] is a combinatorial testing technique used to automatically generate test cases.The base test case may be determined by a certain criterion, like the simplest value. A criterionsuggested by Ammann and Offutt [8] is the most likely value from the point of view of the user.This value could be determined by the tester. By using BC, one is able to generate test casesby choosing a range for each input variable and a base (default) choice value. The test cases arethen generated by using the base choice value for all variables except one, which goes through allnon-base choice values and then it continues with the next variable. The selected base choice istypically either an expected and common input value or a default value.
Test case # Input 1 Input 2 Input 3 Input 41 0 2 3 02 2 2 3 03 3 2 3 04 4 2 3 05 5 2 3 06 1 0 3 07 1 1 3 08 1 3 3 09 1 4 3 010 1 5 3 011 1 2 0 012 1 2 1 013 1 2 2 014 1 2 4 015 1 2 5 016 1 2 3 117 1 2 3 0
Table 2.2: Example of generated test using BC
For example, tests generated using BC strategy for the program shown in Figure 2.2 are obtained
8

Malardalen University Bachelor Thesis
by using the ranges and base choices for each input, as follows:
• Range [1, 5] for (input 1, 2 and 3)
• Base choice values for all inputs. (1 for input 1, 2 for input 2 and 3 for input 3)
• Input 4 has the range [0,1]
• Base choice value 0 for input 4
The test cases are generated by using all non-base choice values for Input 1 which had basechoice 1. In combination with these values the other inputs uses their set base choice. Thegeneration then continues by repeating the procedure for all other inputs. The generated test suitecontaining a set of 17 test cases is shown in Table 2.2
9

Chapter 3
Methodology
We designed a case study for evaluating the use of base choice criteria for testing PLC software.In this chapter we show how we selected the programs and performed a case study.
3.1 Problem Formulation
Software testing is important for ensuring the quality of a program. Therefore, it is of utmostinterest to investigate how base choice testing can be used to improve testing industrial PLC soft-ware in terms of efficiency and effectiveness. Bombardier Transportation is a company producingPLC software and the process of testing PLC software is mainly based on manually testing thesoftware based on both the program specification and the program code.
Since manual testing can be time consuming, it may be of value to consider automated testgeneration approaches (i.e., base choice). Researchers have shown the practical application ofdifferent combinatorial test generation techniques (e.g., base choice (BC) strategy). In particular,recent empirical studies [1, 2] showed the value of using base choice coverage and its fault detectioncapability. However, there is no conclusive evidence on how base choice could be used for industrialsoftware. This is particularly true for PLC software, where manual testing is rigorous and effective.Three questions arose from this:
• RQ1: How does BC and manual tests compare in terms of achieved code coverage?
• RQ2: Are BC tests less costly to use than manual tests?
• RQ3: Are BC tests more effective in fault detection than manual tests?
We considered an industrial project provided by Bombardier Transportation AB containingPLC programs and for each selected program, we executed the tests produced by both manualtesting and base choice testing and collected the following measures: code coverage in termsof achieved decision coverage, the number of tests and the mutation score as a proxy for faultdetection. In order to calculate the mutation score, each test was executed on the mutated versionof the original TCMS program to determine whether it detects the injected fault or not. Thefollowing sections describe in detail the case study process.
3.2 Case Study Process
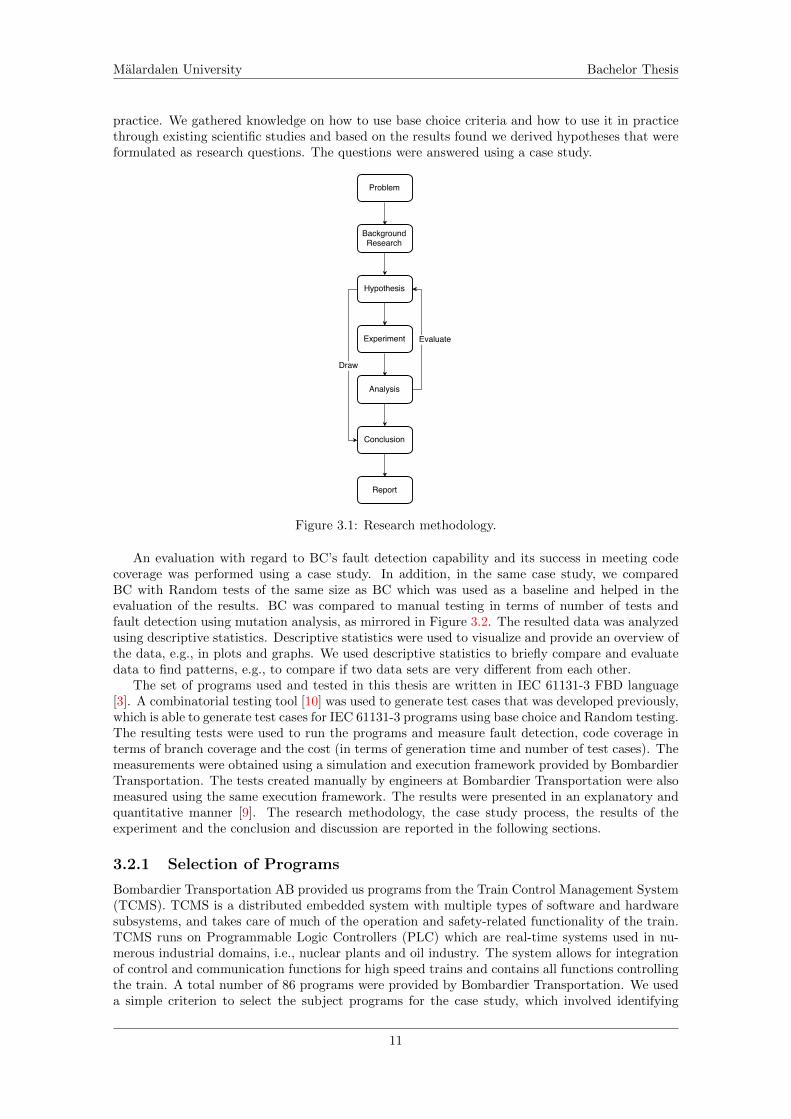
A research methodology is a structured and systematic process that answers a research question.The research started with the opportunity of using BC testing in PLC software development, andended with performing an empirical evaluation [9] and analysis of the results. The case studyprocess, mirrored in Figure 3.1, started with the formulation of the research problem that wasbroken down into the three research questions (i.e., RQ1, RQ2, and RQ3) which are investigatedin this thesis. The study began with the problem of using BC for PLC software and continuedwith further research about this problem in terms of current state of the art and state of the
10
Malardalen University Bachelor Thesis
practice. We gathered knowledge on how to use base choice criteria and how to use it in practicethrough existing scientific studies and based on the results found we derived hypotheses that wereformulated as research questions. The questions were answered using a case study.
Figure 3.1: Research methodology.
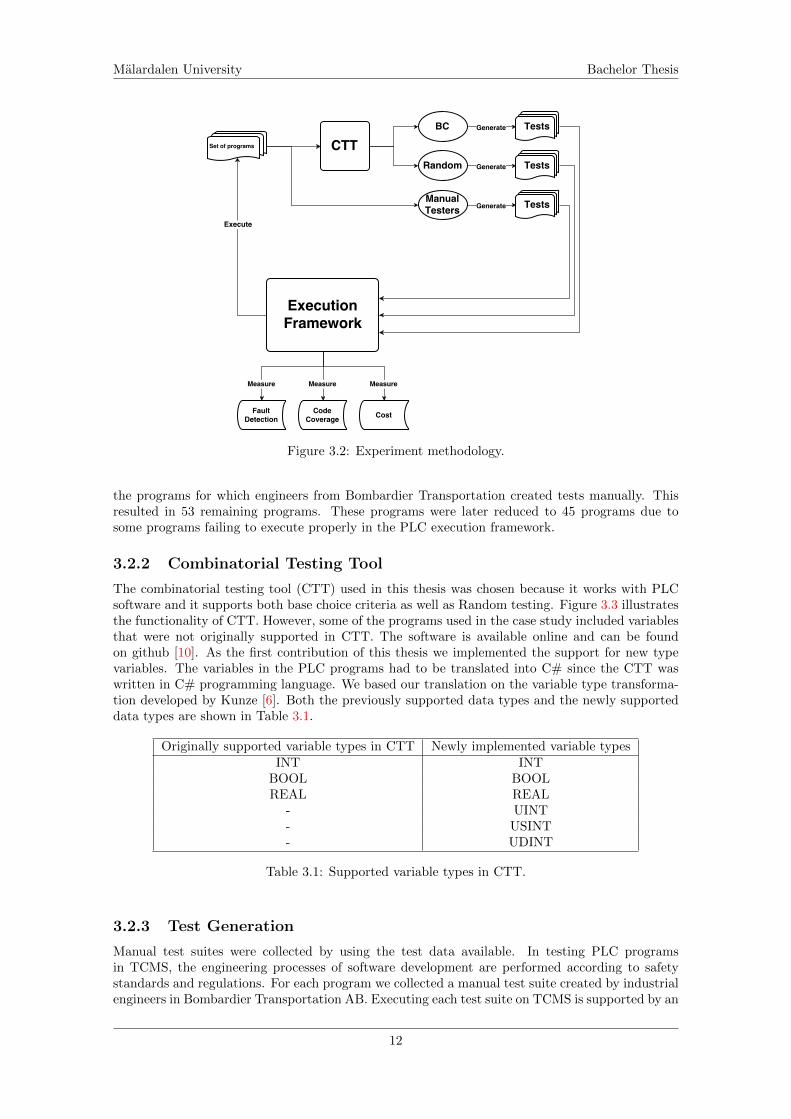
An evaluation with regard to BC’s fault detection capability and its success in meeting codecoverage was performed using a case study. In addition, in the same case study, we comparedBC with Random tests of the same size as BC which was used as a baseline and helped in theevaluation of the results. BC was compared to manual testing in terms of number of tests andfault detection using mutation analysis, as mirrored in Figure 3.2. The resulted data was analyzedusing descriptive statistics. Descriptive statistics were used to visualize and provide an overview ofthe data, e.g., in plots and graphs. We used descriptive statistics to briefly compare and evaluatedata to find patterns, e.g., to compare if two data sets are very different from each other.
The set of programs used and tested in this thesis are written in IEC 61131-3 FBD language[3]. A combinatorial testing tool [10] was used to generate test cases that was developed previously,which is able to generate test cases for IEC 61131-3 programs using base choice and Random testing.The resulting tests were used to run the programs and measure fault detection, code coverage interms of branch coverage and the cost (in terms of generation time and number of test cases). Themeasurements were obtained using a simulation and execution framework provided by BombardierTransportation. The tests created manually by engineers at Bombardier Transportation were alsomeasured using the same execution framework. The results were presented in an explanatory andquantitative manner [9]. The research methodology, the case study process, the results of theexperiment and the conclusion and discussion are reported in the following sections.
3.2.1 Selection of Programs
Bombardier Transportation AB provided us programs from the Train Control Management System(TCMS). TCMS is a distributed embedded system with multiple types of software and hardwaresubsystems, and takes care of much of the operation and safety-related functionality of the train.TCMS runs on Programmable Logic Controllers (PLC) which are real-time systems used in nu-merous industrial domains, i.e., nuclear plants and oil industry. The system allows for integrationof control and communication functions for high speed trains and contains all functions controllingthe train. A total number of 86 programs were provided by Bombardier Transportation. We useda simple criterion to select the subject programs for the case study, which involved identifying
11
Malardalen University Bachelor Thesis
Figure 3.2: Experiment methodology.
the programs for which engineers from Bombardier Transportation created tests manually. Thisresulted in 53 remaining programs. These programs were later reduced to 45 programs due tosome programs failing to execute properly in the PLC execution framework.
3.2.2 Combinatorial Testing Tool
The combinatorial testing tool (CTT) used in this thesis was chosen because it works with PLCsoftware and it supports both base choice criteria as well as Random testing. Figure 3.3 illustratesthe functionality of CTT. However, some of the programs used in the case study included variablesthat were not originally supported in CTT. The software is available online and can be foundon github [10]. As the first contribution of this thesis we implemented the support for new typevariables. The variables in the PLC programs had to be translated into C# since the CTT waswritten in C# programming language. We based our translation on the variable type transforma-tion developed by Kunze [6]. Both the previously supported data types and the newly supporteddata types are shown in Table 3.1.
Originally supported variable types in CTT Newly implemented variable typesINT INT
BOOL BOOLREAL REAL
- UINT- USINT- UDINT
Table 3.1: Supported variable types in CTT.
3.2.3 Test Generation
Manual test suites were collected by using the test data available. In testing PLC programsin TCMS, the engineering processes of software development are performed according to safetystandards and regulations. For each program we collected a manual test suite created by industrialengineers in Bombardier Transportation AB. Executing each test suite on TCMS is supported by an
12

Malardalen University Bachelor Thesis
Figure 3.3: Functionality of CTT.
execution framework. The test suites collected in this thesis were based on functional specificationsexpressed in a natural language.
In addition, we automatically generated test suites using BC. BC testing was performed bythe author of this study by using predetermined ranges and base values for each input variable.The ranges were obtained by looking directly in the comments contained in each program code.A criterion suggested by Ammann and Offutt in the original definition of base choice is the mostlikely value from the point of view of the tester. In order to collect realistic data, we asked one testengineer from Bombardier Transportation, responsible for testing PLC software similar to the oneused in this study, to identify the default value of each input variable based on the predeterminedranges. The test engineer provided base choice values for all input variables. Interestingly enough,one default value (i.e. 1.0 for variables of type float, 1 for variables of type integer and true forboolean variables) was provided for all programs. The engineer argued that programs in TCMScontain default inputs that are usually used for testing the basic functionality of the program.
In addition, we generated tests using a Random testing strategy. We wanted to use Randomtesting as a baseline for comparison. In order to be able to determine how many test cases touse for the Random testing strategy, we measured the time taken to generate a certain amountof test cases using both BC and Random testing and compare the generation time. With thismeasurement we wanted to observe if there is any significant difference in terms of generation timebetween BC and Random. We argue that if there is a significant difference, Random tests shouldnot be generated using the number of tests of BC as the stopping criteria but instead by using thegeneration time of BC. We implemented in CTT a visualization module automatically showing thenumber of test cases generated. This allowed an easier configuration of the number of test casesthat should be generated using Random testing. The generation time measurements between BCand Random for one PLC program can be seen in Table 3.2.
There is no significant difference (see Table 3.2) in the generation time between test generatedusing BC and Random. We decided, based on these results, that Random tests should be generatedbased on the number of test cases generated using BC. In other words, we generated tests withthe same number of test cases as BC, as this is a realistic scenario for a baseline approach.
3.2.4 Metrics
In this study, several metrics have been measured in order to answer our research questions: codecoverage is operationalized using the decision coverage criterion, mutation score for estimating thefault detection capability, and the number of test cases as a cost estimate.
13

Malardalen University Bachelor Thesis
# Test BC Random1 3153 31532 3166 33333 3187 32284 3260 32195 3191 31516 3252 32197 3169 31998 3302 32779 3114 314810 3198 3292
Min 3114 3148Max 3302 3333
Average 3199.2 3221.9
Table 3.2: Generation time in milliseconds of BC and Random using CTT for one PLC program.
Decision Coverage
Code coverage criteria are used in software testing to evaluate how good test cases are [11]. Thesecriteria are usually used to verify the extent to which the code has been evaluated by each test case.In this thesis, code coverage is measured using the decision coverage criterion. For the programsselected in this study and developed by Bombardier Transportation AB, engineers developingPLC software indicated that their testing process involves achieving high decision coverage. Inthe context of traditional programming languages (e.g., C#), decision coverage is usually namedbranch coverage. A decision coverage score was obtained for each test suite. A test suite satisfiesdecision coverage if running the test cases causes each branch in the PLC program to have thevalue true at least once and the value false at least once. Decision coverage was previously usedby Enoiu et al. [12] to improve testing of PLC software. In this thesis we used the executionframework to collect the decision coverage achieved by each test suite.
Fault Detection
Mutation analysis is used to measure fault detection of different testing strategies [13]. Insteadof using real faults, mutation analysis injects faults into the software creating faulty versions [11].These faults are systematically seeded throughout the program for analyzing the fault detectioncapability of a test suite [14]. Mutation analysis has been shown to be useful for experimentationand a good proxy for fault detection since it can be used in cases where real faults are not available.1. The number of mutants created for each program used in the experiment can be shown in Table3.3.
1In software testing literature, a software fault is a static defect in the software, while a software error is anincorrect internal state that is the manifestation of some fault. A software failure refers to the incorrect behaviorwith respect to the requirements or other description of the expected behavior
14

Malardalen University Bachelor Thesis
Program # Mutants Program # Mutants Program # MutantsP1 38 P16 38 P31 8P2 11 P17 33 P32 19P3 6 P18 19 P33 94P4 81 P19 63 P34 31P5 22 P20 19 P35 29P6 68 P21 30 P36 45P7 38 P22 9 P37 10P8 11 P23 15 P38 52P9 39 P24 7 P39 21P10 34 P25 27 P40 25P11 39 P26 38 P41 18P12 3 P27 100 P42 20P13 12 P28 76 P43 29P14 33 P29 93 P44 21P15 47 P30 58 P45 31
Table 3.3: Number of mutants created for each program used in the experiment.
Number of Test Cases
There are several ways of measuring cost efficiency. Cost measurement of software testing containsdirect and indirect type of cost, measuring directly the test creation, the test execution and thechecking of test results. As the programs used in this thesis were already developed and we didnot have any information about the cost of performing manual testing we use a surrogate measureof the cost, the number of test cases. This information was obtained automatically by using theexecution framework provided by Bombardier Transportation. In this thesis we consider that thecost is related to the number of test cases. The higher the number of tests cases, the higher arethe respective costs.
3.2.5 Descriptive Statistics
The resulted data itself was statistically analyzed using descriptive statistics. Descriptive statisticswas used to visualize and provide an overview of the data, e.g., in plots and graphs. For eachmeasure we list the detailed statistics on the obtained results, like minimum values, median, meanand standard deviation.
For each program under test and each testing technique (i.e., base choice (BC), manual testing(Manual) and Random), we collected a test suite. These sets of tests were used to conduct theexperimental analysis. For each test suite produced, we derived three distinct metrics: mutationscore, decision coverage and number of test cases. These metrics form the basis for our analysistowards the goal of answering the research questions. In our analysis we used the R statisticaltool.
3.3 Execution Framework
To perform the experiment, a way of measuring decision coverage, mutation score and cost wasneeded. This was done using an execution framework from Bombardier AB. The tool included FB-DMutator.jar to generate mutations and PLC.jar to measure the needed data. The FBDMutatorused an XML file to generate mutations of the program which would then be used by the PLC.jarduring the execution. By injecting faults into a program it is possible to know how many of thesefaults were found and not found, which allows a measuring of fault detection.
15
Chapter 4
Results and Analysis
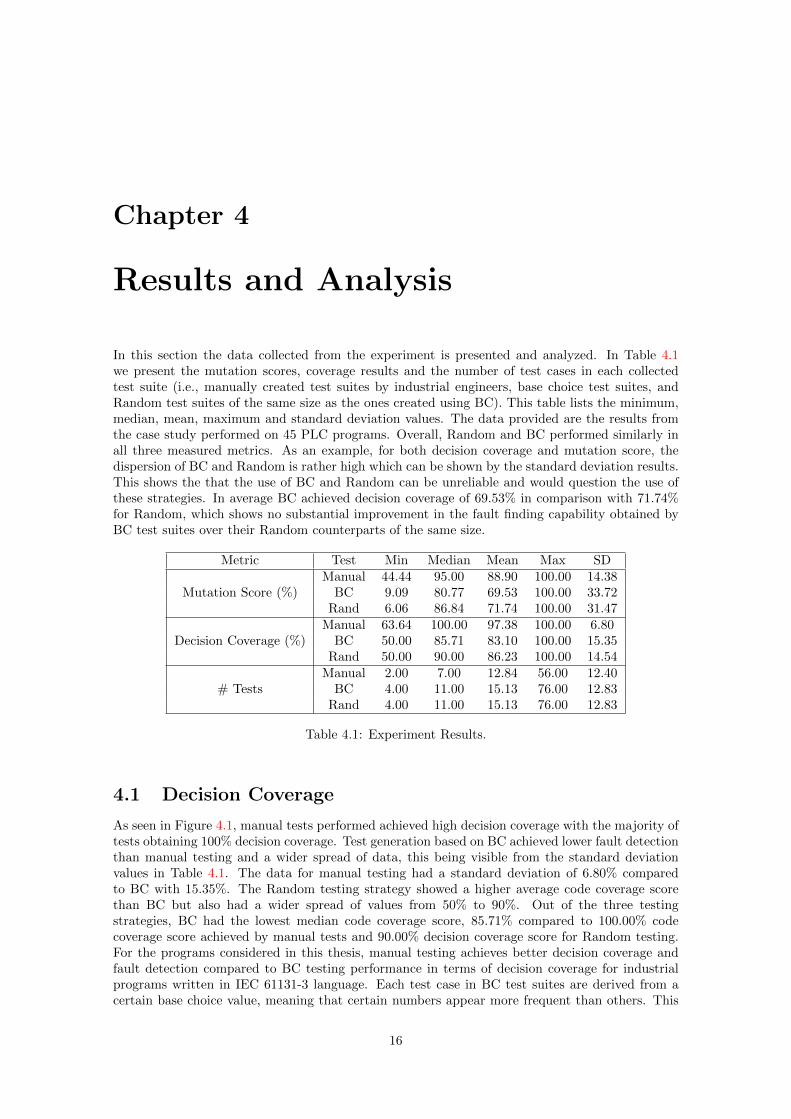
In this section the data collected from the experiment is presented and analyzed. In Table 4.1we present the mutation scores, coverage results and the number of test cases in each collectedtest suite (i.e., manually created test suites by industrial engineers, base choice test suites, andRandom test suites of the same size as the ones created using BC). This table lists the minimum,median, mean, maximum and standard deviation values. The data provided are the results fromthe case study performed on 45 PLC programs. Overall, Random and BC performed similarly inall three measured metrics. As an example, for both decision coverage and mutation score, thedispersion of BC and Random is rather high which can be shown by the standard deviation results.This shows the that the use of BC and Random can be unreliable and would question the use ofthese strategies. In average BC achieved decision coverage of 69.53% in comparison with 71.74%for Random, which shows no substantial improvement in the fault finding capability obtained byBC test suites over their Random counterparts of the same size.
Metric Test Min Median Mean Max SDManual 44.44 95.00 88.90 100.00 14.38
Mutation Score (%) BC 9.09 80.77 69.53 100.00 33.72Rand 6.06 86.84 71.74 100.00 31.47
Manual 63.64 100.00 97.38 100.00 6.80Decision Coverage (%) BC 50.00 85.71 83.10 100.00 15.35
Rand 50.00 90.00 86.23 100.00 14.54Manual 2.00 7.00 12.84 56.00 12.40
# Tests BC 4.00 11.00 15.13 76.00 12.83Rand 4.00 11.00 15.13 76.00 12.83
Table 4.1: Experiment Results.
4.1 Decision Coverage
As seen in Figure 4.1, manual tests performed achieved high decision coverage with the majority oftests obtaining 100% decision coverage. Test generation based on BC achieved lower fault detectionthan manual testing and a wider spread of data, this being visible from the standard deviationvalues in Table 4.1. The data for manual testing had a standard deviation of 6.80% comparedto BC with 15.35%. The Random testing strategy showed a higher average code coverage scorethan BC but also had a wider spread of values from 50% to 90%. Out of the three testingstrategies, BC had the lowest median code coverage score, 85.71% compared to 100.00% codecoverage score achieved by manual tests and 90.00% decision coverage score for Random testing.For the programs considered in this thesis, manual testing achieves better decision coverage andfault detection compared to BC testing performance in terms of decision coverage for industrialprograms written in IEC 61131-3 language. Each test case in BC test suites are derived from acertain base choice value, meaning that certain numbers appear more frequent than others. This
16

Malardalen University Bachelor Thesis
could explain why BC did not perform as well as manual tests, since certain paths taken in theprogram could be less often visited or be excluded all together.
Manual BC Random
5060
7080
9010
0De
cisio
n Co
vera
ge (%
)
Figure 4.1: Decision coverage achieved by each testing approach. Manual stands for manual testing,BC stands for Base Choice and Random stands for Random tests of the same size as BC tests;boxes spans from 1st to 3rd quartile, black middle lines mark the median and the whiskers extendup to 1.5x the inter-quartile range and the circle symbols represent outliers.
While manual tests performed better than BC on average in terms of achieved decision coverage,we were interested in looking closely (see Figure 4.2) at the number of tests where manual testingwas better, equal or worse than BC. Interestingly enough, 72% of all manual tests achieved betterdecision coverage than BC tests (9% of all BC tests achieving higher decision coverage than manualtests). This shows that manual tests are significantly better than BC tests. This could be due tothe selection of the base value for BC testing. In the next chapter we are investigating this further.
Answer RQ1: Manual test suites perform better than test suites generated using basechoice strategy in terms of decision coverage.
17

Malardalen University Bachelor Thesis
73%
9%
18%
Manual Base Choice Equal
Figure 4.2: Decision coverage comparison between Manual and Base Choice Testing showing whichtechnique performed better worse or equal in terms of decision coverage score.
4.2 Fault Detection
The quality of a test suite in terms of fault detection was measured using mutation analysiswith faults automatically injected into each of the 45 programs. Manual tests achieved a higheraverage mutation score (i.e., 88.90% for manual testing) than either BC tests (i.e., 69.53%) andRandom tests (i.e., 71.74%). As shown in Table 4.1, the data for BC and Random testing hadsimilar standard deviations but quite different from manual testing data. The results of the faultdetection comparison are also illustrated in Figure 4.3 as box-plots. Manual testing is with 20% inaverage better in terms of fault detection than BC testing. This can be explained by the fact thatmanual tests are written by engineers with experience in testing PLC software, while base choicetests are only based on a certain combination of inputs that is not exercising certain parts of theprogram behavior. For example, BC is not taking into account programs that contain timers andstate-full blocks in which the inputs need to be kept for a certain amount of time before the outputcan change.
Answer RQ3: Manual test suites are considerably more effective in fault detectionthan test suites using base choice strategy.
Even though manual testing performed better in average than BC testing, from the totalnumber of tests only 53% showed better mutation score (see Figure 4.4). Test suites generatedbased on BC performed equally or better than manual testing for 47% of tests executed (for 16%of the tests, BC is better in terms of fault detection while for 31% of the tests BC and manualtesting achieve the same mutation score). The results can be explained by the fact that manualtest suites are written by experienced engineers for an already developed train.
18

Malardalen University Bachelor Thesis
Manual BC Random
2040
6080
100
Mut
atio
n Sc
ore
Figure 4.3: Mutation score achieved by each testing approach. Manual stands for manual testing,BC stands for Base Choice and Random stands for Random tests of the same size as BC tests;boxes spans from 1st to 3rd quartile, black middle lines mark the median and the whiskers extendup to 1.5x the inter-quartile range and the circle symbols represent outliers.
53%
16%
31%
Manual Base Choice Equal
Figure 4.4: Mutation Score comparison between Manual and Base Choice Testing showing whichtechnique performed better worse or equal in terms of mutation score.
4.3 Number of Test Cases
In this section we show the comparison in terms of number of test cases between manually createdtests and tests created using a combinatorial testing tool [10]. Obviously, BC and Random testingresult in the same number of test cases created for each program (see Figure 4.5). The differencein number of tests between manual and BC is not significantly large. Manually created tests havein average 12.84 test cases while BC generated contain in average 15.13 test cases. Based on thismeasure alone we can say that manual tests are similar in terms of the number of tests (2.29 testcases less in average for BC testing).
19
Malardalen University Bachelor Thesis
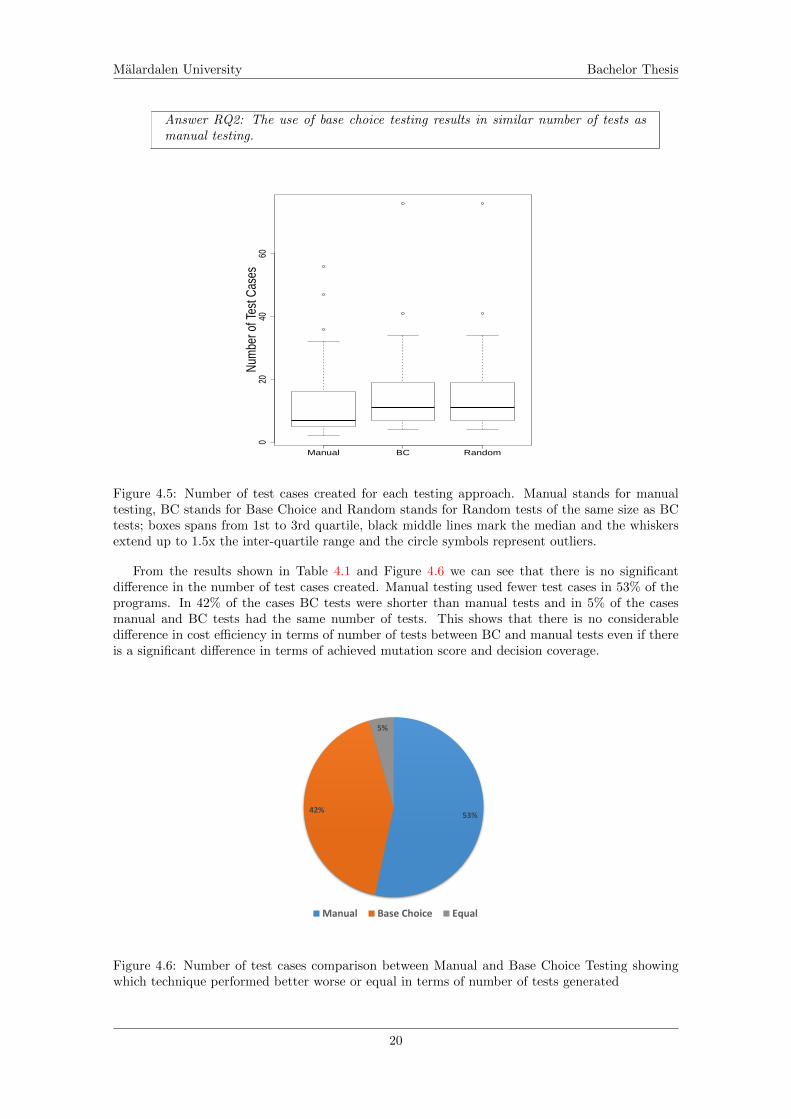
Answer RQ2: The use of base choice testing results in similar number of tests asmanual testing.
Manual BC Random
020
4060
Num
ber o
f Tes
t Cas
es
Figure 4.5: Number of test cases created for each testing approach. Manual stands for manualtesting, BC stands for Base Choice and Random stands for Random tests of the same size as BCtests; boxes spans from 1st to 3rd quartile, black middle lines mark the median and the whiskersextend up to 1.5x the inter-quartile range and the circle symbols represent outliers.
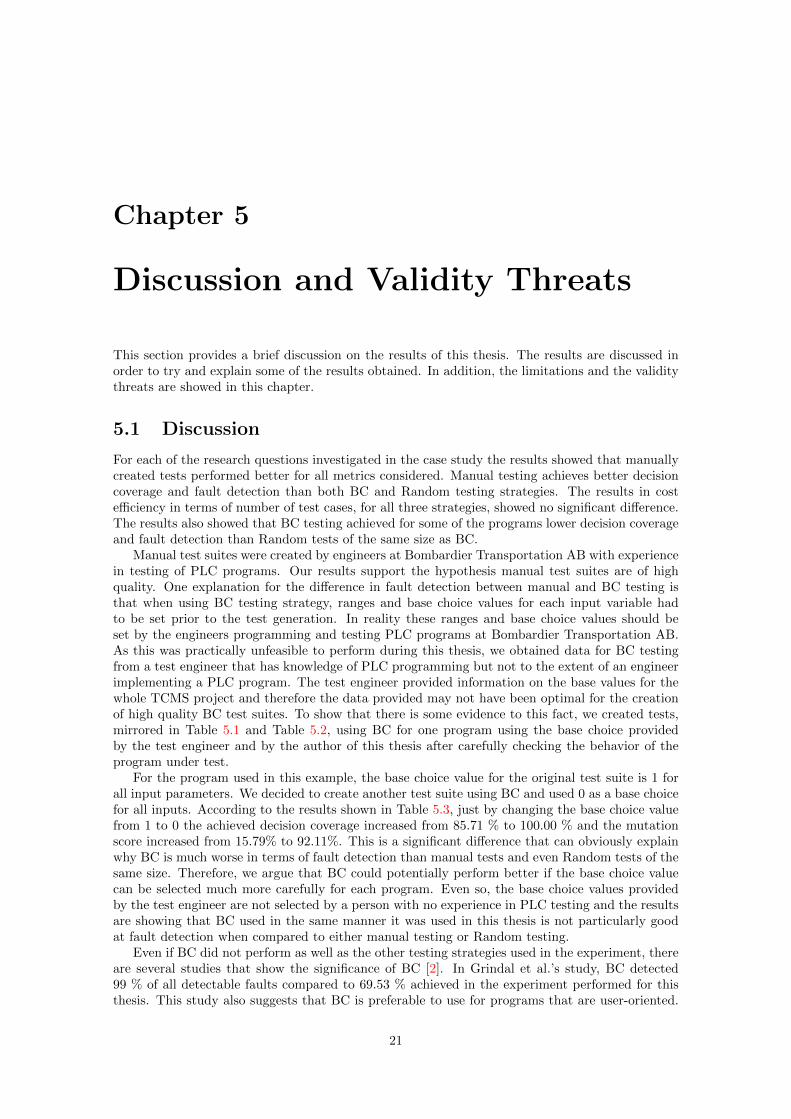
From the results shown in Table 4.1 and Figure 4.6 we can see that there is no significantdifference in the number of test cases created. Manual testing used fewer test cases in 53% of theprograms. In 42% of the cases BC tests were shorter than manual tests and in 5% of the casesmanual and BC tests had the same number of tests. This shows that there is no considerabledifference in cost efficiency in terms of number of tests between BC and manual tests even if thereis a significant difference in terms of achieved mutation score and decision coverage.
53%42%
5%
Manual Base Choice Equal
Figure 4.6: Number of test cases comparison between Manual and Base Choice Testing showingwhich technique performed better worse or equal in terms of number of tests generated
20
Chapter 5
Discussion and Validity Threats
This section provides a brief discussion on the results of this thesis. The results are discussed inorder to try and explain some of the results obtained. In addition, the limitations and the validitythreats are showed in this chapter.
5.1 Discussion
For each of the research questions investigated in the case study the results showed that manuallycreated tests performed better for all metrics considered. Manual testing achieves better decisioncoverage and fault detection than both BC and Random testing strategies. The results in costefficiency in terms of number of test cases, for all three strategies, showed no significant difference.The results also showed that BC testing achieved for some of the programs lower decision coverageand fault detection than Random tests of the same size as BC.
Manual test suites were created by engineers at Bombardier Transportation AB with experiencein testing of PLC programs. Our results support the hypothesis manual test suites are of highquality. One explanation for the difference in fault detection between manual and BC testing isthat when using BC testing strategy, ranges and base choice values for each input variable hadto be set prior to the test generation. In reality these ranges and base choice values should beset by the engineers programming and testing PLC programs at Bombardier Transportation AB.As this was practically unfeasible to perform during this thesis, we obtained data for BC testingfrom a test engineer that has knowledge of PLC programming but not to the extent of an engineerimplementing a PLC program. The test engineer provided information on the base values for thewhole TCMS project and therefore the data provided may not have been optimal for the creationof high quality BC test suites. To show that there is some evidence to this fact, we created tests,mirrored in Table 5.1 and Table 5.2, using BC for one program using the base choice providedby the test engineer and by the author of this thesis after carefully checking the behavior of theprogram under test.
For the program used in this example, the base choice value for the original test suite is 1 forall input parameters. We decided to create another test suite using BC and used 0 as a base choicefor all inputs. According to the results shown in Table 5.3, just by changing the base choice valuefrom 1 to 0 the achieved decision coverage increased from 85.71 % to 100.00 % and the mutationscore increased from 15.79% to 92.11%. This is a significant difference that can obviously explainwhy BC is much worse in terms of fault detection than manual tests and even Random tests of thesame size. Therefore, we argue that BC could potentially perform better if the base choice valuecan be selected much more carefully for each program. Even so, the base choice values providedby the test engineer are not selected by a person with no experience in PLC testing and the resultsare showing that BC used in the same manner it was used in this thesis is not particularly goodat fault detection when compared to either manual testing or Random testing.
Even if BC did not perform as well as the other testing strategies used in the experiment, thereare several studies that show the significance of BC [2]. In Grindal et al.’s study, BC detected99 % of all detectable faults compared to 69.53 % achieved in the experiment performed for thisthesis. This study also suggests that BC is preferable to use for programs that are user-oriented.
21

Malardalen University Bachelor Thesis
Input variable Range(s) Base Choice valueINT 1 -500;-56 to -54; 0; 120 to 128; 500 1
BOOL 1 0 to 1 1BOOL 2 0 to 1 1BOOL 3 0 to 1 1BOOL 4 0 to 1 1
Table 5.1: Test Suite for BC using the base choice provided by the test engineer.
Input variable Range(s) Base Choice valueINT 1 -500;-56 to -54; 0; 120 to 128; 500 0
BOOL 1 0 to 1 0BOOL 2 0 to 1 0BOOL 3 0 to 1 0BOOL 4 0 to 1 0
Table 5.2: Test Suite for BC using the base choice selected by the author of this thesis.
Test Decision Coverage Mutation Score # TestsUsing BC value 1 85.71 15.79 18.00Using BC value 0 100.00 92.11 18.00
Table 5.3: Comparison between two BC test suites each with different base values.
Obviously, the programs used in the experiment for this thesis were not user-oriented since theprograms are used in a train control management system.
5.2 Threats to Validity
The experiment was performed using industrial programs written in FBD which is one of fivelanguages according to the IEC 61131-3 standard [3] and the results cannot be generalized for allPLC software. We argue that the results are representative of programs created in an industrialenvironment in an embedded system controlling a train. More studies are needed to generalize theresults.
The generated tests using BC and Random testing were created using the combinatorial testingtool (CTT) previously developed for PLC software [10]. There are many other tools for combinato-rial testing which may give different results. We argue that CTT uses already known and availablealgorithms that should perform similarly to other tools like ACTS [15].
We used mutation analysis as a proxy for fault detection effectiveness of BC, Random andmanual test strategy. We did not use real faults to evaluate these strategies and this fact mayaffect the outcome of the results. However, mutants have been shown to be a valid substitute forreal faults [14], which would support the use of mutation analysis for our purposes.
22

Chapter 6
Related Work
Ammann and Offutt [8] defined a combinatorial coverage criterion for category-partition test speci-fication in 1994. They identified a process to produce tests that satisfied this criterion. The purposeof this criterion was to relieve programmers from some of the burden of testing the software suchthat they can concentrate on other tasks. This paper [8] is the first to introduce the Base Choicetesting strategy and suggests this method for automatically testing software. In the same paper asBC was introduced [8], Ammann and Offutt also introduced another testing strategy called EachChoice (EC). The testing strategy requires each value of each parameter to be included in at leastone test case.
One testing strategy known as Orthogonal Array (OA) was first introduced to be used insoftware testing by Mandl in 1985 [16]. Mandl suggested OA as an alternative to exhaustivetesting, i.e. a testing method using all possible data combinations, and/or Random testing. Theproblem with exhaustive testing is that the test may be extremely large. Random tests are oftena bit more manageable in size but the problem lies in its reliability, which is one of the mostimportant aspects in software testing in terms of ensuring the quality of the program.
In 1994 a testing tool was introduced called Automatic Efficient Test Generator (AETG) [17]which uses algorithms inspired by ideas from statistical experimental design theory. It is used tominimize the number of test needed for a specific level of test coverage of the input test space.This tool is proven to be superior when compared to exhaustive testing. In Cohen et al.s paper,AETG is compared to experimental design techniques and in particular Orthogonal Array (OA).Studies show that AETG have several advantages over OA, making AETG a more reliable methodof testing.
In Grindal et al.s [2] research study, the results show that BC achieves a high percentage offault detection while using fewer tests than other combinatorial strategies such as OA and AETG.However, BC did require more tests than EC and showed lower fault detection scores than ECstrategy. Although BC may not be as efficient as EC in terms of number of faults detected pertest, BC may yet be more valuable because of its ability to detect faults that EC may not detect.Grindal et al. [2] also states that some of the faults detected by EC was by coincidence and the useof EC may be too unpredictable for real usage. For the programs used in this study, EC detected90% of faults, while BC managed to achieve 99% fault detection with only one missed fault. OAand HPW managed to detect the fault that BC missed, however, these two strategies had 98%fault detection.
There are different combinatorial testing tools which support BC test generation. One of thesetools is called Advanced Combinatorial Testing System (ACTS) [15], which uses t-way combina-torial test generation with several features. Another tool is one developed by several students atMalardalen University [10]. This tool supports both BC and Random test generation. This specifictool was used during the test generation for the experiments performed in this thesis.
To our knowledge, no previous studies has been made comparing the base choice test strategyto manual testing. There is a need to further study how good BC is at detecting faults compareto manual testing performed by industrial engineers.
23

Chapter 7
Conclusion
In this thesis we evaluate base choice criteria and compare it with manual and Random testingstrategies for industrial PLC programs [3]. A case study was performed based on 45 programsfrom a recently developed safety-critical embedded software and manual test suites produced byindustrial professionals. Using this case study, we tried to answer three research questions. Thepurpose of the first research question (RQ1: How does BC and manual tests compare in terms ofachieved code coverage?) was to determine the quality in terms of achieved decision coverage. Ourresults show that manual tests are considerably better than test suites created using BC testingstrategy.
To further investigate the quality of BC testing, the second research question was posed (RQ2:Are BC tests less costly to use than manual tests?). The cost was measured in terms of numberof test cases used for each test suite. This thesis shows that manual tests were similar in terms ofnumber of test cases to base choice tests.
The third and final research question (RQ3: Are BC tests more effective in fault detectionthan manual tests?) involves the measurement of fault detection using mutation analysis. Manualtesting achieved better fault detection than BC.
24

Chapter 8
Future Work
According to the results of this thesis, manual testing is preferable to BC since it is much betterin terms of achieved decision coverage and fault detection. There could be several reasons forthis: it could be of value to investigate this further by performing the same experiment with newranges and especially new base choice values that are chosen by an expert for each single program.Hypothetically, this could improve the results considerably for both decision coverage and faultdetection.
The test cases generated for each test suite are based on a single base choice value for eachinput. This could be improved by introducing an option to use several base choice values whichcan be used for certain programs.
The results for cost efficiency were only taking into account the number of test cases for eachtest suite which is only a small part of the whole testing cost. To represent the total cost for theuse of a specific testing strategy we need to measure the time the engineer spends using BC ormanually testing each program. Therefore, it could be of interest to measure these factors in asimilar study.
25

Bibliography
[1] M. Grindal, J. Offutt, and S. F. Andler, “Combination testing strategies: a survey,” SoftwareTesting, Verification and Reliability, vol. 15, no. 3, pp. 167–199, 2005.
[2] M. Grindal, B. Lindstrom, J. Offutt, and S. F. Andler, “An evaluation of combination strate-gies for test case selection,” Empirical Software Engineering, vol. 11, no. 4, pp. 583–611, 2006.
[3] I. P. ControllersPart, “3: Programming languages, international standard iec 61131-3,”Geneva: International Electrotechnical Commission, 1993.
[4] CENELEC, “50128: Railway application: Communications, signaling and processing systems,software for railway control and protection systems,” Standard Official Document. EuropeanCommittee for Electrotechnical Standardization, 2001.
[5] W. Bolton, Programmable logic controllers. Newnes, 2015.
[6] S. Kunze, “Automated test case generation for function block diagrams using java path finderand symbolic execution,” 2015, http://www.idt.mdh.se/utbildning/exjobb/files/TR1744.pdf.
[7] A. Orso and G. Rothermel, “Software testing: a research travelogue (2000–2014),” in Proceed-ings of the on Future of Software Engineering. ACM, 2014.
[8] P. Ammann and J. Offutt, “Using formal methods to derive test frames in category-partitiontesting,” in Computer Assurance, 1994. COMPASS’94 Safety, Reliability, Fault Tolerance,Concurrency and Real Time, Security. Proceedings of the Ninth Annual Conference on. IEEE,1994, pp. 69–79.
[9] P. Runeson and M. Host, “Guidelines for conducting and reporting case study research insoftware engineering,” Empirical software engineering, vol. 14, no. 2, pp. 131–164, 2009.
[10] M. Aravind, S. Eklund, L. Eklund, S. Ericsson, H. Bergstrm, K. Adeel, and J. Anto-nio Lpez Muntaner, “Combinatorial testing tool,” 2015, https://github.com/juananinca/DVA313-02/blob/master/DVA313ProjectReport Final.pdf.
[11] P. Ammann and J. Offutt, Introduction to software testing. Cambridge University Press,2008.
[12] E. P. Enoiu, A. Causevic, T. J. Ostrand, E. J. Weyuker, D. Sundmark, and P. Pettersson,“Automated test generation using model checking: an industrial evaluation,” InternationalJournal on Software Tools for Technology Transfer, pp. 1–19, 2014.
[13] R. A. DeMillo, R. J. Lipton, and F. G. Sayward, “Hints on test data selection: Help for thepracticing programmer,” Computer, no. 4, pp. 34–41, 1978.
[14] R. Just, D. Jalali, L. Inozemtseva, M. D. Ernst, R. Holmes, and G. Fraser, “Are mutants avalid substitute for real faults in software testing?” in Proceedings of the 22nd ACM SIGSOFTInternational Symposium on Foundations of Software Engineering. ACM, 2014, pp. 654–665.
[15] L. Yu, Y. Lei, R. N. Kacker, and D. R. Kuhn, “Acts: A combinatorial test generation tool,”in Software Testing, Verification and Validation (ICST), 2013 IEEE Sixth International Con-ference on. IEEE, 2013, pp. 370–375.
26

Malardalen University Bachelor Thesis
[16] R. Mandl, “Orthogonal latin squares: an application of experiment design to compiler testing,”Communications of the ACM, vol. 28, no. 10, pp. 1054–1058, 1985.
[17] D. M. Cohen, S. R. Dalal, A. Kajla, and G. C. Patton, “The automatic efficient test genera-tor (aetg) system,” in Software Reliability Engineering, 1994. Proceedings., 5th InternationalSymposium on. IEEE, 1994, pp. 303–309.
27