on the value of land - diva-portal.org814613/fulltext01.pdf · “lag” om första begränsande...
TRANSCRIPT

Mälardalen University Press DissertationsNo. 182
ON THE VALUE OF LAND
Stefan Hellstrand
2015
School of Business, Society and Engineering
Mälardalen University Press DissertationsNo. 182
ON THE VALUE OF LAND
Stefan Hellstrand
2015
School of Business, Society and Engineering

Mälardalen University Press DissertationsNo. 182
ON THE VALUE OF LAND
Stefan Hellstrand
Akademisk avhandling
som för avläggande av teknologie doktorsexamen i energi- och miljöteknik vidAkademin för ekonomi, samhälle och teknik kommer att offentligen försvarasonsdagen den 9 september 2015, 13.15 i Delta, Mälardalens högskola, Västerås.
Fakultetsopponent: docent Pontus Cerin, Kungliga tekniska högskolan, KTH
Akademin för ekonomi, samhälle och teknik
Copyright © Stefan Hellstrand, 2015ISBN 978-91-7485-216-5ISSN 1651-4238Printed by Arkitektkopia, Västerås, Sweden

Mälardalen University Press DissertationsNo. 182
ON THE VALUE OF LAND
Stefan Hellstrand
Akademisk avhandling
som för avläggande av teknologie doktorsexamen i energi- och miljöteknik vidAkademin för ekonomi, samhälle och teknik kommer att offentligen försvarasonsdagen den 9 september 2015, 13.15 i Delta, Mälardalens högskola, Västerås.
Fakultetsopponent: docent Pontus Cerin, Kungliga tekniska högskolan, KTH
Akademin för ekonomi, samhälle och teknik

AbstractThe issue of sustainable development is once again moving the production factor land into the focusof economic theory and practise. There are three production factors, capital, labour and land. Land isa synonym to ecosystems. During the major part of the 20th century land in economic theory has beenhandled as a peripheral issue. The sustainability context implies a challenge to take land in properconsideration. That means to in an adequate way consider system characteristics that result in complexsystems, such as thresholds, resilience, irreversibilities, and interdependencies between systems andsystem levels.
The thesis examines
• how land can be understood and handled in the context of a sustainable development,• the relations between land and society on a conceptual level and in operative terms,• the relations between system levels and between the three sustainability dimensions ecological,economic and social,• the importance of agriculture and animal production in a sustainable development.
The major findings are that in contexts such as economically profitable and natural resource-efficientmilk production; methods to measure sustainability performance of production systems generally; andsocietal strategies for management of natural resources that support economic and social developmentwithin ecological sustainability limits, three “laws” need to be handled appropriate: Liebig’s “Law”of the minimum, Shelford´s “Law” of tolerance, and the “Law” of diminishing return in biological-ecological productions systems.
The thesis identifies examples within dairy sciences, systems ecology, and engineering sciences thataffect or may affect policies in real world systems from local to global level that can be substantiallyimproved. In order to suggest relevant measures a tool-kit supporting a sustainable development havebeen generated, integrating contributions from agricultural sciences, systems ecology, economic theory,economic geography, applied environmental sciences and theories of complex systems. The thesissummarises around 30 years of professional experiences mainly within advanced consultancy, duringwhich this tool-kit has been developed and applied. Evaluation of some applications afterwards showsrelevance. For some of the examples analysed in the thesis, found weaknesses are such that global foodsecurity literally is threatened within one to twenty years.
ISBN 978-91-7485-216-5ISSN 1651-4238

Sammanfattning
Hållbarhetsdiskussionen har ånyo fört produktionsfaktorn mark i fokus i ekonomisk teori och praktik. Det finns tre produktionsfaktorer, kapital, ar-bete och mark. Mark är synonymt med ekosystem. Under merparten av 1900-talet har mark i ekonomisk teori hanterats som en perifer företeelse. Hållbarhetsdiskussionen bär på utmaningen att på ett korrekt sätt hantera markresursen, vilket bl a handlar om att på ett adekvat sätt beakta system-karaktärer som ger komplexa system, som tröskeleffekter, resiliens, irrever-sibiliteter och ömsesidiga beroenden mellan system och systemnivåer.
Avhandlingen studerar
hur produktionsfaktorn mark kan förstås och hanteras i sammanhanget hållbar utveckling
relationen mellan mark och samhälle konceptuellt och i operativa sam-manhang
relationen mellan systemnivåer och mellan hållbarhetens tre dimensioner ekologisk, ekonomisk och social
betydelsen av jordbruk och animalieproduktion i en hållbar utveckling.
De viktigaste resultaten är att i sammanhang som ekonomiskt lönsam och naturresurseffektiv mjölkproduktion; metoder att mäta systems hållbarhets-prestation generellt; samt strategier för naturresurshushållning på samhälls-nivå som främjar en god ekonomisk och social utveckling inom ekologiska hållbarhetsgränser, så finns tre ”lagar” att på ett korrekt sätt beakta: Liebigs “Lag” om första begränsande faktor, Shelfords “Lag” om ”lagom mycket”, samt ”Lagen” om avtagande utbyte i biologiska-ekologiska produktionssy-stem.
Avhandlingen identifierar exempel inom mjölkkornas utfodring och vård, systemekologi, och ingenjörsvetenskaperna som påverkar eller kan påverka policies i verkliga system från lokal till global nivå som kan substantiellt förbättras. För att kunna föreslå relevanta åtgärder har en verktygslåda för hållbar utveckling skapats och tillämpas genom att integrera bidrag från lantbruksvetenskap, systemekologi, ekonomisk teori, och teorier om kom-plexa system.
Avhandlingen sammanfattar drygt 30 års yrkesverksamhet, merparten inom avancerad consulting, där denna verktygslåda har utvecklats och till-lämpats. Utvärdering i efterhand av några tillämpningar visar relevans. För en del exempel som analyserats i avhandlingen, är de svagheter som påvisas sådana att global livsmedelsförsörjning bokstavligen hotas inom ett till tjugo år.

Acknowledgments
On the 25th of August 1982 I started my professional career as the repre-sentative of the Swedish state at the Regional Agricultural Board in the county of Värmland, responsible for the implementation of the national agri-cultural policy at that time in the field of animal husbandry. In 1982 there were 1 621 dairy farms containing 22 124 dairy cows in Värmland. After two years I moved to a position within the farmers’ economic cooperative in the same county, with responsibility for advanced consultancy in ruminant production. By 1986 the number of farms with dairy cows in Värmland had fallen to 1 231, and the number of dairy cows was 19 649. In a sense, this development was a function of the professional skill of my colleagues and me.
It was easy to see this as a rational development given the price relations at the time between labour and natural resources. The question was emerging as to whether this development was reasonable given the long-term capacity of natural systems from local to global level to support humanity. I use the words “rational” and “reasonable” here as put forward by the philosopher Henrik von Wright, where “rational” relates to the demand of internal logical consistency, while “reasonable” implies the same level of internal logical consistency and adds an ethical dimension. The concept of sustainable de-velopment implies a requirement for a sufficient level of justice within and between generations, and thus possesses a strong moral foundation.
This thesis summarises 30 years of professional experience in a number of positions in which I have examined the role of ruminant production in agricultural systems, the role of agriculture and forestry in society, and the role of society in its ecological context. Over the years, my awareness of the importance of sound methods has grown. Sound methods generate sound sustainability maps, which make sustainable development a real possibility.
A number of people have played important roles over the last 30 years. I thank them all. I especially want to thank my family Åsa, Elsa, Amanda, Agnes, Robert and Hillevi for their support during this period.
I am also grateful for the support from my supervisors at Mälardalen Uni-versity, Jinyue Yan and Erik Dahlquist, and Lars Drake from the Swedish University of Agricultural Sciences.
David Ribé improved the English, for which I am also grateful.
Stefan Hellstrand

List of papers
This thesis is based on the following papers, which are referred to in the text by their Roman numerals. Reprints were made with permission from the respective publishers.
Journal papers I. Hellstrand, S., Skånberg, K & Drake, L. (2009). The Relevance of
Ecological and Economic Policies for Sustainable Development. Environment, Development & Sustainability, 11:4, pp. 853–870.
II. Hellstrand, S., Skånberg, K & Drake, L. (2010). A biophysically an-chored production function. Environment, Development & Sustaina-bility, 12:4, pp. 573–596.
III. Hellstrand, S. (2006). A Multi-Criteria Analysis of Sustainability Ef-fects of Increasing Concentrate Intensity in Swedish Milk Produc-tion 1989–1999. Environment, Development and Sustainability, 8:3, pp. 351– 373.
VI. Hellstrand, S. (2013). Animal production in a sustainable agricul-ture. Environment. Development & Sustainability, 15:4, pp. 999–1036.
Conference proceedings accepted following the peer review process
V. Hellstrand, S. & J. Yan (2009). The potential to increase sustainable global green energy production through increased efficiency in milk and cattle production: a Swedish case. First International Confer-ence on Applied Energy, January 5–7, 2009 Hong Kong.
Manuscript IV. Hellstrand, S. A simulation model of animal production and its re-
sults in production biological and economic terms when applied on an ecological and a conventional system.


Contents
1 Introduction ........................................................................................... 1 1.1 Background ....................................................................................... 1 1.2 Scope ................................................................................................. 3 1.3 Thesis outline .................................................................................... 4 1.4 A common thread .............................................................................. 6
2 Methodology .......................................................................................... 9 2.1 General description ........................................................................... 9 2.2 Data gathering and analysis ............................................................ 11 2.3 Validation, use and uncertainties of data ........................................ 13
3 Results ................................................................................................. 16 3.1 Overview ......................................................................................... 16 3.2 Tool-kit for sustainable development.............................................. 25 3.3 The value of land............................................................................. 26 3.4 How to anchor the economy in land ............................................... 28 3.5 Sustainability impacts of feeding trends in milk production........... 29 3.6 A simulation model of animal production ...................................... 30 3.7 Sustainability impacts of measures in animal production ............... 34 3.8 Animal production and global sustainability .................................. 35
4 Discussion ............................................................................................ 38 4.1 Increasing nitrogen influxes for constant milk production ............. 39 4.2 Energy standards to dairy cows ...................................................... 41 4.3 Protein standards for dairy cows ..................................................... 62 4.4 Environmental monitoring systems................................................. 65 4.5 Research regarding sustainable food production ............................ 67 4.6 International relevance .................................................................... 68 4.7 Approaches in engineering sciences ............................................... 71
4.7.1 Contributions from physical resource theory ......................... 72 4.7.2 Environmental and economic national accounts .................... 75 4.7.3 Sustainability in the industrial sector ..................................... 76 4.7.4 LCA in general and applied to milk production .................... 81 4.7.5 Summary of examples 1–25 .................................................. 84
4.8 A safe operating place for humanity ............................................... 84 4.9 Some applications and their implications ....................................... 87

4.9.1 Dairy production and environmental objectives .................... 88 4.9.2 Value of ecosystem services and the 4P principle ................. 92 4.9.3 Do economic trends show increasing value of land? ............. 99 4.9.4 ISO 14 001 and ecosystems ................................................. 104 4.9.5 Relevance for local communities ......................................... 106 4.9.6 Relevance on regional level ................................................. 110 4.9.7 Relevance on national scale ................................................. 112 4.9.8 The IPPC directive and the BAT principle .......................... 114 4.9.9 Correlation between price of oil and food ........................... 116 4.9.10 Conclusions related to recent trends ................................ 118
4.10 Policy implications ................................................................... 122 5 Conclusions ....................................................................................... 124 References ................................................................................................... 127 Papers .......................................................................................................... 135

List of Figures
Figure 1. A model of the global ecological economic system based on the contributions by Odum (1988, 1996). .................................... 5
Figure 2. LCA and the sustainability context. ............................................. 7 Figure 3. The principal relation between energy intake for milk
production in MJ Metabolizable Energy (MJ ME, x-axis) and milk output in kg ECM (y-axis), assuming a curvilinear relation of the fourth order. ........................................................ 45
Figure 4. Average yield and economic result in RAM, measured as payments for milk – costs for feeds, per cow and year for herds with different feeding energy intensities, for 1985, 1989, 1990, 1993, 1994. ............................................................. 46
Figure 5. The relation between milk yield and economic result as milk incomes minus feeding costs on herd level. ............................... 48
Figure 6. Estimated production capacity at different energy supply levels according to NRC (2001) with and without correction for decreasing utilisation of nutrients in the feeds at increasing consumption level; assuming a live weight of 680 kg, no gestation, and no weight changes. .............................................. 51
Figure 7. Production levels in kg milk (ECM) per cow and day predicted from energy intake according to feeding standards in Denmark, Norway and Sweden. Assumed annual production level is in the interval 7 500 to 10 000 kg milk (ECM) per cow. .......................................................................... 52
Figure 8. The difference between the alternative energy feeding standards and the one of Hellstrand (1989). ............................... 54
Figure 9. Nitrogen content in manure from dairy cows per kg milk produced at different production levels among OECD nations. . 69
Figure 10. Nitrogen influx from purchased feeds to dairy cows in Sweden, 1991–1999. .................................................................. 70
Figure 11. Number of dairy cows in the county of Värmland and Dalarna, 1981–2012. .................................................................. 90

Figure 12. The exceedance of critical loads for eutrophication around Europe for the base year 1990 and target year 2010 of the Gothenburg Protocol. ................................................................. 94
Figure 13. Loss in statistical life expectancy in Europe in 2000 due to emissions of particles (PM2.5) in months. ................................. 95
Figure 14. Contribution to GDP in Sweden from acreage-dependent sectors, forest industry, food industry, production of goods, production of services, and GDP, 1993–2012. ........................... 99
Figure 15. The relationship between share of (contribution to) GDP from production of goods in 8 regions in Sweden in 1993 and growth of GDP 1993–2009, reference value is 1.00 for the year 1993. ................................................................................. 101
Figure 16. The contribution to GDP from acreage-dependent sectors 1970–2011 in Sweden, Northern Europe, Western Europe, Europe, North America, Asia, Africa and the world as shares of GDP. ..................................................................................... 102
Figure 17. Contribution to GDP from acreage-dependent sectors in Sweden, Northern Europe, Western Europe, Europe, North America, Asia, Africa and the world 1970–2011, fixed price. Relative to a value 1.00 in 1970. .............................................. 103
Figure 18. Contribution to GDP from acreage-dependent sectors in Sweden, Northern Europe, Western Europe, Europe, North America, Asia, Africa and the world 1970–2011, fixed price. Relative to a value 1.00 in 1970. .............................................. 107
Figure 19. Costs in preschools and elementary schools in Kil, 1998-2012. ......................................................................................... 109
Figure 20. Passenger numbers at Karlstad airport, 1972–2009. ................ 111 Figure 21. Development of national and some major regional economies,
1970–2012. ............................................................................... 113 Figure 22. Price of crude oil, 1861–2012. ................................................. 116 Figure 23. Relative change in crude oil and food prices, 2000–2010.
Based on time series with fixed price. ...................................... 117 Figure 24. Statistical relation between food and crude oil prices, 2000–
2010. ......................................................................................... 117

List of Tables
Table 1. Research questions, system levels, sustainability dimensions, materials and methods, and results in Papers I–V. ..................... 17
Table 2. Economic outcomes at five dairy farms applying a model for evaluation of production biological and economic performance (Hellstrand, 1988) in 2012/2013, based on information from the farmers (Hellstrand, 2014). ...................... 57
Table 3. Ecological economic accounts Höglunda gård (2012) ............... 58 Table 4. Improved sustainability performance due to improved feeding
efficiency at farm D in Table 2, effects per year unless otherwise stated. ......................................................................... 59
Table 5. Examples of efforts based in engineering sciences to support sustainable development. ............................................................ 72
Table 6. Regression between number of dairy cows and time based on data from the Swedish Board of Agriculture for the period 1981–2010. ................................................................................. 89
Table 7. Sustainability accounts regarding climate change gases in the local community Kil, the county of Värmland, Stockholm, and Sweden. ................................................................................ 96

Acronyms and abbreviations
BAPF Biophysically Anchored Production Function DM Dry matter ECM Energy corrected milk EEA Ecological Economic Accounts GHG Greenhouse Gases Gt Gigatonnes (1*109 tonnes) IEA International Energy Agency LCA Life Cycle Assessment ME Metabolizable energy MEA Millennium Ecosystem Assessment SEK Swedish Crowns SUAS Swedish University of Agricultural Sciences

1
1 Introduction
1.1 Background In classical economic theory, the production value was described as a func-tion of inputs of labour, capital and land. Land was a synonym for nature and ecosystems, including all natural resources (Daly and Cobb 1989; Nanneson et al. 1945).
Neoclassical economics focused on the relationship between production value and inputs of labour and of capital, while the importance of land was devalued. As a consequence, environmental impacts of production were classed as something external to the core of the analysis (Daly and Cobb 1989; SOU 1991).
In recent decades, the issue of sustainable development has brought the importance of land back into the focal plane of economic practice and theo-ry, which is expressed in contributions such as Daly (1990), Daly and Cobb (1989), Hall et al. (1986), MEA (2005), Odum (1988), Odum (1989), OECD (2001).
There are unsolved gaps in the scientific knowledge in this area, including
how land can be understood,
the relations between land and society on a conceptual level and in oper-ative terms,
the relations between system levels and between the three sustainability dimensions ecological, economic and social,
the importance of agriculture and animal production in sustainable de-velopment.
These gaps are the main aspects investigated in the thesis. These scientific gaps are not as wide on a general conceptual level. The
OECD has stressed that these gaps are concerns in the implementation phase of policies to enhance sustainable development.
The general foundations for the understanding of sustainable development were laid during the late 1980s and the early 1990s. What has remained an issue is: how does one actually achieve sustainable development?
The thesis mostly focuses on problems in the implementation phase, where representatives from different fields try to solve the new problem of

2
sustainable development using the internal logics of their own disciplines. Giampietro (2003) elaborated on this. Trying to solve new problems by ap-plying old solutions is seldom fruitful. A particular problem is the strong influence of engineering-based approaches, concepts, methods and incen-tives in the efforts to implement measures for sustainable development. This is a problem as engineering sciences do not represent greater competence than any other unrelated field with regard to ecological, economic and social sustainability. However, this is not commonly understood.
Proposals based on systems ecology that by analogous oversimplification and misrepresentation of integrated ecological-economic systems are just as problematic, and could cause actions that may threaten global food security within a few years.
Common denominators between such engineering-based approaches and proposals within systems ecology, are
the weaknesses in the representation of agricultural systems, such as animal production systems, especially ruminant production systems, compared to known properties of these systems, and
the low priority allocated to expertise regarding these systems, and thus to known properties of these systems.
This is a concern from a scientific quality perspective, since for hundreds of years, scientific knowledge has been founded on empirical evidence. The thesis provides examples of these implementation problems and suggests how they can be overcome.
To the discussion above regarding relevance of some contributions from engineering sciences and systems ecology, there is a need to add problems in changes in feeding standards systems to dairy cows in Sweden since 1991, and feeding standard systems to dairy cows common internationally.
Closer examination reveals a great deal of similarity between the con-structed models of real world systems in the examples examined by engi-neering sciences with their knowledge gaps, and the feeding standard sys-tems to dairy cows common internationally.
Basic concepts in economic theory such as capital, pecuniary and proper-ty originate from early economies based on agriculture and cattle production. The word ‘fee’ has a similar origin. Of a total area of 13 billion ha of land globally, 3.4 billion ha (26%) are classed as permanent pastures, where ru-minants are the dominating path to convert the sunlight captured in biomass to food. This suggests that there are substantial relations between efficient cattle production and general principles for efficient natural resource man-agement.
On a higher level, the issues discussed are

3
the importance of using relevant methods for the issues and systems under consideration,
the problem of extrapolating methods from one area where their rele-vance has been sufficiently well probed and approved, to other issues and systems where different disciplines represent the state of the art,
the need for good empirical evidence as a foundation for sustainable development, whether we are discussing feeding standards to dairy cows, or general market-based incentives in the economy.
1.2 Scope The scope of the study is to contribute towards an operative toolkit for sus-tainable development, bridging the implementation and knowledge gaps acknowledged by OECD (2001).
This toolkit consists of contributions on the conceptual level, or what we might call a macro-ecological-economic level. The contribution on the con-ceptual level supplies the major elements and relations to consider in imple-menting sustainable development. The macro-ecological-economic contribu-tion supports the evaluation of the rationality of policy measures given the context of sustainable development.
This toolkit provides a methodological contribution to the field of Partici-patory Multi-Criteria Multi-Level Analysis. This contribution provides an example of how to analyse systems that possess mutual dependencies be-tween systems and system levels, exemplified by an application in animal production sciences. While the contribution on the conceptual level focuses on the relations between the ecological, economic and social dimensions of a sustainable development on the macro level, the later contribution focuses on the relation between very high and very low system levels. An example is the relation between the performance of an individual cow and her marginal impact on food supply as well as climate on the global level. When analys-ing relations between the three sustainability dimensions, and between high and low system levels, it is of crucial importance to pay the respect due to the system characteristics that describe the complexity of systems where sustainability is an issue. If this is solved sufficiently well, it can contribute to systems of ecological economic accounts that are valid at individual firm level, where the ecological, economic and social contribution added per firm can be summed up to regional, national and international systems of ecologi-cal economic accounts, considering carrying capacity limits of affected eco-systems from low to global level. This can also help when adjusting the ac-counting rules regarding the climate issue from IPCC to the accounting rules in the international system of national accounts. It can also improve the sub-

4
system of sustainability performance analysis within systems of sustainabil-ity/environmental certification such as the ISO 14 001 system.
Finally, among these tools an example is presented where traditional management tools within agricultural and animal production sciences are integrated, thus increasing the capacity to explore potentials to increase the efficiency of utilisation of the variation in global agro-ecosystems for pro-duction of goods and services supporting human needs and desires. The tra-ditional management tools integrated are feeding plans in ruminant produc-tion systems such as milk and meat from cattle, plans for nutrient supply in crop production, and the system of production branch calculus in agriculture. The resulting tool supports evaluation of how to increase the long-term con-tribution to societal needs from combined plant-ruminant production systems in agro-ecosystems that otherwise have a low capacity to produce food. Around 70% of global agricultural land (3.4 billion ha) is classed as perma-nent pasture. Ruminants are a prerequisite for food production from perma-nent pastures. Of the remaining 30% of agricultural land classed as arable land (1.4 billion ha), a substantial fraction produces feed for animals. The tools mentioned above are needed to optimise the use of land for different societal purposes from local to global level.
1.3 Thesis outline Section 2 presents the methodology of the thesis. Section 3 gives an over-view of the results of the six papers. Section 4 analyses vital aspects of the results in relation to the knowledge frontier, and discusses policy implica-tions of the results. Section 5 provides conclusions and a short summary of the degree to which the thesis has increased knowledge about the sustainabil-ity aspects considered therein (see 1.1).
Figure 1 shows a model of the global system based on the contributions in systems ecology by H.T. Odum. The different papers in the thesis relate to different parts of this system.

5
Figure 1. A model of the global ecological economic system based on
the contributions by Odum (1988, 1996).
Paper I presents a version of the conceptual model shown in Figure 1, where the concepts, symbols and relations have been translated into the language of economics
Paper II treats the same system. Here, the conceptual model is trans-formed into a mathematical logical structure by which the output in a pro-duction process is related to the inputs of renewable and non-renewable nat-ural resources, and the impact of production on the environment.
Figure 1 indicates the hierarchical structure of global systems, where e.g. in the economy, important system levels are the enterprise and household level (in principle the same level), local level, regional level, national level, EU, the global economy, and the global economic-ecological system.
Paper III focuses on the subsystem concentrate feeding of dairy cows in Sweden and evaluates how it affects other parts of the global system through emissions of ammonia contributing to acidification and eutrophication of aqueous and terrestrial ecosystems, the nutritional supply of members of households that may affect global food security, and the economy of the group of enterprises constituted by Swedish milk producers.
Paper IV goes deep into the animal production system in Sweden and its production biological and economic aspects. It relates the outcomes from

6
animal production to the quality of the input of feeds into animal production. This provides a necessary link in a chain that joins animal production sys-tems to the agro-ecological context provided by nature through e.g. the bed-rock, soils and weather conditions of each individual production site.
Paper V goes further in an analysis of how decisions made in animal pro-duction systems in Sweden and globally affect the different subsystems in Figure 1, thereby affecting economic and ecological resources appropriated in animal production systems, as well as the capacity to fulfil human needs and desires, focusing on food and bioenergy potentials.
Paper VI takes a global perspective of the animal production system and its capacity to fulfil human needs while minimising the appropriation of mainly ecological resources. The role of animal production systems in a sustainable development is defined from the system ecological perspective in Figure 1. Used in a relevant way, animal production systems are important means within “Agriculture” in Figure 1 to enhance global sustainability through the capacity to convert biomass from terrestrial ecosystems (“Land” in Figure 1) to high quality food. Through such production, there may be mutual benefits in agricultural soils through impacts on the humus and nutri-ent content, on atmospheric carbon dioxide levels, on the aesthetic and rec-reational values of the agricultural landscape, and on biodiversity associated with agro-ecosystems. Used poorly (given the context of sustainable devel-opment), animal production systems may cause substantial sustainability costs in the ecological, economic and social dimensions through direct and indirect impacts on agricultural, forestry, water, and atmospheric systems. Based on the logics of Figure 1, such impacts are investigated in the context of four measures in global animal production systems. One of these evalu-ates the global relevance of the findings in Paper III regarding feeding trends in Swedish milk production for sustainable development.
Papers V and VI build on the methodology developed in Paper III regard-ing analysis of causal chains in a complex ecological-economic production-consumption system with mutual interdependencies between systems and system levels.
1.4 A common thread A common thread through the thesis is identification of the gap between the characteristics of real systems according to the best available knowledge and the characteristics of the models of real systems used in different analyses.
LCA (Life Cycle Assessment) is widely used in Sweden to evaluate the sustainability of agricultural production systems. One problem with LCA is that it is a methodology that was developed in the engineering sciences thus

7
it scope is limited and excludes vital features of systems where life is a key systems characteristic, as shown in Figure 2.
Figure 2. LCA and the sustainability context.
The engineering-based conceptual model of the production system is the industrial plant. The importance of labour and capital (using their traditional meanings) is ignored. Furthermore, the model suggests that there are no nat-ural resources costs behind humans, labour, and capital. The focus is on in-fluxes of natural resources, and effluxes in the form of wastes. Products and product quality in relation to their usefulness in the socio-economic system are typically treated with substantially less accuracy.
With its background in engineering sciences, LCA has its strengths in analysis of the technical aspects of industrial production processes (see Baumann and Tillman 2004). Inputs of natural resources into the production system and emissions out of the production system, where the industrial plant is the mental model used, are handled easily. Problems arise because engineering sciences do not provide expert knowledge regarding the ecolog-ical, economic and social process restrictions that define the level of sustain-ability in specific production situations. To overcome this limitation in the

8
understanding of the total sustainability, different assumptions are made, providing analytical shortcuts. For example, it is commonly assumed that there are no time and space dependent variations whatsoever in conditions in ecological systems. Furthermore, ecological carrying capacity limits are not considered. With these assumptions, the concept of ecological sustainability becomes irrelevant as there is no longer any ecological process restriction that can be affected, and thus no ecological carrying capacity limit that can be trespassed. Such assumptions devalue the results obtained, given the sus-tainability context. This illustrates the scientific problems of extrapolation, here on the methodological level. Methods that have proved useful within the boundaries of engineering sciences are applied outside these boundaries, generating results that carry a high risk of being inaccurate.
Important and related aspects considered in the thesis relate to
the relevance of engineering-based concepts, methods and incentives in general as promoters of sustainable development,
the relevance of the theoretical models behind current protein evaluation and standards systems in milk production, and
the relevance of the theoretical models behind current energy evaluation and standards systems in milk production.
There are similar issues regarding the gaps between the characteristics of the real world systems treated in these three groups of examples and the simpli-fied models, as previously mentioned regarding LCA.
The thesis provides arguments supporting these conclusions. It also sug-gests how these models may be complemented so that their advantages are retained while their weaknesses are eliminated.
The following section presents a number of quantitative estimates. A high level of logical consistency is prioritised in the chain of operations leading to the final estimates. This reflects the view that when handling complex sys-tems the quality of the numeric analysis is vitally important. However, the final results should not be viewed as the definite truth. Often the best that can be achieved is a reasonable estimate of the magnitude of impacts, given specific assumptions.

9
2 Methodology
2.1 General description The thesis follows a long tradition in agricultural science in Sweden, where Nanneson et al. (1945) made contributions to agricultural economics with deep roots in the biology of crop production and animal husbandry, Renborg (1957) and Johnsson et al. (1959) developed methods from linear algebra to maximise the profits of individual farms for particular economic and produc-tion biological conditions. Wiktorsson (1971, 1979) explored the law of di-minishing returns in relation to feed allowances in milk production. Hell-strand (1989) based on the relation between feed intake and milk output of Wiktorsson, evaluated whether the energy feeding standards at the time cor-responded to the level that yielded the maximal economic result per cow, taking into account the price relations between concentrate feeds and milk.
Renborg (1957) and Johnson et al. (1959) provided the foundation for management and analytical tools regarding the economics of agriculture at farm level in Sweden from 1960 onwards. The contributions from Wiktorsson (1971, 1979) linked production functions in milk production in biological terms to economic analyses such as those developed by Renborg and Johnson et al. Hellstrand (1989) refers to corresponding contributions regarding biological production functions in cattle production for meat, ges-tation and maintenance for different types of cattle. Drake (1999) developed and applied a methodology to evaluate external values in the agricultural landscape, where one point of departure was methods based on Renborg (1957).
SLU (1989a,b; 2006; 2009) summarises this information in tools for ex-tension services that are updated versions of the methods and relations de-veloped by the authors mentioned above.
This forms the methodological backdrop for Paper IV, in which a simula-tion model of animal production is developed and applied. The model is based on the relations between feed intake and milk output found by Wiktorsson (1971, 1979) and how they are expressed in the system of budget sheets for Swedish agriculture (SLU, 1989a,b; 2006; 2009). Essentially, Paper IV presents the results from the toolkit that guided the work of the regional authorities “Lantbruksnämnden”, which was an important organisa-tional body supporting the implementation of rational agriculture in Sweden from 1967 to 1990. “Rational” in this context refers to the logics of the eco-

10
nomic models guiding the general economic policy at that time, as it was expressed in the agricultural policy. In Paper IV, this methodological ap-proach is used to investigate economic and ecological outcomes of two dif-ferent objectives of animal production. The first is to maximise profit given the prevailing price relations in the economy and the agricultural sector. The second is to maximise sustainable production levels, assuming that rumi-nants consuming 100% forages would support this goal.
Paper III focuses on a minor part of the system described in Paper IV. Ecological, economic and social effects of changes in the concentrate feed-ing of dairy cows from 1991 to 1999 in Sweden were evaluated from the low system level to the global level. The methodological core of the analysis was based on methods that were commonly used in extension services in animal production in the 1980s, when I worked in the field. Hellstrand (1988) sum-marised these experiences in a model to be applied in advanced consultancy in milk production, improving the economic results by more efficient utilisa-tion of the biological production capacity of the cows. Hellstrand (1989), in a background to a major revision of the official feeding table for ruminants in Sweden with feeding standards, further elaborated on the basic principles to handle economically competitive and natural resource efficient milk pro-duction. In these early contributions regarding milk production, the same three basic principles that play a major role in Paper VI are of vital im-portance, namely Liebig´s “Law” of minimum, Shelford´s “Law” of toler-ance, and the “Law” of diminishing returns.
From this common core in Papers III and IV based on traditional methods supporting evaluation of the efficiency in animal production systems in bio-logical and economic terms, the analysis was expanded in an evaluation of the sustainability impacts of the increasing level of concentrate feeding per kg of milk produced in Swedish milk production from 1991 to 1999 (Paper III). The analysis of sustainability impacts from low to global system level in Paper III follows the methodology of Impredicative Loop Analysis (ILA) (Giampietro 2003) on a conceptual level. ILA is a contribution within multi-criteria multi-level analysis and is thus a method for integrative assessment.
The core of the methodology applied in Papers III and IV lies among tra-ditional analytical methods that have been applied for several decades within agricultural sciences in Sweden, as well as in extension services. It implied that in repeated probing against reality, methodological flaws have been removed through trial and error.
Papers III and IV articulate a movement away from traditional analysis in animal production towards contributions that take their point of departure from a high abstract system level.
Paper I makes a contribution at the conceptual level. Animal nutrition, physiology, economic theory, and systems ecology are integrated into a con-ceptual model of the economy in its ecological and social context. In Paper

11
II this model of the economy in its ecological and social context forms the platform for the construction of economic production functions that not only show the value of the outcome of production as a function of inputs of la-bour and capital, but also of natural resources, including environmental ef-fects. This was partly motivated by a need to express the dependence of the economy on the ecosystems in which it is embedded, in a widely understood language, such as the language of economics. Papers I and II were inspired by early contributions of e.g. Costanza and Daly in ecological economics and in systems ecology from around 1990 (e.g. Costanza 1994; Costanza and Perrings 1990; Daly 1990; Daly and Cobb 1989).
Papers III and IV expand analytical approaches from a concrete and low system level to higher levels. Paper I starts at a high abstract level, and per-forms an analysis that moves towards a methodological contribution for quantitative analyses of sustainability performance. This methodological contribution is made in Paper II, in which its relevance is anchored by statis-tical analysis.
Thus, Papers III and IV express a bottom-up approach in the evaluation of the role of land in the economy within a sustainability context; whereas Pa-pers I and II represent a top-down movement in the investigation of the same issue. The same issue is thus illuminated from two independent perspectives.
Papers V and VI take as their departure point Paper III, and broaden the analysis towards a contribution in Paper VI regarding the role of animal pro-duction in sustainable agriculture in a sustainable society.
Taken together, the papers describe original contributions where a sub-stantial part of the work has been to develop new methods to investigate new issues. In this context, the work has followed the methodology of post-normal science as described by Giampietro (2003). The contributions can also be described as a stepwise enlargement of the system boundaries of traditional contributions within economics and agricultural sciences.
2.2 Data gathering and analysis Paper I contains qualitative analysis regarding a basic conceptual model of the economic system in its ecological and social contexts, and thus does not include data gathering and quantitative analysis. Paper II solidifies some of the steps in the conceptual model laid out in Paper I, in terms of a production function where production value is defined as a function of inputs of
natural capital, renewable and non-renewable, including the impact of the life-support systems,
man-made capital, and
human capital.
12
The function obtained is named a Biophysically Anchored Production Func-tion (BAPF).
Data from IEA are used to evaluate the value and significance of some parameters in the BAPF for Sweden, USA, EU, and Japan 1962-1997. Offi-cial national statistics in Sweden are used to evaluate some relations on a more detailed level for the period 1970-2000. Data from Lindmark (1998) made it possible to relate some emissions to air, water and of solid wastes to GDP for the period 1900–1990. The obtained R2-values and significance levels varied substantially for the different emissions.
The BAPF was used in a non-numerical analysis of the pattern of welfare losses of forcing an ecologically limited economic subsystem to act as if exponential growth trespassing carrying capacity limits was possible.
Paper III describes a relatively uncomplicated analysis of a spectrum of sustainability impacts of an increase of crop protein feeds in Swedish milk and cattle production from 1991 to 1999. The analysis performed was of basically the same type that formed the backbone of economic and produc-tion biological analysis in agriculture for decades, with some additional steps. The challenge here was to ensure that the law of constancy of mass and energy were not violated, i.e. that effluxes of energy and matter from one subsystem was equal to the influxes into the next subsystem.
In Paper IV traditional methods to plan the production system at farm level in order to balance available production resources such as labour and land, is used in an analysis of sustainability performance of different man-agement strategies.
Paper V examines sustainability impacts of three measures within animal production systems,
substitution of ruminant products with products from pigs,
increased feeding efficiency in milk production with constant yield per cow, and
increased milk production per cow.
Within animal production sciences and from experience as a professional in animal production, these examples are quite straightforward. The results follow quite logically when the points of departure for the analysis are known.
Paper VI mainly builds on the results in Papers III and V. The following paragraphs describe potentials for improvements. It should
be borne in mind that the estimated potentials are a function of set assump-tions. The degree to which the discovered potentials can actually be realised depends on a number of factors that need further studies for clarification.

13
2.3 Validation, use and uncertainties of data When working with models of complex systems there are three levels where the relevance of a model should be probed (Giampietro 2003).
The first is whether the model is at all relevant for the systems and issues at hand.
The second is whether the subsystems and relations within the overall model are relevant.
The third is whether the numerical values of constants associated with dif-ferent relations are good enough. The expression “good enough” is chosen to stress that when dealing with complex systems there is always an element of arbitrary choice involved.
In all contributions in the thesis, models and tools have been constructed from the literature within disciplines that offer expertise in the systems and issues described. Concepts and structures from different disciplines have been integrated into new concepts and tools appropriate for the questions at hand. The ambition has been to keep a high level of internal logical con-sistency.
This ambition is reflected in the timespan for the PhD thesis, which has enabled studies and professional experiences within different fields of knowledge of importance for the understanding of the value of land within human geography, economy, systems ecology, forestry sciences, agricultural sciences, applied environmental sciences and theories of complex systems. At the same time, networks offering complementary skills have been devel-oped and utilised.
The expansion of the relevance boundaries of already established models, the integration of complementary contributions from different disciplines, and the ambition to meet high standard of internal logical consistency con-tribute to the relevance of the tools and models used on the two highest sys-tem levels.
When possible, the relevance of proposed models has been evaluated through regression analysis against data from the best public sources availa-ble from authorities and/or scientific publications. This contributes to the probing of relevance on the lowest of the three levels.
The methods and tools presented in the thesis have been applied during more than 30 years of professional experiences as a consultant in different contexts. This experience has enabled the possibility to evaluate the rele-vance of the results delivered in real world systems. In a sense, this means that my experience as a consultant has acted as a laboratory for testing meth-ods and concepts developed in the scientific context.
If, for example

14
the analysis in Paper VI suggesting that a new system for feeding stand-ards in Swedish milk production will increase the use of concentrates, reduce the economic returns, and result in a lower efficiency in the use of natural resources,
the analysis is supported by theoretical contributions in the thesis itself, and
work as consultant at five dairy farms from 2011 to 2013 which shows that
o this actually happened when the new system was introduced,
o when farmers adjusted their feeding rations, there were positive impacts on economic results and increased efficiency in the use of natural resources per kg milk produced of the same magnitude as anticipated by the theoretical analysis,
then the evaluation of the relevance of models and tools have elements that are not usually found in scientific contributions. There are two different as-pects to this test of relevance. It demonstrates credibility among dairy farm-ers, who take the risk of changing their feeding strategy against the dominant system. This is not an easy step to take. The second aspect is that the pro-posed potentials for improvements were realised.
The methods and models regarding milk production and feeding strategies in Papers III, IV, V and VI have been evaluated throughout using this scheme. Thus the relevance of models and tools has been tested at all three system levels simultaneously.
The contributions in Papers I and II have been evaluated in the role of consultant to local, regional, and national authorities regarding the issue of how a sustainable development can be understood from the customer in question, and utilised for the benefit of their mission. The acceptance of this work as consultant indicates a perception among people outside the scientific context that issues around data quality, relevance, and uncertainties have been handled satisfactorily.
Later parts of this thesis present a collage of real world trends that is itself a test of relevance of the contributions in the thesis. Do these trends pose questions about where the toolkit for sustainable development presented in the thesis can contribute to needed answers, or do these trends suggest that the toolkit is irrelevant? These trends contribute to a probing of relevance at the three levels mentioned above.
In Papers I and II, the basic structure of the conceptual model of the economy in its ecological and social contexts and the biophysically anchored production function derived from it agree well with
15
the OECD model of the economy in its ecological and social contexts (2001),
the goal structure expressed in the UN Millennium Development Goals of sustainable development (UN 2008), and
the perspectives and methods of the Millennium Ecosystem Assessment (MEA 2005).
The contribution within Participatory Multi-Criteria Multi-Level Analysis in Paper III is consistent with the same three sources. This structure is also an important part of Papers V and VI, and expresses the general structure of the thesis itself.
This suggests that if these contributions in the international policy-sphere are relevant in the relation to a sustainable development, then this thesis with its contributions is as well.

16
3 Results
3.1 Overview This presentation of results has the following structure: Table 1 gives a summary of research questions, materials and methods, and results from the first five papers of the thesis. Paper VI has a somewhat different character, as it is a review of the current knowledge regarding sustainable animal pro-duction on a global scale. Papers I–V are summarised after Table 1.
The papers are included in Appendix I–VI.

17
Tabl
e 1.
Re
sear
ch q
uest
ions
, sys
tem
leve
ls, s
usta
inab
ility
dim
ensi
ons,
mat
eria
ls a
nd m
etho
ds, a
nd re
sults
in P
aper
s I–V
.
Issu
es
Syst
em le
vels
D
imen
sion
s M
ater
ial/
met
hod
Foun
d an
swer
s Pa
per
1. C
once
ptua
l m
odel
of t
he
econ
omy
in it
s ec
olog
ical
and
so
cial
con
text
.
From
phy
siol
ogic
al
cellu
lar a
nd su
b ce
llula
r lev
el to
gl
obal
leve
l reg
ard-
ing,
e.g
., gl
obal
food
se
curit
y.
Ecol
ogic
al,
econ
omic
and
so
cial
.
The
proc
edur
e by
whi
ch
rese
arch
que
stio
n 2
and
3 w
ere
answ
ered
gav
e as
a
resu
lt th
e co
ncep
tual
mod
-el
.
The
conc
eptu
al m
odel
. I
2. S
treng
th a
nd
wea
knes
ses o
f na
tura
l res
ourc
e co
ncep
ts.
From
phy
siol
ogic
al
cellu
lar a
nd su
b ce
llula
r lev
el to
gl
obal
leve
l reg
ard-
ing,
e.g
., gl
obal
food
se
curit
y.
Ecol
ogic
al,
econ
omic
and
so
cial
.
Ana
lysi
s of i
nter
nal l
ogic
al
stru
ctur
e; c
ompa
rison
with
kn
own
prop
ertie
s of e
co-
logi
cal,
econ
omic
and
so
cial
syst
ems,
with
a
focu
s on
thei
r key
cha
rac-
teris
tics g
iven
by
the
im-
porta
nce
of li
fe o
f mi-
crob
es, p
lant
s, an
imal
s and
hu
man
s in
the
sust
aina
bil-
ity c
onte
xt.
Nat
ural
reso
urce
con
cept
s fro
m e
cono
mic
theo
ry, n
utri-
tiona
l phy
siol
ogy
and
syst
ems e
colo
gy h
ad a
subs
tant
ial
pote
ntia
l to
cont
ribut
e to
war
ds su
stai
nabl
e m
anag
emen
t of
nat
ural
reso
urce
s, in
clud
ing
cons
ider
atio
n of
impa
cts
on e
cosy
stem
s life
-sup
porti
ng sy
stem
s.
Stre
ngth
s and
wea
knes
ses w
as a
func
tion
of th
e pa
rt of
ec
olog
ical
eco
nom
ic sy
stem
s foc
used
with
in e
ach
theo
-ry
. Cen
tral r
esou
rce
conc
epts
with
in p
hysi
cal r
esou
rce
theo
ry w
ere
foun
d to
hav
e a
limite
d ca
paci
ty to
con
trib-
ute,
as t
hey
wer
e de
fined
und
er su
ch c
ondi
tions
, tha
t th
ose
proc
ess r
estri
ctio
ns th
at d
efin
es e
colo
gica
l, ec
o-no
mic
and
soci
al su
stai
nabi
lity
limits
are
igno
red.
As a
re
sult,
the
appl
icat
ion
of th
ese
reso
urce
con
cept
s, su
ch
as e
xerg
y an
d/or
ent
ropy
show
s tha
t the
size
of t
he
hum
an e
cono
my
in te
rms o
f the
flux
of n
atur
al re
-so
urce
s fee
ding
the
proc
ess i
n th
e bi
osph
ere
is v
ery
smal
l, ar
ound
1 p
art o
f 10
000
com
pare
d to
the
influ
x th
roug
h so
lar r
adia
tion.
The
mag
nitu
de o
f the
env
iron-
men
tal d
istu
rban
ces d
ue to
hum
an u
se o
f nat
ural
re-
sour
ces i
s sub
stan
tial.
In p
ract
ice,
thus
, vita
l sus
tain
abil-
ity c
ompo
nent
s in
the
eval
uatio
n of
nat
ural
reso
urce
s qu
ality
are
igno
red
whe
n ap
plyi
ng re
sour
ce c
once
pts
from
phy
sica
l res
ourc
e th
eory
. In
the
sim
ples
t for
m th
is
I

18
Issu
es
Syst
em le
vels
D
imen
sion
s M
ater
ial/
met
hod
Foun
d an
swer
s Pa
per
conc
lusio
n ca
n be
stat
ed in
the
follo
win
g w
ay. L
ife is
a
key
syst
em c
hara
cter
istic
in e
colo
gica
l, ec
onom
ic a
nd
soci
al sy
stem
s. In
phy
sics
, life
is n
ot. T
hus,
phys
ics
does
not
hav
e th
e to
ols r
elev
ant f
or a
naly
sis o
f the
su
stai
nabi
lity
of sy
stem
s whe
re su
stai
nabi
lity
is a
n is
sue.
1
3. H
ow to
inte
-gr
ate
betw
een
natu
ral r
esou
rce
conc
epts
, exp
and-
ing
thei
r dom
ain
of re
leva
nce.
From
phy
siol
ogic
al
cellu
lar a
nd su
b ce
llula
r lev
el to
gl
obal
leve
l reg
ard-
ing,
e.g
., gl
obal
food
se
curit
y
From
phy
sio-
logi
cal c
ellu
lar
and
sub
cellu
lar
leve
l to
glob
al
leve
l reg
ardi
ng,
e.g.
, glo
bal
food
secu
rity
Ana
lysi
s by
whi
ch a
ssum
p-tio
ns th
e di
ffere
nt n
atur
al
reso
urce
con
cept
s are
de
fined
; exp
lorin
g to
wha
t de
gree
they
can
be
unifi
ed
by m
odify
ing
the
assu
med
as
sum
ptio
ns; d
ecid
ing
whi
ch th
at c
an b
e in
tegr
at-
ed, a
nd w
hich
that
has
a
limite
d po
tent
ial t
o co
n-tri
bute
, giv
en th
e co
mpl
ex-
ity o
f sys
tem
s whe
re li
fe is
a
key-
feat
ure.
The
basi
c st
ruct
ure
of sy
stem
s eco
logy
, nut
ritio
nal
phys
iolo
gy, a
nd e
cono
mic
theo
ry w
as fo
und
to b
e co
m-
plem
entin
g, n
ot c
ontra
dict
ory.
Thu
s, th
e in
tegr
atio
n im
plie
s tha
t the
syst
em b
orde
rs a
re e
xpan
ded
so th
at th
e co
nnec
tions
can
be
expl
icitl
y ex
pres
sed.
I
4. C
onst
ruct
ion
of
Bio
phys
ical
ly
anch
ored
pro
duc-
tion
func
tions
(B
APF
).
Thos
e sy
stem
leve
ls
whe
re p
rodu
ctio
n fu
nctio
ns a
re re
le-
vant
, i.e
., fro
m si
n-gl
e in
dust
rial p
lant
to
nat
iona
l eco
nom
ic
leve
l.
Ecol
ogic
al a
nd
econ
omic
. Fr
om th
e in
tern
al lo
gic
of
the
conc
eptu
al m
odel
, see
re
sear
ch q
uest
ion
1, a
nd
the
wor
k us
ed a
s inp
ut in
its
con
stru
ctio
n, a
BA
PF
was
con
stru
cted
. Mor
e sp
ecifi
ed, i
mpo
rtant
inpu
ts
in th
at p
roce
ss w
ere
the
prod
uctio
n fu
nctio
ns u
sed
by th
e Sw
edis
h Pr
oduc
tivi-
It w
as p
ossi
ble
to c
onst
ruct
it; w
hen
thro
ugh
stat
istic
al
anal
ysis
est
imat
ing
the
hist
oric
al p
redi
ctiv
e po
wer
, st
rong
R2-
valu
es w
as fo
und.
Tha
t rel
ates
to h
ow m
uch
varia
tion
over
tim
e in
qua
lity
corr
ecte
d en
ergy
use
ex
plai
ned
varia
tion
in G
DP,
for f
our e
cono
mie
s. A
lso,
th
e ch
ange
in e
nerg
y us
e fro
m o
ne y
ear t
o an
othe
r ex
plai
ned
a su
bsta
ntia
l par
t of t
he c
hang
e io
n G
DP
from
on
e ye
ar to
ano
ther
. The
latte
r mea
sure
s dec
reas
es th
e ris
k th
at a
hid
den
third
fact
or is
the
inde
pend
ent o
ne
whe
re e
nerg
y us
e an
d G
DP
both
are
dep
ende
nt o
nes,
II
1.
Thi
s is
not
to s
ay th
at p
hysi
cs la
ck v
alue
in th
e co
ntex
t of a
sus
tain
able
dev
elop
men
t. Th
e po
int i
s th
at p
hysi
cs is
not
sui
tabl
e as
mod
us o
pera
ndi i
n th
e ev
alua
tion
of e
colo
gica
l, ec
onom
ic, a
nd so
cial
sust
aina
bilit
y.

19
Issu
es
Syst
em le
vels
D
imen
sion
s M
ater
ial/
met
hod
Foun
d an
swer
s Pa
per
ty C
omm
issi
on (S
OU
19
91:8
2); t
he so
cal
led
Hub
bert
curv
es u
sed
in
anal
ysis
of t
he e
xplo
itatio
n pa
ttern
of f
ossi
l oil,
ear
lier
stud
ies r
egar
ding
the
con-
vers
ion
effic
ienc
y fro
m
ener
gy to
GD
P, a
nd th
e re
silie
nce
conc
ept w
ith
orga
nisi
ng a
nd d
isorg
anis
-in
g fo
rces
.
with
no
caus
al re
latio
ns b
etw
een
them
. Thu
s, th
e st
atis
-tic
al a
naly
sis s
uppo
rts th
e re
leva
nce
of th
e B
APF
.
5 Tr
ends
, lev
els
and
expl
anat
ory
pow
er o
f key
pa
ram
eter
s in
the
prop
osed
BA
PF.
Nat
iona
l lev
el.
Ecol
ogic
al a
nd
econ
omic
. St
atis
tical
ana
lysi
s of l
ong
term
tren
ds a
nd le
vels
of
key-
para
met
ers i
n th
e pr
opos
ed B
APF
for d
iffer
-en
t eco
nom
ies.
Se a
bove
. II
6. W
hat a
re th
e co
sts o
f uns
usta
in-
able
eco
nom
ic
mat
eria
l exp
onen
-tia
l gro
wth
.
All
leve
ls (t
he is
sue
is g
ener
al).
Ecol
ogic
al,
econ
omic
and
so
cial
.
An
logi
cal a
naly
sis b
ased
on
the
BA
PF c
onst
ruct
ed
(see
4).
The
cost
s fol
low
the
patte
rn o
f qua
drup
le e
xpon
entia
l gr
owth
. The
reas
on is
that
a m
ater
ially
gro
win
g ec
ono-
my
incr
ease
s the
dem
and
on n
atur
al re
sour
ces a
nd
incr
ease
s the
am
ount
of l
and
appr
opria
ted,
and
em
is-
sion
s mad
e, e
very
thin
g el
se e
qual
. At t
he sa
me
time,
w
ith e
xhau
stio
n of
the
mos
t val
uabl
e st
ocks
of r
enew
a-bl
e an
d no
n-re
new
able
nat
ural
cap
ital f
irst (
supp
orts
the
optim
isat
ion
of p
rofit
in re
cent
tim
e), a
n ov
er ti
me
incr
easi
ng a
mou
nt o
f nat
ural
reso
urce
s exp
loite
d is
ne
eded
to (i
) upg
rade
min
ed n
atur
al re
sour
ces t
o th
e pr
evio
us q
ualit
y le
vel a
nd (i
i) ta
ke c
are
of w
aste
s tha
t pe
r uni
t nat
ural
reso
urce
del
iver
ed o
f a st
anda
rdis
ed
qual
ity, i
ncre
ases
with
dec
reas
ing
reso
urce
qua
lity.
2
II
2.
By
mat
hem
atic
al lo
gic,
dec
reas
ing
ore
grad
e im
plie
s inc
reas
ing
was
tes p
er u
nit m
etal
pro
duce
d, e
very
thin
g el
se e
qual
.
20
Issu
es
Syst
em le
vels
D
imen
sion
s M
ater
ial/
met
hod
Foun
d an
swer
s Pa
per
7. M
etho
d to
m
easu
re su
stai
na-
bilit
y ef
fect
s of a
n ov
er ti
me
in-
crea
sed
conc
en-
trate
feed
ing
in
milk
-pro
duct
ion.
From
indi
vidu
al c
ow
to g
loba
l foo
d se
cu-
rity-
leve
l.
Ecol
ogic
al,
econ
omic
and
so
cial
.
Bas
ed o
n (i)
met
hods
and
ap
proa
ches
use
d in
ad-
vanc
ed c
onsu
ltanc
y in
milk
pr
oduc
tion,
(ii)
inte
grat
ed
with
met
hods
of p
artic
ipat
-in
g in
tegr
ativ
e as
sess
men
t, (ii
i) an
d ex
pand
ing
syst
ems
bord
ers t
o al
so in
clud
e su
stai
nabi
lity
impa
cts i
n th
e th
ree
sust
aina
bilit
y di
men
sion
s fro
m si
ngle
co
w to
glo
bal f
ood
supp
ly
leve
l.
A m
etho
d w
as d
evel
oped
, whi
ch m
ade
it po
ssib
le to
re
late
the
incr
ease
d us
e of
pur
chas
ed fe
eds t
o in
crea
sing
su
stai
nabi
lity
cost
s in
ecol
ogic
al, e
cono
mic
and
soci
al
term
s.
III
8. R
esul
ts d
eliv
-er
ed b
y th
e m
eth-
od d
evel
oped
in 7
.
From
indi
vidu
al c
ow
to g
loba
l foo
d se
cu-
rity-
leve
l.
Ecol
ogic
al,
econ
omic
and
so
cial
.
A c
ombi
natio
n of
the
met
hodo
logy
dev
elop
ed in
7
and
offic
ial d
ata
rega
rd-
ing
num
ber o
f cow
s, th
eir
prod
uctio
n le
vel,
and
cons
umpt
ion
of p
urch
ased
fe
eds t
o ca
ttle
and
dairy
co
ws.
Such
resu
lts w
ere
perf
orm
ed, s
how
ing
subs
tant
ial a
nd
nega
tive
effe
cts i
n ec
olog
ical
, eco
nom
ic a
nd so
cial
te
rms f
rom
indi
vidu
al c
ow le
vel t
o gl
obal
food
supp
ly
leve
l. Fo
r the
num
eric
al v
alue
s, se
e pa
per I
II.
III
9. A
naly
sis o
f the
qu
ality
of t
he
desc
riptio
n of
an
imal
pro
duct
ion
in so
me
stud
ies o
f th
e su
stai
nabi
lity
of a
nim
al p
rodu
c-tio
n.
From
rum
en m
icro
be
ecos
yste
m to
glo
bal
food
supp
ly a
nd
clim
ate
chan
ge.
Ecol
ogic
al,
econ
omic
, and
so
cial
, with
a
focu
s on
rum
en
prod
uctio
n bi
olog
y an
d ec
onom
y.
Com
pare
d (i)
LC
A-s
tudi
es
of S
wed
ish
milk
pro
duc-
tion;
(ii)
the
Food
Phy
to-
mas
s Dem
and-
mod
el; a
nd
(iii)
an st
udy
of in
tegr
ated
ca
ttle
and
suga
rcan
e pr
o-du
ctio
n fo
r eth
anol
-pu
rpos
es w
ith c
omm
on
know
ledg
e w
ithin
rum
en
anim
al p
rodu
ctio
n sc
ienc
-es
, and
the
pers
pect
ives
on
The
anal
ysed
exa
mpl
es p
rovi
de re
sults
that
to a
subs
tan-
tial p
art w
ere
arte
fact
s, du
e to
the
gap
betw
een
the
anal
ytic
al a
ppro
ach
they
app
lied
in th
eir a
naly
sis o
f ru
men
ani
mal
pro
duct
ion
syst
ems a
nd (i
) com
mon
kn
owle
dge
with
in ru
men
ani
mal
pro
duct
ion
scie
nces
, an
d (ii
) the
inte
rpre
tatio
n of
a su
stai
nabl
e de
velo
pmen
t ex
pres
sed
by th
e m
entio
ned
sour
ces,
resp
ectiv
ely.
Th
us, t
here
is a
dem
and
for s
uch
met
hods
as t
he si
mul
a-tio
n m
odel
con
stru
cted
, see
rese
arch
que
stio
n 10
and
11
.
IV

21
Issu
es
Syst
em le
vels
D
imen
sion
s M
ater
ial/
met
hod
Foun
d an
swer
s Pa
per
sust
aina
ble
deve
lopm
ent
expr
esse
d by
UN
, OEC
D,
and
Mill
enni
um E
cosy
stem
A
sses
smen
t.
10. C
onst
ruct
ion
of a
sim
ulat
ion
mod
el o
f ani
mal
pr
oduc
tion.
From
phy
siol
ogic
al
leve
l with
in in
divi
d-ua
l ani
mal
up
to
natio
nal a
nim
al
sect
or le
vel.
Nut
ritio
nal
phys
iolo
gy,
prod
uctio
n bi
olog
y an
d pr
oduc
tion
econ
omy
with
-in
ani
mal
pro
-du
ctio
n.
Bas
ed o
n ow
n (i)
exp
eri-
ence
s as e
xten
sion
offi
cer
and
(ii) f
indi
ngs w
hen
cont
ribut
ing
to a
maj
or
revi
sion
of t
he o
ffici
al
Swed
ish
tabl
e of
feed
s and
nu
trien
t req
uire
men
ts fo
r ru
min
ants
; int
egra
ted
into
th
e sy
stem
of p
rodu
ctio
n br
anch
cal
culu
s and
pla
n-ni
ng o
f the
pro
duct
ion
at
farm
leve
l pro
vide
d by
the
Swed
ish
Uni
vers
ity o
f A
gric
ultu
ral S
cien
ces.
That
was
con
stru
cted
, and
use
d, se
e 11
bel
ow.
IV
11. R
esul
t of
sim
ulat
ion
mod
el
whe
n as
sum
ing
that
the
first
man
-ag
emen
t prio
rity
was
max
imum
pr
ofit,
and
max
i-m
um (e
colo
gica
l) su
stai
nabi
lity,
re
spec
tivel
y.
From
phy
siol
ogic
al
leve
l with
in in
divi
d-ua
l ani
mal
up
to
natio
nal a
nim
al
sect
or le
vel.
Nut
ritio
nal
phys
iolo
gy,
prod
uctio
n bi
olog
y an
d pr
oduc
tion
econ
omy
with
-in
ani
mal
pro
-du
ctio
n.
Run
the
sim
ulat
ion
mod
el,
see
10.
The
Con
-sys
tem
ach
ieve
d a
good
resu
lt in
eco
nom
ic
term
s, gi
ven
the
pric
e-re
latio
ns a
t the
tim
e. S
ubst
antia
l po
tent
ials
for i
mpr
ovem
ents
in p
rodu
ctio
n bi
olog
ical
an
d ec
onom
ic te
rms w
as id
entif
ied.
In
the
Eco-
syst
em th
e as
sum
ed m
anag
er m
anag
ed to
pr
oduc
e qu
ite h
igh
milk
yie
lds b
y co
ws o
nly
cons
umin
g fo
rage
s. N
o gr
ains
wer
e us
ed in
the
feed
ing,
onl
y pa
s-tu
re a
nd fo
rage
s. In
this
syst
em, a
stoc
k of
cow
s onl
y pr
oduc
ing
calv
es fo
r mea
t-pro
duct
ion
had
the
sam
e fu
nctio
n as
the
pig-
prod
uctio
n sy
stem
in th
e C
on-
syst
em.
IV
12 W
hat a
re th
e po
tent
ials
to in
-cr
ease
land
ava
il-
From
feed
ing
effi-
cien
cy p
er k
g m
ilk
prod
uced
to g
loba
l
Ecol
ogic
al,
ener
getic
, ec
onom
ic a
nd
V

22
Issu
es
Syst
em le
vels
D
imen
sion
s M
ater
ial/
met
hod
Foun
d an
swer
s Pa
per
able
for f
ood
and
bioe
nerg
y pu
rpos
-es
thro
ugh
im-
prov
ed m
ilk p
ro-
duct
ion
by:
dem
and
of b
io-
ener
gy a
nd fo
od
secu
rity
on g
loba
l le
vel.
soci
al.
12.1
Incr
ease
d fe
edin
g ef
ficie
ncy
with
con
stan
t pr
oduc
tion
leve
l in
a na
tion
with
hig
h pr
oduc
tion
leve
ls.
From
feed
ing
effi-
cien
cy p
er k
g m
ilk
prod
uced
to g
loba
l de
man
d of
bio
-en
ergy
and
food
se
curit
y on
glo
bal
leve
l.
Ecol
ogic
al,
ener
getic
, ec
onom
ic a
nd
soci
al.
Bas
ed o
n m
etho
d, m
ater
ial
and
resu
lts fr
om re
sear
ch
ques
tion
7-8,
com
bine
d w
ith a
n an
alys
is o
f its
po
ssib
le si
gnifi
canc
e on
gl
obal
scal
e, th
roug
h a
com
paris
on o
f fee
ding
ef
ficie
ncie
s in
Swed
en
com
pare
d to
som
e ot
her
natio
ns w
ith h
igh
milk
yi
elds
per
cow
.
Giv
en th
e Sw
edis
h ca
se it
was
est
imat
ed th
at 1
60 0
00
hect
are
of tr
opic
al la
nd c
an b
e re
leas
ed if
the
high
er
feed
ing
effic
ienc
y3 o
f 199
1 w
as re
-ach
ieve
d fro
m th
e lo
wer
one
of 1
999.
Thi
s wou
ld a
t the
sam
e tim
e in
-cr
ease
farm
ers’
reve
nues
with
1.2
bill
ion
SEK
. The
re
sults
scal
ed u
p to
glo
bal l
evel
wou
ld c
orre
spon
d to
32
mill
ion
hect
are,
and
240
bill
ion
SEK
4. T
he re
leva
nce
of
scal
ing
up th
e Sw
edis
h re
sults
to g
loba
l sca
le w
as su
p-po
rted
by d
ata
sugg
estin
g ge
nera
lly lo
wer
feed
ing
effic
ienc
ies i
n m
ilk p
rodu
ctio
n in
USA
, Den
mar
k, a
nd
the
Net
herla
nds.
V
12.2
Impr
oved
pr
oduc
tion
per
cow
glo
bally
From
feed
ing
effi-
cien
cy p
er k
g m
ilk
prod
uced
to g
loba
l de
man
d of
bio
-en
ergy
and
food
se
curit
y on
glo
bal
leve
l.
Ecol
ogic
al,
ener
getic
, ec
onom
ic a
nd
soci
al.
FAO
-dat
a on
num
ber o
f co
ws a
nd th
eir p
rodu
ctio
n le
vels
glo
bally
ove
r tim
e,
and
corr
espo
ndin
g da
ta fo
r Sw
eden
, and
app
lyin
g Sw
edis
h en
ergy
requ
ire-
men
ts fo
r dai
ry c
ows p
ro-
vide
d in
form
atio
n ab
out
the
decr
ease
d ap
prop
ria-
tion
of fe
eds,
thus
of l
and,
fo
r a c
onst
ant t
otal
pro
duc-
tion
of m
ilk g
loba
lly, w
hen
By
incr
easi
ng g
loba
l ave
rage
milk
pro
duct
ion
per c
ow
to th
e cu
rren
t Sw
edis
h le
vel,
and
prod
uce
the
sam
e to
tal
amou
nt o
f milk
, 150
mill
ion
hect
are
crop
land
and
pa
stur
e is
rele
ased
for o
ther
pur
pose
s.
V
3.
To
avoi
d m
isun
ders
tand
ing,
the
feed
ing
effic
ienc
y m
easu
re is
a p
artia
l one
, whe
re m
ilk o
utpu
t is
rela
ted
to in
puts
of p
urch
ased
feed
s. Th
e fra
ctio
ns o
f fe
eds p
rodu
ced
on fa
rms a
nd fe
eds t
rade
d be
twee
n fa
rms a
re n
ot in
clud
ed.
4. O
n 1
Janu
ary
2013
, 1 U
S$ =
6.5
1 SE
K, a
nd 1
€ =
8.5
8 SE
K. F
rom
http
://se
.rate
q.co
m/,
2013
-01-
01.

23
Issu
es
Syst
em le
vels
D
imen
sion
s M
ater
ial/
met
hod
Foun
d an
swer
s Pa
per
aver
age
milk
yie
ld in
crea
s-es
.
12.3
Exp
andi
ng
milk
pro
duct
ion
in
a de
velo
ped
natio
n to
oth
erw
ise,
with
re
gard
to fo
od-
prod
uctio
n, m
ar-
gina
l agr
o-ec
osys
tem
s.
From
feed
ing
effi-
cien
cy p
er k
g m
ilk
prod
uced
to g
loba
l de
man
d of
bio
-en
ergy
and
food
se
curit
y on
glo
bal
leve
l.
Ecol
ogic
al,
ener
getic
, ec
onom
ic a
nd
soci
al.
App
lyin
g th
e pr
oduc
tion
biol
ogic
al c
ompe
tenc
e as
w
as th
e ba
sis o
f the
ana
ly-
sis r
egar
ding
rese
arch
qu
estio
n 7-
11, c
ombi
ned
with
act
ual d
ata
on a
reas
of
agric
ultu
ral l
and,
dis
tribu
-tio
n of
cro
ps, l
ey a
nd
past
ure,
and
ave
rage
yie
lds
per h
ecta
re m
ade
it po
ssi-
ble
to e
stim
ate
wha
t milk
pr
oduc
tion
that
are
a co
uld
supp
ly.
Cur
rent
are
as o
f agr
icul
tura
l lan
d in
the
north
ern
part
of
Swed
en u
sed
for g
rain
and
fora
ge p
rodu
ctio
n, 4
00 0
00
hect
are,
incl
udin
g pa
sture
, with
cur
rent
pro
duct
ion
leve
ls c
ould
supp
ly th
e to
tal e
nerg
y re
quire
men
ts o
f 3.5
tim
es m
ore
dairy
cow
s. Th
ey p
rodu
ce h
igh
qual
ity fo
od,
milk
pro
duct
s, fro
m a
gro-
ecos
yste
ms w
ith o
ther
wis
e m
argi
nal c
apac
ity to
del
iver
hig
h-qu
ality
food
pro
duct
s. If
the
sam
e am
ount
of p
rote
in w
as to
be
prod
uced
by
pigs
, it w
as e
stim
ated
that
this
wou
ld re
quire
290
000
he
ctar
e of
goo
d ag
ricul
tura
l lan
d in
sout
hern
par
ts o
f Sw
eden
or s
omew
here
els
e in
the
EU fo
r gra
in p
rodu
c-tio
n, a
nd 1
30 0
00 h
ecta
re tr
opic
al la
nd fo
r soy
a pr
oduc
-tio
n. T
he n
umbe
r of p
eopl
e w
hose
tota
l pro
tein
nee
ds
coul
d be
satis
fied
by th
e gr
ain
and
soya
pro
duce
d fro
m
thes
e ar
eas s
umm
ed to
14.
1 m
illio
n pe
ople
. H
owev
er. T
he c
ows e
mit
met
hane
, con
tribu
ting
to
glob
al w
arm
ing.
If in
stea
d ta
king
all
cow
s aw
ay, t
he
cont
ribut
ion
tow
ards
a re
duct
ion
of th
e gl
obal
clim
ate
chan
ge, w
ould
sum
to 7
18 m
illio
n kg
, Tha
t im
plie
s a
clim
ate
chan
ge c
ost o
f app
rox
50 k
g C
O2 m
ore,
per
hu
man
life
that
can
be
sust
aine
d th
roug
h in
crea
sed
prod
uctio
n of
hig
h-qu
ality
pro
tein
.5
V
5.
Thi
s an
alys
is is
res
trict
ed to
the
ques
tion
of u
sing
the
land
to m
ilk p
rodu
ctio
n or
not
. In
real
ity, t
he a
ltern
ativ
e of
no
milk
pro
duct
ion
in th
e no
rther
n pa
rts o
f Sw
eden
cou
ld im
ply
that
mos
t of t
he a
gric
ultu
ral l
and
is tr
ansf
orm
ed to
fore
stla
nd. T
hat w
ould
incr
ease
car
bon
sinks
, whi
ch is
pos
itive
. Tha
t is
coun
ter-b
alan
ced
by n
egat
ive
impa
cts
on n
atio
nal l
evel
rela
ted
to n
atio
nal e
nviro
nmen
tal o
bjec
tives
suc
h as
con
serv
atio
n of
cul
tura
l lan
dsca
pe a
nd b
iodi
-ve
rsity
whe
re g
razi
ng c
attle
is a
crit
ical
lim
iting
fact
or in
nor
ther
n Sw
eden
. On
glob
al sc
ale,
incr
ease
d pi
g pr
oduc
tion
incr
ease
s pre
ssur
e on
trop
ical
fore
sts
whe
re th
e cl
imat
e ch
ange
impa
ct p
er k
g m
eat f
rom
pig
s mor
e is
est
imat
ed to
aro
und
230
kg c
arbo
n di
oxid
e, fo
llow
ing
the
feed
ing
ratio
ns in
the
prod
uctio
n br
anch
cal
culi
from
Sw
edis
h U
nive
rsity
of
Agr
icul
tura
l Sci
ence
s fo
r fa
tteni
ng p
igs
the
prod
uctio
n ye
ar 2
007,
the
cont
ent o
f pr
otei
n fe
eds
in p
urch
ased
fe
eds
to fa
tteni
ng p
igs
(Lin
dber
g, 2
008,
per
sona
l com
mun
icat
ion)
, and
the
rout
es o
f cal
cula
ting
the
impa
ct o
f lan
d us
e ch
ange
in tr
opic
al a
reas
of F
AO

24
Issu
es
Syst
em le
vels
D
imen
sion
s M
ater
ial/
met
hod
Foun
d an
swer
s Pa
per
Glo
bal a
rea
of p
astu
rela
nd is
2.5
tim
es th
e ar
ea o
f cr
opla
nd. T
hus,
the
pote
ntia
l to
thro
ugh
rum
inan
ts
utili
se th
ese
area
s, th
at w
ay re
duci
ng th
e pr
essu
re o
n m
ore
prod
uctiv
e cr
opla
nd fo
r foo
d an
d fu
el p
urpo
ses i
s su
bsta
ntia
l. 13
. Wha
t are
the
asso
ciat
ed su
stai
n-ab
ility
effe
cts o
f th
e m
easu
re th
at
rese
arch
que
s-tio
n12.
1 re
late
s to
?
From
feed
ing
effi-
cien
cy p
er k
g m
ilk
prod
uced
to g
loba
l de
man
d of
bio
-en
ergy
and
food
se
curit
y on
glo
bal
leve
l.
Ecol
ogic
al,
ener
getic
, ec
onom
ic a
nd
soci
al.
App
lyin
g th
e sa
me
met
hod
and
data
as u
sed
in 7
, m
odifi
ed to
this
task
.
12.1
show
ed th
at re
-ach
ievi
ng th
e fe
eing
effi
cien
cy o
f 19
91 fr
om th
e lo
wer
leve
l of 1
999
decr
ease
d th
e ap
pro-
pria
tion
of la
nd fo
r a c
onst
ant p
rodu
ctio
n le
vel w
ithin
an
imal
pro
duct
ion.
Rev
enue
s inc
reas
ed. T
hrou
gh a
m
ore
effic
ient
use
of p
rote
in fe
eds,
the
nitro
gen
cont
ent
in m
anur
e de
crea
sed.
All
effe
cts w
ere
subs
tant
ial.
In-
crea
sing
nitr
ogen
effi
cien
cy p
rovi
de b
enef
its in
par
alle
l to
the
ones
repo
rted
in 1
2.1
with
rega
rd to
env
ironm
en-
tal o
bjec
tives
such
as
clim
ate
chan
ge (d
ecre
ased
em
issi
on o
f N2O
) fro
m
man
ure-
hand
ling
decr
ease
d em
issi
ons o
f am
mon
ia c
ontri
butin
g to
eu-
troph
icat
ion
and
acid
ifica
tion
of te
rres
trial
and
wat
er-
ecos
yste
ms
decr
ease
d eu
troph
icat
ion
of su
rrou
ndin
g se
as.
V
(2
006)
. In
anal
yses
of t
he c
limat
e ch
ange
impa
ct o
f rum
inan
ts b
ased
on
life-
cycl
e an
alys
is, t
he is
sue
of re
leva
nt re
fere
nce
valu
es a
re n
orm
ally
not
con
sid-
ered
. Som
e re
sear
cher
s ha
ve p
rovi
ded
resu
lts s
ugge
stin
g th
at th
e to
tal m
etha
ne e
mis
sion
s fro
m th
e m
egaf
auna
on
all c
ontin
ents
bef
ore
thei
r fas
t dec
line,
so
met
imes
ext
inct
ion,
coi
ncid
ing
with
the
arriv
al o
f hum
ans
depe
nden
t on
hunt
ing
and
gath
erin
g m
ight
wel
l be
of th
e sa
me
mag
nitu
de o
f ord
er a
s cu
rren
t to
tal m
etha
ne e
mis
sion
s fro
m f
arm
ani
mal
s an
d w
ild a
nim
als
toge
ther
. Ano
ther
asp
ect i
s th
at th
e sa
me
anal
yses
do
not n
orm
ally
con
side
r ca
rbon
sin
k po
tent
ials
in in
tegr
ated
feed
-rum
inan
t pro
duct
ion
syst
ems,
whi
ch a
re si
gnifi
cant
acc
ordi
on to
FA
O. F
or d
etai
ls, s
ee P
aper
VI.

25
A brief summary of the contributions follows.
3.2 Tool-kit for sustainable development The thesis summarises professional experiences from 25 of August 1982 and onwards. During this course a major ambition has been to develop methods increasing the understanding of land and its importance for humanity. This has resulted in a tool-kit supporting choices that contribute to a sustainable development. The individual tools are
1. A conceptual model of the economic system in its ecological and social contexts, in which natural capital, man-made capital, human capital and social capital are considered, see Paper I and II, and Figure 1.
2. Biophysically Anchored Production Functions (BAPF), where produc-tion value in the economic production process are expressed as a func-tion of inputs of natural capital, man-made capital, human capital, and the environmental impact of the production process through impact on the life-support capacity. Goods and services measured in the adjusted GDP-terms suggested are means to support the maintenance of social capital, see Paper II.
3. A contribution within participatory multi-criteria multi-level analysis for evaluation of how a specified subsystem contributes to a hierarchy of sustainability objectives in the ecological, economic and social dimen-sions from low to high system levels considering typical features of complex systems such as thresholds, resilience, irreversibilities, mutual dependencies between systems and system levels (Paper III).
4. System of ecological economic accounts (EEA) obtained when specify-ing BAPF in time and space, where capital stocks and their changes can be focused, or the flux of economic and ecological goods and services. EEA can be used to measure the performance of any system in ecologi-cal, economic and social terms and in relation to affected systems sus-tainability limits, if sufficient knowledge about them is available. Table 3 and 4 present results from evaluation by means of EEA, where it is shown how the EEA measure contributions to a majority of the 16 na-tional environmental quality objectives in Sweden decided by the Par-liament, as well as to Millennium Development Objectives from the UN. Table 7 gives outcomes on local community, regional and national level. Hellstrand (2003a,b; 2007) used EEA to measure sustainability perfor-mance on regional level. Hellstrand and Yan (2010) in an evalutaion of whether China is an option when Sweden and EU reduces their contribu-tion to climate change.

26
5. A simulation model of animal production systems with supporting crop production where EEA for specified agricultural production subsystems are developed with included biological-economic production functions based on Hellstrand (1988, 1989). The simulation model is a develop-ment of common tools within agricultural sciences used to optimise the use of available resources of land, labour and capital. The simulation model can be used to generate data for further analysis of sustainability performance of animal production systems based on a genuine profes-sional understanding of animal production systems, and of how balanced agricultural production systems shall be constructed where in- and ef-fluxes in biophysical and in monetary terms between systems are con-stant. It is also an example of and suggestion for how on societal level find solutions supporting a sustainable development through the combi-nation of different stocks of capital mentioned in 1. Hellstrand (2009) elaborates on this possibility in connection with an job concerning phys-ical planning for sustainable attractiveness in Gothenburg on behalf of Göteborg Stad. The task was to develop new methods to measure values from agriculture in a landscape dominated by urban and industrial ele-ments utilising the concept of ecosystem services, and then apply them. In this context EEA was used as a means for urban planning for sustain-ability.
3.3 The value of land Paper I examines the value of land on a conceptual level. The relevance of central natural resource concepts in physical resource theory, systems ecolo-gy, nutrition physiology, and economics is probed. By integrating the rele-vance domains of these disciplines, strengths and weaknesses within the disciplines and their resource concepts are identified and broader, more gen-eral natural resource concepts are generated. The conceptual model is con-sistent with the perspectives of sustainable development within systems ecology and ecological economics around 1990, and the perception of sus-tainable development by OECD about ten years later. It harmonises well with the perspective in the Millennium Ecosystem Assessment (MEA 2005) regarding the importance of ecosystems and ecosystem services for human wellbeing, and ways of describing dependencies, often mutual, between so-cioeconomic and ecological systems, and between scales.
The latter follows as Paper I provides the conceptual framework for the other papers. For example, one of the major contributions in Paper III within this frame is the general methodology that is developed relating a specific step in a production system on a low system level and its significance to a hierarchy of sustainability sub-goals in the ecological, economic and social dimensions from a very small to the global scale. This framework ensures

27
that the typical features of systems (given the complexity challenges typical of systems relevant to sustainable development which are difficult to deal with in a formalised methodological manner) are considered, while main-taining the speed and resource (in monetary terms and in terms of intellectu-al power appropriated) efficiency (in monetary and intellectual terms) of the analysis and relevance given the conditions of real world systems.
Paper I expresses the same goal hierarchy regarding sustainability as is expressed in the UN Millennium Development Goals (UN 2008).
The main findings are that:
Exergy, a central resource concept in physical resource theory, is useless as a resource concept, according to its strict definition. It is defined un-der the assumption of thermodynamic ideality. With thermodynamic ideality a flux from system A to system B cannot exist. If anyhow such a flux was possible from A to B, the condition of thermodynamic ideality states that no process where a resource could make a difference can oc-cur in system B. In thermodynamic ideality, all process restrictions de-fining ecological, economic and social sustainability are ignored. Thus, given the conditions in its definition, exergy is a useless resource con-cept.
The result when estimating resource constrains to the global economy by resource concepts in physical resource theory closely related to exergy, suggests that the global economy is infinitesimally small, around 1 part in 10 000 of global natural resource metabolism. Paper I suggests that this result is not a measure of the potential for material growth of the global human economy within the limits of the solar energy flux, but ra-ther a measure of the gap of relevance when measuring environmental resource restrictions by measures that relies on concepts that places e.g. sustainability limits outside the system borders.
Resource concepts relevant to sustainable development can be improved by integrating contributions from systems ecology, economics and nutri-tion physiology.
A comment is needed here. The total supply of primary energy globally in 2008 was 492 EJ6. Global technical potential for renewable energy (RE) is estimated to lie in the range 1 895 to 52 721 EJ7. The estimates of technical
6. EJ = 1018 J. 7. The source for these three estimates is IPCC 2011. Special Report on Renewable Energy Sources and Climate Change Mitigation: Summary for Policymakers. A report of working group III of the IPCC and Technical Summary. Eds: Edenhofer, O., Pichs-Madruga, R: & Y. Sokona. The values are from “Figure SPM.4”. The figure summaries data presented in chap-ters 2–7 in: IPCC. 2012. Renewable Energy Sources and Climate Change Mitigation. Special Report of the Intergovernmental Panel on Climate Change. Eds: Edenhofer, O., Pichs-Madruga, R: & Y. Sokona.

28
potential for RE are thus 3.9 to 107 times the total supply of primary energy. In 2008 it was estimated that RE contributed 12.9% of the total primary en-ergy supply, i.e. 63.5 EJ. Thus, the estimates suggest the potential to increase the supply of RE by a factor of 30 to 830 times the contribution in 2008. To put these figures into perspective, total biomass production in agriculture globally adds up to around 230 EJ chemical energy annually (Paper V) when agricultural land comprises the most productive terrestrial ecosystems, and covers around 38% of global land area.
Without anticipating the rest of the results, Papers II and VI explore weaknesses in analyses of environmental performance focused on the cli-mate impact based on the rationality and relevance provided by engineering sciences on an operative level. Some of the examples evaluated directly af-fect the estimates provided above regarding future RE potentials. On an op-erative level they are shown to suffer from the same problems as the pro-posals in Paper I based on physical resource theory, i.e. the problems of ex-trapolating methods and concepts outside the relevance boundaries where they have been probed. The results in Paper I motivate the following ques-tion: to what degree do the potentials for RE proposed by IPCC reflect real sustainable potentials, and to what degree do they express a gap between the constructed maps of the terrain and the terrain itself, given known properties of the systems concerned within the disciplines that represent the expertise regarding these systems and issues? For example, is it possible that the esti-mates to some extent express the same or similar weaknesses described in Paper I in relation to basic resource concepts in physical resource theory?
I am not stating that there is a problem. The point is to evaluate whether there is a problem or not, through competence that is independent of the competence that generates these estimates. Paper VI demonstrates that the contributions regarding renewable energy from the IPCC rely on contribu-tions from physical resource theory. This issue is therefore not only motivat-ed by principally academic reasons. The importance is stressed by the obvi-ous competition for land use for RE and for food production, and the fact that the first UN Millennium Development Goal concerns global food supply while climate change is one aspect of three in one of four sub-goals in the seventh of a total of eight UN Millennium Development Goals. In total there are 15 aspects of the four sub-goals in the seventh UN Millennium Goal. Thus, the UN through the UN Millennium Development Goals values food production from land higher than RE production. The energy supply for hu-mans is valued higher than the energy supply for machines.
3.4 How to anchor the economy in land A biophysically anchored production function (BAPF) is derived in Paper II from the conceptual model in Paper I. The BAPF is a tool that supports the
29
evaluation of the sustainability performance on a macro-economic-ecological level. The BAPF is used to analyse the welfare costs of forcing an economic system to trespass ecological sustainability limits, focusing the resilience aspect. It supports measures that enhance sustainable development in harmony with the perceptions of sustainable development within systems ecology, ecological economics, OECD, Millennium Ecosystem Assessment, and UN Millennium Development Goals.
The main outcomes are that:
The increase of GDP has historically been closely associated with growth in use of energy in Sweden and in other countries.
The Swedish economy has a lower level of eco-efficiency, measured as GDP obtained per unit energy used, compared to Japan and the EU over the period 1962–1997, and showed a smaller increase in eco-efficiency than Japan, the EU and the USA over the same period.
The major remaining environmental issues are related to energy use (the importance of changed land use was not examined).
Forcing an economy to follow the path of exponential material growth may eventually lead to a situation where the welfare costs increase in a pattern of exponential growth raised to the second power, when ecologi-cal carrying capacity limits are trespassed.
3.5 Sustainability impacts of feeding trends in milk production
Paper III develops a methodology which supports analyses of sustainability impacts of production systems from low to global system levels within the ecological, economic and social dimensions. The perspective in Papers I and II is integrated with a methodological approach in agro-ecology with a basis in complex system theory, supporting sustainable land management strate-gies, and traditional management tools within dairy production sciences and agricultural economics. The system levels covered span from the conditions of rumen microbes in physiological terms to global sustainability impacts due to the skill in managing the complex system comprising feeds, rumen microbes and the dairy cow.
The methodology is used to evaluate the sustainability impacts of the in-crease in use of crop protein feeds by a factor of 2.7 in Swedish milk produc-tion from 1991 to 1999 and the associated increase in the use of purchased feeds. The increased feeding intensity for constant milk production equates to decreased feeding efficiency, i.e. decreased economic efficiency and natu-ral resource efficiency. The major impacts were:

30
Inferior economic results, by 840 million SEK8 in 1999 which corre-sponds to 23% of total payments for labour and capital within the entire agricultural sector.
An increase in national ammonia emissions by 15% compared to the officially reported level.
Reduced global food security capacity by 6.6 million people, as the in-creased amounts of soymeal and other crop protein feeds used in excess of feeding requirements could otherwise have been used to fulfil human nutritive requirements.
It was found that the increase in use of crop protein feeds had not resulted in a greater increase in milk yield than otherwise expected. Nor did changes in price relations between milk price and costs of purchased feeds motivate the increased use of concentrates. The estimate of increased costs for purchased feeds considered the increase in quantities but did not consider the price effect of the substantial increase in the share of the more costly protein feeds in purchased feeds.
Paper III stresses the importance of methods within animal production sciences that formalise the relations between feeds and animals on low sys-tem levels, up to appropriation of natural capital, man-made capital, human capital, and the impact on social capital on a high system level.
3.6 A simulation model of animal production Paper IV presents a simulation model of animal production that meets a ma-jor part of the demand of methods that formalise the relations between feeds and animals on low system levels, up to appropriation of natural capital, man-made capital, human capital, and the impact on social capital on a high system level. The simulation model covers milk and meat production from cattle and pigs, i.e. the majority of animal production in Sweden, as well as of agricultural production.
On the global scale, animal production accounts for 40% of agricultural gross domestic product (GDP). It employs 1.3 billion people and creates livelihoods for one billion of the world’s poor. Animal products provide close to 40% of humanity’s protein intake (Paper VI). On the global scale, ruminants and pigs provided 72% of the feed energy consumed by humans from animal products in 2003, and 52% of the protein consumed from ani-
8. On 1 January 2013, 1 US$ = 6.51 SEK and 1 € = 8.58 SEK, accessed from http://se.rateq.com/ 2013-01-01.

31
mal products9. Of the total area of agricultural land, 70% or more produces feeds for ruminants.
These figures indicate the global need for this type of well probed analyti-cal tool, reflecting the importance of animal production systems as a media-tor in enhancing the capacity to use land for sustainable fulfilment of human needs and desires.
The analytical tools here discussed are the system of ecological economic accounts proposed during the 1950s combined with linear algebra and dif-ferential functions as means to find optimal production designs on farm level taking into consideration the biophysical and socioeconomic context at hand for the individual farm. The ambition was to find the optimal combination and use of land, labour and capital available. These tools are presented by Nanneson et al. (1945), Renborg (1957), Johnsson et al. (1959), Arbrandt (1971), Wiktorsson (1971, 1979), Østergaard (1979), Hellstrand (1988, 1989).
A feeding plan program was developed and integrated with a common management system in agricultural economics, the system of production branch calculus with associated methods to optimise the production on farm level with consideration of available resources of land, labour and capital (SLU 1989a,b; 2006; 2009). This system has its roots in agricultural man-agement systems from the early 20th century in Sweden (Nanneson et al. 1945), as well as in the management systems developed to support the productivity improvement in European agriculture within the Marshall plan that were inspired by the system used to steer the economy of the USA to meet the demands of the Second World War and the civil society (Renborg 1957).
The simulation model formalises the impact of changes at the low physio-logical level on overall system performance. The simulation model is based on mathematical expressions of animals’ nutritive physiological require-ments. All costs in the production branches behind the cattle and the pig production systems are included. In this way, the impact of e.g. increased energy content in forages fed to dairy cows by 1.0 MJ metabolizable energy per kg dry matter on all revenues and costs in a system producing a fixed amount of milk and meat from cattle and pigs can be estimated. This is a quite complex issue, as increased energy content per kg dry matter affects the production of milk per cow as well as the amount of feeds needed for a fixed milk production. Increased production of milk per cow affects the number of cows needed to produce a certain amount of milk. A change in the number of dairy cows affects the amount of meat produced from the stock of dairy cows through cows, heifers and bulls. Thus, it also affects the comple-mentary meat production system. With changes in the structure of the animal
9. Own processing of data from FAOSTAT, http://faostat.fao.org/site/610/DesktopDef-ault.aspx?PageID=610#ancor, accessed 2009-07-16.

32
production in terms of number of animals in different production branches, the structure of supporting crop production systems is affected. The crop production system is also affected through another path; increases in nutri-tive quality per kg dry matter of silage, for example, reduce the amount of feeds needed per kg of milk and meat produced.
Since 1997 I have analysed a huge number of studies related to the envi-ronmental and sustainability profile of animal production systems, especially ruminant and dairy production systems. None of the studies that I have ana-lysed has captured the importance of the skill by which e.g. the physiological requirements of the complex dairy cow rumen ecosystem in interaction with the host animal are considered in the socioeconomic and biophysical context of the farm. As shown by Hellstrand (1988), the skill by which farmers man-age to do precisely this has a major impact on their economic results as well as the natural resource efficiency of their production. I therefore propose that Paper IV fills in a gap in the available methodological toolkit used to im-prove the capacity of land to fulfil human needs in Sweden and internation-ally.
Increased energy value of forages is a major means of improving rumi-nant production. Substantial improvement can be achieved within existing technological solutions, simply by doing things in a more skilful way. To be able to evaluate this potential, tools are needed that capture the causal chains from nutritive values of feeds to overall system performance for integrated animal production systems, including supporting crop production systems. The simulation model captures fluxes in biophysical and monetary terms. It relates to the appropriation of natural capital (renewable and non-renewable), man-made capital such as buildings and machines, and human capital (labour). The products are food items that have a substantial im-portance for the maintenance of social capital in society. By this type of analysis, a platform is provided that supports evaluation of environmental (positive and negative) effects of animal and agricultural production systems (results in Papers III, V and VI are based on this type of analysis) as well as human health impacts. The latter are needed when evaluating cost-efficient policy measures regarding food-mediated human health impacts. Hellstrand and Landner (1998; 2001), Hellstrand and Drake (2008) and Drake and Hell-strand (1998) utilised this approach in an evaluation of social costs related to food intake of cadmium. This had an impact on cadmium policies in Sweden and on the debate in the EU.
The social costs of fractures related to the impact on the skeleton of cad-mium intake through food in Sweden are 4.2 billion SEK annually. Total costs for fracture annually are 39 billion SEK (Kemikalieinspektionen, 2012). One of the major conclusions of this report was that there are large social benefits to be gained by reducing cadmium intake through food. The implementation of cost-efficient policy measures for this task demands the type of analysis of cadmium fluxes and factors affecting human exposure to

33
cadmium in the food system that Hellstrand and others produced (references above). The consistency regarding influxes and effluxes and the general methodological approach in traditional management tools in agriculture dis-cussed above is a prerequisite for this task.
The simulation model supports a mutual evaluation of natural resource and economic efficiency in the production. It fills a gap as a tool that sup-ports the development of ecological, economic and social contributions to a sustainable society from animal production systems generally. The output in production biological and economic terms provides information about im-pact on the appropriation of renewable natural capital, non-renewable natural capital, assimilative capacity, human capital, man-made capital and social capital. For some impacts the effects are shown immediately. For others, the outputs of the model are vital inputs for subsequent analyses of impacts on aspects of the aforementioned stocks of capital, as illustrated in Paper III.
The contextual factors referred to above were common knowledge in ag-ricultural sciences in Sweden during the 20th century up to around 1990/95. However, a major research program with the ambition of supporting sustain-able food production systems (FOOD 21) was initiated in 1997. Together with the changes in feeding standards systems during the 1990s, FOOD 21 was symptomatic of a significant loss of awareness of this perspective, which is discussed in Papers IV and VI. The results imply that there were significant scientific problems with the changes in the feeding standards systems in 1991 and 1995, and that these made a large contribution to the falling sustainability performance of Swedish milk production from 1991 to 1999 as reported in Paper III (see also Section 4). For this reason, the simu-lation model of milk production is based on the feeding standards that were valid until 1990.
The simulation model is applied in an evaluation of one conventional and one ecological production system. The potential for improvements in pro-duction biological and economic terms are analysed in relation to application of good agricultural practice in animal production.
The most important outcomes were:
The simulation model itself.
The identification of weaknesses in the way animal production systems and agricultural systems were treated in engineering-based approaches such as
o a model of the global food system developed within the frame of physical resource theory (Wirsenius 2000; 2003a,b),
o an integrated model of ethanol and milk production in Brazil with major inputs from physical resource theory (Sparovek et al. 2007; Egeskog and Gustafsson 2007), and

34
o LCA studies delivered from the Swedish University of Agricultural Sciences (SUAS) and the FOOD 21 program regarding sustainability in milk production systems (Cederberg and Flysjö 2004; Cederberg et al. 2007; Gunnarsson et al. 2005; Sonesson 2005).
The identification of the deep nutrition physiological problems in Totfor, a program from SUAS that was used to provide production biological and economic data for milk production for Swedish authorities and the milk sector from 1996 onwards.
The results from the comparison of the two production systems, which
o are valuable inputs for further studies of the sustainability profile of animal production systems, and
o inform about potential for improvements in economic results and natural resource efficiency within each system.
3.7 Sustainability impacts of measures in animal production
Paper V evaluates sustainability contributions of three measures in animal production systems based on the contributions in Papers I to IV. The evalu-ated measures are:
1. increased production level per cow on the global scale,
2. increased feeding efficiency in milk production at constant production level, and
3. the importance of utilising ruminants as ruminants, converting biomass from otherwise marginal agro-ecological systems to high quality food.
The major results were
(i) that increased milk production level on the global scale by a factor of 4 up to the current level in Sweden would
reduce energy requirements per kg milk produced from 13.7 to 7.7 MJ metabolizable energy, i.e. by 44%, and
as a result reduce the agricultural land area appropriated for a fixed amount of milk produced globally by 150 million ha, and decrease the appropriation of gross energy by 6.7 EJ10.
(ii) Increased feeding efficiency globally was estimated to
10. EJ = 1018 J.
35
increase the revenues from milk production by approximately 40 billion US$ per year,
reduce nitrogen emissions to air and water by approximately 4 000 mil-lion kg nitrogen per year, and
decrease the pressure on forests in Brazil to produce soya bean meal by approximately 32 million ha or increase global food security through an increased capacity to fulfil human need for protein by 1.3 billion people.
(iii) Utilising the current production area of 400 000 ha in Northern Sweden would support milk production that
provided the total protein supply for 3.7 million people,
released 293 000 ha of good arable land for grain production and 131 000 ha of tropical arable land for soymeal production, that otherwise would have been appropriated to produce the same amount of protein from pigs. The utilisation of 400 000 ha of otherwise marginal agricul-tural land would enable use of 424 000 ha of good agricultural land, and
increased global food security potential by 14.1 million people with re-spect to protein supply (the number of people whose protein require-ments could be supplied if not using up barley and soymeal for the cor-responding pig protein production).
Paper V explores a combined ecological-agricultural-social perspective in the analysis. The ecological, economic and social impacts identified are typ-ically not covered in engineering-based analyses of milk production, as in the references provided above in the presentation of Paper IV.
3.8 Animal production and global sustainability Paper VI analyses the contribution to a global sustainable society of four measures in animal production systems. It provides measures of the signifi-cance of animal production systems in economic, ecological and global food security terms. The most important results in Papers III and V were utilised, together with results from other sources. The impact of consuming 1.7 g less chicken meat per capita and day in developed nations was considered along-side the three measures evaluated in Paper V. The most important additional findings as a result were that:
Reduced consumption of chicken meat would reduce the amount of ap-propriated arable land by 16.0 million ha of which 9.1 million ha was tropical forests, increase global food security potential by 470 million

36
people, or11 as a one-off event12, reduce emissions of climate change gas-es by 5.2 Gt CO2-equivalents.
Increased feeding efficiency at constant milk yields per cow and con-stant total production globally would reduce the appropriation of agricul-tural land by 51 million ha of which 32 million ha are tropical forests, increase global food security by 1.3 billion people, or decrease climate change impact by 22.4 Gt as a one-off event.
Increased feeding efficiency in Swedish milk production from 1999 lev-els to 1991 levels (as reported in Paper III) would reduce discharges of nitrogen to the Baltic Sea by around 6 million kg, while saving the milk producers an estimated 1.21 billion SEK.
The reason for the estimate of savings being 370 million SEK higher than the 840 million SEK estimated in Paper III is that in Paper VI, the impact of the increased quality of the purchased feeds is accounted for and added to the impact of the increased use of purchased feeds.
The eutrophication issue is interesting. As Paper VI shows, it was decided that Swedish national discharges of nitrogen to the Baltic Sea should be re-duced by around 10 million kg more than earlier objectives. Sweden has problems in meeting the current objectives regarding reduced discharges to the Baltic Sea, especially in the south-west of the country. In this context Kattegatt, outside the south-western part of Sweden, is defined as a part of the Baltic Sea. On the margin, the cost for reducing nitrogen discharges is around 1 000 SEK/kg. The set objectives are not being met, and thus the marginal price to fully cope with the objectives is increasing. Here, a previ-ously unidentified measure has been found that through increased nitrogen efficiency in milk production improves farmers’ economic results by 1.21 billion SEK, reduces nitrogen discharges to the Baltic Sea by around 6 mil-lion kg, reduces the contribution to climate change through deforestation in Brazil and through emissions of nitrous gases from manure (due to decreased nitrogen content), and reduces contributions to acidification and eutrophica-tion through ammonia emissions.
Paper VI found that the welfare economic impact of the possible in-creased nitrogen efficiency in Swedish milk production was a net societal gain of 9.8 billion SEK (slightly more than 1 billion €) given the environ-mental preferences of Swedish society. This corresponds well with the value of the total milk production in Sweden, suggesting that the negative external
11. Either tropical forests, that on the margin are appropriated for soymeal production, are converted to agricultural land producing soymeal with the capacity to support human protein requirements, or they remain, thus the contribution to climate change by deforestation is avoided. 12. I use the expression “one-off event” to stress that when forests are cut down, the storage of carbon in wood will eventually be oxidised and released as carbon dioxide.

37
effects of Swedish milk production in 1999 in terms of the aspects discussed here were close to the same size. The welfare value of reduced nitrogen dis-charges of 9.8 billion SEK, corresponds to a negative cost of 1 600 SEK per kg of nitrogen less discharged.
Applied to the global scale, the three measures mentioned (i) reduced the appropriation of agricultural land by 217 million ha of which 41 billion ha were tropical forests; (ii) improved global food security potential by 1.8 bil-lion people (protein supply); (iii) reduced the contribution to global climate change as a one-off event by 27.6 Gt, where the total annual anthropogenic contribution is estimated at 40 Gt. Effects (ii) and (iii) are of the either/or type.
The next part of Paper VI analyses the mechanisms that explain why these potentials were not yet utilised. This knowledge enables measures to be taken that contribute to eliminating current implementation gaps in sus-tainable development, with a focus on animal production systems globally. For this reason, a detailed examination was carried out on the quality of methods and concepts that underpin current
energy standards in milk production,
protein standards in milk production, and
evaluation of sustainability impacts of production systems generally and of agricultural and ruminant production systems specifically.
The results indicate substantial potentials for improved sustainability per-formance on the aggregate level through measures at the low system level, by changing common practice. This is a result of a partly new and more effi-cient methodological approach, whose foundations are presented in Papers I-VI. The combination of the significant potentials and the novelty of the ap-proach motivates further discussion of some important aspects in Section 4, in order to probe the relevance of the results.

38
4 Discussion
This section discusses in detail some of the most critical aspects affecting the relevance of the contributions in Papers I to VI and the thesis.
Papers I and II are relatively straightforward in their approach, content and delivered results. Papers III to VI treat animal production systems in a sustainability context. There is a need to discuss some aspects of the results in more detail. For instance:
Provided the official data from Statistics Sweden, Swedish Board of Agriculture, Eurostat, FAO, and OECD are correct, they suggest sub-stantial sustainability improvement potentials in the dairy production sector in Sweden, the Nordic Countries, the EU, and globally, which in-fluence overall sustainability in ecological, economic and social terms.
Current theoretical foundations for feed evaluation and feeding standards systems for dairy cows in Sweden, the Nordic Countries, and interna-tionally may be a major factor.
Analyses of general sustainability potentials based on engineering sci-ences and systems ecology have identified substantial potentials through measures within agriculture, animal production, and ruminant production systems. Papers I, II, IV, V and VI suggest that the relevance of these analyses may be questionable.
If the relevance is not sufficient when probed against
o known properties of relevant systems within the disciplines in which there is expertise regarding concerned systems and issues,
o traditional scientific criteria regarding e.g. internal logical con-sistency and a sound empirical probing,
there is a risk that advocated measures may in fact harm vital sustaina-bility assets.
Thus, if the logic of these analyses guides real world actions and their relevance is weak as suggested by the results in Papers I–VI, within a time frame of 2–20 years they could severely
o reduce the productivity of global agricultural systems and thus human food supply,

39
o reduce the effectiveness of Swedish environmental policies in-cluding those on climate change from local authority level to con-tributions in international contexts,
o diminish Swedish competitive power given major economic, en-ergetic and environmental trends from local to global level,
o reduce the ecological sustainability basis for urban and industrial systems,
o harm rural development.
Few people are in a position to be aware of these problems, as it would require the capacity to follow causal chains from the level of the physi-ology of rumen microbes to global food security, taking into account so-cioeconomic and biophysical contexts and variations in time and space.
Thus, there is a real risk that actions that are currently being taken to secure sustainable development within, e.g.
o dairy production in Sweden and internationally, or
o biofuel production,
will actually harm the objectives of sustainable development.
This section, on a meta level, treats the importance of complying with tradi-tional scientific quality criteria as one aspect of supporting good quality in societal decision-making processes.
The systems under consideration are complex. The presentation is based on my own understanding of the issues, with all the strengths and weakness-es that this implies. One purpose of this section is to present my perception of the situation with supporting arguments. The most important effect of doing so is the invitation to the reader to address those parts of the presenta-tion that the reader perceives as having the most important flaws. With this exchange of information I can either improve the arguments, or thanks to the feedback adjust and improve the analysis.
4.1 Increasing nitrogen influxes for constant milk production
Papers III and VI imply that the nitrogen influxes to cattle production though purchased feeds in 2006 were 2.5 times higher than in 1991, 48.2 million kg compared to 19.0 million kg. Swedish production of beef and milk was 137 099 and 3 200 000 tonnes respectively in 1991, and 137 404 and 3 172 000 tonnes respectively in 2006. Thus, changes in production did not motivate this increase in nitrogen influxes and nor did the price relations

40
between milk and purchased feeds. Fixed prices for purchased feeds and milk fell by a similar degree from 1991 to 1999, thus the price relation was constant (Paper III). This raises five questions in parallel: 1. Could the changes of the energy standards to dairy cows in Sweden dur-
ing this period (1991–1999) explain these trends?
2. Could the changes of the protein standards to dairy cows in Sweden during this period (1991–1999) explain these trends?
3. Why were these trends not detected in national environmental monitor-ing systems regarding ammonia emissions from and nitrogen balances of the milk production sector?
4. Why were these trends not detected in the research regarding sustainable food production at that time?
5. What is the international relevance of the Swedish case?
These questions are discussed in the following paragraphs. Without antici-pating the results from this discussion, the answer to 4 generates a sixth question:
6. Are engineering-based approaches intended to support sustainable de-velopment counterproductive, due to their limited capacity to detect the ecological, economic, and social process restrictions that define sustain-ability limits and opportunities?
While questions 1–5 focus on the animal production level, addressed in Pa-pers III to VI, question 6 has a more general relevance for sustainable devel-opment, and thus applies for all papers in the thesis.
Paper VI was accepted in October 2012. Questions 1–5 were not dis-cussed in detail in the submitted version. Rightly, one of the reviewers strongly criticised this omission, as the submitted version did not present sufficient arguments to support the conclusions. Thus, the final revision was rewritten in the first weeks of October 2012 to provide some of the answers to questions 1–5. I am aware that the following paragraphs repeat some of the information in Paper VI. There are five reasons for deciding to do so:
1. The information in this section and in Paper VI is complementary in parts.
2. If the analyses in Papers I–VI are mainly correct, they imply that only by improving the way in which the feeding requirements of dairy cows are estimated globally and then feeding the cows in accordance with the re-sults can major ecological, economic and social sustainability improve-ments be achieved globally (see Table 1 and Paper VI).

41
3. If the analyses in Papers I–VI are mainly correct, then there are major problems, for instance in the climate change policy from regional level in Sweden, through national to the IPCC level, that ultimately risk global food security (Paper VI).
4. This is new knowledge that is not yet available in national and interna-tional policy contexts.
5. Before major changes in important policies are made, new proposals should be scrutinised; with this presentation I invite readers to do their best to show that the presented analysis is false.
Regarding 2, examples of contributions to sustainability are improvements in the capacity to support human protein requirements corresponding to 1.3 billion people, or reducing the global land area for soymeal production by 32 million ha, i.e. close to half the total global area for soymeal production (FAO 2006).
Regarding 5, this forms part of a relevance test of scientific contributions that aim to support sustainable development. This kind of transparency is needed due to the complexity of the issue.
4.2 Energy standards to dairy cows This section is mainly an extraction of Paper VI and a draft of a longer report from which Paper VI is extracted. As most readers of the thesis are not ex-perts in animal nutrition and animal production theory, major issues in the scientific basis of current energy standard systems in Sweden and interna-tionally are outlined below, followed by a more detailed discussion of some of the most important aspects. This is because these issues have a major in-fluence on the natural resource efficiency in the major animal production branch in Sweden (Paper IV) and globally (Paper VI), and that there may be major problems with current systems in Sweden, Denmark, and the USA (Paper VI). Furthermore, this is one area where there are critical problems with engineering-based approaches in the analysis of sustainability of animal production systems when compared to known properties of the systems stud-ied. This discussion also serves as preparation for an analysis of the rele-vance of the way in which animal production systems have been treated in some engineering approaches discussed in Section 4.7.
The first question is the accuracy of how metabolism of ruminants is pre-sented. Problems in this field imply sustainability costs in ecological, eco-nomic and social terms. Here lies a paradox. The higher the identified costs the better, as past flaws imply future options for savings.

42
Since 1995 energy standards to dairy cows in Sweden have been based on the objective that they predict yield from feed intake on the commercial herd level. Paper VI and the underpinning report show that this is flawed as:
The aim on the commercial herd level is to achieve a good economic result. This happens when the marginal cost for feeds equals the margin-al income from milk.
On the commercial herd level, both feed intake and milk yield depend on the sum of the quality of the management, in terms of the degree to which it allows the herd to express its full genetic capacity for milk pro-duction. This is closely related to Liebig´s “Law” of the minimum con-cerning the first limiting factor for production in biological systems, and Shelford’s “Law” of tolerance (Paper VI). The effect is that the apparent (not true) relation between feed intake and yield among commercial herds is linear.
The statistical method applied introduces problems. Regression analysis was applied on trial averages of milk yield and feed intake where
o in many trials the cows had free access to high quality forages13,
o none of the trials were designed to provide information about the response curve to increasing feeding intensity
Consequently,
o feeding levels above economic optima in feeding trials were trans-formed to general feeding standards to be applied to commercial herds, steering the feeding levels of basically all herds in Sweden to excessive feeding rations considering economic and environ-mental impacts,
o pure chance decided the values for maintenance and milk produc-tion requirements; this was a function of the trials that were se-lected for the meta-analysis, where there was no obvious guiding principle for the selection process.
13. As an example; in the probing of the relevance of different feeding standard and evalua-tion systems for the new Nordic Norfor system, trial 16 (of a total of 26) had an average intake of forages of 10.0 kg dry matter for a production of 3 kg ECM. With average forage quality, this implies an energy allowance of 9.6 MJ ME (Metabolizable Energy) per kg milk, where the official standard in Sweden since 1995 is 5.55 (Spörndly 1995), and before 1995 it was 5.0 (Hellstrand 1989; Spörndly 1989). This raises the question of whether it is reasonable that such a trial, with such a significant average deviation from commercial production condi-tions, is used as a criteria by which the relevance of different energy standard systems are probed (see Table 4.1.b in Norfor 2004). A consequence is that this trial will steer the Norfor system to feeding intensities above the economic optimal level.

43
The reason given for the change of the energy standard, that the relation between feed intake and milk output is curvilinear, was not addressed by the measure taken; one linear relation was replaced with another. This indicates that the combined physiological, mathematical, logical and sta-tistical competence applied was not sufficient.
A new physiological principle was introduced. For lactating cows, the maintenance needs were now assumed to be a function of the life-weight and an added constant, -13.6 MJ14. Previously, it was only a function of the life-weight. No reason was given for the introduction of this princi-pally new physiological approach.
The work was performed at too low a scientific level. Energy standards to dairy cows are among the most important relations in agriculture from combined economic, natural resource, environmental and social sustain-ability perspectives. The sustainability impacts of increased feeding in-tensity reported in Paper III express precisely this point. The fundamen-tal change regarding the guiding principle in 1995 was based on a stu-dent’s work that contained substantial internal inconsistencies15 (Paper VI and supporting report).
During most of the 20th century, the feeding standards regarding energy al-lowances in milk production in Sweden were based on three ruling princi-ples:
The purpose is to support a feeding intensity that maximises the econom-ic result at commercial farm level;
Based on this, the law of diminishing returns was utilised to arrive at the average energy allowance per kg milk where the value of a marginal in-crease in milk yield is equal to the feeding costs that produce it;
On commercial herd level, the apparent relation (not a true one) between milk yield and feeding levels is constant.
The last point is explained by Liebig’s “Law” of the minimum (Liebig 1840) and Shelford’s “Law” of tolerance (Shelford 1913). Together, these early contributions present the chemical, physiological, biological and ecological foundations for relations behind the concept of resilience later introduced..
When the quality of the total environment of the animal is enhanced, the capacity of the cow to utilise her production capacity increases. When this happens both milk yield and feeds consumed increase. Both yield and feed intake are in this situation dependent factors and the quality of the total envi-
14. This implies an assumption that very small cows have no maintenance requirement. 15. This is not a critique of the work of the student. The issue is whether a student’s work should have this much influence on national feeding standards to dairy cows.

44
ronment is the independent factor. This explains why in nations like Sweden where the use of artificial insemination is widespread, and the genetic capac-ity of cows in all herds is therefore similar, production can vary by a factor of 2 between herds, while the amount of feeds for production of a kg of milk is constant.
The methodological approach to achieve feeding standards that conform to these rules involved long-term production trials (three years) in which the feeding intensity was varied while all other factors were held constant. By doing so, the marginal response to increasing feeding intensity was estimat-ed.
This perspective was expressed and supported by contributions from Nanneson et al. (1945), Wiktorsson (1971, 1979), Arbrandt (1971), Østergaard (1979), Hellstrand (1989) and Spörndly (1989, 1991, 1993).
In 1995 the guiding principles in the energy standards system in Sweden were fundamentally changed (see Andresen 1994, Spörndly 1995). With this change it was assumed that:
Energy standards would predict milk yield from energy intake.
Due to the law of diminishing returns16 high yielding cows are assumed to request more feeds per kg milk produced, consequently on average the energy requirement for milk production per kg milk is higher in high-yielding commercial herds.
The relationship between milk yield and amount of feeds consumed is curvilinear on both individual cow level and among commercial herds.
It is noteworthy that the production economic aspects were no longer con-sidered (see Andresen 1994, Spörndly 1995).
Figure 3 illustrates the curvilinear relationship between feed intake and milk yield on the individual cow level in trials where variations in factors other than the feeding intensity are minimised.
The figure shows diminishing returns at individual cow level with in-creasing feeding levels, when all other factors are held constant.
16. Expressed in physiological terms as lower utilisation of nutrients per kg feed consumed at higher production levels, as every kg of feed then passes through the digestion tract more quickly, as more feed is processed per time unit, and thus the time for digestion processes per kg is decreased.

45
Figure 3. The principal relation between energy intake for milk production in
MJ Metabolizable Energy (MJ ME, x-axis) and milk output in kg ECM (y-axis), assuming a curvilinear relation of the fourth order. Adapted to the marginal output in Wiktorsson (1971) as interpreted by Hellstrand (1989).
The significance of Figure 3 for commercial feeding is in the challenge to find the average feeding intensity that causes the maximal result, i.e. where the value of a marginal increase in production exactly matches the costs for the marginal increase in feeds causing it. For many decades this was the ruling principle for feeding standards in Sweden (see Nanneson et al. 1945; Hellstrand 1989), but it was abolished in 1995 (Andresen 1994; Spörndly 1995). The basic principles discussed, ruled during the major parts of the 20th century in Swedish dairy science, based on theoretical and empirical supporting evidence. It is surprising that these principles so easily were withdrawn with that level of scientific justification.
It is notable that in Swedish crop production science, the same principal approach using dose-response in biological-economic production systems is still used to recommend fertiliser application rates in response to varying market prices (Jordbruksverket 2008a). It is also noteworthy that when the approach regarding energy standards was changed to the present Norfor sys-tem, a mutual Nordic17 system for feed evaluation and feeding standards, Danish researchers reacted as though it was no longer possible to identify the feeding intensity that maximised the economic result on the commercial herd level utilising the combination of the “laws” of diminishing returns, first
17. Except Finland.
Y = 0.487X -0.00278X2 + 0.00000780X3 - 0.00000000905X4; Y = kg ECM, X = MJ for
milkproduction; based on Wiktorsson 1971 and Hellstrand 1989
0,0
5,0
10,0
15,0
20,0
25,0
30,0
35,0
40,0
0 50 100 150 200 250
4.0 MJ5.0 MJ6.25 MJPredicted

46
limiting factor, and of tolerance18. This resulted in a longer report that led to a Scandinavian research program with the aim of correcting for this limita-tion - see Østergaard et al. (2009) for the report.
Figure 4 shows the relation between energy intake, milk yield and eco-nomic results among commercial farms in Sweden for five different years.
Figure 4. Average yield and economic result in RAM, measured as payments
for milk – costs for feeds, per cow and year for herds with different feeding energy intensities, for 1985, 1989, 1990, 1993, 1994. Source: SHS (1986, 1991, 1994, 1995).
Figure 4 present results from RAM. RAM is an acronym for ResultatAnalys i Mjölkproduktion, i. e. Result-Analysis in Milk Production. It was a tool offered to dairy farmers to analyse the production biological and economic efficiency. From 1984 to 1986 I was responsible for that system with about 30-35 farmers as customers. A substantial part of Hellstrand (1988) is a syn-thesis of these experiences.
At commercial herd level, with increasing energy intensity per kg milk (i.e., amount of feeds consumed per kg milk produced), the production level and the economic result per cow decreases at a certain point. Thus, the feed-ing intensity that results in the highest milk production for the five years investigated was in the range 4.4–5.6 MJ per kg ECM. The highest economic result per cow was achieved at a feeding intensity in the range 4.4–4.8 MJ ME per kg ECM. 18. Shelford´s “Law” of tolerance is not commonly known within agricultural sciences. I propose that the way the “Law” of first limiting factor is handled, e.g. in Wiktorsson (1979) and Hellstrand (1988), it actually represents an integration of the contributions of Liebig and Shelford.
0
2 000
4 000
6 000
8 000
10 000
12 000
14 000
16 000
4,00 4,50 5,00 5,50 6,00 6,50
Econ
omic
resu
lt in
SEK
per
cow
and
yea
r, al
tern
ativ
ely
yiel
d in
kg E
CM
per c
ow a
nd y
ear
Energy-intensity, MJ per kg FCM/ECM
Economic result in SEK per cow and year as milk incomes minus feed costs, and yield kg ECM per cow and year, respectively, as function of the energy-intensity in MJ per kg ECM at herds within
RAM, different years
Econ result 85
Econ result 89
Econ result 90
Econ result 93
Econ result 94
Yield 85
Yield 89
Yield 90
Yield 93
Yield 94
47
Figure 4 supports three important arguments that bring into question the relevance of the guiding principles behind the change in energy standards in Sweden in 1995:
1. Among commercial herds, the amount of energy for milk production per kg milk is not always higher in high-yielding farms than in low-yielding farms.
2. The farms with highest production levels reported energy intakes per kg milk produced that was centred around 5.0 MJ ME per kg milk (ECM), i.e. the energy standard that operated until 1995.
3. In commercial farms, the primary objective of milk production is not to maximise milk production per cow but to achieve a high and durable economic result in relation to inputs of own labour and capital. Figure 4 clearly shows that farms with the best economic result per cow operated at an energy intensity equal to or below the official energy standard at the time.
Figure 4 provides empirical arguments that suggest that the ruling principles behind the changed energy standards for dairy cows in Sweden in 1995 should be rejected, and that the previous ruling principle was still valid. Fig-ure 4 suggests that in the construction of the new energy standard system, a relation between feeds consumed and milk yield on the individual cow level, when all other factors were held constant (Figure 3), was mistakenly used to describe the relation between average milk yield and feed consumption be-tween commercial herds with different production levels. If so, the changed ruling principle for the energy standard showed a decreasing understanding of the complexity of the milk producing dairy cow in commercial herds.

48
Figure 5 shows the relation between milk yield and economic result measured as revenues for milk minus feeding costs among commercial herds in Sweden for eight different years. The yield at herd level accounted for all of the variation in economic results. The relation between feed intake and economic result is completely linear, as the data that Figure 5 is based on are standardised prices for feeds and milk, which support this type of compari-son. Thus, Figure 5 shows an apparent linear relation between feed intake and yield at commercial farm level.
Figure 5. The relation between milk yield and economic result as milk incomes
minus feeding costs on herd level. The regression function for the trend each year is presented to the left in Figure 5, with the function for 1985 at the top and for 1997 at the bottom. Source: Own calculations based on SHS (1986, 1991, 1994, 1995; re-sults for 1992, 1995, 1996, 1997 are based on internal material which the author obtained from SHS).
The reason that the relation is apparent is that both are a function of a third factor, the total environment of the cow (excluding feed intake). Figure 5 provides strong arguments that Liebig’s “Law” of the minimum and Shelford´s “Law” of tolerance are valid at the commercial herd level. This results in an “apparently” linear relation between feed intake and milk yield. Figure 5 points towards the double challenge of commercial milk produc-tion: to simultaneously optimise the total environment of the dairy cow and provide the amount of feeds of the right quality that optimises the economic return taking into account the principle of diminishing returns.
The reason to call this relation “apparently” is that when comparing aver-ages of milk production and feed intake between farms, which is what Figure
y = 1,8243x - 3410,5R² = 0,999
y = 1,9883x - 2311,9R² = 0,9989
y = 2,1244x - 2769,6R² = 0,9954
y = 1,7622x - 1082,8R² = 0,9989
y = 1,8985x - 1997R² = 0,9991
y = 1,8001x - 1753,8R² = 0,9957
y = 1,8847x - 1915,2R² = 0,9998
y = 1,962x - 2569,9R² = 0,9985
0
2 000
4 000
6 000
8 000
10 000
12 000
14 000
16 000
18 000
20 000
0 2 000 4 000 6 000 8 000 10 000 12 000
SEK
per c
ow
ECM at herd-level
Economic result in SEK per cow and year at herd level as incomes from milk minus costs for feeds (farm-specific prices) as function of milk yield per cow different production years; number of farms varied between 271 and 1 077
within years
1985
1990
1992
1993
1994
1995
1996
1997
Linjär (1985)
Linjär (1990)
Linjär (1992)
Linjär (1993)
Linjär (1994)
Linjär (1995)
Linjär (1996)
Linjär (1997)

49
5 actually does, it is not so that the difference between farms regarding aver-age milk production is because they differ in the feed rations. The difference relate to the capacity to provide a good environment for the dairy cows. When this environment is good, the milk production of the cows is closer to their genetic capacity. Then they milk more and eat more. The underlying independent factor “environment for milk production” affects the dependent variables milk production and feed intake. In this situation they are inde-pendent of each others. The result is an “apparent” linear relation between milk production and feed intake.
The situation here described is hard for the human mind to understand. It contradicts what as intuitively appears as quite a simple system to under-stand. The reason is that when discussing commercial milk production the number of feed-back loops to understand, and subsequently the degree of self-reference is substantially higher than when performing controlled feed-ing trials.
I suggest that Andresen (1994), NRC (2001) and Norfor (2004) have not understand the difference between the real curvilinear relation between feed intake and milk production in controlled trials, and the “apparent” linear relation when comparing average feed intake and milk production between commercial herds.
During most of the 20th century until 1995 the combination of the law of diminishing returns and Liebig´s law of the minimum provided the founda-tion for the official energy standard system in Sweden (see Nanneson et al. 1945; Wiktorsson 1971, 1979; Arbrandt 1971; Østergaard 1979; Hellstrand 1989; Spörndly 1989, 1991, 1993) and the basis for the official nitrogen application recommendations (Jordbruksverket 2008a). Why Sweden now applies two fundamentally contradictory approaches to basically the same issue in plant production and milk production is unclear. Figure 5 provides strong empirical evidence that the assumption of a curvilinear relation be-tween feed intake and milk yield at commercial herd level in milk produc-tion is false.
The changed ruling principles behind the energy standards in 1995 re-duced the feeding efficiency in Swedish milk production through two paths:
1. The adjusted energy standards increased the amount of concentrate ra-tions at high production levels.
2. The disconnect between economic efficiency and feeding standards communicated on false grounds to farmers that the task was no longer to feed their cows economically optimal amounts of feeds.
The basic argument for the change of energy standards was that due to a curvilinear relation (Figure 3) between feed intake and milk yield, on the margin more feed was required per kg milk at high production levels than at low production levels. However, the enforced change implied that the energy

50
requirement in MJ ME estimated by the older system for milk production and for maintenance was multiplied by 1.11, reducing the result by 13.6 MJ ME (Spörndly 1995). Thus, in order to create a curvilinear relation, a linear relation was transformed by multiplication and subtraction of constants, i.e. the linear relation was replaced by another linear relation. This characterises the lack of logical consistency behind current Swedish feeding standards to dairy cows. A mathematical expression of the relationship between feed intake and milk production was sought based on a false assumption regard-ing the physiology of milk production at commercial herd level. The statisti-cal method applied resulted in the rejected mathematical expression being replaced by another expression of exactly the same form.
This mistake has remained unrecognised by the organisations and experts in charge since 1995.
Against this background, it is not surprising that the major changes in the energy and protein standard systems (see next section) in Sweden during the 1990s contributed to a 2.7-fold increase in the use of crop protein feeds to cattle between 1991 and 1999 as reported in Paper III (see also Paper VI).
These findings are of fundamental importance for the issue of increasing the sustainability of global milk production. Feeding standards in the USA, Denmark and the Netherlands (Paper VI) are based on the same logic as the one behind Swedish feeding standards since 1995. The governing assump-tion is that at high production levels in commercial herds the demand on feeds per additional kg milk is higher than in herds with lower production levels. The curvilinear relation from controlled dose-response trials at indi-vidual cow level (Figure 3) provides the results that form the basis of the energy standards that are applied at commercial herd level.
Figure 6 shows this relation as it relates to the USA standards. It is based on the relations in NRC (2001) regarding the energy content in feeds and energy requirements of the dairy cow.

51
Figure 6. Estimated production capacity at different energy supply levels
according to NRC (2001) with and without correction for decreas-ing utilisation of nutrients in the feeds at increasing consumption level; assuming a live weight of 680 kg, no gestation, and no weight changes. Digestible Nutrients are 77% of feeds.
NRC (2001) assumes decreasing capacity of cows to utilise nutrients in feeds at higher production levels, i.e. at higher feed consumption levels. A con-sumption of 200 MJ ME above maintenance requirements would, according to the pre-1995 Swedish standards, support production of 40 kg milk (ECM). The NRC system gives a similar result before correcting for an assumed decreased utilisation rate at high consumption levels. After the correction is applied, the NRC system suggests that the same amount of feed would sup-port less than 35 kg milk. The consequence is that at these production levels, the NRC system estimates that the cows need an additional 3–4 kg of con-centrates per day, compared to the pre-1995 Swedish system. This difference can be converted directly to increased sustainability costs ecologically, eco-nomically and socially as shown by Hellstrand (2006). The results in Figure 6 are in agreement with Huhtanen and Hristov (2009), who found in a com-parison of feeding trials between North America and Western Europe, that the average feeding intensity per kg milk was higher in North America for the same production. They interpreted this as an expression of different cus-toms regarding feeding at commercial herd level in North America and Western Europe,
Figure 7 shows the corresponding curves for Denmark, Norway and Swe-den based on Norfor (2004; p. 51), which gives the relations that predict
Estimated production kg ECM
-5,0
0,0
5,0
10,0
15,0
20,0
25,0
30,0
35,0
40,0
45,0
0 50 100 150 200 250
ME, MJ, for production
Kg
ECM
ECM, no correctionECM, correctionSwedish standards 1991

52
milk production from energy intake according to Danish, Norwegian, and Swedish feeding standards at the time.
The assumed live weight is 600 kg, and barley is used as “currency” when converting the different energy qualities used in the Swedish, Danish and Norwegian energy standard systems to the same energy base.
Figure 7. Production levels in kg milk (ECM) per cow and day predicted from
energy intake according to feeding standards in Denmark, Norway and Sweden. Assumed annual production level is in the interval 7 500 to 10 000 kg milk (ECM) per cow.
The Danish feeding standard implies that milk yield peaks at a consumption of 24.4 kg dry matter (DM), with a predicted production of 37.2 kg ECM, whereas using the Swedish feeding standard as described by Hellstrand (1989) (“ECM, Swedish standards, –1994” in Figure 7), predicted produc-tion would be 52 kg ECM.
Note that the dry matter intake here is related to an energy concentration of 13.2 MJ ME per kg dry matter, as in barley. This is higher than common energy concentrations at commercial herd level, where roughly half of the dry matter intake is forage and half is concentrate. However, the principal point is not affected. The consequence for feeding on commercial herd level is that if using the Danish approach, a substantially lower feeding efficiency is assumed at production levels of 35 kg ECM and above. The Danish sys-tem gives a similar outcome as the NRC system (Figure 6). ME on the X-axis in Figure 6 relates to energy for milk production after maintenance re-quirements are met, while in Figure 7 it relates to the total energy intake.
The consequences from a sustainability perspective are that the NRC standard in the USA and the Danish feeding standard for herds with high
Milk yield predicted from energy intake according to Danish, Norwegian, and Swedish (current and earlier) feeding standards; production level 7
500 -
-10,0
0,0
10,0
20,0
30,0
40,0
50,0
60,0
0,0 50,0 100,0 150,0 200,0 250,0 300,0 350,0 400,0
Feed intake in MJ ME per cow and day
Pre
dict
ed m
ilk
yiel
d in
kg
ECM
per
cow
an
d da
y
ECM, Danish standardsECM, Norwegian standardsECM, Swedish standards, -1994ECM, Swedish standards 1995-

53
production levels recommend substantially higher feed rations per kg milk produced compared to herds with lower production level. The reason is that they have mistaken an apparent linear relation between feed intake and milk production between herds with different average production levels, with the real curvilinear relation on individual level in controlled trials when other factors are hold constant, without realising that these are two fundamentally different situations as a function of different contexts.
This causes the kind of unnecessary ecological, economic and social costs that emerged in Swedish milk production from 1991 to 1999 due to in-creased concentrate intensities as reported in Paper III.
Andresen (1994) compared the outcome of different energy standard sys-tems. While the Danish system underestimated the production capacity by 6.8 kg milk, the system from the Netherlands underestimated the production capacity by 3.9 kg milk. This implies that on real high-yielding farms, these cows would be fed around 3 and 2 kg concentrates more per day during a long part of the lactation period respectively. The Netherlands also had a system that presumed that a curvilinear relation was preferable in energy standards for commercial herds.
Figure 8 shows the results of four different applications of the same basic assumptions and analytical approach in the statistical analysis as the one that governed the changed energy standards in Sweden post-1995. The difference between these examples is the selection of data on which essentially the same methodology is applied. If based on good science, the results should be reproducible and the influence of randomness would be minimised. Figure 8 shows a significant variation in the estimates of energy requirements for maintenance needs and milk production when applying the same methodolo-gy on different datasets.
Regarding Norfor, the results are based on the assumption that the energy content of concentrates was 13.5 MJ per kg dry matter, and 10.5 MJ per kg dry matter for forages, and that the cows weighed 600 kg. A regression be-tween production of milk in ECM and energy intake was done, based on the averages for these parameters in the investigated trials. The source for the data used is Norfor (2004). At a 20 kg ECM production level, the Norfor system gives an input of 5.75 MJ ME per kg ECM (15/20) (Figure 8), at 30 kg ECM the input is 5.9 MJ ME per kg ECM, at 40 and 50 kg ECM it is 6.0 MJ ME per kg ECM. This is what as would be expected from the feeding intensities in the trials that were chosen to probe the method when evaluating the relevance of different systems of feeding standards when constructing the NorFor system. A common denominator of these trials was that none was constructed with the purpose of finding the economic optimal and/or natural resource optimal feeding level. These two optimal levels are the same when adding external effects such as higher emissions per kg milk and higher ap-propriation of tropical forests per kg milk at the margin at higher feeding intensities, i.e. lower feeding efficiency per kg milk.

54
The consequence when taking a societal perspective is that the optimal feeding intensity decreases when considering negative environmental exter-nalities.
When considering the variation in the total environmental and human health load for different locations, consideration of external effects will ap-ply pressure for a structural redistribution of animal production from areas with high concentrations of humans and animal production to areas where the load is lower and more environmental space is available, see Figures 12 and 13 and the associated discussion. Stokstad (2014) elaborated on this issue, and Hellstrand commented on this contribution19.
Hellstrand (1989) made a major revision of the official Swedish feedstuff table and feeding standards for ruminants. The feeding standards were pre-sented as equations when possible.
The lines in Figure 8 show the difference between the energy require-ments at different yields using the same statistical method described by (An-dresen 1994) and the pre-1995 method (Hellstrand 1989). These alternatives were used in the search for the correct feeding standards with respect to en-ergy.
Figure 8. The difference between the alternative energy feeding standards
and the one of Hellstrand (1989). Source: Own calculations based on Andresen (1994), Berg and Thuen (1991), Norfor (2004) and Salomonsson et al. (2003).
19. See http://comments.sciencemag.org/content/10.1126/science.343.6168.238#comments, accessed 2014-02-15.
-60
-40
-20
0
20
40
60
80
100
120
0 10 20 30 40 50Berg and Thuen -51 -22 8 37 67 96Andresen -7 -1 4 10 15 21Salomosson 65 54 44 33 23 12NORFOR -9 3 15 27 39 51
MJ M
E pe
r cow
and
day
Kg ECM per cow and day
Energy requirement per day at different production levels as difference to Hellstrand assumed live-weight 600 kg

55
Hellstrand (1989) provides the background with commentaries and refer-ences to the original sources to a new official table of feedstuffs in Sweden for ruminants, including feeding standards. As far as possible the require-ments for different physiological functions are given as mathematical ex-pressions. This is the latest official report from the Swedish University of Agricultural Sciences that treat feeding standards to milk production, where the ruling principle is to arrive at that average amount of energy per kg milk produced that precisely results at that output of milk at the margin, which value equals the cost for the marginal increase in feeds applied. The point that Figure 8 makes is that in four examples where the same basic assumption for the purpose of feedings standards are
assumed; that the overall objective is to predict milk yield as a function of feed intake, and where
the feeding standard that shall generate this answer is calibrated against average milk yields and feed intakes, respectively, in different trials connected by two common factors;
o none is designed to capture actual marginal output of milk at a marginal increase in feed-intake
o on average, the consumption of feeds are above the level that gives maximal net economic result, as in most trials the cows have free access to feeds of good quality;
the resulting feeding standard results in feeding intensities that on the aver-age are above the level that is economically motivated; with a huge variation in whether the greatest gap compared to Hellstrand (1989) is at low or high production level.
Thus, on average this approach results in lower feeding efficiency in natu-ral resource terms, higher levels of feeds per kg milk produced; and the re-sult to a substantial degree expressed a random factor introduced when pick-ing trials to calibrate with.
As a result, due to these circumstances, there are significant variations be-tween the different studies with respect to energy requirements for mainte-nance purposes and for milk production. Pure chance determines the results with respect to energy requirements for maintenance and production. There is insufficient understanding of real causal chains in the considered systems. Figure 8 suggests that the statistical approach used to achieve the numerical values of the variables in the energy standards in Sweden post-1995 is incor-rect.
From the information in Figures 3 to 8 the following can be concluded.
The scientific basis for the changes in the foundations of Swedish energy standards for dairy cows in 1995 applied to commercial herds is weak.

56
The changes have reduced the feeding efficiency, thus partly explaining the increase in sustainability costs reported in Papers III and VI between 1991 and 1999 (and 2006) due to increased concentrate intensities in Swedish milk production.
The Swedish trend is towards a lower feeding efficiency which is com-mon internationally.
Other nations have similar problems, where there are indications that the level of sustainability costs are higher in nations such as the USA, Den-mark, and the Netherlands, than currently in Sweden.
The relevance of the pre-1994 ruling principles and the way they were interpreted with respect to the law of diminishing returns, Liebig’s “Law” of the minimum, Shelford´s “Law” of tolerance, and how to set up trials and analyse them statistically in order to support economically and natural resource-efficient feeding strategies is supported.
In a Scandinavian context, the results are concerning. There are indica-tions that the feeding standard system Norfor recently introduced in Denmark, Iceland, Norway and Sweden will contradict national efforts to increase the economic and environmental efficiency of milk produc-tion. This needs to be investigated further by independent and competent researchers.
Figures 3 to 8 provide empirical evidence that suggests that the ruling prin-ciples for the fundamental change of energy feeding standards in Sweden in 1995 should be rejected, while they support the relevance of the principles that were accepted until 1995. They question the relevance of the ruling principles behind the NRC system in USA, and the Norfor system now in-troduced in the Nordic countries, excluding Finland. The magnitude of the results is such that it supports the conclusion that as a first estimate, the in-crease in sustainability costs in Swedish milk production from 1991 to 1999 can be used as a measure of the potential for sustainability improvements through increased feeding efficiency at constant production levels per cow globally.
The model for analysis of production biological and economic perfor-mance presented by Hellstrand (1988) was applied at five farms in 2012-2013. The results are interesting. According to reports from the farmers they have increased their eco-nomic results by an average of 3 500 SEK per cow and year (Table 2).

57
Table 2. Economic outcomes at five dairy farms applying a model for evalua-tion of production biological and economic performance (Hell-strand, 1988) in 2012/2013, based on information from the farmers (Hellstrand, 2014).
Improved economic result, SEK per year
Total Aspect
Farm Per cow Per herd Production
Purchased feeds
Age first calving
A 3 936 551 000 193 000 197 000 161 000 Con
B 3 060 404 000
404 000
Eco
C 7 950 349 800 349 800
Eco
D 2 375 166 250
166 250
Eco
E 0 0 -107 310 122 640
Eco
Average 3 470
Half of the impact was due to increased feeding efficiency, by reducing the feeding intensity by around 0.5 MJ ME (through decreased rations of pur-chased feeds) per kg milk. On average, the feeding rations suggested by the Norfor system corresponded to an allowance of 6.2 MJ ME per kg milk (ECM) (Hellstrand 2014).
A system of ecological economic accounts called Hellstrandmetoden® has been generated from the toolkit supporting sustainable development presented in this thesis, and has been applied in a number of tasks in ad-vanced consultancy. Table 3 shows the results when applied to farm D to estimate some important aspects of its sustainability performance in 2012. Table 4 shows the result of the increased feeding efficiency through de-creased amount of purchased feeds (Table 2).

58
Table 3. Ecological economic accounts Höglunda gård (2012) Source: Hellstrand (2014).
Aspect Value Social
Food security Protein supply, total yearly requirement, no of people 1 210
Landscape with aesthetical and recreational values, SEK 430 000 Ecological
Resource Food security, see above Forest biomass, tonne 905
Energy, MWh energy captured in forests minus own consumption 4 170 Uranium, kg (through use of electricity) -0,28 Biodiversity
Sustains a landscape formed by thousands of years of pasture, ha 184 Assimilative capacity
Carbon dioxide equivalents, tonne 1 600 Carbon dioxide equivalents, value for society, SEK 2 453 000 Water, kg nitrogen 1 210 Water, value of purification of nitrogen, SEK 300 000 Release of oxygen , tonne 1 200 Economy
Contribution to GDP, SEK Without value of ecosystem services 1 188 000
With value of ecosystem services (assimilative capacity) 3 979 000 Employments
Based on non environmentally adjusted contribution to GDP 2.5 Public welfare
Taxes to local and regional authorities 250 000 Environmental space for ecological footprints, Stockholm- equivalents, no
Carbon dioxide 250 Nitrogen 115 Sulphur 510

59
Table 4. Improved sustainability performance due to improved feeding effi-ciency at farm D in Table 2, effects per year unless otherwise stated.
On milk herd level Per tonne milk
Influx of nitrogen, kg -1 250 -1.88
Economic effects
Economic result, SEK 166 000 250
Social effects
Increased food security, protein demand, no of people 361
0.55
Taxes to local and regional public authorities, SEK 35 000
53
Ecological effects
Decreased pressure tropical defor-estation, ha 8,7
0.014
Decreased emissions of ammonia, kg 456
0.69
Decreased emissions of GHG, kg CO2equiv
Nitrous oxide 96 000 145 Tropical deforestation, al-
located on 20 years 307 000
460 Decreased eutrophication
-Kattegatt, kg N 330
0.50
Societal benefits, SEK
Ammonia emissions, SEK 92 000 140
GHG, nitrous oxide 144 000 217 GHG, tropical defor, allocated on 20 years 460 000
700
Eutrophication Kattegatt 330 000 500
Sum societal benefits 1 192 000 1 800 Economic result the farm of total societal value of taken measure 0.14
0.14
Tables 3 and 4 may look quite simple, but they are not. They present tabulat-ed values representing the difference between two point estimates of a bio-physical production function describing the milk production system at farm D in Table 2. Everything is held constant in the two alternatives expect the amount of purchased feeds per kg milk. The outcome of this comparison is analysed within the ecological economic social context of the farm. The structure and the estimates in Table 3 and 4 are a function of the methods and results in Papers I to VI. The challenge is not to deliver values in a table, but to find those values that reflect important features of real world systems.
Multiplying the values in the right hand column by 3.3 million provides an initial estimate of the national impact in Sweden based on the impact at this farm. Typically, the other farms using this method showed similar levels

60
of improved contribution to ecological, economic and social sustainability objectives, from local to global level. These first estimates of national im-pacts show
reduced influxes of nitrogen by 6.2 million kg N,
less pressure for tropical deforestation by 46 000 ha,
improved food security by 1.8 million people (protein supply),
improved economic results for Swedish milk production by 825 million SEK, and
increased taxes to local and regional public actors by 173 million SEK.
Hence, here at cow and herd level roughly one fourth of the suggested sus-tainability improvements through increased feeding efficiency, i.e. measure 4 in Table 2 in Paper VI, have been achieved.
The Swedish national environmental quality objectives20 are 1. Reduced Climate Impact. 2. Clean Air. 3. Natural Acidification Only. 4. A Non-Toxic Environment. 5. A Protective Ozone Layer. 6. A Safe Radiation Environment. 7. Zero Eutrophication. 8. Flourishing Lakes and Streams. 9. Good-Quality Groundwater. 10. A Balanced Marine Environment, flourishing Coastal Areas and Archi-
pelagos. 11. Thriving Wetlands. 12. Sustainable Forests. 13. A Varied Agricultural Landscape. 14. A Magnificent Mountain Landscape 15. A Good Built Environment 16. A Rich Diversity of Plant and Animal Life
20. See http://www.miljomal.se/sv/Environmental-Objectives-Portal/, accessed 2014-02-17.

61
The increased feeding efficiency in this example results in substantial con-tributions to numbers 1, 2, 3, 4, 5, 6, 7, 8, 9, 10, 11, 12, 13, and 16. Objective 4 is influenced as increased feeding efficiency reduces the amount of crops required, thereby reducing the amount of pesticides used. A similar reason-ing explains the contribution to objective 6, as less feeds to handle and pro-cess implies reduced use of electricity, reducing the demand for nuclear power.
The same measure has contributed to the UN Millennium Development Goal 1 – to eradicate extreme poverty and hunger, and 7 – ensure environ-mental sustainability, where aspects explicitly expressed are reducing loss of forests and biodiversity respectively, increasing access to safe drinking wa-ter, and addressing climate change.
The outcome in Tables 3 and 4 can be compared to the criteria for public procurement from SEMCO (Miljöstyrningsrådet in Swedish)21. SEMCO proposes three criteria regarding impacts on ecosystems on the highest ambition level for dairy: phosphorus, “has the amount of livestock effluents on producing farms
not exceeded a level corresponding to a maximum of 22 kg phosphorus per hectare and year, calculated as an average over five years?”;
nitrogen, “has the amount of livestock effluents spread by producer farms not exceeded the limit set forth by the Nitrates Directive of 170 kg nitrogen per hectare and year?”; and
emissions of GHG, “can the supplier provide information about the product's carbon footprint from a lifecycle perspective, reported in CO2 equivalents?”.
In the Swedish version, the criteria regarding GHG are linked to LCA provided by the rules set by ISO 14 040 and 14 044. The limits of the sus-tainability relevance of a number of LCAs of dairy production following ISO 14 040 ad 14 044 are analysed in Papers III, IV and VI.
The limits suggested for influxes of phosphorus and nitrogen though ma-nure are quite high. This is one of many influxes, and the balance per ha land is more interesting if the purpose is to link the criteria to real impacts on ecosystems. If that is the purpose, the total environmental load of affected ecosystems should be considered: The same environmental load from one ha of agricultural land can have substantially different environmental and hu-man health consequences depending on the context, see Figures 12 and 13 and Stokstad (2014). Stokstad shows that as well as nitrogen applied to the field, ammonia emissions are also important, and may cause substantial hu-man health impacts in areas with high densities of people and farm animals.
21. SEMCO´s procurement criteria for dairy, accessed 2014-01-17 at http://www.msr.se/sv/.

62
Hence, the methodology presented in the thesis can support public pro-curement to achieve the objectives put forward in SOU 2013:12 regarding public procurement. It can increase the efficiency of public procurement when it is used as a tool to enable national environmental objectives and global sustainability goals such as the UN Millennium Development Goals, by providing objective grounds to facilitate selection of offers with lower external costs and higher external benefits.
Figure 8 suggests that already at the stage when the feeding trials were chosen that were the prober stones for the candidates of established systems of feeding standards to build the new Nordic feeding standard system around, the project group made a choice to increase the feeding intensity from the level of 5.0 MJ ME that resulted in economic rational feeding lev-els (Hellstrand 1989), see also Figure 4 and 5, to around 6.0 MJ ME per kg ECM..
Causes behind impacts at farm level are hard to determine with scientific precision. So far, these experiences at these farms support the relevance of the analysis above and in Paper III and IV. An improved economic result with 3 500 SEK per cow with 350 000 dairy cows in Sweden in 2012 corre-sponds to 1.2 billion SEK at national scale.
The outcome when switching from the new system to the one used in 1991 at these farms is that Norfor presupposes an energy requirement meas-ured in ME terms of 6.1–6.3 MJ per kg ECM. This corresponds to the line representing an average allowance of 6.25 MJ ME per kg milk (ECM) in Figure 3. According to this figure, the biological return on an extra unit of feed at this intensity is low, if any. A decrease in the feeding intensity at this high level will have little negative impact on milk production, positive im-pact on economic result, and a substantial impact in terms of decreased ap-propriation of renewable natural resources (feeds) and decreased emissions of e.g. nitrogen. The positive contribution to Millennium Development Goals regarding food security and ecological sustainability is substantial, so is the contribution to national environmental quality objectives.
4.3 Protein standards for dairy cows A fundamental change in Swedish protein standards systems was made in 1991, and was followed by a major revision in 1995. Some of the problems with the changes are that (see also Paper VI and Hellstrand 2008):
In the 1991 change it was assumed that
o the maintenance requirements increased in g protein per cow de-spite the fact that the protein content in most feeds was substan-tially reduced with the new protein measure,

63
o protein content in forages was no longer a function of the crude protein content, but was a strong function of the energy content. Thus in practice the energy value of forages was counted twice, while their protein content was not accounted for,
o the protein value of forages with high crude protein contents was reduced to greater degree than for other feeds.
As a consequence, the estimate of the requirement for crop protein feeds increased, and the assumed feeding value of forages decreased. The ni-trogen efficiency thus decreased. This follows the logics of how feeding rations are constructed. An assumption of higher protein maintenance requirement increases the estimate of the amount of soymeal22 required to balance energy and protein demands and reduces the amount of coarse grain. Assuming decreased protein content in forages increases demand for soymeal, everything else being equal. Thus, the changes in 1991 im-plied that the value of soymeal increased relative to grain and forages.
In the 1995 revision, the assumed protein requirement for maintenance was increased further, as was the protein requirement for low lactating cows, while it was reduced for high lactating cows.
This was based on a fundamentally new physiological principle, i.e. that the requirement of protein in g per unit energy was constant and the same for very low and high production levels. Arguments for this fun-damentally new principle were not delivered.
The scientific basis for these major changes in such an important relation regarding the economic and ecological efficiency of Swedish agriculture is not available. The reference in the official publication presenting feedstuff tables and feeding standards (Spörndly 1995) is to a PM at a department at the Swedish University of Agricultural Sciences. The PM cannot be found at the department (Hellstrand 2008).
The same competence at the Swedish University of Agricultural Scienc-es that is responsible for the feeding standards has supported the Swe-dish Environmental Protection Agency, the Swedish Board of Agricul-ture and the Swedish Dairy Association with feeding plans to be used in official contexts from 1996 to 2006. Surprisingly, these feeding plans are not congruent with the official feeding standards that the same source is responsible for, and the deviations are substantial.
22. I use “soymeal” as a synonym for crop protein, for three reasons: (i) soymeal dominates the global crop protein feeds market; (ii) Soymeal can be used for all animals; and (iii) thus on the margin, changes in use of all other types of crop protein feed affect the supply and de-mand on soymeal.

64
In the instances mentioned in the previous point, there are substantial deviations from basic animal physiology, and no supporting arguments have been provided. Together, these changes increased assumed protein requirements, resulting in decreased nitrogen efficiency.
The full extent of the deviations from basic physiological knowledge can only be seen when examining the content in the individual Excel cells of the supporting data. Hellstrand (2008) and Paper IV illustrate its conse-quences.
There are two problems with this from a sustainability perspective. (i) The contributions from the responsible competence at the Swedish Uni-versity of Agricultural Sciences in these two contexts (definition of offi-cial feeding standards and the application of the same feeding standards in influential contexts) contain a substantial internal inconsistency. (ii) This can only be fully appreciated through the expressions at the level of individual cells in the supporting spreadsheets. This conflicts with the demand for transparency in the analysis supporting well-informed deci-sion processes for sustainable development, as expressed by Giampietro (2003) and OECD (2001).
The Swedish Dairy Association, which is responsible for most of the extension services to dairy farmers and the production of recommended daily feeding rations on individual cow level, recommend a substantial increase in protein requirements compared to the official standard for high-yielding cows. This increases assumed protein requirements, which results in decreased nitrogen efficiency. The scientific basis for this de-viation is unclear.
In the system for feeding rations control in order to secure high nitrogen efficiency, the Swedish Dairy Association chose a system from the USA. OECD statistics and FAO statistics indicate that the USA has the lowest nitrogen efficiency in milk production globally among nations with high production levels23. The rules chosen allowed animals to be fed substan-tially more nitrogen than the level corresponding to the official Swedish protein standards. Thus the control measure chosen with the aim of im-proving nitrogen efficiency in milk production was set at such a high protein level that it allowed a substantial decrease of the nitrogen effi-ciency.
The choice of a rule expressed in a different protein measure than the official feeding standards system is odd (previous point). There should either be trust in the official system, or it should be changed. Working
23. This is treated in Section 4.7 in the thesis.

65
with two fundamentally different systems in parallel does not support ef-ficiency in management.
The basic construction of the protein standards system is questionable. It expresses a belief that the true complexity of a system with complex feed-back loops such as the rumen digestion system can be captured by computer based models with long chains of calculations, presupposing only linear causal relationships. I propose that regarding milk production, the human mind is better suited to handling this kind of complexity than computer pro-grams.
Thus, the changes in the protein standards systems in Sweden in 1991 and 1995, and the praxis in the way it has been applied explains an important part of the increase in use of purchased feeds to dairy cows in Sweden from 1991 to 1999. This is further shown in Paper VI and Hellstrand (2008).
The increase in nitrogen influxes via crop protein feeds in Swedish cattle production from 1991–2006 (Paper VI) implies increased use of soymeal equivalents of 450 million kg in milk production and 81 million kg in other cattle production systems. In November 2012 the price of soymeal on the Chicago market was 490.6 US$ per tonne24. This implies an increased cost in Swedish milk production in 2006 of 1 435 million SEK compared to a situa-tion with 1991 levels of crop protein feeds. In 2006 the number of dairy cows was 387 530, corresponding to an increased cost for crop protein feeds of 3 700 SEK per dairy cow and year in 2006.
4.4 Environmental monitoring systems One reason that the rapid increase in the use of crop protein feeds and the associated significant sustainability costs in Sweden between 1991 and 1999 were not detected is as follows: Authorities with the responsibility of moni-toring trends regarding the environmental pressure from agriculture (Statis-tics Sweden and Swedish Environmental Protection Agency) in the official reporting of ammonia emissions and nitrogen balances in agriculture, mainly base this reporting on so-called soil surface balances, see e.g. Statistics Swe-den (2009a,b). These analyses, from 1995 and onwards, are based on the assumption that the feeding of the cows is constant over time at the same production level. With increased production, the feeding was changed in accordance to fixed feeding rations constructed in 1996 (Paper VI). There was no capacity to reflect real national feeding trends. Thus, these balances do not reflect the substantial and fast increase of nitrogen influxes in cattle
24. http://www.indexmundi.com/commodities/?commodity=soybean-meal, accessed 2013-01-02.
66
production due to the increase of crop protein feeds in purchased feeds to cattle from 1991 to 2006 (see Figure 2 in Papers III and VI respectively).
The Swedish Board of Agriculture is responsible for the programme Fo-cus on Nutrients (Greppa näringen in Swedish)25. This is a major means of dealing with eutrophication issues in agriculture. Regarding milk production, they rely on the contributions and competence of the Swedish Dairy Asso-ciation. For 701 dairy farms that participate in the program, three years par-ticipation did not result in any increase in the nitrogen efficiency of their milk production measured on the cow level (Jordbruksverket 2008b).
Possible explanations are
there was no focus on the nitrogen efficiency in the animal production subsystem, and/or
the methodology used was not relevant, i.e. the issue could not be solved within the logics of the feeding standards system applied.
Regarding the third point, the Swedish Dairy Association and their member organisations have a dominant role in the production of feeding rations for commercial herds. They are also in charge of feeding standards. In Focus on Nutrients, they are responsible for the revision of the very same advice and recommendations regarding the feeding of dairy cows that they themselves are responsible for. Thus the same organisation that may have caused a prob-lem in the first place are supposed to evaluate the outcome of their own work and eventually correct it by applying the same methods that caused the prob-lem.
This is not an efficient organisation of evaluation and revision. Furthermore, the impact on milk production on the farms in terms of in-
creased milk production per cow was the same as in the official milk record-ing program in the same period. Hellstrand (1988) showed that the most important way to improve the economics of milk production and feeding efficiency among commercial herds is to increase the capacity of the farm to utilise the genetic capacity for milk production, i.e. increase milk production. The second most important measure is to improve feeding efficiency. Hell-strand also presented a production biological and economic model for how to do this. This model provides the frames for the feeding plan subsystem in the simulation model in Paper IV. Actual impact of the model on economy and milk yield after around two years of application was shown for two real farms in the same report. The positive impacts were substantial.
According to the mentioned report, in the milk production subsystem, the Focus on Nutrients program had no impact on either milk yield per cow or on the feeding efficiency measured as nitrogen efficiency on the cow level.
25. http://www.greppa.nu/ovrigt/kontakt/english.4.1c0ae76117773233f780001230.html, accessed 2009-11-05.

67
This can be compared to the positive sustainability impacts of advanced consultancy based on the methods of Papers I to VI at five farms according to information from the farmers reported in Tables 2 and 3.
Another problem with this program is that it subsidises inputs of ad-vanced consultancy to farms in intensive animal production areas with high eutrophication problems, at least indirectly, by farms that do not have these problems.26 Thus, this reflects a new environmental policy: The Polluter Subsidy System. This distorts the competitive conditions in a way that disfa-vour sustainable production in favour of unsustainable production.
4.5 Research regarding sustainable food production The major research program in Sweden regarding sustainable food produc-tion since 1997 is FOOD 21.27 In their synthesis work, the evaluation of en-vironmental impacts was based on LCA, a method developed within engi-neering sciences. Paper IV (see also section 4.7) identifies major problems in their model of the ruminant production system given its social and ecological context in the studies regarding milk production (Cederberg and Flysjö 2004; Gunnarsson et al. 2005; Sonesson 2005). More specifically, there were major weaknesses in
the animal production system constructed,
the model of environmental systems supporting the production system with natural resources, and taking care of emission/discharges, and
the social system, with regard to the evaluation of the social and eco-nomic needs and desires that the production satisfied.
The severity of these problems was such that it restricted the capacity to detect the substantial negative sustainability impacts due to the reduction in nitrogen efficiency in Swedish milk production from 1991–1999 (Paper III). Consequently, these effects were not reported.
These findings suggest that there is reason to evaluate the relevance of applying engineering-based approaches as means of supporting sustainable development. Section 4.7 presents 25 such applications, and evaluates their usefulness for supporting sustainable development. The examples from FOOD 21 mentioned will be examined further in this context.
26. This is the consequence when looking at regional level. Agriculture in areas with low discharges of nitrogen to the sea per kg milk produced are outside this system, while agricul-ture in areas with high discharges per kg milk can utilise the opportunity of subsidised consul-tancy. 27. http://www-mat21.slu.se/eng/, accessed 2010-01-18.

68
The discussion about the shortcomings of these applications of engineer-ing tools by no means reduces the importance of engineering science. This is an example of the principal problem of methodological extrapolation.
Before the examination of the 25 applications, the international relevance of the results will be discussed first.
4.6 International relevance Paper VI shows that
the same basic approaches govern energy standard systems in Sweden, Norway, Denmark, the USA and the Netherlands (see also Figures 6 and 7);
similar protein standards systems are used in Denmark, Norway and the USA as in Sweden;
there are theoretical and empirical indications that the feeding efficiency is lower in Denmark, the Netherlands and the USA compared to Swe-den; and
available theoretical and empirical evidence suggests that the new feed-ing standards system introduced in the Nordic Countries (excluding Fin-land) will deteriorate the feeding efficiency further compared to the cur-rent Swedish system.
This suggests that the findings regarding sustainability trends associated with Swedish milk production from 1991-1999 may well be representative
on a global scale, and
for the Nordic countries (excluding Finland) in the future.
The findings in Sections 4.2 and 4.3 support this conclusion. Figure 9 illus-trates the possible international relevance.

69
Figure 9. Nitrogen content in manure from dairy cows per kg milk produced
at different production levels among OECD nations. Source: Own calculations based on OECD data regarding nitrogen balances, and FAO data regarding production levels28. Turkey ex-cluded as their data were not included in the reports.
The nitrogen balances reflect both the nitrogen/protein content in the feeding ration, and the total amounts of feeds consumed (Huhtanen and Hristov 2009). Thus, they relate to both energy and protein standards and their im-pact on feeding regimes.
Figure 9 shows a trend of increasing nitrogen efficiency with increasing yields, but the trend is not strong. Other factors explain 78% of the variation. The values for Korea and the USA are interesting. Korea combines a high production level, around 9 500 kg per cow, with high nitrogen efficiency. The amount of nitrogen in manure is 8.8 g per kg milk, which is 3.3 g less than the expected value due to the high production level. The USA has a somewhat lower production, 8 600 kg per cow and year, with 17.3 g nitrogen in manure per kg milk, which is 4.0 g more than expected due to the milk yield level. The measure for Korea is thus 8.8 kg nitrogen in manure per 1 000 kg milk, and the corresponding measure for the USA is 17.3 kg nitro-gen in manure per 1 000 kg milk, i.e. 8.5 kg more than in Korea. Among nations with high production levels (> 7 000 kg per cow and year), the Neth-erlands and Denmark have low nitrogen efficiencies, i.e. 3 and 2.3 g more nitrogen in manure per kg milk than expected respectively. Finland is the
28. From FAOstat, http://faostat.fao.org/default.aspx, and Environmental Performance of Agriculture in OECD countries since 1990, http://stats.oecd.org/Index.aspx?datasetcode= ENVPERFINDIC_TAD_2008, respectively. For further details, see Hellstrand (2010).
-15
-10
-5
0
5
10
15
20
25
30
35
0 2 000 4 000 6 000 8 000 10 000 12 000
Nitr
ogen
in m
anur
e as
g N
per
kg
milk
pro
duce
d
Kg ECM per cow and year as national average
Nitrogene in manure per kg milk in 2004 as national average; R2 = 0.22, trend gives 1.3 g nitrogen less per 1 000 kg milk more
g N/kg milk
Trend
Estimate minus trend

70
only nation with a lower value than the level predicted from the yield in the group with high production levels, 0.3 g below the trend.
With a global production of 578 million tonnes of cow milk in 200829, the estimate for Korea suggests the possibility of a nitrogen efflux in manure of 5 100 million kg, while the efficiency of USA milk production suggests a nitrogen efflux in manure of 10 000 million kg, i.e. 4 900 million kg higher. The estimate 4 900 million kg nitrogen in terms of nitrogen in soymeal cor-responds to around 35 million ha of soybean production. This is half the global acreage used for soymeal production for feed purposes (FAO 2006). From this measure the possible impact on climate change, global food secu-rity and on farmers’ net income can be estimated through the same route as in Paper VI.
However, before continuing with a process for possible global policy im-plementation of Korean feeding strategies, there is a need to probe the accu-racy of the nitrogen balances data from OECD.
Figure 10 shows nitrogen influxes to dairy cows from 1991 to 1999 through purchased feeds as kg N per cow in Sweden.
Figure 10. Nitrogen influx from purchased feeds to dairy cows in Sweden,
1991–1999. Based on materials, methods and results in Hellstrand (2006).30
29. http://faostat.fao.org/site/569/DesktopDefault.aspx?PageID=569#ancor, accessed 2010-01-19. 30. The nitrogen influxes from purchased feeds to cattle were estimated by multiplying the amounts of feedstuffs within purchased feeds by their crude protein content. Division by 6.25 gives the amount of nitrogen. Here the same operation has been performed for the fraction of purchased feeds to cattle that is reported as feeds to dairy cows. Division by the number of dairy cows gives the amount of nitrogen influx per dairy cow (Hellstrand, 2006).
0,0
10,0
20,0
30,0
40,0
50,0
60,0
70,0
80,0
90,0
1991 1992 1993 1994 1995 1996 1997 1998 1999Nitrogen influx purchased feeds, kg per dairy cow 30,9 34,2 46,4 56,0 65,2 71,5 66,7 72,2 77,1Nitrogen influx purchased feeds, increase kg per
dairy cow since 1991 0,0 3,3 15,5 25,2 34,4 40,6 35,9 41,3 46,2
Kg N
per
dai
ry c
ow a
nd y
ear
Nitrogen influx through purchased feeds to dairy cows in Sweeden 1991 to 1999; the increase from 1991 to 1999 corresponds to 5.5 g N per kg ECM produced

71
The nitrogen efficiency in milk production decreased substantially during the decade as major changes were enforced in the protein standards system (Fig-ure 2; Paper III).
The increase in influx by 46 kg from 1991 to 1999 should be compared with the 117 kg nitrogen in manure per dairy cow that OECD uses as a con-stant in their nitrogen balances for Sweden from 1985–2004. Considering this increase in nitrogen influx, the value of nitrogen per kg milk for Sweden would increase by 5.5 g to 19.9 g per kg milk, the highest level of all nations with a production of 7 000 kg milk per cow and year or more (Figure 9).
These facts in combination with Paper VI (see beginning of this section) imply that it is relevant to use the Swedish values as starting values in a first evaluation of global potentials for increased feeding efficiency in milk pro-duction. Figures 9 and 10 raise a concern, as they indicate that among na-tions with high production values Sweden may now have an internationally low nitrogen efficiency level in milk production. This question is open as available official data is not sufficient to determine the answer. Other data from official sources (see Hellstrand 2008) suggest that the Swedish trend is towards a lower value that is common internationally. Even so, the Swedish trends since 1989 imply that there is a huge potential to improve the sustain-ability performance in Swedish milk production. Other facts presented earli-er in this thesis as well as in Paper VI and in Hellstrand (2008) suggest that this is of international relevance.
The fact that the environmental monitoring systems regarding nitrogen balances in agriculture and ammonia emissions in Sweden do not consider this flux (see Section 4.4) is a concern. A relevant question is whether moni-toring systems and systems for evaluation of environmental performance in dairy production in the EU and FAO have similar weaknesses.
4.7 Approaches in engineering sciences There is a multitude of examples where engineering-based approaches form a toolkit with the ambition of supporting the implementation of sustainable development. In the following 25 such examples are analysed. This analysis informs about possible obstacles for sustainable development, and provides an indirect evaluation of
the relevance of the toolkit for sustainable development that this thesis presents,
the degree to which the thesis contributes to bridging the knowledge and implementation gaps of sustainable development identified by OECD (2001), and
the level to which the thesis increases the understanding of the value of land.

72
Examples of engineering-based approaches for analyses of (ecological) sus-tainability of economic production systems that have been examined are shown in Table 5. Table 5. Examples of efforts based in engineering sciences to support
sustainable development.
Physical resource theo-ry
Environmental and national accounts
Industrial sector LCA in general and applied on milk production
1. Kåberger and Månsson (2001)
8. Statistics Sweden (2009)c
10. The IPPC-directive with the BAT-principle (EIPPCB 2014)
15. Baumann and Tillman (2004)
2. Månsson and McGlade (1993)
9. Engström et al. (2007)
11. EU-directive31 governing technical solutions sewage treatment plants
16. Stern et al. (2005)
3. Kåberger (1991, 1999) 12. The Integrated Product Policy (IPP) (Wijkman 2004)
17. Gunnarsson et al. (2005), Sonesson (2005)
4. Azar et al. (1996), the Natural Step (2014), the Forom For the Future (2014)
13. Application of IPP, Williams et al. (2008)
18. Cederberg and Flysjö (2004), Cederberg et al. (2007)
5. Egeskog and Gus-tafsson (2007), Sparovek et al. (2007)
14. SWENTEC, SOU (2004)
19. LRF (2002)
6. Wirsenius (2000) 20. SNFA (2008), Lagerberg Fogelberg (2008)
7. Swedish Environmen-tal Advisory Council (2007), Lundqvist et al. (2007)
21. SBA (2008)
22. The Swedish Dairy Asso-ciation (2009) work with climate change issues
23. IDF (2009), GDAACC (2009)
24. A cooking book titled Food and climate, by Björ-klund et al. (2008)
25. The sustainability work by one group of Swedish ham-burger-restaurants (MAX 2009)
4.7.1 Contributions from physical resource theory Examples 1–7 concern contributions from physical resource theory. Example 1 is on the most general level, and is treated in Paper I. Here, natural re- 31. EU directive (91/27/EEG).

73
source concepts are defined using assumptions such that even the word ‘re-source’ loses its meaning. Exergy is defined assuming thermodynamic ideal-ity, implying that no fluxes occur. Resource is thus a meaningless concept. As a consequence, the definition presupposes freedom from all process re-strictions that define ecological, economic and social sustainability. Not surprisingly, based on these resource concepts, the authors estimate a poten-tial for the growth of the human economy in physical terms by a factor 10 000 from the current level, fed by energy fluxes from the sun.
In Example 2, the authors perform an analysis of the relevance of contri-butions in systems ecology. They base their analysis on four criteria deliv-ered by O´Neill et al. (1986). They chose physics as their modus operandi. What they do not realise is that this choice violates their own criteria. They do not show why it is relevant to apply physics in an evaluation of the rele-vance of contributions within systems ecology regarding the characteristics of ecosystems. Rather, Example 1 shows that physics is not relevant in such contexts. Basically, this is an example of extrapolation error, here on an ab-stract, methodological, scientific level.
Example 3 concludes that energy values in nutrition theory are basically measures of gross energy. This is fundamentally wrong. This assumes that the physiological complexity of humans and animals is equivalent to that of a combustion engine or wood stove. Energy evaluation in animal and human nutrition theory expresses an intricate understanding of energy trans-formations in a complex physiological web that defines energy metabolism in living organisms. This conclusion in Example 3 is thus a good measure of the gap between expert knowledge regarding energy metabolism in living organisms, and the level of understanding delivered from physics. The per-ceptions of the economy in Examples 2 and 3 are problematic.
The scientific basis for the system conditions for sustainability of The Natural Step (Example 4) is a contribution within physical resource theory (see Azar et al., 1996). When relating to Figure 2, one can conclude that the consideration of process restrictions in economic and ecological systems is poor. The system conditions imply that agriculture is impossible, as it raises the level of nutrients in water systems to unnaturally high levels. If imple-menting these system conditions, the majority of the human population would vanish. Thus, the consideration of vital social process restrictions is also poor.
Example 5 implies that local socio-economic conditions will be severely depressed, and that the gender profile is strongly negative. This follows be-cause the results that state that the local socio-economic conditions would be improved are based on the assumption that women in the local society milk 7 times more milk by hand than in the reference alternative, i.e. up to 100 tonnes of milk per year, without payment. The net impact on climate change may be negative, as the marginal impact on deforestation and on methane emissions of a 7-fold increase in milk production are not considered. It is

74
interesting that this is found when the details and footnotes in Egeskog and Gustafsson (2007) are analysed. Still, Sparovek et al. (2007) present it as a case study illustrating how certification schemes for good ethanol including climate change impacts and local socioeconomic development can be con-structed. Lundqvist et al. (2008) in a policy brief to decision makers in the international community and nationally, also present this example, where due to their lack of competence in animal production science and practice, they did not notice that if actually implemented, the proposed measure would most probably increase contributions to climate change and depress local socioeconomic conditions.
In Example 6, the FPD-/ALBIO model, a global model of food produc-tion from crops to human intake is constructed. The model includes an ener-gy conversion efficiency measure which follows the same logic as in Exam-ple 3. Thus, it is the ratio between gross energy in food consumed and gross energy in biomass appropriated. The same critique is relevant as for Exam-ple 3. The physiological complexity of humans is reduced to that of a wood stove. One problem of this efficiency measure in the way it is used in the FPD-/ALBIO model is that it defines fluxes of manure and crop residues back to agricultural land as a waste, as if there were no feedback loops ferti-lising the top soil layer enhancing the productivity of agricultural land. An-other is that it is ignorant to the quality aspect of energy in food given the physiological context of humans and how it may vary.
Furthermore, the variation in ecological conditions is reduced to zero. In reality the agro-ecological as well as agro-social conditions provide contexts that must be considered when evaluating efficiency and durability in agricul-tural production. Regarding the social dimension, in many economies cattle production provides a multitude of values outside food production. FAO (2006) is clear about this. In Example 6, these social values are ignored. This implies that the low efficiency in ruminant production systems that the au-thor report substantially reflects an ignorance of real values related to rumi-nant production systems in their ecological and social contexts.
Thus, ruminant production systems are classed as having extremely low efficiency.
In the FPD-/ALBIO model, agricultural soils are not included. Around 50% of biomass appropriated in food production from agricultural land ends up in feedback loops back to agricultural land through fluxes of manure and crop residues. According to the FPD-/ALBIO model, society would be better off if these useless fluxes (according to the model) were steered so that they supported the energy metabolism of society. In reality, this measure would deplete one of the most important stocks of natural capital for human socie-ties, the humus content of 4.9 billion ha of agricultural land, where this is a prerequisite for future yields and thus food production. This is one example of how the theoretical analysis in Paper II regarding the pattern of welfare costs of forcing an economic system to exhibit such a growth in physical

75
terms that biophysical sustainability limits are trespassed, can become rele-vant in the understanding of real world policy failures and their causes. Pa-per VI shows how this model now influences the IPCC strategy for bioener-gy.
Example 7 proposes precisely this, where about 50% of current refluxes should instead feed the energy metabolism of society. It concludes that this measure will have no ecological consequence whatsoever. Considering all agricultural land globally, this implies a reduction of the reflux of 600 kg dry matter (DM) organic matter per ha and year, or if considering all arable land, it corresponds to 2 100 kg DM per ha and year. In reality, this will reduce the humus and plant nutrient content of agricultural soils, reducing soil fertil-ity and global food supply capacity while increasing carbon dioxide emis-sions. The context is a study that aims to inform the Swedish Government about the conflict between growth and the environment. In this example, physical resource theory was chosen as the relevant competence for analysis of sustainable production potentials in agriculture and forestry. However, as shown above, physical resource theory is not suitable for this task. Other problems are that energy conversion issues in agriculture and society were treated in quite odd ways, and that estimates of acreages needed for bioener-gy purposes were not based on real production potentials, considering real agro-ecological conditions affecting production levels.
Examples 1–7 illustrate a consistency in the way contributions from phys-ical resource theory ignore real conditions that define ecological, economic and social sustainability, from highly abstract conceptual contributions, to non-scientific analyses of animal production systems. If such studies influ-ence policy decisions, the sustainability cost can be devastating.
The reason to class it as non-scientific is that the way data here are gener-ated is in conflict with the second principle in ”Fundamental Principles of Official Statistics”32 of UN:
“Principle 2. To retain trust in official statistics, the statistical agencies need to decide according to strictly professional considerations, including scientific principles and professional ethics, on the methods and procedures for the collection, processing, storage and presentation of statistical data.”
Here data are processed in conflict with established principles in scientific disciplines that represent the excellence of competence regarding systems and issues focused.
4.7.2 Environmental and economic national accounts The Swedish system of environmental economic accounts (Example 8) is not a system of environmental accounts, since it is basically an accounting sys-
32. http://unstats.un.org/unsd/dnss/gp/FP-New-E.pdf, adopted by the General Assembly on 29 January 2014. Accessed 2015-03-31.

76
tem that handles aspects of economic and natural resource use. The condi-tions of ecosystems and impacts of production on ecosystems are largely ignored.
Example 9 makes an effort to evaluate the environmental impact of Swe-dish agriculture on national environmental objectives. With some simplifica-tion the approach is a hybrid between LCA and some of the methods behind the system of environmental economic accounts. Two unacknowledged problems arise: only negative environmental impacts are considered, while agriculture is also the limiting factor for other environmental objectives where maintained agriculture is crucial. The focus on negative impacts is surprising, given that the objective of the paper is to evaluate environmental impacts, and not only negative impacts. The evaluation of environmental impacts is not based on an investigation of environmental impacts in affected ecosystems using suitable methods in natural sciences. Instead it is based on different approaches to measure preferences among groups of citizens. This becomes problematic if “scientific” contributions influence decision-makers, when the scientific material actually reflects preferences of certain groups.
Examples 8 and 9 are biased in their treatment of land and agriculture. Positive contributions through production of ecosystems services are not considered, while environmental costs are.
4.7.3 Sustainability in the industrial sector Examples 10–14 treat the issues of methods and means supporting the de-velopment of more sustainable production processes and products in the business sector. All are examples of production-oriented approaches. The environmental policy discussed in these treatments is not an environmental policy, as the criteria are defined in terms of natural resource use and emis-sions per unit product (see Figure 2). The real impact on ecosystem carrying capacity limits is largely ignored.
Example 13 illustrates the weak environmental consideration within Inte-grated Product Policy (IPP) and the weak regional anchoring. Here it is pre-sented in some detail in a discussion regarding problems of the EU-based IPP in its implementation as a tool supporting sustainable regional and na-tional growth. IPP and similar approaches play a major role in the EU, Swe-den and in Swedish regions in the ambition to improve competitive power through the environmental factor.
The study is a scientific outcome within the field of environmentally driv-en businesses in a strategy for sustainable growth in Värmland within the regional growth program. This area, together with IPP, was prioritised in this growth program under the heading environment and production (Länsstyrel-sen och Region Värmland 2004). The article treats the importance of food packaging well. The pulp and paper industry are important in Värmland, and production of packages is an important part of this industry. Nevertheless,

77
this is a minor fraction of the total production in Värmland. The “environ-mental analysis” is not an environmental analysis. It is a review of some LCA studies from regions other than Värmland or other system levels, in which production related aspects such as the capacity to protect food, the environmental impact of the production of food packaging, the capacity of the package to support efficient transport solutions, environmental impact of wastes generated by the packages, material, process energy, transport and loss of food are classed as environmental aspects. These aspects affect the environment, but they are not aspects of the environment per se. This results in the same principal problems as in all typical LCA studies, with one added element. All studies with the character of a meta-study have the problem of varying contexts for the individual exploited studies, and how to deal with them. The article does not treat the impact of the production systems on the environmental systems in Värmland. The gap between what is called envi-ronmental aspects and real impacts on the carrying capacity limits of ecosys-tems that would be affected is significant. Because
the small fraction of the regional production treated,
the non-existent relation between the analysis in the article and the eco-systems in Värmland, and
the substantial gap between the performed analysis with respect to what are called environmental aspects and real world impacts expected on physiological processes in microorganisms, plants, animals, and/or hu-mans that define carrying capacity limits,
the capacity of this type of scientific contribution to support sustainable growth on the regional level is limited.
This critique should be seen in context. The definition of environmentally driven businesses from NUTEK, the national authority in the area at that time, relates to environmentally adopted products and services (NUTEK 2003). The criterion provided is that they should have a better environmental performance than existing alternatives on the market. Taking the definition literally, this implies that all alternatives belong to the class of environmen-tally adopted products and services, even those that cause severe environ-mental damages, if there is at least one alternative that is worse. The defini-tion is so broad that its value is minimal.
The regional growth programs were viewed by the government as a major tool to achieve a sustainable development in Sweden (p. 117, Regeringen 2004). The origin of the definition of environmentally adopted products and services by NUTEK was from earlier definitions by Eurostat, OECD, and the EU (NUTEK 2003, p. 4). It is similar to the IPP concept of the EU commis-sion, which was criticised by the EU parliament (Example 12). This illus-trates how definitions and concepts on high system levels such as

78
EU/Eurostat/OECD that have “environment” in their name, by setting such system boundaries as in Figure 2, often ignore the characteristics of affected ecological, economic, and social systems. The sustainability issue is inter-preted as mainly an issue of numerical values of natural resource use and emissions per unit product while ignoring
whether the total appropriation of natural resources and of assimilative capacity is within available ecological carrying capacity limits,
a major part of the economic aspects of production and consumption including impacts on the environment and human health and
the social consequences of natural resource use and emissions made.
With this definition of environmentally adopted products and services, the decision by the Värmland growth program to base its sub-strategy regarding environment and production on IPP and environmentally driven businesses implies a decision to ignore the values delivered by the ecosystems of Värm-land.
Following methods and prices used by Swedish authorities, the value of the assimilative capacity of the ecosystems in Värmland in 2006 was around 20-40 billion SEK33 compared with a total contribution to GDP of around 70 billion SEK. The Stockholm urban region had a net deficit in assimilative capacity worth several billion SEK. On a national scale, the value of Swe-dish production of ecosystem services is in the range of 300 to 600 billion SEK from a total GDP of around 3 000 billion (2006 prices). These figures are deliberately presented as round figures. For a detailed presentation see Hellstrand (2003a). Section 4.9 presents some further information regarding this issue.
There is a principal difference between these analyses, however. The val-ues presented here are based on the assumption that when felling a tree, not all of its carbon content is oxidised to carbon dioxide immediately. Hell-strand (2003a) followed the common convention of only considering the change of the storage of carbon in living trees. The values presented here are based on the assumption that climate accounting rules should be based on the best available knowledge regarding important processes. The photosyn-thesis in forests in Värmland and globally is one such important process. This assumption is in accordance with what could be termed good account-ing practise as expressed by ”Principles governing international statistical activities” from the United Nations Statistics Division.34
33. Given as ranges as SIKA recommend the use of two prices for carbon dioxide, 1.5 and 3.5 SEK per kg. 34. See http://unstats.un.org/unsd/methods/statorg/Principles_stat_activities/principles_stat_ activities.htm, hämtad 2012-09-23.

79
These values were obtained by specifying the biophysically anchored production function in Paper II, which is derived from the conceptual model of the economy in its ecological and social context (Paper I) in time and space, and with such a focus, that the obtained system of ecological econom-ic accounts was well suited to the purpose of estimating the production and consumption of ecosystem services in one rural and one urban region, and on the national scale. In the operation, information from traditional management tools in forestry and agriculture was integrated with the perspectives of sus-tainable development of Giampietro (2003) and OECD (2001).
The definition of environmentally adopted products and services by EU/Eurostat/OECD on the international level and by the responsible Swe-dish authority NUTEK, combined with the decision of the regional authori-ties in Värmland to base their strategy for sustainable growth on this con-cept, resulted in a regional strategy for sustainable growth that lacked the capacity to translate unique environmental values including a substantial production of ecosystems services to improved economic results for firms in Värmland.
This illustrates how definitions on high policy levels may have substantial impacts on a low operative system level. This is one example illustrating causes behind the combined knowledge and implementation gap for a sus-tainable development that OECD (2001) stressed. The consequences of this are that information needed for incentives
to increase capacity of rural regions to produce ecological goods and services that define the sustainability basis of urban regions,
to increase capacity of agriculture and forestry to produce ecological goods and services that define the sustainability basis of industrial sec-tors,
to adopt urban regions to available ecological carrying capacity deliv-ered from surrounding rural areas and
to adopt industrial sectors to available carrying capacity from agriculture and forestry,
is blocked. “Environmental” policies that ignore known key features of envi-ronmental systems are dominating in the operative mode. This follows as the environmental systems are located outside the system boundaries of the per-formed analysis. This may cause human health problems and environmental disturbances and degrade sustainable attractiveness in urban and rural re-gions, compared to policies based on methodologies and knowledge from the disciplines that represent the state of the art knowledge in the systems con-cerned.
One key aspect here is that most if not all sustainability effects imply im-pacts on the physiological level for microbes, plants, animals and/or humans.

80
Evaluations of sustainability impacts that ignore the physiological level may have a limited value.
This is another example that supports the message from the analysis of feeding standards of dairy cows. The understanding of the causal chains between high and low system levels is crucial in the sustainability context. The feeding example regarding cows shows how assumptions on the rumen physiological level have major sustainability impacts on the global level. In this latter example, definitions made on a high policy level internationally have a major impact on the relevance of regional strategies for sustainable growth with regard to their capacity to handle the ecological sustainability dimension.
Example 11 concerns sewage plants, and is not related to businesses. However, it resembles Example 10 as specific technical solutions are decid-ed by authorities, where the consideration of local conditions could be better.
The discussion above concerns outcomes from policies in Sweden and the EU around 2003–2004. A Swedish strategy for environmental technology was launched in September 2011 (Regeringen 2011). Environmental tech-nology was defined as “all technology that causes less harm to the environ-ment than available alternatives”. It follows the definition used by the EU Commission in the Environmental Technologies Action Plan (2004). The definition of environmental technologies that they use includes all technolo-gies whose use is less environmentally harmful than relevant alternatives.
Problems with this definition have been discussed above. It is so broad that its value is minimal. The steering definition does not address ecological, economic, or social aspects.
The first lines in the communication from the EU Commission (ibid.) are:
Sustainable development – development that meets the needs of the present without compromising those of future generations – is at the core of the Eu-ropean Union’s (EU) objectives. In 2001, the Göteborg European Council launched the EU strategy for sustainable development. This set ambitious ob-jectives and called for a more integrated approach to policy making in which economic, social and environmental objectives can be achieved at the same time. It therefore complemented the Lisbon strategy to make the EU “the most competitive and dynamic knowledge-based economy in the world, ca-pable of sustainable economic growth with more and better jobs and greater social cohesion”.
This shows both the importance of sustainable development within EU ob-jectives and the high ambition level in the Lisbon strategy. The communica-tion in the following paragraphs underlines the importance of the action plan for environmental technologies for these overall objectives. However, major policies for sustainable development steered by definitions that ignore vital aspects of ecological and economic sustainability can cause problems in the context of sustainable development, as it is understood and interpreted by

81
e.g. the UN Millennium Development Goals (UN 2008), OECD (2001), and Millennium Ecosystem Assessment (MEA 2005). These definitions conflict with the interpretation of sustainable development in the scientific context of this thesis.
Section 4.9.3 present some trends that show the degree to which these policies have contributed to an increased awareness of ecological resources measured in terms of economic contribution to GDP in Sweden and in dif-ferent parts of Europe, and to the objective of being the most competitive and dynamic knowledge-based economy in the world, capable of sustainable economic growth with more and better jobs and greater social cohesion.
4.7.4 LCA in general and applied to milk production The remaining examples (15–25) are related to LCA. Example 15 is a text-book case of LCA. Even in the analysis of technical systems, the methodol-ogy shows severe scientific shortcomings. The authors explicitly mention 11 different ways to solve the allocation problem. This concerns how to divide natural resource use and emissions among a spectrum of co-products. This introduces a significant level of arbitrariness into the methodology. The in-ternal consistency is low, thus LCA does not pass one of the criteria that O’Neill et al. (1986) put forward for when application of a theory or method is relevant in analysis of ecosystems. The conclusion that the internal con-sistency is low follows, as the optional space for the “experimenter” to steer the results is large, due to the multitude of options available regarding the allocation issue.
In example 16, the evaluation of the environmental impact is done in ac-cordance with the logics of Figure 2, see also Example 18 below.
In Example 17 the authors presuppose that the manager in the scenario that resembles organic milk production is substantially less skilful than the manager in the conventional scenario. The latter feeds the cows according to feeding standards, while the former provides 40–50% more feeds than re-quired per kg milk. As most resources and emissions in milk production are related to the feeding intensity, this causes significant errors in all the deliv-ered results.
Example 18 requires a more detailed presentation for two reasons. It con-cerns the core of the thesis – the sustainability contribution of milk produc-tion – and is influential in Sweden and internationally. It essentially relates to two studies performed in the same way in the southern and northern parts of Sweden respectively. A number of dairy farms were analysed, where some produced conventional milk and others produced organic milk. There are major flaws both in the description of the animal production system and in the evaluation of the environmental impacts.
In the description of the animal production system, roughly 50–75% of the dry matter intake was measured through the amount of diesel used on the

82
farm, according to the accounts. The nitrogen content in manure, which is a function of nitrogen influxes in feeds minus effluxes in meat and milk, was not estimated in this way. Instead, the STANK program from the Swedish Board of Agriculture was used in these two studies from 2004 and 2007. The value for nitrogen in manure in STANK is based on a feeding plan for con-ventional milk production from 1996 that assumes protein overfeeding. Thus, the estimates of ammonia emissions for the organic farms were based on data that were about ten years old for conventional milk production with protein overfeeding.
The same data was used to estimate nitrous oxide emissions from manure, an important climate change gas that also contributes to decreasing strato-spheric ozone levels.
The environmental profile of the major protein feed in the organic system was not evaluated due to methodological issues within LCA (the allocation problem, see also comment regarding Example 15). Instead, data for conven-tional soymeal was used despite the fact that soymeal is not accepted in or-ganic production. The soymeal equivalent of the other protein feed was es-timated through the crude protein content. The crude protein levels are quite similar for the two protein feeds. The problem with this is that according to the official protein evaluation system of the time, the nutritive value of the crude protein differs substantially between the two feedstuffs. Thus, given that the protein evaluation system is relevant, the amounts of the protein feeds assumed to be equal, was far from equal in physiological terms.
Thus major parts of the evaluation of the environmental profile of organic milk were based on data for conventional milk production. With some sur-prise it was noted that the environmental profiles obtained for organic and conventional milk production was quite the same...
In these studies 1 kg of organic milk was assumed to be equivalent to 1 kg of conventional milk. This is not correct as the sum of the premium payment from consumers and society for the organic system results in a value per kg milk that is about 30% higher compared to conventional milk. Thus, the two products differ and cannot be compared in this way. The differences between the two systems are further illustrated by Table 4 and 5, Paper VI.
With regard to the evaluation of environmental performance, the default assumption is that there is no variation in the environmental conditions be-tween winter and summer and geographically. Any substance emitted in the production chain anywhere in the global production network that has a ca-pacity to contribute to, e.g. eutrophication, is assumed to do so. Thus, strict additive relations are assumed between compounds and between ecosystems around the globe. From an agricultural perspective, this equals an assump-tion that application of 100 kg of nitrogen in the Pacific Ocean will have the same fertilising effect on the farm in Kil in Värmland as applying the same 100 kg on the fields of that farm. Furthermore, to that effect on that farm in Kil shall be added the fertilising effect of 100 kg of phosphorus applied in

83
the middle of Sahara. And if we solely look at the farm, the ruling assump-tion in LCA is that a further increase of the application of nitrogen by 100 kg per ha, repeated an infinite number of times, will always have the same mar-ginal impact on biological production. Thus, the law of diminishing returns does not exist in LCA, the way it is normally performed.
Furthermore, the impact on biological production of nitrogen is assumed to be indifferent to the phosphorus status of the soil. Thus, the relevance of Liebig’s Law of the minimum is also rejected. The eutrophication of terres-trial ecosystems, of lakes, and of seas is principally the same issue as the issue of plant nutrient supply in agriculture. When an agricultural university in its major research program regarding sustainable food production moves the knowledge frontier regarding the biological significance of plant nutri-ents from that of around the year 2000 to that from 160 years or more earlier in this way, there should indeed be a concern, not only for the university, but for the citizens that ultimately pay the bills. This implies that at least in this context, the work performed at the agricultural university regarding the con-ditions for sustainability, which implies an ambition to reintroduce the im-portance of land as a production factor, in the main ignores the importance of land.
Impact on climate change through deforestation due to increasing amounts of soymeal is not included in these studies. The possibility of pro-duction of ecosystem services is also excluded. Thus, the substantial carbon sink capacity in crop rotation systems with ley and pasture is not accounted for. According to FAO (2006), the mitigation options in global animal pro-duction systems, mainly within ruminant production systems with supporting plant production, equal total emissions of climate change gases. This capaci-ty is ignored in Example 18.
The assumption is that all relations are linear. Humans can only damage ecosystems; all impacts considered are appropriation of natural resources or emissions that cause harm. Consider a thought experiment where all activi-ties in the Baltic Sea Drainage Basin were evaluated by means of LCA. The goal function regarding discharges of nitrogen and phosphorus would then be zero discharges to the Baltic Sea. If achieved, the ecosystems of the Baltic Sea would starve to death.
In these applications LCA has major problems in
representing economic values (compare the assumed equal value of one kg of organic and conventional milk),
representing the animal production system, assuming that for all conven-tional and organic farms in the study, vital environmental aspects were best estimated through data for conventional production from other con-texts in time and space,

84
that the evaluation of environmental effects moved the knowledge fron-tier regarding the biological effects of plant nutrients at least 160 years back in time,
that the evaluation of environmental impacts was based on assumptions that implied major conflicts with known properties of ecosystems.
Examples 20–23 draw heavily on the studies in Examples 5 and 6, and thus the same weaknesses in those studies are reflected in Examples 20–23.
The recommendations in Examples 24 and 25 regarding design of cli-mate-friendly meals are based on the results from several LCA studies.
4.7.5 Summary of examples 1–25 The consequence of the examination of Examples 1–25 is that none of them comply with the principles for sustainable development with respect to its ecological dimensions as expressed by the Millennium Ecosystem Assess-ment (MEA 2005), OECD (2001) and the UN Millennium Goals (UN 2008). Aspects not considered are the limitedness of renewable and non-renewable natural resources; the limitedness in ecosystems assimilative capacity; the typical features of thresholds, irreversibilities, and resilience in ecological-economic systems; and the mutual dependencies between systems and sys-tem levels. The capacity to reflect the value of land is highly restricted.
Examples 1–25 affect measures that directly or indirectly aim at increased ecological sustainability as well as design of environmental policies and strategies among actors in the private and public sphere from the enterprise level to the international community. It is not possible to explore this further within the frame of this thesis. What can be concluded is that at best the cost efficiency of these measures/policies/strategies could be improved. At worst they may increase the speed at which the sustainability of our society is eroded.
The examples all express the problems of methodological extrapolation. They reflect an insufficient understanding of the value of land, and of agri-culture and animal production systems in a sustainable development. How-ever, this is not only an issue within engineering sciences. The next section presents an example from systems ecology where the thesis has the capacity to make a contribution in increasing the understanding of the conditions for sustainable development.
4.8 A safe operating place for humanity An article in Nature (Rockström et al. 2009) discusses the natural boundaries for a safe operating space for humanity over the next 1 000 years. The ambi-

85
tion of the paper is good. Having a background in agriculture, I have closely examined the planetary boundaries relating to the use of phosphorus and nitrogen. The results are disturbing. With the trends in (i) population growth; (ii) increased welfare per capita causing a shift in food intake towards more animal products; (iii) urbanisation; (iv) globalisation with more and more agricultural products traded over increasingly longer distances; (v) the in-creasing demand for bioenergy; and (vi) the limitations of the available land area, we have an increasing demand on biological production per ha land with time. Since the Second World War, mineral fertilisers such as nitrogen and phosphorus have been major means of increasing yields per ha globally. This was a major element in the so-called Green Revolution.
During the 18th and 19th centuries Sweden suffered from starvation. The introduction of crop rotation systems in which nitrogen fixation by legumi-nouses was utilised contributed to eliminating these food shortages.
The food supply perspective related to the biophysical conditions of the planet is not considered in the article. On the subject of plant nutrients it focuses on the wellbeing of water systems, while allocating a lower priority to the biophysical preconditions for the wellbeing of people, including the food supply. Regarding phosphorus, it is the wellbeing of oceans over the next 1 000 years that defines the set boundary, while possible restrictions in agricultural production affecting global food security due to a lack of phos-phorus are ignored. The estimate of global available reserves quoted in the paper is not referenced. It is up to 9.6 times higher than the reserves estimat-ed in U.S. Geological Surveys, and 3.1 times higher than the reserve base estimated by the same source. Estimates suggesting that the phosphorus re-serves will be used up within 100 years are quite common within agricultural sciences.
Regarding nitrogen, the concern is once again the quality of water sys-tems. The planetary boundary suggested implies that the amount of mineral nitrogen fertiliser used globally should be reduced from an application rate of an average of 57 kg per ha arable land to 13 kg per ha. This reduction cannot be compensated by increased use of leguminouses. On the contrary, their contribution should be reduced from 29 to 7 kg nitrogen per ha arable land and year. Thus, in total an average supply of 86 kg nitrogen per ha and year should be reduced to 20 kg per ha and year. This reduces global agricul-tural production substantially in a short time while demands are increasing.
The provided estimate of annual use of nitrogen fertilisers is 80 million tonnes; once again, this is not referenced. A check with FAOstat (2009-11-17) showed that the actual global consumption in 2007 was 111 million tonnes, i.e. close to 40% higher. Thus, the reduction in application rates dis-cussed above is based on conservative and inaccurate estimates. When work-ing with extension services to farmers, it is important to use relevant figures. This is equally important when considering the issue of the management of land on the global level, with the ambition to affect real world policies.

86
The natural boundary presented regarding biodiversity is that the rate in loss of species should be reduced to 1–10% of current rate. This will effec-tively restrict the possibility to increase food production from ecosystems other than agricultural ones. Habitat loss may be the most important factor driving loss of biodiversity, thus the consequence of successful policies re-garding biodiversity is that substantial parts of global terrestrial ecosystems are removed from production purposes.
The restriction related to global climate change will substantially increase demand for biofuels. Given that around 80% of the global energy budget is provided by fossil fuels, and current socioeconomic trends suggest that total energy use will double or more in 35 years (2% yearly growth), the climate change boundary will increase the competition for land, reducing the area of agricultural land available for food purposes. The combined demand for biomass from agricultural land for food and fuel purposes will increase sub-stantially.
Combining the natural boundaries proposed due to biodiversity loss, cli-mate change and eutrophication implies that more biomass should be pro-duced from less remaining productive land, while nitrogen influxes to arable land as the sum from nitrogen fertiliser and leguminouses are reduced from 111 to 21 kg per ha and year, assuming no such influxes to permanent pas-tures, gardens or forests.
If these planetary boundaries regarding plant nutrients were actually in-troduced, then the number of starving people would increase substantially within a year. Within ten years, the global population will have fallen signif-icantly. Lack of energy and food will increase social disorder among people, regions and nations. The biophysical constrains for humanity proposed in the article, if they were effectively implemented, would soon deteriorate the socioeconomic foundations for a safe operating space.35
This shows that the integrated eco-agro-social perspective of the thesis al-so has a contribution to make in this context, increasing the understanding of the importance of land and our land management skills to maintain a safe operating space.
One reason for the limited usefulness of Rockström et al. (2009) is that the article does not consider the importance of land and agricultural expertise when discussing global food security. Agriculture is possibly the most im-portant system that mediates global biophysical conditions, defining a safe operating place for humanity (see Figure 1). Thanks to agriculture, this oper-ating space has been enlarged by a factor of 100 to 1 000 times (Paper I). Animal production systems play a major role in this (Paper VI). This insight regarding the importance of agriculture is reflected in the Millennium De-velopment Goals of the UN and the order by which MEA (2005) presents
35. See http://blogs.nature.com/climatefeedback/2009/09/planetary_boundaries_1.html, ac-cessed 2009-11-15, contribution dated 20th of October 2009.

87
ecosystem services that support human wellbeing. Here, I conclude that the biophysical limits for humanity that Rockström et al. have defined are flawed due to the fact that (i) they have not included the significance of agri-culture and food for humanity in their analysis, and (ii) they have not utilised competences within agricultural sciences in the process of generating the biophysical boundaries.
Moreover, the system perspective could have been stronger. For three boundaries they conclude that critical thresholds have been trespassed, re-garding climate change, eutrophication, and loss of biodiversity. Their mes-sage is that we need to tether global society to these boundaries in order to have the possibility to continue a positive social and economic development. However, according to their analysis, the combined measures that are needed in order to achieve a safe operating space regarding these three aspects would instead increase the threats to global sustainability by substantially reducing global food security.
This shows that the performed analysis has provided results that conflict with the very purpose of the work. Boundaries proposed with the aim of securing human wellbeing will severely damage human wellbeing within a few years if converted into efficient measures. With a stronger system per-spective, humanity and agriculture had been considered in the analysis. The current analysis focuses on the conditions of global biophysical and ecologi-cal systems within a time frame of 1 000 years, while the impacts on human-ity over the next ten years if the proposed boundaries are enforced are not analysed.
This is not merely an academic discussion. In different contexts in Swe-den and internationally, the findings of this article are being presented as something that has to be addressed in its entirety and in an integrated man-ner, to secure global social and economic development within ecological sustainability limits.
The thesis makes a contribution regarding both the knowledge of agricul-tural systems and the system perspective on biophysical conditions, humani-ty and a safe operating space, compared to the way these aspects were treat-ed in Rockström et al. (2009).
4.9 Some applications and their implications The thesis and its papers make contributions in two fields, the design of feeding rations to dairy cows that support the economic result and natural resource efficiency, and methods for evaluation of systems sustainability performance. On a high system level the findings contribute and agree well with policy contexts such as the UN Millennium Development Goals, the principles for sustainable development put forward by OECD, Millennium Ecosystem Assessment, the initiative “Beyond GDP”, FAO and its percep-

88
tion of the role of animal production in a sustainable future, “The Economics of Ecosystems and Biodiversity” (TEEB), and the risk analysis of the global economy launched at World Economic Forum36. Thus, on a general policy level there is no major tension between the thesis and the current discourse.
There are substantial tensions between the findings presented and meth-ods and approaches that dominate on the operative level. This section pre-sents some applications of the methods presented and their consequences in different contexts. The applications are sometimes in the role as consultant. This means that the following information may suffer from self-reporting bias. No scientific proofs are presented. However, it still contributes to a test of the relevance of the applied methods and the ways in which they have been applied in real world situations. When dealing with such complex sys-tems as are typical when the issue concerns aspects of a sustainable devel-opment, the relevance of the work for the system and issue at hand is equally important as high standards of the work in relation to traditional scientific criteria (Giampietro 2003). In the following, the information is based on official statistical sources when possible in order to reduce the space for subjective bias.
The following tables and figures provide some information supporting a relevance test of the thesis and some of its central parts.
4.9.1 Dairy production and environmental objectives Table 6 shows the results from a regression between number of dairy cows and time based on data from the Swedish Board of Agriculture for the period 1981–2010.
36. Most of these contexts are presented earlier in the thesis or in the included papers. Regard-ing Beyond GDP, see http://www.beyond-gdp.eu/; TEEB, see http://www.teebweb.org/ wpcotent/uploads/Study%20and%20Reports/Reports/Synthesis%20report/TEEB%20Synthsis%20Report%202010.pdf; and the risk report from World Economic Forum, see http://www.weforum.org/reports/global-risks-2012-seventh-edition; all accessed 2013-01-02.

89
Table 6. Regression between number of dairy cows and time based on data from the Swedish Board of Agriculture for the period 1981–2010.
Regression
Predicted year for the vanish of last dairy cow
County Stockholm y = -319.92x + 13001 R² = 0.969 2020.6
Västmanland y = -366.53x + 15191 R² = 0.9852 2021.4
Värmland y = -516.51x + 22907 R² = 0.9865 2024.3
Södermanland y = -609.41x + 1E+06 R² = 0.9751 2024.8
Örebro y = -437.71x + 19835 R² = 0.9768 2025.3
Dalarna y = -415.49x + 19040 R² = 0.9875 2025.8
Västernorrland y = -407.11x + 18714 R² = 0.9603 2026
Norrbotten y = -340.16x + 15906 R² = 0.9647 2026.7
Gävleborg y = -464.18x + 21767 R² = 0.98 2026.9
Blekinge y = -237.83x + 11185 R² = 0.985 2027
Västra Götaland y = -2338.3x + 125310 R² = 0.9731 2033.6
Skåne y = -1423.3x + 79975 R² = 0.9797 2036.2
Västerbotten y = -459.74x + 25925 R² = 0.9322 2036.4
Jämtland y = -301.52x + 17200 R² = 0.9752 2037
Kronoberg y = -430.38x + 24991 R² = 0.9273 2038.1
Östergötland y = -532.62x + 40059 R² = 0.9208 2055.2
Uppsala y = -491.31x + 997288 R² = 0.971 2056.3
Jönköping y = -549.12x + 45338 R² = 0.9293 2062.6
Halland y = -342.4x + 34680 R² = 0.7933 2081.3
Gotland y = -195.39x + 21608 R² = 0.8944 2090.6
Kalmar y = -380.2x + 50002 R² = 0.8693 2111.6
Dairy cooperative "Milko" y = -2104.8x + 99628 R² = 0.9923 2027.3
"Norrmejerier" y = -799.9x + 41832 R² = 0.9506 2032.3
"Skånemejerier" y = -1423.3x + 79975 R² = 0.9797 2036.2
Sverige y = -11559x + 674451 R² = 0.9786 2038.3
"Arla" y = -7231.1x + 453016 R² = 0.971 2042.6 x in the equations refers to the number of years after 1980. The information in Table 6 should not be interpreted literally. It is not a pre-diction of when the last dairy cow will disappear in different regions. In-stead, it shows what will happen if the same trends that operated from 1981 to 2010 were to continue. Nobody knows whether they will.

90
Figure 11 illustrates these trends.
Figure 11. Number of dairy cows in the county of Värmland and Dalarna,
1981–2012. Data from http://statistik.sjv.se/Dialog/Saveshow.asp, accessed 2014-02-17
The results in Table 6 and Figure 11 are concerning. Dairy cows are of cru-cial importance for achieving four of the sixteen national environmental objectives37, namely
Number 1, reduced climate impact, where the first paragraph explains its meaning as “In accordance with the UN Framework Convention on Cli-mate Change, concentrations of greenhouse gases in the atmosphere must be stabilised at a level that will prevent dangerous anthropogenic interference with the climate system. This goal must be achieved in such a way and at such a pace that biological diversity is preserved, food pro-duction is assured and other goals of sustainable development are not jeopardised. Sweden, together with other countries, must assume respon-sibility for achieving this global objective.” 38
Number 8, flourishing lakes and streams: “Lakes and watercourses must be ecologically sustainable and their variety of habitats must be pre-served. Natural productive capacity, biological diversity, cultural herit-age assets and the ecological and water-conserving function of the land-
37. See http://www.miljomal.nu/sv/Environmental-Objectives-Portal/, accessed 2013-01-02. 38. See http://www.miljomal.nu/sv/Environmental-Objectives-Portal/, accessed 2013-01-02.
-5000
0
5000
10000
15000
20000
25000
1980 1982 1984 1986 1988 1990 1992 1994 1996 1998 2000 2002 2004 2006 2008 2010 2012 2014 2016 2018 2020 2022 2024 2026
No
of d
airy
cow
s
Dairy cows in the county of Värmland and Dalarna respectively, 1981-2012,R2-value for the trends are 0.98 in Värmland and 0.99 in Dalarna
Värmlands län
Dalarnas län
Värmland trend
Dalarna trend

91
scape must be preserved, at the same time as recreational assets are safe-guarded.”
Number 13, a varied agricultural landscape: “The value of the farmed landscape and agricultural land for biological production and food pro-duction must be protected, at the same time as biological diversity and cultural heritage assets are preserved and strengthened.”
Number 16, a rich diversity of plant and animal life: “Biological diversi-ty must be preserved and used sustainably for the benefit of present and future generations. Species habitats and ecosystems and their func-tions and processes must be safeguarded. Species must be able to survive in long-term viable populations with sufficient genetic varia-tion. Finally, people must have access to a good natural and cultural environment rich in biological diversity, as a basis for health, quality of life and well-being.”
One kg of milk produced in Sweden maintains 1–2 m2 agricultural land in production forms that support environmental objectives related to biodiversi-ty and the preservation of the cultural landscape.
Society has decided on these environmental objectives, with the ambition to achieve them in one generation. It is a policy failure when current trends in one agricultural production branch crucial for their success, dairy produc-tion, are such that in those regions where this production is vitally important for success, linear trends are unbroken since 1981, suggesting that the last dairy cow will disappear within half a generation. The counties within the area of the former dairy cooperative Milko, i.e. Värmland, Dalarna, Väster-norrland, Gävleborg and Jämtland, had a higher rate of annual decline of dairy cows compared to the counties whose farmers delivered to the three largest Swedish dairy cooperatives in 2011.
Papers V and VI showed that increased milk production in the former Milko area makes a substantial contribution to vital global sustainability goals such as food security. Paper VI also showed large positive societal welfare effects of milk production in this area compared to other areas in Sweden with substantially higher contributions to eutrophication of the Bal-tic Sea per kg milk delivered.
Thus, milk production in these counties is competitive in its delivery of the ecosystem services that society demands, expressed through national environmental quality objectives. The problem is that these farmers are not paid for the societal value of their production.
Based on current trends, the last dairy cow will leave a number of coun-ties in 10 to 15 years. In many of them, continued dairy production is neces-sary to reach four of the environmental objectives decided by the national parliament. Furthermore, in the same areas the contribution per kg of milk to the eutrophication of the Baltic Sea is substantially lower than in other areas

92
that have benefited from subsidised extension services in the program Focus on Nutrients for a long time. The societal value of the lower contribution to eutrophication is in the range of 30–60 000 SEK per dairy cow in some of these regions, following the calculation route laid out in Paper VI.
An interesting initiative was undertaken by local retail stores in Jämtland in the summer of 2012. They offered customers the option to pay more for their milk, on the condition that the extra money was transferred to local milk producers. The customer demand for the more expensive milk in-creased. This indicates that people are concerned about current trends and are willing to pay to maintain local milk production. The initiative was communicated via the motto “Milk is thicker than water” (“Mjölk är tjockare än vatten”), to underline the situation where water is more expensive in shops per litre than milk. This situation was already noted in 1970 (Jansson 1970).
Finally, maintaining dairy production contributes to a landscape which is attractive for permanent living as well as for tourists. Many of the regions in Table 6 such as Dalarna, Värmland and Jämtland are dependent on tourism.
These aspects, added to the environmental objectives underline the severi-ty of this policy failure. Despite the delivery of a spectrum of ecosystems services of societal importance, the total impact of the incentives that society provides are such that the objectives that society has decided on cannot be reached.
4.9.2 Value of ecosystem services and the 4P principle It is not certain that the main policy failure is within agricultural policy. Eco-systems deliver ecosystem services. As around 75% of terrestrial land in Sweden is classed as agricultural land or forests, most of the total production of ecosystem services originates from agriculture and forestry. Globally, the corresponding value is 70%. A sustainable situation is at hand when the total consumption of ecosystems services is within the sustainable production level. One major incentive towards achieving this is to adjust the prices of goods and services so that they reflect the value of positive and negative ecosystems and human health impacts (OECD 2011). FAO (2006), Millen-nium Ecosystem Assessment (MEA 2005), and TEEB39 make similar pro-posals.
Hellstrand (1998) suggested a solution based on the Precautionary Pollut-er Pays Principle (the 3P principle) (Costanza and Perrings 1990; Costanza 1994). The 3P principle integrated the precautionary and the polluter pays principle into a market based insurance solution. The 3P principle made it rational for enterprises to reduce (the risk of) human and ecosystem health
39. http://www.teebweb.org/wp-content/uploads/Study%20and%20Reports/Reports/ Synthesis%20report/TEEB%20Synthesis%20Report%202010.pdf, accessed 2014-02-18.

93
damages caused by production. It also provided incentives where enterprises benefitted from actions that reduced the uncertainty regarding possible nega-tive external impacts of production. However, one piece of the puzzle was still missing. The 3P principle did not link the consumption of environmental space to its production, i.e. it did not link consumption of ecosystem services to production. The 4P principle (the Precautionary Polluter Pays the Prevent-er/the Polluted Principle) however does this, within production levels set by affected ecosystems carrying capacity limits (Hellstrand 1998). The potential contribution of the 4P principle was discussed in relation to aspects such as cadmium fluxes in the food system with its impacts on human health, the depression of photosynthesis and thus production in forestry and agriculture as a result of ozone close to the ground due to emissions from society, car-bon sinks in forestry, and production permits to the forestry industry based on the so-called best available technology principle.
The 4P principle stresses the importance of not only utilising environmen-tal fees and taxes but also reward systems when actors take measures to im-prove the environment and the production of ecosystem services40. In theory, with this kind of principle an insurance solution is enforced where environ-mental as well as human health risks of production systems are internalised in the price. Actors that harm the environment or/and human health are forced to pay those that bear the costs. Finally, in this system actors that produce ecosystem services that enhance the sustainability basis of society are paid for this production. In fact, the 4P principle provides a frame where for example, trading systems for emissions are anchored in the carrying ca-pacity limits of affected ecosystems. By doing so, the market mechanism is used to enhance social and economic development in affected systems with-in ecological and human health limits. Solutions that provide low satisfaction of human needs per unit emissions will then be outcompeted while solutions that provide high satisfaction of human needs per unit emission are favoured. At the same time, this system suggests how the total amount of emissions can be captured within the carrying capacity of affected ecosystems. It pro-vides incentives where managers of ecosystems are encouraged to improve the production of ecosystem services, and it provides incentives favouring technological development and innovation favouring social and economic development within sustainability limits of affected ecosystems41
40. The issue of externalities and how to price them has been discussed for a long time within economics. 41. This concept has been treated at a conference and a workshop at the Swedish Royal Acad-emy of Forestry and Agriculture. The exercises are documented in separate reports, see Jakten på den gröna marknadskraften, samt Jakten på den gröna marknadskraften del 2 in separate issues of KSLAs Tidskrift. The first report is also available in English, The Search for green market forces. Links to these reports are http://www.ksla.se/publikationer/kslat/kslat-1-2006/; http://www.ksla.se/publikationer/kslat/kslat-6-2008/; http://www.ksla.se/publikationer/kslat/ kslat-1-2006-eng/, all accessed 2013-01-03.

94
The Swedish ecological-economic system combines industrial sectors with high resource and emission efficiency, and ecosystems/recipients with higher remaining assimilative capacity compared to most other developed nations. The latter aspect is mainly a function of the low concentration of humans per ha of biologically productive ecosystem. The share of land area where deposition of nitrogen exceeds critical thresholds is substantially low-er in Sweden compared to most EU countries (Figure 12).
Figure 12. The exceedance of critical loads for eutrophication around Europe for
the base year 1990 and target year 2010 of the Gothenburg Protocol. Source: Pleijel (2007).
Figure 12 shows a huge variation in the degree to which critical loads, i.e. assimilative capacity limits, are trespassed in Europe. In the most densely populated areas, which also have the highest economic activity per area unit, the critical load is trespassed for 100% of the area of ecosystems.
Emissions to air also have human health impacts. They were estimated to cause around 400 000 deaths in the year 2000 in the EU. The annual cost to society of this level of health impacts has been estimated at 270 to 880 bil-lion € (EU-Commission 2005).
The spatial variation in air emissions is similar to the one in Figure 13. Thus, in the most densely populated areas with the highest economic activi-ty, the expected lifespan is expected to be reduced by 1–3 years due to emis-sions to air. In the three largest cities in Sweden the reduction is 6–9 months, while in the majority of Sweden it is 0–4 months (personal communication; Grennfelt 2009).

95
Figure 13. Loss in statistical life expectancy in Europe in 2000 due to
emissions of particles (PM2.5) in months.
The concentration of ecosystem and human health impacts in areas with the highest level of economic activity per area unit in combination with the high economic costs in terms of e.g. human health impacts suggests that econom-ically efficient policies for sustainable growth in Sweden and the EU would improve the competitive power in rural areas in Sweden in two ways:
1. Through payment for the production of ecosystems services such as the annual sink of around 170 million tonnes of carbon dioxide via photo-synthesis in Swedish forests.
2. Through the competitive advantage of industries via the combination of resource and emission-efficient industrial plants located such that the negative pressure is zero or significantly lower compared with identical industrial plants located in areas with high economic activity per area unit with a corresponding high environmental and human health load (see Figures 12 and 13; Hellstrand 1997 and 1998 treat this issue).

96
Incentives with the characteristics of the 4P principle would work via these two paths. At the same time, they would favour cost-efficient measures that help the adaptation of those urban/industrial regions to human health and ecosystems carrying capacity limits where they are now trespassed. This implies that the costs of such measures are allocated in those urban areas where the contribution to GDP will be somewhat lower when the ecosystem and human health impacts are internalised in the price mechanism, improv-ing the environment and increasing expected average lifetime.
Table 7 shows the impact of economic development, from local to nation-al level, of incentives internalising external environmental and human health effects.
Table 7. Sustainability accounts regarding climate change gases in the local community Kil, the county of Värmland, Stockholm, and Sweden.
Million kg Balance
Assimilative capacity (i)
Consumption (i.e. emissions caused by final energy use (ii))
Million kg (i minus ii)
Value, million SEK
Value, SEK per inhabitant
Kil 194 44 150 225 19 206
County of Värmland
11 849 2 013 9 837 14 755 53 995
County of Stockholm
2 814 4 277 -1 462 -2 194 -1 068
Sweden 168 545 63 347 105 198 157 798 16 759
The assimilative capacity of carbon dioxide in forests is estimated via the chemical formula for photosynthesis, where sunlight + 6 molecules of water + 6 molecules of carbon dioxide result in 6 molecules of oxygen released to the atmosphere, and the production of biomass via the molecule of sugar that result from this process. The total annual forestry photosynthesis is estimated via annual growth of Swedish forests according to official statistics. It is assumed that the total biomass production is 1.7 times the estimate of annual growth, which is measured in m3sk. This volume measure is converted to weight considering the distribution of different types of trees with their dif-ferent densities.
Every kg of biomass (dry matter) stores the equivalent of 1.8 kg of carbon dioxide and contains around 17 MJ of chemical energy. Thus, on the nation-al scale in Sweden, photosynthesis in forests produces 92 million tonnes of biomass, converts solar energy to 434 TWh of chemical energy, and releases 123 million tonnes of oxygen to the atmosphere, making life on land possi-ble for humans and other animals. In the same process, 169 million tonnes of

97
carbon dioxide are captured. As a comparison, total final use of energy in Sweden in 2009 was 376 TWh42.
Emissions of climate change gases are estimated from emission factors for different types of energy carriers from the Swedish Environmental Pro-tection Agency, and data on final use of energy are estimated from data on different energy carriers from Statistics Sweden. One major point that Table 7 communicates is the structure of the analysis where production of envi-ronmental services is compared to consumption, resulting in a sustainability balance, where this follows the same structure as when construction e.g. feeding plans in animal husbandry and fertilisation plans in crop production.
Official measures of total emissions of climate change gases in Sweden are 55–60 million tonnes carbon dioxide equivalents annually43. The estimate in Table 7 of a carbon sink of close to 170 million tonnes in Swedish forest annually suggests that in fact Sweden now have a substantial negative cli-mate gas balance that neutralises emissions from nations that are net-emitters.
The estimate of 55–60 million tonnes carbon dioxide emitted in Sweden should however be increased. The estimate of 170 million tonnes as a sink considers the total photosynthesis in forests. In order to treat related subsys-tems with internal consistency, all the emissions when using e.g. biofuels should be considered. When doing so and using the best data I can find in 2014, total emissions in Sweden is increased to around 100 million tonnes of carbon dioxide equivalents. Still, the negative balance is substantial.
Thus, current climate policies in Sweden aiming at achieving climate gas neutrality within some decades, reflects an unawareness of the nature of the systems discussed.
The value is estimated from the price of 1.5 SEK per kg carbon dioxide. This is a measure used by Swedish authorities when estimating welfare ef-fects of emissions (SIKA 2009).
The sustainability accounts for climate change gases follow the structure of analytical and management tools that have been used and developed for decades and centuries in agriculture and forestry in Sweden, capturing com-bined biological/ecological and economic performance. They follow the logic of the biophysically anchored production functions developed in Paper II and the system boundaries and rules of aggregation in conventions regard-ing systems of national accounts. This is a contribution to systems of “cli-
42. The two estimates cannot be directly compared as not all of the chemical energy produced via photosynthesis can be utilised by the economy because of economic and ecological re-strictions. Furthermore, correction for different energy qualities has not been made. Still, this provides a basis for the first step in an evaluation of the sustainable capacity of our forests to produce energy to substitute fossil fuels. 43. See e.g. Swedish Environmental Protection Agency, National Inventory Report 2012 Sweden, Submitted under the United Nations Framework Convention on Climate Change and the Kyoto Protocol (SEPA 2012).

98
mate change accounts”44 which supports an adoption of current dominating modes to known properties of forestry and the forestry industry, where there is no longer a need to assume that when a tree is cut down, all of its carbon is immediately and completely oxidised to carbon dioxide. If that were the case IKEA could not sell any wooden furniture, and there would be no houses built from wood. Table 7 indicates that it may be a smart option to include wood products in society as a carbon sink among systems for Carbon Cap-ture and Storage (CCS). In so doing, Sweden and its forest sector and forest industry could sell three functions in the same product, the traditional func-tion of a table made of wood, the 1.8 kg of carbon dioxide stored in every kg of wood (dry matter) and the 17 MJ of renewable energy also stored in every kg.
Table 7 and Figures 12 and 13 suggest that when positive and negative external effects are adequately considered in the price, regions and nations that combine a high production of ecosystems services with resource and emission-efficient industries will have a good development. Regions and nations that are worse off at the beginning, is stimulated by a price internal-ising external effects to find cost-efficient measures improving their situa-tion.
Recently, Sveaskog and LKAB, with support from Pricewaterhouse-Cooper, have developed a system for payment for ecosystem services. The mining company LKAB is increasing its production due to the increasing demand from China. Their carbon dioxide emissions will therefore also in-crease. At the same time the emissions permits within the EU trading system are being reduced. One way to deal with this is to pay for measures that in-crease the carbon sink in the forest of Sveaskog45.
This is in line with concepts introduced in the environmental report of AssiDomän for the year 1997 (AssiDomän 1998). Hellstrand et al. (1998) performed a study in which the environmental space of the forest of Assi-Domän generated by the production of ecosystem services was estimated. At that time, the company owned over 3 million ha forest land, i.e. more than 10% of the total forestry area in Sweden. The production of environmental services in the forests was reduced by the consumption due to actions such as felling and the transporting of trees and the activities in pulp and sawmills. This work delivered the first estimates of the company’s eco-efficiency. That work was one element inspiring the proposal of the 4P-principle in Hellstrand (1998), which then resulted in one conference and
44. See e.g. Swedish Environmental Protection Agency, National Inventory Report 2012 Sweden, Submitted under the United Nations Framework Convention on Climate Change and the Kyoto Protocol. 45. See http://www.sveaskog.se/press-och-nyheter/pressmeddelanden/2011/lkab-koper-kol-dioxidkrediter-av-sveaskog/, accessed 2013-01-04.

99
one workshop at the Swedish Royal Academy of Forestry and Agriculture (2005 and 2007) under the title the Search for Green Market Forces46.
Sveaskog now owns the majority of these forests. The initiative between Sveaskog, LKAB and PWC follows the logics outlined in the work by Hell-strand (1998) and Hellstrand et al. (1998).
4.9.3 Do economic trends show increasing value of land? This section presents a number of economic trends. Its purpose is to investi-gate whether an increasing value of land is expressed, i.e. an increased value of ecological resources. One reason that this could be the case is that a sus-tainable development within affected ecosystems carrying capacity limits is a general objective within UN, OECD, the EU, Sweden, and its region from around the year 2000 (Hellstrand 2005b).
Figure 14 presents the development of the contribution to GDP from dif-ferent sectors in Sweden from 1993 to 2012.
Figure 14. Contribution to GDP in Sweden from acreage-dependent sectors,
forest industry, food industry, production of goods, production of services, and GDP, 1993–2012. Data from www.scb.se, accessed 2014-02-19.
In nominal prices, the contribution to GDP from acreage-dependent sectors in Sweden from 1993 to 2012 has increased by a factor 1.27, in the mean- 46. For documentation from these events, see http://www.ksla.se/publikationer/kslat/kslat-1-2006/, http://www.ksla.se/publikationer/kslat/kslat-6-2008/, and http://www.ksla.se/publika- tioner/kslat/kslat-1-2006-eng/, the last in English, all accessed 2013-02-19.
Producers of services; 2,63
GDP at market prices; 2,26
Producers of goods; 2,05
Food industry; 1,72
Forestry industry; 1,38
Agriculture, forestry, fishing; 1,27
0,00
0,50
1,00
1,50
2,00
2,50
3,00
1993 1994 1995 1996 1997 1998 1999 2000 2001 2002 2003 2004 2005 2006 2007 2008 2009 2010 2011 2012
Trend 1993 to 2012, GDP/contribution to GDP nominal values some sectors of the Swedish economy, 1993 is reference-year, value 1.00

100
time the the forest industry sector and the food industry grew by 1.38 and 1.72-fold respectively. In total beneficial production increased by 2.05 times, and GDP increased 2.26-fold. Service sectors increased by a factor of 2.68.
Figure 14 shows that since around 1995 the acreage-dependent sectors in Sweden have not grown in nominal prices, and that from around 2000 the forestry industry has substantially decreased its contribution to GDP. The food industry has also shown low growth similar to the acreage-dependent sectors since around 2000.
This can of course be understood as an example of what happens in grow-ing economies, where the importance of acreage-dependent sectors in the economy decreases first, followed by industrial sectors, while the importance of service sectors increases.
At the same time, the sustainability issue suggests that this trajectory of developing economies has hidden external costs where the economy may eventually move outside a safe operation space for humanity as defined by Rockström et al. (2009). According to Odum (1989), OECD (2001), FAO (2006), MEA (2005), TEEB (2010), a prerequisite for sustainable develop-ment is that external effects are considered, including payments for ecosys-tem services that constitute the ecological sustainability of society.
From this perspective, if efficient incentives for sustainable development were implemented around 2000 when sustainable development emerged as an overall societal goal, then they would have had an impact on economic trends. Growth of acreage-dependent sectors would have increased due to their production of ecosystem services, and forestry and food industries would have increased in size due to their combination of “embodied” envi-ronmental values47, often resource- and emission-efficient production sys-tems, and their location where remaining assimilative capacity is high.
The trends in Figure 14 show that this did not happen. It may be that cur-rent societal development in Sweden is quite sustainable. The trends may also reflect that current incentives do not efficiently promote sustainable development in which positive and negative external impacts are internal-ised. This issue requires further studies.
Figure 15 shows the relation between the share of the regional economy that comes from the production of goods in 1993, and the regional economic development from 1993 to 2009.
47. Forestry products are also a carbon sink. Every kg of milk typically contributes around one square meter of agricultural land supporting biodiversity.

101
Figure 15. The relationship between share of (contribution to) GDP from
production of goods in 8 regions in Sweden in 1993 and growth of GDP 1993–2009, reference value is 1.00 for the year 1993.
From 1993 to 2009, the growth in those regions in Sweden that in 1993 had a regional economy with a high share of production of goods was substan-tially lower compared to other regions.
The regions in Figure 15 with the lowest growth from 1993 to 2009 are the northern parts of Svealand and the southern and middle parts of Norr-land. These regions combine a high production of ecosystem services per inhabitant (because they have a large area of productive ecosystems per in-habitant), low environmental load of ecosystems (Figure 12), low decrease of expected lifespan due to emissions to air (Figure 13), and an economy where the base industry, such as forestry, mining and steel industry is more important than in other regions.
I suggest that if efficient incentives internalising positive and negative environmental and human health effects had been implemented, then the economic development in these regions had been better. Thus, the trends in Figures 14 and 15 suggest that there is an implementation issue in Sweden regarding sustainable development. The trends in Figures 14 and 15 are not surprising given the outcome of the analyses in Papers II, VI and section 4.7, regarding the lack of capacity of different methods to evaluate real impacts of production in real ecosystems, where this lack of capacity is converted to environmental policies based on the logics of these methods.
Figure 16 presents the contribution to GDP from acreage dependent sec-tors from 1970 to 2011 in Sweden, Northern Europe, Western Europe, Eu-rope, North America, Asia, Africa and the world.
y = -2,928x + 2,7264R² = 0,8555
0,00
0,50
1,00
1,50
2,00
2,50
0,00 0,05 0,10 0,15 0,20 0,25 0,30 0,35 0,40
GDP
2009
/199
3
The share of the regional contribution to GDP in 1993 from production of goods (SNI-kod 01-45)
Regression between share of (contribution to) GDP from production of goods in 8 regions in Sweden in 1993 and growth of GDP 1993 to 2009, reference value 1,00 for the year 1993;
Processing of data from www.scb.se, accessed 212-07-27
GDP 2009/1993
Linjär (GDP 2009/1993)

102
Figure 16. The contribution to GDP from acreage-dependent sectors 1970–
2011 in Sweden, Northern Europe, Western Europe, Europe, North America, Asia, Africa and the world as shares of GDP.
Figure 16 shows that the general trend in the economies investigated is that the share of acreage-dependent sectors in GDP is decreasing. Europe and Africa follows a somewhat different pattern. It does not support the conclu-sion that policies for sustainable development in general have increased the value of the fluxes of ecosystems services from the stock of natural capital land. Ecosystem services (MEA 2005) are e.g. clean water; food; forestry products; capacity to take care of emissions and discharges to water, air and land; aesthetic values.
Figure 17 shows the development over time of the contribution to GDP from acreage-dependent sectors in Sweden, Northern Europe, Western Eu-rope, Europe, North America, Asia, Africa and the world.
0,000
0,020
0,040
0,060
0,080
0,100
0,120
0,140
0,160
0,18019
7019
7119
7219
7319
7419
7519
7619
7719
7819
7919
8019
8119
8219
8319
8419
8519
8619
8719
8819
8919
9019
9119
9219
9319
9419
9519
9619
9719
9819
9920
0020
0120
0220
0320
0420
0520
0620
0720
0820
0920
1020
11
Agriculture, forestry, fishing, hunting as share of GDP;data from UNstats accessed 2012-12-28
Sweden
North Europe
Western Europe
Europe
North America
Asia
Africa
World

103
Figure 17. Contribution to GDP from acreage-dependent sectors in Sweden,
Northern Europe, Western Europe, Europe, North America, Asia, Africa and the world 1970–2011, fixed price. Relative to a value 1.00 in 1970.
The lowest growth in the contribution to GDP from acreage-dependent sec-tors in this period was in Sweden, followed by different regions in Europe, while Africa, Asia, North America, and the world had a substantially higher growth (Figure 17).
The information provided in Tables 6 and 7 and in Figures 12–17 support the following conclusions:
Global trends do not reflect an increased value of land due to incentives effectively internalising positive and negative human health and envi-ronmental impacts.
There are substantial welfare economic advantages in rural regions in Sweden and in their agriculture and forestry due to human health and environmental aspects.
When discussing the Northern parts of Svealand and the southern and middle parts of Norrland the following can be added. The environmental load is lower than in other areas, the human health impact of emissions is lower, the positive contribution to national environmental objectives is higher, and the environmental load in terms of eutrophication of the Bal-tic Sea per kg milk produced is lower than in other regions. Despite this the development of the regional economy and of milk production, the most important agricultural production branch, is weaker/more negative in these areas than in other areas of Sweden.
0,00
0,50
1,00
1,50
2,00
2,50
3,00
3,50
4,00
1970
1971
1972
1973
1974
1975
1976
1977
1978
1979
1980
1981
1982
1983
1984
1985
1986
1987
1988
1989
1990
1991
1992
1993
1994
1995
1996
1997
1998
1999
2000
2001
2002
2003
2004
2005
2006
2007
2008
2009
2010
2011
Contribution to GDP, fixed price, 1970-2011, from agriculture, forestry, fishing, hunting, 1970 reference-year value 1,00;
data from UNstats accessed 2012-12-28
Sweden
North Europe
Western Europe
Europe
North America
Asia
Africa
World

104
In Sweden and in Northern and Western Europe, the contribution to GDP from acreage dependent sectors is low and falling as a share of the economy as a long-term trend.
One explanation is if policy measures in the private and the public sphere aiming at sustainable development from regional and national to EU level express substantial weaknesses in their capacity to capture the relations between ecological, economic and social systems.
The results presented above suggest that the overall incentive structure may still neglect vital aspects of the production factor land. If so, the fast decline in the number of dairy cows in regions in Sweden where their marginal contribution to
o global food supply (Papers V and VI), and to
o the fulfilment of national environmental objectives is substantial,
can to a significant degree be a function of policies on higher levels than the European Agricultural Policy, such as general economic poli-cies, environmental policies, and policies for sustainable development.
The tables and figures presented here may reflect policy failures on higher policy levels, impairing the capacity of agriculture and rural areas to make their full and important contribution to the ecological sustainability basis of society.
4.9.4 ISO 14 001 and ecosystems In 2010, organisations behind the ISO 14 000 system initiated the first major revision since it was introduced in 1996. ISO 14 040 and ISO 14 044 give rules regarding how to perform Life Cycle Assessments (LCA). The ap-proach of LCA and the method itself are influential in environmental poli-cies in Sweden and the EU, not least within agriculture.
Eleven challenges are to be handled, concerning environment manage-ment systems (EMS)48:
1. EMS as part of sustainability and social responsibility
2. EMS and (improvement of) environmental performance
3. EMS and compliance with legal and other external requirements
4. EMS and overall (strategic) business management
5. EMS and conformity assessment 48. ISO/TC 207/SC 1 Future challenges Study group N 9. Final report on the future challeng-es of EMS and ISO 14001.

105
6. EMS and the uptake in small organizations
7. EMS and environmental impacts in the value/supply chain
8. EMS and engaging stakeholders
9. EMS and parallel or sub systems (GHG, energy)
10. EMS and external communication (including product information)
11. Positioning of EMS in (inter)national policy agendas
The text explaining these challenges shows that future credibility is depend-ent on a capacity to actually contribute to a better environment in the future. The focus of ISO 14 001 from 1996 is the efficiency in the internal admin-istration of internal environmental policies. There has been a demand to ac-tually perform an analysis of the environmental performance of the ISO 14 001 system. However, no criteria have been put forward regarding the content and quality of this analysis. Knowing this, and given the influence in public and private spheres in Sweden and in the EU, the low capacity to actually translate unique environmental assets to improved economic results in agriculture as well as enterprises in other sectors areas where the envi-ronmental factor implies a competitive advantage given effective policies for sustainable development is not surprising.
This is a concern because since around the year 2000 there has been an ambition in the EU, Sweden, and Swedish regions to secure future interna-tional competitive power and domestic economic growth via policies for environmentally driven businesses. As shown in previous sections, a number of policies aimed at environmentally driven growth are based on LCA and the information this methodology provides about systems sustainability-performance.
One example is the criteria for public procurement from SEMCO (Miljöstyrningsrådet) of dairy production, where in the Swedish version the criteria proposed regarding climate change are results from analyses in ac-cordance with the IS0 14 040 serie. Another example is the research program FOOD 21 in Sweden which started in 1997, which used LCA in accordance with ISO 14 040 and ISO 140 44 as the methodology to evaluate sustainabil-ity performance of animal production systems. This program now influences climate change policies in Sweden regarding ruminants as well as the IPCC strategy for bioenergy. Section 4.7, Paper II and Paper VI analysed weak-nesses of LCA and the way that it analysis impacts of production in affected ecosystems.
The consequence is that current climate change policies regarding animal production systems in Sweden and internationally, as well as policies for environmentally driven growth, are based on the logic and results from a methodology from 1996 onwards, where the organisation responsible for the

106
guidelines regarding how to perform the analysis is now concerned with its lack of capacity to credibly handle environmental impacts of production.
To avoid any misunderstanding, I do not argue that agriculture should al-ways be the major economic sector measured in GDP terms. My argument is that when going from an economic system that ignores the value of land, i.e. the ecological dimension of the economy, towards a sustainable economy where economic and social development are within affected ecosystems carrying capacity limits, it is probable that trends that have dominated for several decades in developed nations, with declining contribution to GDP from acreage dependant sectors will be influenced, and that this will be ex-pressed in the type of analyses presented above. Furthermore, if the ambition of society to facilitate sustainable growth is to a significant degree based on methods that lack the capacity to capture the characteristics of ecosystems and the potentials for sustainable development that they provide, then this may explain the lack of such signs in overall economic trends.
4.9.5 Relevance for local communities Figure 2 in Paper I and Figure 1 in Paper II show the economic system in its ecological and social contexts. It follows the logics of economic theory when the system boundaries are broadened and more of the ecological system is located inside the system boundaries. Figure 1 in this thesis shows what is basically the same system with symbols from system ecology and emergy analysis.
These figures stress the importance of
being efficient in all subsystems affected in the sustainability context in terms of the production of wanted goods and services per unit resource used no matter whether the resources emanate from natural capital, man-made capital or human capital on the donor side of the subsystem at hand; and “wanted” relates directly or indirectly to the use of the product in the receiving system,
producing and consuming within the sustainability limits of systems affected; and
applying a system perspective.
With a system perspective, it is obvious that one subsystem may well have a high environmental cost per se, but due to its capacity to enhance overall system performance; it may well be of vital importance for a high general system performance. A subsystem that has a high cost in natural resources may well be a prerequisite for a high and sustainable societal welfare level.
It is essential in the sustainability context to not use up available capital assets, but to live on the interest, i.e. the sustainable flux of goods and ser-

107
vices from capital stocks. In the work preceding the bill for local communi-ties in 1953 (1953 års kommunallags förarbeten) the principle was stated that the current generation do not have the right to use up what previous genera-tions have brought together to the benefit of generations to come49. This is quite similar to common definitions of sustainable development and its pre-requisites (OECD 2001). It relates to the importance of maintaining suffi-cient capital stocks taking into consideration their different features.
Figure 18 shows the trend from 1993 to 2012 of the equity in the local community Kils kommun.
Figure 18. Contribution to GDP from acreage-dependent sectors in Sweden,
Northern Europe, Western Europe, Europe, North America, Asia, Africa and the world 1970–2011, fixed price. Relative to a value 1.00 in 1970. Data from www.kolada.se, accessed 2014-02-22, for the year 1993 from Jan Sturesson PWC, 2004.
From 1993 to 2008 the equity value fell from 49 million SEK to minus 181 million SEK. To 2012 this deficit had decreased from minus 181 to minus 111 million SEK, thus the equity had increased by 70 million SEK in this four year period. Kil has around 12 000 inhabitants.
As I have lived in Kils kommun since 1990; I have a strong societal inter-est; and I am trained from my professional occupations since 1982 to analyse system performance in production biological, energetic, system ecological, and economic terms for enterprises and as societal values, I have since the 49. Sturesson, J and A. Haglund. 2004. Pressmeddelande PricewaterhouseCoopers 2004-12-03. PricewaterhouseCoopers.
Kils kommun equity million SEK; -111
Kils kommun, surety bonds million SEK; -592
Kils kommun equity plus risks due to surety bonds, million SEK; -703
Equity weighted average Swedish local communities; 167
Equity, Kils kommun minus average local communities ; -278
-1 000
-800
-600
-400
-200
0
200
400
1993 1994 1995 1996 1997 1998 1999 2000 2001 2002 2003 2004 2005 2006 2007 2008 2009 2010 2011 2012
Mill
ion
SEK
Equity 1993 to 2012 Kils kommun

108
autumn 1991 to and through analysed economic trends and the consideration of economic aspects in the decision-process in Kils kommun. That had from the beginning two purposes. The first was to if possible contribute to a better development in the community where I live. The second was to learn to what degree the institutional context on local community level supported the de-velopment of agriculture and forestry towards their important role in a sus-tainable society, where “Land, including all natural resources, is the scarce factor of production in the long run” (Daly and Cobb 1989, p. 324). Hell-strand (1995a,b; 2003b; 2005a, 2009) treats the role of communities in a sustainable society including their impact on the possibilities for acreage dependent sectors to fully provide the ecological basis of a sustainable socie-ty through the production of ecosystem services.
With my professional training, it was quite easy to see in the beginning of the 1990s that Kils kommun were moving into economic problems if not economic aspects in the future would be valued higher (Hellstrand 1995b). In different roles such as a member of the board of an association for local, rural development; PhD-student; concerned citizen; local politician; one of the auditors appointed by the local parliament; and as consultant, I have re-peatedly provided this information to Kils kommun. After about 15 years this contributed to a shift in the culture of the organisation where it become possible to take actions where a trend of 15 years with an annual loss of eq-uity with 15 million SEK was reversed to a new trend were the deficit in equity was decreased with around 18 million SEK per year. The information I had provided contributed to this shift from a 15 years trend of loss of equity to a period of rebuilding it. Without this information the rate towards posi-tive values of the equity would be lower.50
Basically, the same analytical approach and tools were applied, as when providing in depth analysis of the production biological and economic per-formance of around 100 dairy farms in Värmland from 1982 to 1986 (Hell-strand 1988).
A central theme in the thesis and accompanying papers is resource effi-ciency in the economic process. Paper II presents long-term trends for na-tional economies such as the GDP produced per unit of natural resource used. Paper III shows such measures for the Swedish economy and the milk production sector.
In the public sector, the majority of the natural resources are indirectly appropriated, through the natural resources used in the economy paying the taxes that fund public activities, See Figure 1.
In 2006 the total GDP in Sweden was around 3 000 billion SEK, the use of energy was around 600 billion kWh, and the carbon dioxide emissions were around 60 billion kg. Thus in the Swedish economy, the cost of the
50. Personal communication from Georg Forsberg 2014-02-07, one of two “kommunalråd” in Kils kommun.

109
production of 1 SEK GDP in 2006 was 0.2 kWh of energy, and 0.02 kg car-bon dioxide.
From the perspective of a sustainable society, it is equally important that primary sectors such as agriculture; secondary sectors such as industry; and tertiary sectors such as public services are efficient and operates within their resource limits. Deterioration of assets as seen in the trends in Figure 18 is not sustainable over time, either for households, enterprises or local commu-nities. Similarly, when society deteriorates the stocks of natural capital that it depends on, the path is not ecologically sustainable.
For sustainable development, it is not sufficient for the system to be sus-tainable; the development criteria imply an increasing capacity to meet the needs of humans within the sustainability limits of affected systems.
A closer examination of the economic results in Kils kommun shows that 80% of the regain of own assets from 2008 to 2012 is due to increased in-comes through fees. During decades the incomes through fees in Kils kom-mun has been substantially lower compared to average of local communities, while taxes and cost-levels have not compensated. From the years 2007 and 2008 to an average for the years 2009 to 2012 this gap was decreased from 40 million SEK less in incomes through fees to 26 million SEK annually less51. Data are from www.kolada.se
Figure 19 shows the cost level over time in preschool and elementary school in Kils kommun.
Figure 19. Costs in preschools and elementary schools in Kil, 1998-2012.
Data from www.kolada.se, accessed 2014-01-14.
51. Data from www.kolada.se, accessed 2014-01-14.
-50
0
50
100
150
200
250
1998 1999 2000 2001 2002 2003 2004 2005 2006 2007 2008 2009 2010 2011 2012Preschool, real costs 40 40 43 43 46 45 51 54 54 65 67 65 69 69 76Preschool, costs if national average 46 43 44 46 47 44 45 47 48 52 55 59 62 64 69Elementary school, real costs 85 86 99 108 113 124 126 124 120 126 125 125 118 124 126Elementary school, costs if national average 80 85 93 98 104 116 116 115 111 110 109 106 107 110 113Preschool + elementary schoool, real costs 125 126 142 151 158 169 177 178 175 191 192 191 186 193 201Preschool + elementary schoool, costs if national
average 125 129 137 145 151 160 161 162 158 162 164 165 169 174 182
Real costs minus average cost level 0 -3 5 7 7 9 16 15 17 29 28 26 17 19 20
Mill
ion
SEK
Costs preschoool and elementary school in Kil

110
Taken together, real costs for preschool and elementary school have in-creased above national averages52, from a level that equalled national aver-ages around the year 2000 to a level that as an average was 21 million SEK above that average the years 2004 to 2012, i.e. 12.5% higher. The pedagogic result in Kil from elementary school is not better, nor worse than the average among schools in Sweden (Hellstrand 2010). As a consequence, the efficien-cy in elementary school in Kils kommun was ranked 199 of a total of 290 local communities in 201253.
This suggests that there is a similar situation here as when discussing sus-tainability impacts of resources (purchased feeds) to dairy cows above the economically optimal level. Here we have around 20 million SEK (ca 12%) more in costs compared to national averages while the pedagogic result is at the average level.
This amount of money as a share of Swedish GDP corresponds to 4 mil-lion kWh of energy used, and the emission of 400 000 kg of carbon dioxide.
Four conclusions follow:
The analytical tools developed can be applied to dairy production as well as to public services.
The toolkit in the papers also contributes to an understanding of the eco-logical dependency of the public sector.
The toolkit presented supports the understanding of the dependencies of subsystems for the overall system performance of society in its ecologi-cal context.
It is equally important to increase the efficiency in primary, secondary and tertiary sectors of the economy and society.
4.9.6 Relevance on regional level In the early 1990s, there was a process regarding the establishment of a new and bigger regional airport in the county of Värmland. As a member of the board of the regional association for the conservation of nature (Na-turskyddsföreningen), I had the task to evaluate the analyses underpinning the decision. This was in the early phase in my development of the toolkit supporting sustainable development that is presented in this thesis. However, I was able to utilise my experience from agriculture, including how to per-form investment analyses.
The regional authorities planned for a capacity of 400 000 to 500 000 pas-sengers annually. In this task I applied basically the same approach as when 52. Taking into consideration the impact of structural factors the local community cannot control as expressed within the system of a national balancing of costs among local communi-ties in Sweden (“kommunala kostnadsutjämningssystemet). 53. Data from www.kolada.se, accessed 2014-01-14.

111
analysing the investment space in systems for forage-harvesting and storage in milk production that was one of the major tasks as “Lantbrukskonsulent husdjur”, i.e. the public official with the main responsibility for animal pro-duction in Värmland county in 1982–1984. The outcome showed that there were major problems in the investigations supporting the process for the new regional airport (Hellstrand 1995b) that influenced the decision process. For example, the positive contribution to the regional economy was based on an assumption that future trains to Stockholm would have the same low quality that they had in the 1980s, while the X2000 service with fast trains from the centre of Karlstad to the centre of Stockholm had already been launched. In reality, that system was more cost-efficient and too strong a competitor to the regional airport. This resulted in the trend for passengers from Karlstad airport that is shown in Figure 20.
Figure 20. Passenger numbers at Karlstad airport, 1972–2009.
Instead of 400 000 to 500 000 passengers the level in 2009 was well below 100 000.
Karlstad airport is one of the airports with the worst negative results in Sweden since its establishment at the new location. Public resources have subsidised the airport, meaning that a transportation system with natural high resource and emission costs per person and km has been favoured while systems that are more efficient both from a narrow economic and a wider natural resource perspective have not.
From this five conclusions follow:
0
50 000
100 000
150 000
200 000
250 000
300 000
350 000
1970 1975 1980 1985 1990 1995 2000 2005 2010 2015
Passengers at Karlstads airport 1972-2009, data from Luftfartsverket
Domestic Foreign Sum

112
The previous example at the local community level showed that the toolkit supporting sustainable development could be applied in analysis of fluxes of resources (monetary), providing new information that sup-ported increasing assets and reduced pressure on the natural resource ba-sis of society. This example shows that it is also applicable when going from an investment calculus focusing on investments increasing the stock of capital (man-made) where this affects future fluxes of resources in monetary terms and also in terms of natural resources.
The three examples regarding dairy production, the economy of a local community and a regional airport show that there is often congruency between economic efficiency in a quite narrow and short-term perspec-tive and ecological sustainability in a wider and longer perspective.
Factors other than a good description of reality using established meth-ods and knowledge within disciplines with competence of excellence re-garding concerned systems and issues54 often govern the decision pro-cess.
This can cause substantial sustainability costs in the ecological, econom-ic and social dimensions.
This is indeed positive information. The potential for improved system performance within sustainability limits is significant, and different ac-tors such as dairy farmers and local and regional authorities have the power to decide over factors that matter.
The two examples from local and regional levels show that when the system boundaries of the toolkit for sustainability are narrowed so far that the eco-logical dimension is excluded, the toolkit does a good job in traditional eco-nomic analyses. This is part of the relevance test of the toolkit. It is difficult to argue that LCA can make a similar contribution when evaluating the economy of local communities, or in connection with an investment calculus for a regional airport, taking into account its ambition to cover all impacts from cradle to grave.
Both examples illustrate that the toolkit is well suited for analyses where fluxes of resources are related to stocks of capital.
4.9.7 Relevance on national scale Figure 21 shows the development of several economies, countries and some of the major global regions from 1970 to 2012. 54. The toolkit supporting sustainable development presented in this thesis was developed though an expansion of system boundaries of traditional and well proven methods. Individual-ly powerful in their traditional core fields, they are often also powerful in a sustainability context.

113
Figure 21. Development of national and some major regional economies,
1970–2012. Data from UN stats. Relative to 1970, with value 1.00.
Sweden has had the lowest economic development measured in traditional GDP terms and fixed prices between 1970 and 2012 of the economies pre-sented in Figure 21. All the regions of Europe have a lower growth than the other nations and regions presented.
Since the turn of the Millennium both Sweden and the EU have had a goal of becoming leaders of global economic development. An important means to this end was “green growth”. A common opinion in Sweden is that Swedish industry and agriculture apply more “environmentally friendly” methods than in most competitor countries. The use of natural resources and emissions per unit of Swedish product would be smaller compared to prod-ucts from other nations, in general. Sweden has a lower population density than most nations, thus the area of ecosystems and hence the production of ecosystem services per inhabitant and per unit GDP in Sweden is higher compared to most other developed nations. This suggests that when efficient measures supporting sustainable development are implemented in Sweden, the EU, and internationally, then the development of the Swedish economy should stand out in a positive way compared to other nations and regions. Figure 21 communicates the opposite situation. The trends for the regions of Europe that are part of the EU suggest that the ambition to become global leaders in growth through environmentally driven growth in the EU has not been successful over the past decade.
One possible reason for these trends in Sweden and the EU is that the pol-icies implemented with the aim of supporting sustainable growth were not
0,00
1,00
2,00
3,00
4,00
5,00
6,00
7,00
1970 1972 1974 1976 1978 1980 1982 1984 1986 1988 1990 1992 1994 1996 1998 2000 2002 2004 2006 2008 2010 2012
GDP trends US$2005 1970 to 2012 selected regions and countries; 1970 reference-year value 1.00
Asia
World excl N America and Europe
South America
Latin America and the Caribbean
Africa
World
Oceania
United States
Northern America
Japan
Northern Europe
Eastern Europe
Europe
Southern Europe
Western Europe
Sweden

114
efficient. Another possible cause is that other factors in the economy and in society had a stronger influence. Even so, the perspectives in this thesis sug-gest that it is equally important that all parts of the economy and of society work well for sustainable development to be realised. If factors in the econ-omy or society obstruct sustainable development, then they ought to be ad-dressed with suitable tools.
4.9.8 The IPPC directive and the BAT principle Papers II and VI and Hellstrand (1997; 1998; 2005b) treat weaknesses in the EU directive Integrated Pollution Prevention and Control. The purpose of the directive is to handle environmental damages due to human activities such as industry and large scale agriculture. In Sweden this directive is implemented through “Miljöbalken”, the Environmental Bill. An important part of the bill is “Miljökvalitetsnormer” (MKN)55, in English Environmental Quality Ob-jective.
MKN are steering in a number of environmental policy contexts, and are related to EU decisions. Among other factors, they are important in decisions on production permit conditions for industry.
The Swedish Environmental Protection Agency has developed guide-lines56 for defining the quality of water systems in relation to set MKN. Länsstyrelsen i Dalarna (the County Administrative Board of Dalarna) has compared the outcomes of these guidelines with their actual knowledge about lakes in Dalarna (Länsstyrelsen i Dalarna 2010).
They found that for nearly 60% of investigated lakes, the classification based on these guidelines resulted in classes of ecological status that did not agree with the real status of the same lakes. This is a problem as MKN is powerful in the context of environmental law, which may ultimately result in permission permits that actually harm both the environment and the econo-my of industrial plants. If so, it can cause negative effects on employment rates and tax incomes at local community level in the long run.
One cause of this situation is that there is a low level of current knowledge about the conditions of water systems and their natural variation. Increasing this knowledge costs money. An alternative approach would be to construct standards in the form of guidelines when generating the MKN. A problem occurs when these standards deviate from actual conditions of real lakes to the degree that the map of the ecological status generated by the MKN deviates too far from reality. This was the case for the majority of lakes in the investigation by Länsstyrelsen in Dalarna. 55. See http://www.naturvardsverket.se/Start/Lagar-och-styrning/Miljokvalitetsnormer/, acessed 2013-01-04 (Swedish). 56. See Naturvårdsverkets föreskrifter och allmänna råd om klassificering och miljö-kvalitetsnormer avseende ytvatten (NFS 2008:1); and Bilaga A till Naturvårdsverkets hand-bok 2007:4 Bedömningsgrunder för sjöar och vattendrag.

115
This study is another example of a policy context where the importance of the production factor land is substantially reduced by applying theoretical criteria with low connection to real conditions in real ecosystems, i.e. water systems in this case.
Hellstrand (2005c), using the version of the toolkit for sustainability pre-sented in the thesis at that time, analysed the sustainability relevance of pro-duction permits in 9 cases where the IPPC directive was applied. Some cases were analysed briefly, and others were analysed in detail. One concerned a saw-mill, two concerned managed fish production in lakes, and six were pulp and paper production. Substantial potentials for improving the eco-efficiency of set production permits were identified. This confirms the find-ings in Hellstrand (1997; 1998; 2013) and Hellstrand et al. (2010). One of the conclusions was that the BAT principle (Best Available Technology) is product-oriented, and not oriented towards the environment. Criteria for natural resource use and emissions are set per unit product and not in terms of the impact on affected ecosystems. Of course it is still important to not waste resources in the production process and to not cause unnecessary emissions.
However, as shown by Figures 12 and 13, this is important but not enough to secure a sustainable production. The location of the production also matters. Identical production plants may cause substantially different human health and ecosystem impacts if located in EU regions with the high-est economic activity and high environmental loads per ha compared to re-gions with low economic activity per ha and low environmental load per ha.
If too narrow an interpretation of the BAT principle is used, there may even be a reduction of one or more substances at the margin, causing such high energy costs that other emissions increase exponentially due to the same basic mechanisms as was analysed in detail in previous sections treat-ing the issue of feeding intensity to dairy cows. The mechanisms behind Figure 3 are central here. Just as increasing amounts of nutrients in crop production and feeds in animal production are required per unit increase in production in biological production systems, increasing inputs of energy and other resources as well as monetary resources are needed per unit emission at the margins. Hellstrand (1997; 1998) discussed this in depth, and showed that situations can occur where little or no benefit may be achieved in the local ecosystems while production costs, energy costs, and environmental costs at higher system levels increase.
From a Swedish perspective this costs competitive power. Swedish pro-duction often combines fairly resource and emission-efficient production systems in agriculture and in industry with locations where the delivery of the ecosystem service waste assimilative capacity is substantially less appro-priate compared to production systems in most competitor countries. With “environmental” standards that relate to the product and not to the impact on affected ecosystems, Swedish production cannot capitalise this environmen-

116
tal benefit. The disadvantage increases if set environmental standards do not reflect real conditions in real ecosystems. This is not good for the companies or the environment. Better information about the production options of the production factor land is needed, as well as better adaptation of production permits for industry to the production factor land.
4.9.9 Correlation between price of oil and food Figure 22 shows the price of oil from 1861 to 2012.
Figure 22. Price of crude oil, 1861–2012.
Based on data from BP (2012).
There was a strong increase in crude oil prices beginning in 1998. In 2012 US$ the price per barrel in 1998 was 18, and in 2012 it was 112, a 6.2-fold increase.
Figure 23 shows the relative change in crude oil price and food price from 2000 to 2010.
0
20
40
60
80
100
120
140
1861
1864
1867
1870
1873
1876
1879
1882
1885
1888
1891
1894
1897
1900
1903
1906
1909
1912
1915
1918
1921
1924
1927
1930
1933
1936
1939
1942
1945
1948
1951
1954
1957
1960
1963
1966
1969
1972
1975
1978
1981
1984
1987
1990
1993
1996
1999
2002
2005
2008
2011
Crude oil prices 1861-2012, source BP Statistical Review of World Energy June 2013
$ money of the day $ 2012

117
Figure 23. Relative change in crude oil and food prices, 2000–2010. Based on
time series with fixed price. Sources: Oil prices from BP, food prices from FAO .
The prices of food and oil are closely linked. Figure 24 shows the statistical relation between the trends in oil and food
prices.
Figure 24. Statistical relation between food and crude oil prices, 2000–2010.
0,00
0,50
1,00
1,50
2,00
2,50
3,00
1998 2000 2002 2004 2006 2008 2010 2012
Pricl
evel
, com
pare
d to
200
0
Year
Price crude oil and food price index, 2000 - 2010, fixed prices, year 2000 reference-year, value 1,00
Oil price, US$ 2010
Food Price Index
y = 0,4164x + 0,6011R² = 0,8792
0,00
0,20
0,40
0,60
0,80
1,00
1,20
1,40
1,60
1,80
2,00
0,00 0,50 1,00 1,50 2,00 2,50 3,00
Food
pric
e in
dex
Price index crude oil
Food price and cruide oil price 2000 - 2010, fixed price
Food Price Index
Linjär (Food Price Index)

118
The result of the regression analysis presented in Figure 24 is that when crude oil price increases by one unit from the level in 2000, the food price as measured by FAO increases by 0.42 units. The R2-value is 0.88.
This is not a scientific proof of a causal relation. However, the result of the statistical analysis supports the possibility that there may be a causal relationship. Given the dependency of modern agriculture on energy-demanding inputs, and the increasing competition of land for food and fuel purposes, there is a need to investigate further the strength of a possible causal relationship, and measures to decouple it.
The measure described in Papers V and VI regarding utilising otherwise marginal agro-ecosystems in the northern parts of Sweden and worldwide for production of food via ruminants is one such measure. Increasing the efficiency of feed-utilisation in milk production as discussed in Papers III, V and VI is another. A third measure is to improve the production level per dairy cow, as discussed in Papers V and VI.
Together, these three measures can substantially reduce the acreage of ar-able land appropriated for food production globally, making large areas available for increased production of food, bioenergy, and other renewable natural resources.
Two principles for sustainable development can be met through these three measures. One is improved efficiency in the utilisation of resources; the other is a contribution towards the substitution of non-renewable natural resources by renewable ones.
4.9.10 Conclusions related to recent trends The important parts of the papers in the thesis and of the thesis itself are the proposals for methodological improvements that support the bridging of current implementations and knowledge gaps regarding sustainable devel-opment. With the proposed changes, substantial potentials for good econom-ic and social development in rural and urban areas in Sweden and interna-tionally can be realised, based on the insight of the interdependencies be-tween urban and rural areas.
As a side effect, such a bridging may substantially improve the competi-tiveness of the Swedish economy as it allows the entire economy to reinforce its sustainability profile by balancing consumption of ecosystems services with the high level of production of ecosystem services in Swedish rural ecosystems.
If this occurs, the contribution to GDP will increase in those areas in Sweden that are now experiencing falling populations and lower economic development than other areas.
Another side effect is that the thesis provides a knowledge and methodo-logical platform where integrated competence from different disciplines and actors in Sweden can make a contribution in Sweden, the EU and globally.

119
On the global level, the briefly presented 4P principle in combination with the methodological toolkit for sustainable development may simultane-ously contribute to fulfilling the first UN Millennium Development goal of eradicating extreme poverty and hunger. This may provide a channel where actors emitting carbon dioxide can pay, e.g., 30 US$ per tonne carbon diox-ide more in the topsoils in agriculture. FAO (2006) provide an example re-garding pastoral dry lands in Africa. They suggest that modest improvements in management may gain 0.5 tonnes C per ha and year, i.e. 1.8 tonnes of carbon dioxide per ha and year. Typical population densities are one person per 10 ha. This could result in improved incomes corresponding to 18 tonnes times 30 US$ = 540 US$ per person and year. This is almost twice the cur-rent incomes of many herders in Africa. The same measure may improve soil productivity at the same time.
This indicates how systems for payment of ecosystem services (PES) can improve incomes in rural areas in developed nations such as Sweden and in marginal areas in Africa, while simultaneously enhancing production of eco-system services.
Increasing incomes from acreage-dependent sectors in Africa, Sweden and other rural areas around the world imply that the rent per unit of land increases, and thereby the value of land as production factor will increase.
This indicates how methodologies presented in Papers I to VI and com-plementing sections in the thesis point towards a way to further develop the-ories regarding the rational localisation of production and consumption in the geography supporting physical planning for sustainable development. This can contribute to current theories regarding rational physical planning that have emerged from earlier contributions such as Andersson (1987), Christaller (1933), Lösch (1940), von Thünen (1826) and Weber (1909). Johansson (1991) treats the issue of infrastructure and productivity by apply-ing a geographic perspective on the productivity issue. He used traditional economic production functions of the same type that formed the backbone of the work by the Swedish productivity delegation (SOU 1991). This implied that production value was assumed to be a function of inputs of labour and capital only, while the importance of the production factor land, and thereby the ecological dimension of the economy, was ignored. Although the infra-structural investments selected as rational by Johansson and the productivity delegation increased the volume, speed, and distance of physical fluxes in society, i.e. the ecological impact was substantial; they were based on anal-yses ignoring the production factor land, i.e. the ecological dimension of the economy.
Hellstrand (2009) used the toolkit presented in this paper to develop new methods to evaluate the value of agricultural land in a sustainability context and applied them, in a task from Göteborgs stad, to support long-term physi-cal planning for sustainable attractiveness. The toolkit is now used in a simi-lar job for Lerums kommun.

120
Currently in Sweden, major efforts are being made to develop and im-plement a policy for zero emissions of climate change gases by 2050. An important part of this work concerns long-term physical planning. I propose that an update of the approach of Johansson including a broadening of the analytical perspective, thereby including the importance of land, labour and capital in the context would be fruitful. Biophysically anchored production functions (Paper II) can make a contribution here.
With the current (January 2014) financial crisis ongoing in some EU na-tions the thesis, with the 4P principle, suggests that there are options availa-ble where a development of the market system as a tool supporting good economic and social development within affected ecosystems´ carrying ca-pacity limits can link producers of environmental services to consumers. If so, incomes may increase in acreage-dependent sectors in the EU that pro-vide good support for the demands of a society with sustainable growth. If this occurs, the market system increases its capacity to consider the produc-tion factor land, then the need for EU subsidies to agriculture and rural de-velopment will decrease. This will release pressure on the EU budget, mak-ing it possible to use some of the financial resources no longer appropriated in these systems to fulfil basic needs for those sections of the EU population that now bear the heaviest burdens in the present crisis. The financial re-sources released may also be used to secure financial systems in the EU and its member states.
Figure 2 in Paper I and Figure 1 in this thesis describe basically the same system from the perspectives of economic theory and systems ecology re-spectively. A key message is that most, if not all, systems are related to each other. This implies that, given the compartment conceptual model of the economy, where compartment 1 concerns the ecological system, compart-ment 2 concerns the GDP economy, and compartment 3 concerns the fulfil-ment of needs through the economic resources produced in the GDP econo-my, a doubling of the efficiency in
the primary sectors making natural resources available,
the GDP economy where through inputs of labour and capital natural resources are upgraded to goods and services of economic value, and
the fulfilment of human needs and desires by the means produced in the GDP economy,
will result in an increase in eco-efficiency by a factor of 8, i.e. 2 * 2 * 2: From the same amount of ecological resources appropriated, the fulfilment of human needs will be 8 times higher.
This also suggests that the efficiency in e.g. local communities’ use of tax money is related to the total pressure of the economy on the natural resource

121
base. All things being equal, more efficient local communities can support a higher welfare level per unit of natural resource appropriated.
Another advantage of efficient local communities is that they can provide the same level of welfare as other communities at a lower tax rate. If so, citizens will have more money available to buy goods and services, i.e. the demand for locally and regionally produced goods and services will increase. In addition, with more efficient local communities, a lower tax rate can im-prove results among firms in the geographic area of the local community, increasing future investments.
The cases presented from local and regional levels show that the tools supporting a sustainable development presented in the thesis can be applied in traditional economic contexts, that they generate relevant results, and that this through the mechanisms indicated above, can support the overall objec-tives of sustainable development.
The example regarding “Miljökvalitetsnormer” from Länsstyrelsen in Da-larna supports the proposal in Papers II and VI that the Integrated Pollution Prevention and Control Directive can be improved, favouring both the envi-ronment and the economic results of industrial plants, and thus local and regional economies.
The trends presented in the thesis regarding GDP and the share of the contribution to GDP from acreage-dependent sectors suggests that there is still a substantial implementation gap regarding sustainable development. Despite a growing number of analyses that show substantial economic and social values in the production of ecosystem services, actual payments to managers of ecosystems have not changed in a way that affects national ac-counts. On the contrary, the relative economic values of acreage-dependent sectors on most economic levels analysed are in rapid decline. This may be understood as an intended consequence of global structural economic chang-es, where most people experience a growing material welfare level.
However the analyses in the thesis, including Papers I to VI, suggest that there is a problem in that many analytical approaches now used with the ambition of supporting sustainable development do not correctly present the ecological foundation for a good economic and social development, and that this may eventually harm vital sustainability assets, including the future global food supply. These analyses affect policy measures from regional to global level.
Another explanation for the shrinking share of the contribution from acre-age-dependent sectors to GDP may be that on the operative level, actual measures still underestimate the importance of the production factor land. This may be valid from the regional and national level in Sweden and other nations to the global scale.
A concern is the close relationship between the prices of energy and food, in combination with the rapid increase in energy prices in recent decades. Given the dependency of modern agriculture on energy-demanding inputs,

122
and the increasing competition for land for food and fuel purposes, there is a need to investigate further the strength of a possible causal relation, and measures to decouple it.
The measure in Papers V and VI regarding utilising otherwise marginal agro-ecosystems in the northern parts of Sweden and worldwide for produc-tion of food via ruminants is one such measure. Increasing the efficiency of feed utilisation in milk production, which is treated in Papers III, V and VI, is another such measure. A third measure is to improve the production level per dairy cow globally, as discussed in Papers V and VI.
Together, these three measures can substantially reduce the acreage of ar-able land appropriated for food production globally, making large areas available for increased production of bioenergy and other renewable natural resources. The reason this can be made is that ruminants can utilise 3.4 bil-lion ha permanent pastures for food production thus releasing the pressure on the 1.4 billion ha of arable land. Together, permanent pastures and arable land contributes with the dominating part of in total 4.9 billion ha agricultur-al land.
Many analysts of agricultural systems and their efficiency are not aware of the quality differences between arable land and permanent pastures. This is reflected in their results.
The presented results show that there are significant win-win solutions that can be exploited. Sound analytical methods in combination with the next generation of incentives will support this.
The basic perspective and conclusions regarding the importance of agri-culture in Sweden and globally that is presented in this thesis has previously been presented by Jansson (1970).
4.10 Policy implications The thesis provides a toolkit that supports sustainable development which is consistent with the perspectives on sustainability in
the UN Millennium Goals;
Millennium Ecosystem Assessments; and
OECD.
It supports analysis of unbroken causal chains from the rumen physiological level to the global sustainability level. The toolkit considers
Thresholds;
Irreversibilities;
Resilience phenomena; and

123
Mutual dependencies between systems and system levels of importance in the sustainability context.
The analysis of 25 applications that aim to support sustainable development based on engineering sciences showed major problems that basically reflect-ed that engineering sciences do not provide the state of the art knowledge regarding analysis of sustainability impacts in ecological, economic and social systems. The analysis of mainstream economic theory (Papers I and II) showed a limited capacity, if any, to cope with ecological sustainability limits. A contribution regarding a safe operating space for humanity within systems ecology actually prioritised sustainability for ecosystems before humanity. To a large extent, this was a consequence of excluding agricultur-al systems from the analysis. Paper VI showed significant potentials to sim-ultaneously improve the economic results of farmers, a number of important ecological sustainability objectives, and global food security in an analysis of measures within animal production systems.
The consequence of the findings in Papers I to VI and the previous sec-tions of the thesis as briefly summarised above, is that through the methodo-logical contribution, the thesis supports
sustainable development on the macro ecological-economic level,
the development of agricultural systems with increased capacity to sup-port a sustainable societal development, and
the development of animal production systems with increased capacity to support a sustainable societal development.
The methodological contribution is not in conflict with engineering ap-proaches. The contributions from engineering sciences are crucially im-portant for sustainable development. However, the thesis suggests paths to improve the relevance of engineering approaches through integration with contributions from other fields. This is achieved partly by applying the engi-neering approaches in contexts where they have comparative advantages, i.e. within their relevance boundaries.
The results may be of significant value in future development of energy and protein standards systems for dairy cows.
The methodological contributions suggest how environmental monitoring systems could be improved.
The thesis has shown that there are substantial potentials to improve farmers’ economic results, reduce contributions to climate change and eu-trophication, and increase global food security through measures in animal production systems.

124
5 Conclusions
Collectively, the six papers offer a toolbox that supports the operationalising of sustainable development. It consists of:
A conceptual model of the economic system in its ecological and social contexts.
Biophysically anchored production functions.
A methodology for evaluation of sustainability impacts in the ecological, economic, and social dimensions, from low to high system levels, of production systems.
A simulation model of animal production that integrates production-physiological relations and common agricultural economic management tools.
Empirical results to support the interpretation of results obtained in fu-ture applications of the toolbox.
The toolbox is consistent with principles for sustainable development ex-pressed by OECD and the UN, and known properties of ecological-economic production systems in economic theory, systems ecology, and agricultural sciences.
When the biophysically anchored production function is specified in time and space, a system of Ecological Economic Accounts (EEA) is generated. These may focus on changes of stocks of natural capital, man-made capital, human capital, and social capital. They can also focus on fluxes of economic and ecological goods and services in the landscape.
Compared to Life Cycle Assessment (LCA) and related approaches, this toolbox for sustainability with its individual but related tools has merits, since it is built on known properties of the concerned systems within rele-vant disciplines. Conversely, LCA and related concepts, in their convention-al applications, are not based on fields with state of the art knowledge in those systems in which ecological, economic and social sustainability are defined. Thus, the tools presented in this thesis may help to overcome these limitations in LCA when dealing with the sustainability contribution of bio-logical production systems.

125
As the thesis covers areas from the general conceptual level, to specific and detailed tools that can support everyday decisions, as well as system levels from the physiological conditions of rumen microbes up to allocation of agricultural land for different crops, the policy implications are many and substantial.
The thesis support the implementation of measures that
strengthen economic and social development within ecological carrying capacity limits from individual product level to the global scale;
increase the capacity of animal production systems to
o support farmers’ incomes,
o reduce eutrophication,
o reduce acidification,
o reduce climate change effects,
o increase global food security, and
o increase bioenergy production capacities;
integrate rural and urban landscapes and their activities, increasing total ecological economic sustainability;
integrate industrial activities and activities in forestry and agriculture, increasing total ecological economic sustainability.
This outcome is the result of considering the significance of land. It is com-mon in currently delivered proposals for actions to support sustainability to ignore the importance of vital aspects of land, causing the implementation gap in sustainable development that OECD stressed. The thesis contributes to the closing of this implementation gap and the associated knowledge gap.
Has the thesis treated the scientific gaps that were put forward in the in-troduction? It has contributed to an increased understanding of
the value of land (including ecosystems),
the relations between land and society on a conceptual level and in oper-ative terms,
the relations between system levels and the three sustainability dimen-sions, ecological, economic and social, and
the importance of agriculture and animal production in a sustainable development.
The thesis has thus treated the scientific gaps put forward in the introduction.

126
Around 40% of the total product value in global agriculture is from ani-mal products; permanent pasture covers around 70% of total agricultural land; and around 70% of the biomass appropriated in the food system from agricultural land supports animal production. Therefore it is obvious that animal production is hugely important in the global food system. This is emphasised further by the substantial positive and negative environmental impacts associated with animal production.
The importance of agriculture is reflected in the carrying capacity of global ecosystems expressed in terms of the human population before and after the introduction of agriculture. Estimates of global population at the time agriculture was introduced suggest that the carrying capacity is now between 100 and 1 000 times the carrying capacity when humans were sole-ly dependent on gathering, hunting and fishing. Access to cheap fossil fuels has also contributed to this increase.
The results presented show that
land is crucial for sustainable development,
the understanding of the economic significance of land is a factor limit-ing a sustainable development,
the thesis provides initial insights that contribute to the understanding of the importance of land.
Thus the ambition of the thesis is fulfilled.

127
References
Andersson, R. (1987). Den svenska urbaniseringen. Kontextualisering av begrepp och processer, Geografiska regionstudier nr 18, Kulturgeografiska institutionen, Uppsala Universitet.
Andresen, N. (1994). Fodrets energivärde vid ökande foderintag. SLU Info rappor-ter, Husdjur 76, Sveriges lantbruksuniversitet, Uppsala.
Arbrandt, B. (1971). Ekonomisk analys av intensitetsförsök med mjölkkor. Medd., Institutionen för ekonomi och statistik, Lantbrukshögskolan, Uppsala.
AssiDomän. (1998). Assi Domän Environmental Report 1997. Azar, C., Holmberg, J., & Lindgren, K., (1996). Socio-ecological Indicators for
Sustainability, Ecological Economics 18, 89-112. Baumann, H. & Tillman, A.-M. (2004). The Hitch Hiker’s Guide to LCA: An Orien-
tation in Life Cycle Assessment Methodology and Application, Studentlitteratur. Berg, J. & Thuen, E. 1991. A comparison between some feed energy systems based
on Nordic production experiments in cattle. Norwegian Journal of agricultural science, Supplement No. 5, 7-15.
Björklund, J., Holmgren, P., & Johansson S. (2008). Mat och klimat. Medströms Bokförlag.
Cederberg, C., & Flysjö, A. (2004). Life Cycle Inventory of 23 Dairy Farms in South-West Sweden. SIK-Report 728, SIK - Institutet för Livsmedel och Biotek-nik, Göteborg.
Cederberg, C., Flysjö, A., & Ericson, L. (2007). Livscykelanalys (LCA) av norr-ländsk mjölkproduktion. SIK-rapport Nr 761, SIK - Institutet för Livsmedel och Bioteknik, Göteborg.
Christaller. W. (1933) (first edition in German). Central Places in Southern Germa-ny. Referred by Andersson (1987).
Costanza, R. (1994). Three general policies to achieve sustainability. In A.-M. Jans-son, M. Hammer, C. Folke, & R. Costanza (Eds.), Investing in natural capital: the ecological economics approach to sustainability, (p. 392-407). Island Press.
Costanza, R., & Perrings, C. H. (1990). A flexible assurance bonding system for improved environmental management. Ecological Economics 2(1), 57-76.
Daly, H. (1990). Towards some operational principles of sustainable development. Ecological Economics 2(1), 1-6.
Daly, H., & Cobb, J. B. (1989). For the Common Good: Redirecting the Economy Toward Community, the Environment, and a Sustainable Future. Boston: Bea-con Press.
Drake, L. (1999). The Swedish agricultural landscape – economic characteristics, valuations and policy options. International journal of social economics, 26(7-9), 1 042-1 060.

128
Drake, L. & Hellstrand, S. (1998). The Economics of the Swedish Policy to Reduce Cadmium in Fertilisers. Kemikalieinspektionen PM no 2.
Egeskog, A., & Gustafsson, S. (2007). Socioeconomic and environmental effects from sugarcane expansion in to the Pontal do Paranapanema region (state of São Paulo, Brazil): -A model-based analysis. Thesis for the Degree of Master of Science in Industrial Ecology. Department of Energy and Environment, Divi-sion of Physical Resource Theory, Chalmers University of Technology, Gothemburg.
EIPPCB. (2014). See http://eippcb.jrc.ec.europa.eu/index.html, accessed 2014-03-27.
Engström, G., Wadeskog, A., & G. Finnveden. (2007). Environmental assessment of Swedish agriculture. Ecological Economics 60(3), 550-563.
EU-Commission. 2004. COM(2004) 38 final. Stimulating Technologies for Sustain-able Development: An Environmental Technologies Action Plan for the Euro-pean Union.
EU-Commission. (2005). COM (2005) 466 final. Thematic Strategy on air pollution. Bryssel 21.9.2005.
FAO. (2006). Livestock’s long shadow. Rome:FAO. GDAACC. (2009). The Global Dairy Agenda for Action on Climate Change.
http://www.dairy-sustainability-initiative.org/Public/Menu.php?ID=36, 2014-03-27.
Giampietro, M. (2003). Multi-Scale Integrated Analysis of Agroecosystems, CRC Press, Boca Raton.
Grennfelt, P. (2005). ”Kommissionens luftvårdsstrategi – CAFE: Fina partiklar men också de traditionella luftföroreningarna”, Presentation, Svensk Energi 27th of January 2005.
Gunnarsson, S., Sonesson, U., Stenberg, M., Kumm, K. I., & Ventorp, M. (2005). Scenarios for future Swedish dairy production: A report from the Synthesis group of FOOD 21. Swedish University of Agricultural Sciences, Uppsala.
Hall, C. A. S., Cleveland, C. J., & Kaufmann, R. (1986). Energy and Resource Quality: the Ecology of the Economic Process. New York: John Wiley & Sons, Inc.
Hellstrand, S. (1988). Kan ekonomin i mjölkproduktionen förbättras - en modell för biologisk - ekonomisk analys av mjölkproduktionen och dess resultat för 15 gårdar i Värmland. Rapport 175, inst. för husdjurens utfodring och vård, Sveri-ges lantbruksuniversitet (Swedish University of Agricultural Sciences), Uppsala.
Hellstrand, S. (1989). Bakgrund och kommentarer till 1989 års fodermedelstabeller och näringsrekommendationer för idisslare (Background and comments to the Swedish feedstuff-tables and feeding standards for ruminants) (in Swedish). Rapport 191, inst. för husdjurens utfodring och vård, Sveriges lantbruksuniver-sitet (Swedish University of Agricultural Sciences), Uppsala.
Hellstrand, S. (1995a). The role of agriculture in a sustainable Baltic region. In Eco-logical Economic Aspects of the Agricultural Sector in the Baltic Drainage Ba-sin: - Course papers from the Copernicus Graduate Course September 19 - Oc-tober 2, 1994. Technical report no. 20, 1995, Department of Systems Ecology, Stockholm University.

129
Hellstrand, S. (1995b). Hållbar välfärd i Värmland: - Hinder och möjligheter på kommunal nivå. Rapport för Miljöpartiet Värmland.
Hellstrand, S. (1997). Reduction of the Discharges on the Local Level not Always Sustainable: - A Swedish Example. In Proceedings, Pulp & Paper Conference, March 9-13, 1997, Orlando, Florida.
Hellstrand, S. (1998). Methods for operationalizing an ecologically effective and economically profitable sustainable development. Licentiate in philosophy the-sis 1998:3 in Natural Resources Management May 1998. Department of Sys-tems Ecology, Stockholm University.
Hellstrand, S. (2003a). Ecological Economic Accounts on the Regional Scale. Out-comes for one rural and one urban region in Sweden 2000. Arbetsrapport 2003:7, Cerut (Centrum för forskning om regional utveckling), Institutionen för samhällsvetenskap, Karlstads universitet.
Hellstrand, S. (2003b). Kriterier för hållbar utveckling och miljöekonomiska räken-skaper. En förstudie med inriktning på Värmland, Länsstyrelsen Värmland, Ut-rednings- och strategisekretariatet, rapport 2003:3.
Hellstrand, S. (2005a). Om kommuners roll i en hållbar utveckling analyserad med hjälp av multikriterieanalys på flera nivåer … Eller … Om sunt bondförnuft och en hållbar utveckling. Rapport för Studieförbundet Vuxenskolan.
Hellstrand, S. (2005b). Utveckling av multikriterieanalys på flera nivåer. Ett projekt inom området Hållbar konsumtion och produktion, på uppdrag av Naturvårds-verket.
Hellstrand, S. (2005c). Den gröna marknadskraftens ekonomiska och ekologiska effekter för lantbruk, industri, region studerat i ett gränsregionalt perspektiv, underlagsrapport till konferensen Jakten på den Gröna Marknadskraften, KSLA 20 okt 2005.
Hellstrand, S. (2006). A Multi-Criteria Analysis of Sustainability Effects of Increas-ing Concentrate Intensity in Swedish Milk Production 1989-1999. Environment, Development and Sustainability 8(3), 351-373.
Hellstrand, S. (2007). Energieffektivitet, koldioxideffektivitet och produktion av hållbarhet i Sveriges regioner: Ett bidrag till det politiska målet en hållbar reg-ional tillväxt. Report from Nolby Ekostrategi on the behalf of ITPS, a former national authority which objective was to promote regional and national growth, underpinning their report Regionernas tillstånd 2007, (in English The state of the Swedish regions 2007), see http://www.tillvaxtanalys.se/download/18.56ef093c139bf3ef89027d8/1349863458776/regionernas-tillstand-2007-08.pdf, accessed 2013-11-01.
Hellstrand. S. (2008). Ekonomisk och miljömässig optimering av svensk mjölk-produktion (Economic and environmental optimisation of Swedish milk produc-tion) (in Swedish), report to the Swedish Environmental Protection Agency.
Hellstrand, S. (2009). Utredning av jordbruksområden i Göteborg – ekonomiska värden, dnr 0345/08. Uppdrag från stadsbyggnadskontoret i Göteborg.
Hellstrand, S. (2010). Några trender och nivåer rörande barnsomsorg och grund-skola i Kils kommun. Uppdrag Kils kommun.
Hellstrand, S. (2014). Hållbarhetsbidrag fem mjölkgårdar analyserade med Hell-strandmetoden® 2012-2013. Report to Nolby Ekostrategi.
Hellstrand, S., & Drake, L. (2008). Konsekvensanalyser av åtgärder för att minska människors exponering för kadmium via livsmedel. Underlag Kemi för att nat-

130
ionellt och internationellt driva arbetet för att minska människors exponering för kadmium.
Hellstrand, S., & Landner, L. (1998). Cadmium in Fertilizers, Soil, Crops, and Foods - the Swedish situation. In: Cadmium exposure in the Swedish environ-ment. KEMI report no. 1/1998.
Hellstrand, S., & Landner, L. (2001). Role of phosphorus in sustainable agriculture and the cadmium issue. In Syers, J.K. & M. Gochfeld. Proceedings of the SCOPE-workshop, Belgian Academy of Sciences, Brussels, Belgium, 13-16 Sep-tember 2000, financially supported by the Royal Academy of Sciences of Bel-gium, the Institute Mondial du Phosphate (IMPHOS), and the U.S. National In-stitute of Environmental Health Sciences.
Hellstrand, S., & Yan, J. (2010). Is China an option for Sweden and the EU when reducing their contribution to global climate change? Report from School of Sustainable Development of Society and Technology, Mälardalen University, Västerås, on behalf of ITPS, PricewaterhouseCooper and Södra.
Hellstrand, S., Sangfors, O., & Grahn, O. (1998). Ekologiska fotavtryck av några skogsindustrier inom AssiDomän koncernen i förhållande till omgivande skogs-förvaltningar. F 98/11:3, MFG, Fryksta.
Huhtanen, P., & Hristov, A. N. (2009). A meta-analysis of the effects of dietary protein concentration and degradability on milk protein yield and milk N effi-ciency in dairy cows. J. Dairy Sci. 92(7), 3 222-3 232
IPCC. (2011). Special Report on Renewable Energy Sources and Climate Change Mitigation: Summary for Policymakers. A report of working group III of the IPCC and Technical Summary. Eds: Edenhofer, O., Pichs-Madruga, R: & Y. Sokona.
IPCC. (2012). Renewable Energy Sources and Climate Change Mitigation. Special Report of the Intergovernmental Panel on Climate Change. Eds: Edenhofer, O., Pichs-Madruga, R: & Y. Sokona.
IDF. (2009). Environmental/Ecological Impact of the Dairy Sector. Bulletin 436/2009, International Dairy Federation.
Jansson. S. L. (1970). Samhället och biosfären. In J. Weibull (Ed.), Weibullsholm 1870-1970. En jubileumsskrift (p. 135-150). Landskrona.
Johanson, B. (1991). Infrastruktur, produktivitet och konkurrenskraft in Expertrap-port nr 9 till produktivitetsdelegationen. Allmänna Förlaget.
Johnsson, H., Renborg, U., & Säfvestad, V. (1959). Resultatmaximering i lantbru-ket. Meddelande från jordbrukets utredningsinstitut, 3-59. Stockholm.
Jordbruksverket. (2008a). Riktlinjer för gödsling och kalkning 2009. Jordbruksin-formation 26 – 2008.
Jordbruksverket. (2008b). Växtnäringsbalanser och kväveutlakning på gårdar i Greppa Näringen åren 2000– 2006. Rapport 2008:25. Jönköping: Jordbruks-verket.
Kemikalieinspektion. (2012). Samhällsekonomisk kostnad för frakturer orsakade av kadmiumintag via maten. PM 12/12.
Kåberger, T. (1991). Instrumental value of energy. In C. Folke, & T. Kåberger (Eds.), Linking the natural environment and the economy: Essays from the Eco-Eco Group (p. 61-75). Dordrecht: Kluwer Academic Publishers.

131
Kåberger, T. (1999). Aspects of Energy Resource Management, Doctoral thesis. Chalmers University of Technology, Gothemburg.
Kåberger, T., & Månsson, B. (2001). Entropy and economic processes – Physics perspectives. Ecological Economics, 36(1), 165-179.
Lagerberg Fogelberg, C. (2008). På väg mot miljöanpassade kostråd - Vetenskapligt underlag inför miljökonsekvensanalysen av Livsmedelsverkets kostråd, Rapport 9-2008, Livsmedelsverket.
Liebig, J. (1840). Chemistry in its Application to Agriculture and Physiology. Lon-don: Taylor and Watson. (Referred by Odum 1991.)
Lindmark, M. 1998. Towards environmental historical national accounts for Swe-den. Methodological considerations and estimates for the 19th and 20th centu-ries. Doctoral thesis, Umeå University, Studies in Economic History 21.
LRF. (2002). Maten och miljön. Livscykelanalys av sju livsmedel. Skövde. Lundqvist, J., Barron, J., Berndes, G., Berntell, A., Falkenmark, M., Karlberg, L., &
Rockström, J. (2007). Water pressure and increases in food and bioenergy de-mand. Implications of economic growth and options for decoupling. In: Scenar-ios on economic growth and research development: Background report to the Swedish Environmental Advisory Council Memorandum 2007:1, 55-152.
Lundqvist, J., de Fraiture, C., & Molden, D. (2008). Saving Water: From Field to Fork – Curbing Losses and Wastage in the Food Chain. SIWI Policy Brief.
Länsstyrelsen i Dalarna. (2010). Utvärdering av biologiska bedömningsgrunder för sjöar: Erfarenheter från Dalarna, Rapport 2010:16.
Länsstyrelsen och Region Värmland. (2004). Hållbar värmländsk växtkraft, hand-lingsprogram för Värmland år 2004.
Lösch. A. (1940). Die räumliche Ordnung der Wirtschaft. Referred by Andersson (1987).
MAX. (2009). The methodology behind the sustainability-work by MAX’ hamburger restaurants (Metod för klimatanalys bakom MAX’ klimatstrategi), http://www.max.se/download/Metod%20Max%20klimat%20080506.pdf, ac-cessed 2010-02-09.
MEA. (2005). http://www.millenniumassessment.org/en/About.aspx. Accessed 6th of February 2009.
Månsson, B. Å., & McGlade, J. M. (1993). Ecology, Thermodynamics and H.T. Odum's Conjectures. Oecologia 93, 582-596.
Nanneson, L., Nilsson, H., & Ytterborn, G. R. (1945). Jordbruksekonomi för jord-brukets ungdomsskolor och för självstudium, femte omarbetade upplagan, Stockholm.
Norfor. (2004). Assessment of Feed Evaluation Systems. NorFor (Nordic Feed Evaluation System). Report nr 1.
NRC. (2001). Nutrient Requirements of Dairy Cattle. 7th revised edition. Washing-ton: National Academic Press..
NUTEK. (2003). Nationell kraftsamling för miljödriven näringslivsutveckling - ett förslag till strategi.
Odum, E. P. (1989). Ecology and Our Endangered Life-Support Systems. Massachu-setts: Sinauer Associates, Inc., Publishers.

132
Odum, E. P. (1991). Fundamentals of Ecology. First edition 1971 USA: W. B. Saunders Company, third edition 1991 New Dehli: Natraj Publishers.
Odum, H. T. (1988). Self-organization, transformity, and information. Science, 242(4882), 1132-1139.
Odum, H.T. 1996. Environmental Accounting. Wiley & Sons. OECD. 2001. Policies to Enhance Sustainable Development. Meeting of the OECD
Council at Ministerial level, 2001. O’Neill, R. V., DeAngelis, D. L., Waide, J. B., & Allen, T. F. H. (1986). A hierar-
chical concept of ecosystems. Princeton: Princeton University Press. Østergaard, V. (1979). Optimum feeding strategy during lactation. In W. H. Broster
& H. Swan (Eds.). Feeding strategy for the high yielding dairy cow. London: Granada Publishing Limited.
Østergaard, S., Weisbjerg, M., Aaes, O., Friggens, N., Kristensen, T., Ringgaard Kristensen, A., Relund Nielsen, S., & Bossen, D. (2009). Udredningsrapport om økonomisk foderoptimering i den enkelte besætning baseret på NorFor Plan. Intern rapport, DJF husdyrbrug nr. 14, 2009. Det Jordbrugsvidenskabelige Fakultet, Aarhus Universitet.
Pleijel, H. (2007). Transboundary air pollution. Scientific understanding and envi-ronmental policy in Europe. Studentlitteratur.
Regeringen. (2004). En svensk strategi för hållbar utveckling – ekonomisk, social och miljömässig. Regeringens skrivelse 2003/04:129.
Regeringen. (2011). Strategi för utveckling och export av miljöteknik 2011–2014. Promemoria.
Renborg, U. (1957). Lineär planering använd i lantbruksekonomiska driftsplane-ringsproblem. Meddelande från jordbrukets utredningsinstitut, 3-57. Stockholm.
Rockström, J., Steffen, W., Noone, K., Persson, Å., Chapin, F.S., Lambin, E. F., Lenton, T. M., Scheffer, M, Folke, C., Schellnhuber, H. J., Nykvist, B., de Wit, C. A., Hughes, T., van der Leeuw, S., Rodhe, H., Sörlin, S., Snyder, P. K., Costanza, R., Svedin, U., Falkenmark, M., Karlberg, L., Corell, R. W., Fabry, V. J., Hansen, J., Walker, B. Liverman, D., Richardson, K., Crutzen, P., & Fo-ley, J. A. (2009). A safe operating space for humanity. Nature 461, 472-475.
Salomonsson, S., Gustafsson, A. & Bertilsson, J. (2003). Möjligheter till utveckling och förbättring av AAT/PBV-systemet för ökat kväveutnyttjande i mjölkprodukt-ionen. Svensk Mjölk.
SBA. (2008). Minska jordbrukets klimatpåverkan! Del 1. Introduktion och några åtgärder/styrmedel (”Reduce the climate impact of agriculture! Part 1. Introduc-tion and some measures/incentives”) (In Swedish), http://www2.sjv.se/download/18.677019f111ab5ecc5be80007018/klimat_delrapport_1.pdf; accessed 2008-08-25.
SEPA. (2012). National Inventory Report 2012 Sweden, Submitted under the United Nations Framework Convention on Climate Change and the Kyoto Protocol.
Shelford, V. E. (1913). Animal Communities in Temperate America. Chicago: Uni-versity of Chicago Press. (Referred by Odum 1991.)
SHS. (1986). Mjölkproduktionens lönsamhet, 1 Lönsamhetsutveckling perioden 1960-1985, 2 Resultat från RAM 1984/85. Meddelande nr 140 SHS. Eskilstuna.

133
SHS. (1991). Mjölkproduktionens lönsamhet 1989/90, 1 Lönsamhetsutveckling peri-oden 1960-1990 2 Resultat från RAM 1989/90. Meddelande nr 169 SHS. Eskilstuna.
SHS. (1994). Mjölkproduktionens lönsamhet, Resultat från RAM 1970/71 - 1992/93. Eskilstuna.
SHS. (1995). Mjölkproduktionens lönsamhet, Resultat från RAM 1970/71 - 1993/94. Eskilstuna.
SIKA. (2009). Värden och metoder för transportsektorns samhällsekonomiska ana-lyser – ASEK 4. SIKA Rapport 2009:3.
SLU. (1989a). Områdeskalkyler Jordbruk Ss 1989/90. Report 157, Konsulentavdel-ningen, Swedish University of Agricultural Sciences. Uppsala.
SLU. (1989b). Databok för driftsplanering. Speciella skrifter 37, Swedish Univer-sity of Agricultural Sciences. Uppsala.
SLU. (2006). Agriwise. www.agriwise.org. Accessed 2007-09-14. SLU. (2009). Agriwise. www.agriwise.org. Accessed 2009-03-01. SNFA. (2008).
http://www.slv.se/templates/SLV_NewsPage.aspx?id=21729&epslanguage=SV, accessed 2008-08-25.
Sonesson, U. (2005). Environmental Assessment of Future Dairy Farming Systems - Quantifications of Two Scenarios from the FOOD 21 Synthesis Work. SIK-rapport Nr 741, SIK. Gothemburg.
SOU. (1991). Drivkrafter för produktivitet och välstånd, SOU 1991:82. SOU (2004). SWENTEC AB - för en nationell kraftsamling på svensk miljöteknik.
SOU 2004:84. Sparovek, G., Berndes, G., Egeskog, A., de Freitas, F.L.M., Gustafsson, S., & Hans-
son, J. (2007). Sugarcane ethanol production in Brazil: an expansion model sen-sitive to socio-economic and environmental concerns. Biofuels, Bioprod. Bioref. 1(4), 270–282.
Spörndly, R. (1989). Fodertabeller för idisslare 1989. Speciella skrifter 39, Swedish University of Agricultural Sciences, Uppsala.
Spörndly, R. (1991). Fodertabeller för idisslare 1991. Speciella skrifter 44, Sveriges lantbruksuniversitet, Uppsala.
Spörndly, R. (1993). Fodertabeller för idisslare 1993. Speciella skrifter 52, SLU Info, Sveriges lantbruksuniversitet, Uppsala.
Spörndly, R. (1995). Fodertabeller för idisslare 1995. Rapport 235, inst. för husdju-rens utfodring och vård, Sveriges lantbruksuniversitet, Uppsala.
Statistics Sweden. (2009a). Emissions of ammonia, http://www.scb.se/Pages/PublishingCalendarViewInfo____259923.aspx?PublObjId=11327, accessed 2009-08-13.
Statistics Sweden. (2009b). Nitrogen and phosphorus balances in Swedish agricul-ture, http://www.scb.se/Pages/Product____13159.aspx, accessed 2009-08-13.
Statistics Sweden. (2009c). The system of environmental and economic accounts, see http://www.scb.se/Pages/Product____38161.aspx, accessed 2009-09-02.
Stern, S., Sonesson, U., Gunnarsson, S., Kumm, K.-I., Öborn, I., & Nybrant, T. (2005). Sustainable pig production in the future - development and evaluation of

134
different scenarios. Report FOOD 21 No 5/2005, Swedish University of Agri-cultural Sciences and SIK, Uppsala.
Stokstad, E. (2014). Ammonia Pollution From Farming May Exact Hefty Health Costs. Science 343(6168), 238-238.
Swedish Environmental Advisory Council. (2007). Background report to the Swe-dish Environmental Advisory Council memorandum, 2007:1.
The Forum for the Future. (2014). http://www.forumforthefuture.org/project/natural-step-tns/more/system-conditions, accessed 2014-03-27.
The Natural Step. (2014). http://www.naturalstep.org/the-system-conditions, ac-cessed 2014-03-27.
The Swedish Dairy Association. (2009). http://www.svenskmjolk.se/templates/PressRoom/Article_SM____3567.aspx, accessed 2009-09-30.
von Thünen, J. H. (1826). Der isolirte staat in beziehung auf landwirtschaft und nationalökonomie. Referred by Andersson (1987).
UN. (2008). UN Millennium Goals, http://www.un.org/millenniumgoals/poverty.shtml, accessed 2008-08-25.
Weber, A. (1909). (First ed. in German.) The location of Industries. Referred by Andersson (1987).
Wijkman, A. (2004). Report on the communication from the Commission to the Council and the European Parliament on Integrated Product Policy – Building on Environmental Life-Cycle Thinking (COM(2003) 302 – C5-0550/2003 – 2003/2221(INI)), from the Committee on the Environment, Public Health and Consumer Policy. Rapporteur: Anders Wijkman, FINAL, A5-0261/2004, 8 April 2004.
Williams, H., Wikström, F., Löfgren, M. (2008). A life cycle perspective on envi-ronmental effects of customer focused packaging development. Journal of Cleaner Production 16(7), 853-859.
Wiktorsson, H. (1971). Studies on the effect of different levels of nutrition to dairy cows. Swedish J. Agric. Res. 1, 83-103.
Wiktorsson, H. (1979). General plan of nutrition for dairy cows. In W. H. Broster & H. Swan (Eds.). Feeding strategy for the high yielding dairy cow. London: Gra-nada Publishing Limited.
Wirsenius, S. (2000). Human use of land and organic materials: Modelling the turnover of biomass in the global food system, Doctoral thesis, Chalmers Uni-versity of Technology, Gothemburg.
Wirsenius, S. (2003a). Efficiencies and biomass appropriation of food commodities on global and regional level. Agricultural Systems 77(3), 219-255.
Wirsenius, S. (2003b). The biomass metabolism of the food system: A model based survey of the global and regional turnover of food biomass. Journal of Industri-al Ecology 7(1), 47-80.

135
Papers


Paper I


The relevance of ecological and economic policiesfor sustainable development
Stefan Hellstrand Æ Kristian Skanberg Æ Lars Drake
Received: 5 September 2007 /Accepted: 8 May 2008 / Published online: 6 June 2008� Springer Science+Business Media B.V. 2008
Abstract A sustainable development can be understood as social and economic
development within ecological sustainability limits. The operationalisation of a sustainable
development presupposes integration of resource concepts covering relevant disciplines
and systems levels. In this paper descriptive domains within physical resource theory
(PRT), nutrition theory (NT), economic theory (ET) and emergy theory (EmT) are joined
in what we call a ‘‘sustainability map.’’ The sustainability map represents a conceptual
model of the economic production system in its ecological and social contexts. It is a
contribution within the field integrated assessment. The relevance domain of each resource
concept is analysed by comparison with the sustainability map. It is concluded that
resource concepts that well supports a sustainable development should recognise the
process restrictions that defines ecological, economic and social sustainability limits; thus
recognise and in a relevant way treat threshold—and resilience phenomena; and capture
the use-value of resources for human well-being. We suggest that the integration of NT, ET
and EmT may contribute, while we find the value of PRT limited, as physics, thus PRT, is
indifferent to life as a system characteristic, while life of microbes, plants, animals and
humans is central in the sustainability context. The paper contributes to a theoretical
foundation supporting a bridging of the implementation gap of a sustainable development,
e.g. through its proposal of how to develop more accurate natural resource concepts.
Readers should send their comments on this paper to: [email protected] within 3 months ofpublication of this issue.
S. Hellstrand (&)Department of Urban and Rural Development, Swedish University of Agricultural Sciences, Tolita 8,SE-665 92 Kil, Swedene-mail: [email protected]
K. SkanbergDepartment of Forest Economics, Swedish University of Agricultural Sciences, Umea, Sweden
L. DrakeSwedish Chemicals Agency, Sundbyberg, Sweden
123
Environ Dev Sustain (2009) 11:853–870DOI 10.1007/s10668-008-9156-1
Keywords Resource concepts � Value measures � Exergy � Emergy �Integrated assessment � Sustainable development � Multi-disciplinary
AbbreviationsAHP Animal and human physiology
ANT Animal nutrition theory
EmT Emergy theory
ET Economic theory
HC Human capital
HNT Human nutrition theory
ILA Impredicative Loop Analysis
MMC Man-made capital
NC Natural capital
NNC Non-renewable natural capital
NNR Non-renewable natural resources
NR Natural resources
NT Nutrition theory
PRT Physical resource theory
RNC Renewable natural capital
RNR Renewable natural resources
SC Social capital
1 Introduction
Currently, the drawbacks from Nature to Society due to the pressure that Society puts on
Nature are clearer than ever before. Human actions affect Nature in a way that eventually
affects global security. Socioeconomic trends such as population growth, urbanisation,
increased material welfare per capita, increased world trade combine into biophysical trends
where the volume, distance and speed of material fluxes increase. This will ultimately
1. deplete stocks of non-renewable natural capital (NNC)
2. first, turn stocks of renewable natural capital (RNC) into the class of NNC, as harvests
exceeds sustainable yield levels, second, deplete these stocks as well
3. decrease the life-supporting capacity of ecosystems that provide the physiological
necessities for human and other life, through
– depletion of stocks of RNC
– increased leaching of wastes and emissions through the global production chain
beyond sustainable waste assimilative capacities
– changed land-use regimes, that decrease ecosystem-services provided and habitats
and share of solar energy fluxes available for ecosystems, while increasing
nutrient leaching.
Thresholds and resiliens phenomena are typical for ecosystems. When thresholds are
passed, the balance between organising and disorganising forces is impaired, causing fast
and systematic changes, not easily reversed. Well functioning ecosystems have a sufficient
resilience. Resilience presupposes biodiversity, and, thus, sufficient quality and quantity of
habitats, including environments not disturbed by land-use change and discharges. Func-
tioning ecosystems are a prerequisite for sustained human well-being (Odum 1989). The
854 S. Hellstrand et al.
123

protection and sustainable management of biodiversity—including genetic resources,
species and ecosystem services that support human development—is central to achieving
the Millennium Development Goals, a set of measurable, time-bound goals and targets
adopted by world leaders at the UN Millennium Summit in September 2000 (UNDP 2008).
Important, early contributions regarding economic and ecological aspects of the complex
living systems discussed above are Common and Perrings (1992), Costanza and Perrings
(1990), Holling (1973, 1986), Jansson et al. (1994), Kay (1991), Odum (1985, 1989),
Perrings (1994), Perrings et al. (1992).
Pimentel and Pimentel (2008), McNeill (2001), Scheffer et al. (2001), Steffen et al.
(2004), and the number of reports launched through the Millennium Ecosystem Assess-
ment are later examples exploring these relations. Former UN Secretary-General Kofi
Amman initiated the Millennium Ecosystem Assessment. It assessed the consequences of
ecosystem change for human well-being. It involved the work of more than 1,360 experts
worldwide (Millennium Ecosystem Assessment 2008). Food production and food security
is an ecosystem good of a special importance for human well-being (Pimentel and Pimentel
2008; Lundqvist 2007). Thus, the first of the eight Millennium Development Goals by UN
is ‘‘Eradicate extreme poverty and hunger’’ (UN 2008). At the same time, agriculture is a
major factor causing environmental disturbances. Thus, to achieve a sustainable
development, resource concepts that can handle the issue of poverty and hunger, and trade-
offs between human needs and greed, and between ecosystem services and goods is needed.
The principles and incentives for sustainable development OECD (2001) put forward,
agree well with contributions within Ecological Economics ca 10 years earlier (e.g.
Costanza 1994; Daly 1990; Daly and Cobb 1989; Jansson et al. 1994). At the World
Summit on Sustainable Development, Johannesburg, 2002, sustainable development was
recognised as superior principle for the work of the UN (UN 2002). It is also the superior
objective of Sweden (Regeringen 2004), and a key priority for OECD and its member
countries (OECD 2001).
Ten years after the Rio Conference on the Environment and Development, the concept
of sustainable development is firmly rooted in standard economic analysis (OECD 2001).
But for all the work at the conceptual level, its implementation in practice remains muted
and uneven. OECD formulates the question: Given the urgency with which the case for
sustainability is often made, why have concrete actions lagged behind? They conclude that
the gap between the need of policies due to the urgency of the sustainability challenges and
the policies in place reflects both knowledge and implementation problems.
This gap is the cause for this paper. Its objective is to increase the understanding of their
relevance borders through an analysis of different resource concepts and their system
boundaries. It presents
– a three-compartment model of the economy in its ecological and social context
– resource concepts within physical resource theory (PRT), animal and human
physiology (AHP), economic theory (ET) and emergy theory (EmT).
Emergy theory is a special branch of systems ecology, a discipline of major influence on
the development of ecological economics.
The three-compartment model provides a sustainability map. The map is used to
identify measurement points of PRT, AHP, ET and EmT; their relevance domain; and
synergetic effects to be realised by integration. From this ground, we suggest how resource
concepts can be further developed, that simultaneously consider ecological source and sink
restrictions to socioeconomic systems, especially the importance of resilience and
thresholds within organisms and ecosystems.
The relevance of ecological and economic policies 855
123

2 Drawing a sustainability map
2.1 The challenge to handle key system characteristics of complex systems
The kind of systems that we are interested in is characterised by mutual dependencies
between socioeconomic and biophysical systems and between high system levels (such as
the global economy and the biosphere) and low system level (such as the sub cellular
mechanisms for uptake of toxic substances in microbes, plants, animals and humans).
Giampietro (2003) makes a major review of this field. Within integrated assessment, he
develops the Impredicative Loop Analysis (ILA) as a means. The Royal Swedish Academy
of Agriculture and Forestry (KSLA 2003) in a process involving 20 organisations in the
green sectors including forestry industries, authorities, farmers and NGOs involved in the
conservation of nature, strongly advocated the importance of integrative assessment in
studies of the societal values produced in agricultural and forestry ecosystems. The purpose
was to influence the national research priorities of the Swedish government. The Millen-
nium Ecosystem Assessment applies the approach of integrated assessment (Millennium
Ecosystem Assessment 2008).
Giampietro (2003) argues that the experiences of advanced consultancy have a con-
tribution to make in this context, as complement to traditional science. There are a number
of contributions at the interface between science and advanced consultancy (e.g. Drake and
Hellstrand 1998; Hellstrand 1997, 2006; Hellstrand and Landner 1998, 2001; Landner
1990, 1994; Landner and Reuther 2004; Landner et al. 1996, 2000a, b).
The references in the preceding paragraph represent studies where methods and con-
cepts in agricultural science (production biology and economy) and extension services,
environmental economics on macro scale, and applied environmental research and con-
sultancy have been integrated. The references include, literally, cases when causal chains
from such low system levels as the root-uptake of cadmium in agricultural crops as a
function of the form in which nitrogen fertilisers is applied up to the prevalence of cad-
mium induced renal disturbances in the Swedish population; as well as the impact of
changed strategies to satisfy the physiological needs of the rumen microbes of Swedish
dairy cows (considering actual price relations between feeds and milk products on the
market) on farmers net income, national ammonia emissions, and global food security,
respectively, successfully was examined. The coherence between the work in these studies
and ILA is profound. The knowledge level regarding eco- and human-toxicological aspects
down to cellular and sub cellular level was stronger, thus supporting a more precise
localisation of thresholds and resilience domains in studied systems, compared to the more
general methodological outline of Giampietro.
This supports the conclusion (Giampietro 2003) that lessons learned in a combined
consultancy and research context have a contribution to make in the development of
scientific methods supporting a sustainable development. This is accurate in the
development of resource concepts supporting an efficient use of natural resources for
human wellbeing.
The principle model in Fig. 1 summarises experiences from the contexts above.
The message in the figure is the following: Given the context of a sustainable
development, where thresholds, resilience, irreversibilities, food security, trade-offs
between economic and ecological objectives, trade-offs between different ecosystem ser-
vices and goods are typical; life of micro organisms, plants, animals and humans is a
critical system feature. It complicates the system. Relevant resource concepts must in a
relevant way deal with this life-induced system complexity.
856 S. Hellstrand et al.
123

2.2 The sustainability map
Mind map refer to predominating mental models of reality in a discipline, providing the
backbone for the tools applied when segments of reality are explored. Descriptive domain
is another name (Giampietro 2003).
PRT focuses on the physical aspects of resources. AHP treats physiological process
constraints to a sustainable development, where one significant aspect is the capacity of
agriculture to support global food security. Another contribution is the physiological
context for biodiversity, considering ecotoxicological effects, and changed nutrient con-
ditions. ET is powerful regarding analysis of transactions in the human economy and in
analysis of the welfare and distributional outcomes of human efforts. Systems ecology is
strong in its perspective where the human economy is embedded in the ecological system,
providing ecological sink and source restrictions to society.
Figure 2 shows a sustainability map obtained by integrating the mind maps of the
disciplines mentioned.
The model contains three compartments. Ecosystems including natural resources (NR)
constitute Compartment I. Sun, tide and processes providing heat in the depth of the Earth
are independent power sources driving processes in economic and ecological systems.
According to the first thermodynamic law the amount of energy is constant while
according to the second the quality of energy is degraded in real world processes (Pimentel
and Pimentel 2008). The amounts of elements are assumed to be constant. Although this is
not correct with regard to nuclear processes, it is an appropriate assumption for the purpose
of this paper. In geobiophysical processes driven by the independent power sources ele-
ments are rearranged into stores of natural capital (NC). NC provides life-support, that is,
the physiological necessities for life (Odum 1989). The economy consumes renewable and
non-renewable natural resources (RNR and NNR, respectively), appropriated from the
stock of NC. The availability of natural resources (NR) provides source restrictions to the
economy. This is the source-aspect of ecological sustainability.
Ecological sustainability includes, also, a sink-aspect. The sink-aspect refers to the
capacity of ecosystems to assimilate wastes from the economy without such negative
environmental impact that the life-support capacity is threatened. Land-use may also affect
the life-support capacity, and may, thus, be constrained by ecological sink-restrictions. The
impact of the economy on thresholds, resilience, environment, human health and the
Complexity
00
2
2
4
4
6
6
8
8
10
10
12
12
Significance of life as system characteristicSy
stem
com
plex
ity
Complexity
Fig. 1 Principle relationbetween the complexity ofsystems and the significance oflife as system characteristic
The relevance of ecological and economic policies 857
123

productivity of RNC is crucial in the understanding of how Nature trough ecological sink-
restrictions trough the pressure Man puts on Nature, affects future human well-being.
In Compartment II, energy and other resources are transformed to goods and services
measured in terms of GDP in processes steered by man-made and human capital (MMC
and HC, respectively). HC refers to the capacity of the individual to contribute to pro-
duction in Compartment II. It is a measure of the productivity of the individual. The
primary sectors1 act as a bridge between the first and second compartments, making NR
available to the rest of the economy.
In Compartment III ecological goods and services produced in Compartment I as well as
goods and services produced in Compartment II are consumed, satisfying human needs and
desires. Social capital (SC) is related to the degree of social sustainability and is connected
to aspects such as democracy, legitimacy of authorities and distribution of resources. At the
interface between Compartments II and III, consumer prices and production values are
established. Compartment II, including the interfaces to Compartments I and III, respec-
tively, is the primary focus in economics. It can be called the GDP economy. Prices are
important information carriers and basis for production and consumption decisions by
market actors. Consumer surpluses describe the social value of the goods and services
consumed and invested. GDP is an estimate of production, not welfare.
Compartment I defines ecological restrictions to society, Compartment II provide the
means, while Compartment III contains the objective; human well-being.
The sustainability map in Fig. 2 is inspired by the way the ecological economic system
was presented in ecological economics in the early 1990s (for references, see Sect. 1). It
corresponds well with OECD (2001).
Compartment II: “The economy”
Source-aspect Compartment I: Ecosystems including natural resources Sink-aspect
Compartment III:
Satisfaction needs & desires
SC
Compartment II:
“The economy”
Labour, capital
Payments
Payments
Goods, services
HouseholdsEnterprises
Primary
Secondary
Tertiary
MMC HC
Sources
Sun
Tide
Deep heat
Elements
Nonrenewable
Renewable
Natural resources; renewable and nonrenewable Wastes
L i f e S u p p o r t
Sinks
Assimilative capacityrestrictions via impact on:
Thresholds
Resilience
Environ-ment
Human health
Productivity RNC
NC
Fig. 2 A conceptual model of the economy in its ecological and social context
1 Agriculture, forestry, fishery, mining and power production.
858 S. Hellstrand et al.
123

3 Resource concepts from different disciplines
3.1 Physical resource theory
Energy, materials and information are physical resources (Wall 1986, p. 3). PRT has been
defined as the science dealing with physical resources (Kaberger 1999). Thus, the rele-
vance domain of PRT is the physical aspect of solar energy, tidal energy, energy from deep
earth, NNR, RNR and the conversion of these resources (Fig. 2).
For the purpose of this paper, we focus on the definition of exergy.
Exergy is the result of a combination of the first and second laws of thermodynamics.
Theoretically, exergy is the amount of work obtainable when some matter is brought to
equilibrium with the common component of the natural surroundings by means of a
reversible process (Szargut et al. 1988). Kaberger and Mansson (2001, p. 171) express
exergy as the maximum amount of useful energy that one can get out of a certain system,
given specified conditions. Exergy is calculated under freedom of process constraints other
than ideality; thus, it is essentially a generalisation of the common free energy concepts of
physics and chemistry. Free energy is the energy that can be transformed to mechanical
work provided that the processes are ideal (no entropy production) and a specification of
the restriction that applies for the particular kind of system.
Before the name exergy was agreed upon, the concept was called useful energy,
available energy and availability (Kaberger and Mansson 2001).
Ideal processes take place at equilibrium, thus no entropy is produced. Strictly speaking,
ideal processes are impossible, as equilibrium processes are impossible. No thermody-
namic changes can occur when all thermodynamic forces are balanced (Kaberger and
Mansson 2001, p. 168).
Thus:
1. Exergy is defined in a model of the real world, where all process restrictions other
than thermodynamic ideality are omitted: All process-restrictions that constitute
ecological, economic and social carrying capacity limits are located outside the
system borders of the conceptual model of reality, in which exergy is defined. Thus,
phenomena such as thresholds and resilience are located outside the system borders
of the conceptual model by which exergy is defined.
2. The condition that exergy is defined under the condition of thermodynamic ideality,
i.e., equilibrium, makes the concept resource meaningless: At equilibrium, no
processes take place. With no processes a situation with a flux of ‘‘resource’’ C from
system A? system B is impossible. And, if still a flux of ‘‘resource’’ C were possible
from system A ? system B, still no processes could occur in B where the ‘‘resource’’
C contributed. And, if still C contributed in processes in system B, the existence of an
observer D notifying the resource value of C is not possible.
Having said that, is not the same as to argue that ‘‘exergy’’-analysis, the way it in real
world situations is performed, is use-less. The point is that in a fundamental aspect the
world ‘‘exergy’’ as used in these contexts, differ from the word ‘‘exergy’’ given its sci-
entific definition. Such gaps in meaning may cause confusion. (This points towards
Wittgenstein’s analyses of possibilities and restrictions to communicate through the lan-
guage, which, in fact, relates to an important area in integrated analysis.)
Other resource concepts in PRT as entropy and negentropy are strongly related to the
definition of exergy (see Kaberger and Mansson 2001). We conclude that the conceptual
models in which resource concepts in PRT are defined are abstracted so far away from the
The relevance of ecological and economic policies 859
123

characteristics of systems where life is a key system characteristic, that their use for the
purpose of this paper is limited.
Cleveland et al. (2000), in the context of analysing fuel qualities arrived at a similar
conclusion. Exergy was of little value, as the measure ignored the use-value in the
receiving system.
To avoid misunderstanding, this is not to suggest that the first and second thermodynamic
laws should be rejected. Within the physical constraints of the thermodynamic laws, process
restrictions defining ecological, economic and social sustainability operate, that are several
magnitudes of order stronger. Therefore, the capacity of PRT to locate ecological, economic
and social carrying capacity constraints is limited. Furthermore, by ignoring the mentioned
process restrictions when constructing the mental map by which PRT understands reality,
they risk the fallacy of misplaced concreteness (see Daly and Cobb 1989): For each extra real
world process restriction ignored, the perceived degrees of freedom for human actions
increases (metaphorically). However, this is not a measure of real options for actions, but a
measure of a widening gap between the map and the terrain. This conclusion is general
regarding real systems and models of real systems (see Giampietro 2003), and addresses a
major cause behind the implementation gap of a sustainable development.
3.2 Animal and human physiology
There are a number of low-level system models of interest in the analysis of relevant
resource concepts. We here analyse animal (ANT) and human nutrition theory (HNT),
respectively.
A fair understanding of processes on physiological level within plants, animals and
humans is a prerequisite for a sustainable development. This is required knowledge for
understanding human-induced environmental and human health effects. Nutrition theory
(NT) is a part of physiology. A central theme in NT is how to quantify/measure the
nutritive value of feeds and foodstuffs in physiological processes such as maintenance,
growth, motion, lactation, gestation, traction taking into consideration characteristics of the
feed/food as well as the individual consuming the feed/foodstuff. Therefore, it is plausible
that NT may have something to offer in a further development of resource-concepts.
The characteristics of the resource (the feed) are a function of the resource-producing
system such as crop production. Here the environment, such as climate and soil fertility at
the actual location, plays a significant role, in interaction with choices of the crop producer
regarding crops used and cultivating practices applied. The nutritive value of feeds is at the
same time a function of the characteristics of the ‘‘consumer’’. Typical relevant charac-
teristics of the consumer are species, breed, sex, age, production level, to mention a few.
Resource-measures in NT are a function of the system producing the resource, thus in that
sense ‘‘donor’’-based, and a function of the consuming system, thus ‘‘receiver-based’’
(McDonald et al. 1981; NRC 2001).
One challenge of sustainable development is how to manage the conflict between sufficient
and sustainable production. ANT, has, like other areas of agricultural sciences, for decades and
centuries struggled with this conflict. The system manager—dairy cow—rumen microbes
constitutes a system inwhich onechallenge is tomake the dairy cow—rumen systemperform in
such a way that the objective of the owner of the cows is fulfilled. This implies
1. Acknowledging the relevance of thresholds and resilience within the dairy cow—
rumen system, to be able to exploit those domains where continuous dose—response
relations dominates, while at the same time
860 S. Hellstrand et al.
123
2. Take the actual position within the global ecological economic network into
consideration.
The manager that fails condition (a) will experience a too high prevalence of cata-
strophic shifts of the ecosystem dairy cow—rumen expressed in terms of severe illnesses.
NRC (2001) discusses a number of severe feeding related dairy cow diseases, which are a
result of imbalances between the dairy cow and the rumen system. The manager that fails
condition (b) will show too low profit, and thus, given her/his socio-economic context,
become economically unsustainable. Crop production and agriculture in general has for
thousands of years dealt with principally the same challenge between sufficient and sus-
tainable (food) production. When the equation was not solved, civilisations were
threatened.
The position of ANT in the system in Fig. 2 is among primary sector enterprises. ANT
concerns important conversion/transformation processes in the animal production sub-
system in the agro-ecosystem. In these processes, food such as milk, meat and eggs with
high human nutritive value are produced from inputs such as crops and forages, which in
turn are the outputs from the conversion/transformation processes in the crop production
subsystem in the agro-ecosystem. Another output is manure, which in some contexts is a
valuable product and in other contexts a burden in economic and ecological terms.
When agriculture was introduced, the carrying capacity of the Earth in terms of the
number of people that could be fed increased by a factor of 100 to 1,000. Animal pro-
duction was one important means in this technology shift. It can increase the capacity of
ecosystems to fulfil basic human needs. McNeill (2001) estimated the global population
8,000 B.C. to 11 million people. Currently, we are ca 6 billion, and are estimated to reach
ca 10 billion around 2050, i.e. 1,000 times the population around the time agriculture was
introduced. Current productivity in agriculture is heavily dependent on industrial pro-
duction forms with huge dependency on high energy inputs. Pimentel and Pimentel (2008)
provide estimates where hunters and gatherers need 150-50,000 ha of land for food supply
per person. As a comparison, the amount of arable land per capita in Sweden is ca 0.25 ha,
and the total land area is ca 5 ha. The population density in Sweden is low. Of course, such
huge interference with biological high productive land as agriculture is, causes environ-
mental effects. The environmental impact per unit human well-being supplied through
global animal production is currently increasing, where current socioeconomic trends
implies a major shift from vegetables to animal products, not seldom to a population
already suffering from obesity (Lundqvist 2007). This results in substantial and negative
trade-offs between animal production, environmental effects and global food security. This
is the cause for the FAO-report (Steinfeld et al. 2006), Livestock’s long shadow, about
environmental consequences of current trends.
WHO (1985, p. 12) defines human energy requirements:
The energy requirement of an individual is the level of energy intake from food that
will balance energy expenditure when the individual has a body size and composi-
tion, and level of physical activity, consistent with long-term good health; and that
will allow for the maintenance of economically necessary and socially desirable
physical activity. In children and pregnant or lactating women the energy require-
ments includes the energy needs associated with the deposition of tissues or the
secretion of milk at rates consistent with good health.
Thus, the position of HNT in Fig. 2 is in Compartment III, with implications on Com-
partment II. The nutrition of humans concerns one of the basic physiological needs. If parts
The relevance of ecological and economic policies 861
123

of a population are undernourished while other are over-fed, there are welfare costs
because basic needs are not fulfilled for some while other suffer from obesity, and the
distribution of resources fundamental for a decent life is uneven: The world for food in
Sweden is ‘‘Livsmedel’’, which in translation is ‘‘Means for life’’.
Under-nourishment affects the economic sustainability, through decreased productivity
of the labour force. Food habits are closely related to health standards and thus to health
care costs. However, most important are the social costs if basic needs are not met or if the
resources are too unjustly distributed. The consequences of this can be personal suffering
and social conflict. Currently, the prevalence of hunger and obesity is significant
(Lundqvist 2007).
ANT and HNT, thus, are at the centre of the issue of a sustainable development, with
substantial importance for the understanding of its social, economic and environmental
dimensions.
We propose that the way the conversion of energy and nutrients are treated in the
metabolism of organisms in NT may be of general interest for the understanding of
conversion of energy and materials in the metabolism of societal systems. Compared to
PRT, this would add some valuable features. The importance of physiological process
constraints for global food security is considered. Estimates are based on process con-
straints affecting conversion efficiencies in real situations. Estimates are context-
dependent.
3.3 Economic theory
The actor is the economic man. The organising principle is the striving of the actor to
maximise own ‘‘utility’’. Value is determined on the market through selection by com-
petition, and measured in monetary terms. The result is the evolution of economic systems.
The producer who in competition manages to produce a product at a price that consumers
are willing to pay will survive. The values that occur on the market are set at the inter-
section between the demand and the supply functions (curves) after selection through
competition. At the market price no producer is willing to produce another unit and no
consumer is willing to buy another unit.2 Thus, the value in the market economy is a
function of both production costs and the consumer’s willingness to pay; it is a function of
the conditions of the situation with regard to the producer and the consumer. To be precise:
In economic theory, consumer surpluses used in welfare economics are receiver-based,
while exchange values are market-based, and thus both receiver- and donor-based.
Values are, thus, context-dependent. They are set in real systems while considering
social, economic and ecological process constraints. However, the sustainability issue
shows that current consideration of social, economic and ecological factors in the economy
is not always sufficient. Only resources that are scarce from the point of view of final
consumption are considered in ET. On the market only uses of resources for which an actor
has the capacity to charge a price, due to ownership and institutional support, will be
considered in the price.
Natural resource economics, agricultural economics and environmental economics
focus mostly on the interface between Compartments I and II in Fig. 2. The first two
concern mostly the resource flows from I to II, and the latter the flows (pollution) that goes
the other way. Industrial organisation and growth theory focuses on the value-adding
processes within Compartment II. GDP can be measured as the sum of all value added in
2 The problems of estimating the values of consumer or producer surpluses are not considered here.
862 S. Hellstrand et al.
123

Compartment II or the flows of goods and services, or wages and capital returns, through
the interface between Compartments II and III, where the exchange values (relative prices)
are established. Micro- and macroeconomics focus mostly on market transactions taking
place at that interface on the individual/firm and societal level respectively. In Compart-
ment III, human needs and desires are satisfied, which is analysed in welfare economics.
By, for example, using the consumer surplus, the total utility received by consuming a
product, including the distributional aspects, and not only the market price, can be brought
into the analyses. Welfare economics is not only concerned with the social aspects but also
with ecological aspects such as environmental degradation, as humans value not only
marketed goods and services but also goods and services provided directly by Nature, and
the state of the Environment as such, as well.
3.4 Emergy theory
Howard Odum is, together with his brother Eugene Odum, one of the pioneers in systems
ecology. The importance of H. Odum’s work for ecological economics and a variety of
other disciplines concerned with sustainable development is acknowledged by, e.g. Hall
(1995) and Cleveland et al. (2000). In later years, he synthesised his knowledge in emergy
analysis. In this paper, we mainly discuss concepts in the EmT behind emergy analysis.
The following, brief summary, is mainly based on Odum (1988), an article in Science,
although he also published widely during the 1990s. The reason to focus on Odum (1988)
is that this is when the EmT was probed on the highest level within the scientific com-
munity. Furthermore, most of available EmT-papers have been published within the frame
of the descriptive domain evolved by Odum. Therefore, they have not been exposed to
external, independent critique to the same extend.
In emergy analysis the studied system is linked to the surrounding economic and
ecological system back to the basic flows and stores feeding the processes in the biosphere.
Within the economic systems, the method is capable of analysing both monetary flows and
material flows. Emergy analysis considers quality differences between different energy
forms. This results in energy hierarchies, where one energy unit at a later stage in a chain
of energy transformations has higher value compared to earlier stages. There is a loss of
energy at each energy transformation step. Thus, there is a strong linear approach in the
emergy analysis, where value is added in each step where energy is added. The analogy to
the labour-value concept of Marx is strong, and explicitly acknowledged by Odum (1996).
Possible strengths of the emergy analysis is the linkage of the studied system to sur-
rounding economic (Compartment II and III, Fig. 2) and ecological systems (Compartment I)
back to the basic stores and fluxes feeding it; and the parallel analysis of monetary and
material fluxes, respectively. However, whether these are real strengths, depend on the
relevance of how these dependencies are expressed. Emergy analysis does not focus on the
human actor and his utility in compartment II and III as ET does, but on the whole system,
where compartment II and III are seen as subsystems of compartment I, i.e. it is eco-centric.
Odum (1995, p. 521) claims that his energy systems approach is a general systems
formulation of which there are examples in each field, and that there are special cases of
the general principles in electrical, mechanical, biological, geological and economic sys-
tems. If so, the position of EmT in Fig. 2 is the whole system presented. The conclusion
about EmT as a general system formulation with special cases expressed within a wide
range of fields is a claim that emergy analysis is a major tool supporting all aspects of a
sustainable development. Such claims have been made, see, e.g. Odum (1988; 1996) and
Brown and Ulgiati (1999). This calls for a thorough examination of its basic logics.
The relevance of ecological and economic policies 863
123

Odum in 1988 defines emergy (p. 1135):
as the energy of one type required in transformations to generate a flow or storage.
We will look closer at three basic emergy concepts: (1) the transformity, (2) the maximum
empower principle and (3) the proposal that the emergy cost calculated for a product or
process measures the value of the product or process in the system, in case selection
through competition has operated.
Odum (1988, p. 1135) defined transformity as:
Extending food chain concepts to thermodynamics generally, we defined a new
quantity, the transformity, which is the amount of energy of one type required to
generate a unit of energy of another type (in real competitive conditions of optimum
loading for maximum power).
In connection with the definition of transformity, Odum proposed that
a transformation is useful only if it is to a higher quality that can amplify more with
less energy. Work will not become part of a real world system unless it includes
transformation to a product that can reinforce another flow. Thus, real work is
redefined as a useful energy transformation.
Odum (1988) ‘‘transformed’’ the food chain concepts to evaluation of value in processes in
ecosystems in general. Transformity, in emergy analysis, is the sum of emergy in inputs per
unit energy in the product, the unit being solar emergy joules (emjoules) per Joule. The
purpose of the transformity is to support an expression of resources on a common
denominator, which considers the differences between qualities in real, not ideal, condi-
tions. The transformity concerns processes in real systems exposed to selection through
competition.
Odum (1988, p. 1135) formulated the maximum empower principle as the principle of
self-organisation for maximum emergy use. He proposed a connection between emergy
and value (pp. 1135–1136):
self-organizing systems use stores and flows for purposes commensurate with what
was required for their formation. To do otherwise is to waste resources, making
products without as much effect as alternative designs. Thus, emergy appears to
measure the value of a flow or storage to a system in the long run after self-
organizing selection processes have been at work.
The proposal that emergy measures the value of a flow or process is linked to the definition
of the transformity: it concerns processes in real competitive conditions of optimum
loading for maximum power (Odum 1988). Thus, he suggested that emergy measures the
value of a product or service to a system, if this product or service exists in a real system
that has been exposed to selection through competition.
There are similarities between basic concepts in EmT and ET.
However, there is an internal conflict within EmT, where value is sometimes defined as
both donor- and receiver based (see above), while at other times strictly defined as donor
based (see Odum 1988, 1995, 1996, 1998; Brown and Ulgiati 1999). Thus, Cleveland et al.
(2000), rejected emergy concept in their analysis of fuel qualities, by a similar argument as
they rejected exergy: The information about the value in the receiving system was limited,
given the context of that system in the specific situation.
864 S. Hellstrand et al.
123

4 Comparisons of resource concepts
Based on the results of the previous analysis, we locate the investigated theories in a Life–
System Complexity dimension as in Fig. 3.
As in all analyses of complex systems, this exercise contains an element of subjectivity.
We locate PRT at the point (0; 3). The x-value is 0 because life is outside the system
borders of physics, and thus PRT. Thus, the capacity to handle system complexity in a
sustainability context, where life is a significant system-feature, is limited. Therefore, the
y-value 3:
With the basic resource concept exergy defined under freedom from such process
restrictions that defines ecological, economic and social sustainability limits, and pre-
supposing thermodynamic ideality, implying that the mere word resource lacks meaning;
and where the definitions of the other basic resource concepts entropy and negentropy is
strongly related to the definition of exergy, the capacity of resource concepts in PRT to
capsulate typical system features of life such as thresholds, resilience, irreversibilities, food
security, trade-offs between economic and ecological objectives, trade-offs between dif-
ferent ecosystem services and goods; i.e., the features of life in micro organisms, plants,
animals and humans is strongly limited. The map is abstracted too far away from the
sustainability-terrain.
We give EmT x-value 5 and y-value 6. EmT deals with complex systems. The slightly
lower value for the x-value is motivated by the focus on the donor-perspective in defining
value, implying that actual impact in living systems (‘‘the receiver’’) is of secondary
interest. Furthermore, in the definition of the basic concept ‘‘emergy’’ in emergy analysis in
Odum’s later work, (see e.g. Odum 1996), the dependency of the exergy concept is
stronger than before, implying that the weaknesses in the exergy concepts is influencing the
emergy concepts at its core. This reduces the capacity of EmT to represent the true
complexity of systems with interdependencies between systems and system levels. One
reflection of this is the limited capacity to handle eco-toxicological effects, where impact
on cellular and sub cellular physiological level, has a major influence on system perfor-
mance on macro-scale. This is partly the reason why we give EmT substantially lower
x- and y-values than NT and ET. Another reason is the combination of (a) very vast system
borders, including the total system in Fig. 2, and even the Universe, and (b) the strive to
deliver very aggregated results (in the emergy-dimension only). The EmT is abstracted so
far away from real world systems, that vital parts providing meaning is lost. The ‘‘map’’, is
00
2
2
4
4
6
6
8
8
10
10
12
12
Significance of life as system characterstic
Syst
em c
ompl
exit
y
Complexity
PRT
ET
EmT
NT
Fig. 3 The location ofinvestigated theories in a Life–System Complexity dimension
The relevance of ecological and economic policies 865
123

abstracted to far from the terrain. The mere ambition of general relevance results in
shallowness. Thus, the significance of achieved emergy values for operative decisions in
real world situations is unclear. A further limitation for EmT as a basis for policies for
human well-being is the indifference to human life, as it is eco-centric.
We give high x- and y-values for ET and NT, with a slightly higher y-value for ET, andx-value for NT, respectively. The reason is that ET has a stronger general system-per-
spective, while NT is stronger in its capacity to catch interdependencies from very low
physiological level to high ones, from cellular and sub-cellular physiological level to the
first UN Millenium Development Goal, eradicating extreme poverty and hunger.
Economic systems are highly complex, where life as system characteristic is important.
The nutritive systems of humans and animals are highly complex, and, it is at the core of
the issue of life as system characteristic. In ET and NT higher and lower system levels
restricts each other’s. ET and NT have high capacity to catch the network- or web-
character of living systems where humans matter. From resource concepts in ET and NT,
respectively, future resource concepts can be developed that better capsulate both eco-
logical source- and sink-restrictions in the societal metabolism of natural resources, and in
doing that, recognise interdependencies between systems and system levels. Interesting is
that market values in the analysis by Cleveland et al. (2000) had high capacity to reflect
natural resource qualities of fuels, while exergy and emergy had low. Thus, resource-
measures of ET had a higher precision to measure actual physical resource-quality dif-
ferences, than resource concepts of EmT and PRT. The reasons for this are something to
further explore within this fields, in a further development of their concepts.
Emergy theory can make a contribution on conceptual level, in the process of identi-
fying the system-structure at hand, when in general terms developing future resource
concepts from an integration of ET and NT. Simultaneously, NT and ET can merge into
EmT, increasing its practical relevance.
In this process, PRT has little to offer, as Kaberger and Mansson (2001) so rightly
conclude: PRT is suitable to apply in technical and industrial contexts. In socio-economic
and ecological contexts, its value is limited.
5 Discussion
The analysis in the paper is not only of an abstract, academic interest. Pending the way
conceptual models are set up, the resource limits to the global economy differ by a factor
10,000.
Kaberger and Mansson (2001), based on resource concepts from PRT, conclude that the
current influx of resources through sun light is a factor 10,000 higher than the current use in
the global human economy. The Royal Swedish Academy of Agriculture and Forestry in a
document that expresses the opinion regarding research needs in the green sectors of 21
organisations to the government, with the ambition to influence the national research
policy (KSLA 2007), arrives at a similar estimate. Meadows et al. (1992) conclude that the
solar energy influx is ca 16,000 times the current human use of fossil fuels.
In contrast to these measures, the estimate provided by Odum (1988) implies that the,
human use of previously stored resources, was 1.5 times higher than the resource influx
through solar light. That is, human interference with global ecological resource fluxes was
profound.
866 S. Hellstrand et al.
123
A. Assume that the measures (excluding the one of Odum) are correct, i.e., that the
methods by which the results were provided in a relevant way reflect such ecological
source and sink restrictions that in the real world defines resources value in socio-
economic systems, where the objective is to support human wellbeing without risking
ecological sustainability, and paying due attention to thresholds and resilience,
including functional biodiversity. If so, current discussions about resource restrictions
to global society regarding land, food, bioenergy, fossil fuels, phosphorus, water, is an
illusion. It is not a restriction in the supply of resources per se, it is a restriction in the
human capacity to utilise an abandoned flux of renewable resources, solar energy.
Actually, this is the argumentation in KSLA (2007), aiming at influencing the
Swedish governments criteria for the size and allocating of future research fundings. If
this is reality, research fundings in Sweden and other nations should be focused on
technological progress colonizing this still mainly unused resource flux: The natural
resource budget of the global society is just 0.0001 times the solar energy resource
influx.
B. However, another interpretation is possible. Measured this way, human appropriation
of global environmental space, is 0.0001 the available environmental resource space.
That can be assumed equal to non-existing. Thus, continued exponential material
growth of the global economy can be sustained to a volume that in physical terms are
10 and 100 times the current one. However, at the output side of the economy, i.e.,
when considering ecological sink restrictions, a slightly different picture evolves.
Eutrophication, increased levels of ozone close to the ground, amount and effects of
chemical hazards, human health effects due to environmental disturbances, global
climate change and its possible socio-economic and security impacts, sign that the
possible ‘‘illusion’’ of a resource restriction problem, can by itself be an illusion. If so,
it can be a product of resource measures defined by models abstracted so far away
from real world systems, that their capacity to catch real world limits to natural
resource use is limited.
Assume that B is the case, while scientists, wrongly, argues that A is the case. Then the
policy-sphere has a problem. Scientists offer an emergency exit to the policy-sphere, where
they on the one hand, can cope with a sustainable development, based on fluxes of
renewable resources, i.e., solar energy. On the other hand, they can benefit for another 300
years from a continued exponential material growth of the global economy by 2% per year,
and still with margin remain within global carrying capacity limits, only 3.8% of it is
appropriated. And, with such sustainable growth potentials, there is no need for the poli-
ticians to really address the tricky distribution issue within and between nations: The future
promises luxury for all at least the coming 300 years, through ‘‘sustained’’, even increased
exponential material economic growth.
We suggest that this situation is a part of the cause for the implementation gap of a
sustainable development, identified by OECD (2001). The scientific community has not
yet, in a sufficient way, been able to capture the combined effect of ecological source
and sink restrictions for a sustainable development. Natural resource measures are in
this context crucial, because they define our current position in relation to ecological
source- and sink-restrictions. As shown above, the estimate of the size of human use of
natural resources in relation to the solar resource influx, differ a factor of 10,000
between EmT and PRT. Whether either (or none) of these measures are correct, has
major influence on what future policies that are rational, in the context of future sus-
tained human well-being.
The relevance of ecological and economic policies 867
123

This strategic reasoning shows why it is important to develop resource concepts that
capsulate real world sink- and source restrictions, thus supports policies for increased
sustainable human well-being. This is needed in a world where the drawbacks from Nature
to Society due to the pressure that Society puts on Nature are clearer than maybe ever
before.
6 Conclusions
In the context of a sustainable development, there is a need for natural resource concepts
with an improved capacity to capsulate:
– Ecological sink- and source restrictions.
– Use-value in receiving systems.
– Interdependencies between systems and system levels.
– The significance of physiological effects in micro organisms, plants, animals, and
humans for a sustainable development.
– The significance of thresholds, resilience and biodiversity.
We suggest that the sustainability map presented in this paper supports that purpose.
The integration of vital features in ET, NT and EmT will contribute. However, PRT has
little to contribute, basically due to the fact that life, as a system characteristic, lies outside
the system borders of physics and therefore of PRT, and life is at the core in a sustainable
development.
Acknowledgements This study was performed with financial support from Ekhagastiftelsen, Nutek—theSwedish Agency for Economic and Regional Growth, The Nordic Council of Ministers, and the SwedishEnvironmental Protection Agency.
References
Brown, M. T., & Ulgiati, S. (1999). Emergy evaluation of the biosphere and natural capital. Ambio, 28,486–493.
Cleveland, C. J., Kaufmann, R. K., & Stern, D. (2000). Aggregation and the role of energy in the economy.Ecological Economics, 32, 301–317.
Common, M. S., & Perrings, C. (1992). Towards an ecological economics of sustainability. EcologicalEconomics, 6, 7–34.
Costanza, R. (1994). Three general policies to achieve sustainability. In A.-M. Jansson, M. Hammer, C.Folke, & R. Costanza (Eds.), Investing in natural capital: the ecological economics approach tosustainability (pp. 392–407). Washington: Island Press.
Costanza, R., & Perrings, C. (1990). A flexible assurance bonding system for improved environmentalmanagement. Ecological Economics, 2, 57–75.
Daly, H. E. (1990). Toward some operational principles of sustainable development. Ecological Economics,2, 1–6.
Daly, H. E., & Cobb, J. B. (1989). For the common good: redirecting the economy toward community, theenvironment, and a sustainable future. Boston: Beacon Press.
Drake, L., & Hellstrand, S. (1998). The Economics of the Swedish Policy to Reduce Cadmium in Fertilisers.Solna: Kemikalieinspektionen PM no 2.
Giampietro, M. (2003). Multi-scale integrated analysis of agroecosystems. Boca Raton: CRC Press.Hall, C. A. S. (Ed.). (1995).Maximum power: the ideas and applications of H. T. Odum. Boulder: University
Press of Colorado.Hellstrand, S. (1997). Reduction of the discharges on the local level not always sustainable: A Swedish
example. Proceedings, Pulp & Paper Conference, March 9–13, 1997. Orlando, Florida.
868 S. Hellstrand et al.
123

Hellstrand, S. (2006). A multi-criteria analysis of sustainability effects of increasing concentrate intensity inSwedish milk production 1989–1999. Environment, Development and Sustainability, 8(3), 351–373.
Hellstrand, S., & Landner, L. (1998). Cadmium in fertilizers, soil, crops, and foods—the Swedish situation.In Cadmium exposure in the Swedish environment. KEMI report no. 1/1998.
Hellstrand, S., & Landner, L. (2001). Role of phosphorus in sustainable agriculture and the cadmium issue.In J. K. Syers & M. Gochfeld (Eds.), Proceedings of the SCOPE-Workshop, Belgian Academy ofSciences, Brussels, Belgium, 13–16 September 2000. (Financially supported by the Royal Academyof Sciences of Belgium, the Institute Mondial du Phosphate (IMPHOS), and the U.S. National Instituteof Environmental Health Sciences).
Holling, C. S. (1973). Resilience and stability of ecological systems. Annual Review of Ecology andSystematics, 4, 1–24.
Holling, C. S. (1986). The resilience of terrestrial ecosystems: local surprise and global change. In W. C.Clark & R. E. Munn (Eds.), Sustainable development of the biosphere. Cambridge: CambridgeUniversity Press.
Jansson, A.-M., Hammer, M., Folke, C., & Costanza, R. (Eds.). (1994). Investing in natural capital: Theecological economics approach to sustainability. Washington: Island Press.
Kay, J. J. (1991). A nonequilibrium thermodynamic framework for discussing ecosystem integrity. Envi-ronmental Management, 15, 483–495.
Kaberger, T. (1999). Aspects of energy resource management. Ph.D. dissertation, Department of PhysicalResource Theory, Chalmers University of Technology and Goteborg University, Goteborg.
Kaberger, T., & Mansson, B. (2001). Entropy and economic processes—Physics perspectives. EcologicalEconomics, 36, 165–179.
KSLA. (2003). Forskning for gron framtid. Stockholm: KSLA.KSLA. (2007). Det grona kunskapssamhallet. Stockholm: KSLA.Landner, L. (1990). Chemicals in the aquatic environment. Advanced hazard assessment. Berlin: Springer.Landner, L. (1994). How do we know when we have done enough to protect the environment? Marine
Pollution Bulletin, 29, 593–598.Landner, L., Folke, J., Oberg, M. O., Mikaelsson, H., & Aringberg-Laanatza, M. (1996). Cadmium in
Fertilizers—Consultants report prepared for the OECD Cadmium Workshop, Saltsjobaden, Sweden,16–20 October 1995.
Landner, L., Hellstrand, S., & Mikaelsson, H. (2000a). Cadmium in phosphate fertilisers: Consequences ofan eventual European standard limit. Stockholm: AF-Environmental Research Group Ltd. (AF-MFG).
Landner, L., & Reuther, R. (2004). Metals in society and the environment. Dordrecht: Kluwer AcademicPublishers.
Landner, L., Walterson, E., & Hellstrand, S. (2000b). Copper in sewage sludge and soil. A literature reviewand critical discussion of disposal of copper-containing sludges to agricultural land. New York:International Copper Association Ltd.
Lundqvist, J. (2007). Food chain dynamics and consumption trends: Implications for freshwater resources.In U. Aswathanarayana (Ed.), Food and water security (pp. 187–198). London: Taylor & Francis.
McDonald, P., Edwards, R. A., & Greenhalgh, J. D. F. (1981). Animal nutrition (3rd ed.). London: LongmanGroup Limited.
McNeill, J. R. (2001). Something new under the sun. New York: W. W. Norton & Company.Meadows, D. H., Meadows, D. L., & Randers, J. (1992). Beyond the limits: Confronting global collapse,
envisioning a sustainable future. Vermont: Chelsea Green Publishing Company.Millennium Ecosystem Assessment (2008). Accessed February 21, 2008 from http://www.
millenniumassessment.org/en/index.aspx. (From this website, links to all books and reports pro-duced are found, as well as overview information about the Millennium Ecosystem Assessment.)
NRC. (2001). Nutrient requirements of dairy cattle (7th ed.). Washington: National Academic Press.Odum, E. P. (1985). Trends expected in stressed ecosystems. BioScience, 35, 419–422.Odum, E. P. (1989). Ecology and our endangered life-support systems. Sinauer Associates, Inc: Sunderland,
MA.Odum, H. T. (1988). Self-organization, transformity, and information. Science, 242, 1132–1139.Odum, H. T. (1995). Energy system concepts and self-organization: a rebuttal. Oecologia, 104, 518–522.Odum, H. T. (1996). Environmental accounting. New York: Wiley & Sons.Odum, H. T. (1998). Emergy evaluation. In S. Ulgiati, M. T. Brown, M. Giampietro, R. A. Herendeen, & K.
Mayumi (Eds.), Proceedings of the International Workshop Advances in Energy Studies Energy flowsin Ecology and Economy, Porto Venere, Italy, 26/30 May, 1998.
OECD. (2001). Policies to enhance sustainable development. Meeting of the OECD Council at Ministeriallevel, 2001. Accessed March 29, 2008 from http://www.oecd.org/dataoecd/47/22/1869800.pdf.
The relevance of ecological and economic policies 869
123

Perrings, C. (1994). Biotic diversity, sustainable development, and natural capital. In A.-M. Jansson, M.Hammer, C. Folke, & R. Costanza (Eds.), Investing in natural capital: The ecological economicsapproach to sustainability (pp. 92–112). Washington: Island Press.
Perrings, C., Folke, C., & Maler, K.-G. (1992). The ecology and economics of biodiversity loss: Theresearch agenda. Ambio, 21, 201–211.
Pimentel, D., & Pimentel, M. H. (2008). Food, energy, and society (3rd ed.). CRC Press, Taylor & FrancesGroup: NewYork.
Regeringen (2004). En svensk strategi for hallbar utveckling: Ekonomisk, social och miljomassig,Regeringens skrivelse till riksdagen 2003/04:129.
Scheffer, M., Carpenter, S., Foley, J. A., Folke, C., & Walker, B. (2001). Catastrophic shifts in ecosystems.Nature, 413, 591–596.
Steffen, W., Sanderson, A., Tyson, P. D., Jager, J., Matson, P. M., Moore, B., et al. (2004). Global changeand the earth system: A planet under pressure. New York: Springer-Verlag.
Steinfeld, H., Gerber, P., Wassenaar, T., Castel, V., Rosales, M., & de Haan, C. (2006). Livestock’s longshadow: Environmental issues and options. Rome: FAO.
Szargut, J., Morris, D. R., & Steward, F. R. (1988). Exergy analysis of thermal, chemical and metallurgicalprocesses. New York: Hemisphere.
UN. (2002). Report of the World Summit on Sustainable Development, Johannesburg, South Africa, 26August–4 September 2002. New York: United Nations.
UN. (2008). Accessed February 25, 2008 from http://www.un.org/millenniumgoals/#.UNDP. (2008). Accessed February 24, 2008 from http://www.undp.org/biodiversity/mdgandbiodiversity.
html. (This website provides information from UNDP regarding the Millennium goals and biodiversity.)Wall, G. (1986). Exergy: A useful concept. Ph.D. dissertation in physics, Physical Resource Theory Group,
Chalmers University of Technology, Gothenburg.WHO. (1985). Energy and Protein Requirements. Report of a joint FAO/WHO/UNU Expert Consultation.
WHO Tech. Rep. Ser. 724. Geneva: WHO.
870 S. Hellstrand et al.
123

Paper II


A biophysically anchored production function
Stefan Hellstrand • Kristian Skanberg • Lars Drake
Received: 12 February 2009 / Accepted: 16 September 2009� Springer Science+Business Media B.V. 2009
Abstract The first part presents a conceptual model of the economic system in its eco-
logical and social context. It is developed via an integration of basic concepts in physical
resource theory, animal and human physiology, economic theory and systems ecology. The
capacity of the model to support analysis of such complex systems where life is a key
system characteristic is high. The conceptual model shows the dependency of the human
economy on support by non-renewable and renewable resources from Nature (i.e. eco-
logical source restrictions), as well as the capacity of ecosystems to assimilate wastes
(ecological sink restrictions). The analysis focuses general principles; thus, the high level
of abstraction results in an apparent simplicity. In the second part, we integrate traditional
economic production functions and the conceptual model, which results in the formulation
of a biophysically anchored production function (BAPF). The BAPF by itself, and through
the system of ecological economic accounts that can be derived from it, represent a toolbox
that supports the operationalisation of a sustainable development from micro to macro
level. It is coherent with Impredicative Loop Analysis, existing management systems
within agricultural sciences, OECD’s principles for sustainable development and the
approach of Millennium Ecosystem Assessment. Compared to analytical approaches used
in the formulation of sustainability policies in the private and public sphere, based on
conceptual models ignoring the complexity when life (bios) is a defining system charac-
teristic, its relevance for the operationalisation of sustainable development approaches
infinity. The third part presents results from statistical analysis of relations between gross
Readers should send their comments on this paper to [email protected] within 3 months of publicationof this issue.
S. Hellstrand (&)School of Sustainable Development of Society and Technology, Malardalen University, Tolita 8,665 92 Kil, Swedene-mail: [email protected]
K. SkanbergDepartment of Forest Economics, Swedish University of Agricultural Sciences, Uppsala, Sweden
L. DrakeSwedish Chemical Agency, Sundbyberg, Sweden
123
Environ Dev SustainDOI 10.1007/s10668-009-9212-5

domestic product and energy supply and some emissions, respectively, for different nations
and time periods, delivering values on levels and trends for parameters in the BAPF as well
as a first test of the relevance of the BAPF proposed. The paper is ended by a theoretical
analysis of the costs of provoking an economic system working under ecological source
and sink restrictions to follow exponential growth: The need to decouple economic growth
from natural resource use and emissions is highlighted. Otherwise, the erosion of the
ecological foundation of the economy with regard to source as well as sink aspects will be
a function of exponential growth.
Keywords Biophysical productivity � Energy use � GDP � Emissions �Time trends
AbbreviationsBAPF Biophysically anchored production function
EROIE Energy return on invested energy
GDP Gross domestic product
HC Human capital
MMC Man-made capital
NC Natural capital
NDP Net domestic product
NNC Non-renewable natural capital
NNR Non-renewable natural resources
NR Natural resources
RNC Renewable natural capital
RNR Renewable natural resources
SC Social capital
1 Introduction
1.1 Economic theory and land
In classical economic theory, land was used as a synonym for ecosystems including natural
resources. In the following, ‘‘land’’ and ‘‘Nature’’ is used with that interpretation. During
the eighteenth and nineteenth century, the interest focused on the capacity of land to
produce natural resources, i.e. on its (re-) source function. In that period, the waste
assimilative capacity of land, the sink capacity, was not a major economic restriction.
During the twentieth century, the use of non-renewable resources such as fossil fuels and
phosphorous fertilisers increased. The increasing use of non-renewable resources, which at
the time seemed unlimited, made the land constraints to the economy appear to be less
pressing. As a consequence, the interest in economic theory during the twentieth century
focused on the productivity of labour and capital while taking the support from Nature for
granted. Daly and Cobb (1989) give an overview of the development of economic theory
over centuries. A late example from the policy sphere of the ignorance of the production
factor land is the Swedish Productivity Commission, initiated by the government, with the
task to perform an extensive analysis of the Swedish economy and its productivity issue
and from that basis suggest a united strategy to secure future durable development of the
S. Hellstrand et al.
123

Swedish welfare (SOU 1991). Currently, reported interactions between ecological and
economic systems are once again moving the focal point towards the economic signifi-
cance of the source and sink capacities of land. This is the core message in the concern for
a sustainable development regarding its ecological dimension. The concept a sustainable
development was established by the so-called Brundtland Commission (see WCED 1987).
There are a number of expressions of this concern around 1990 within the, at that time
emerging discipline, ecological economics (e.g. Common and Perrings 1992; Costanza
1994; Daly 1990; Daly and Cobb 1989; Perrings et al. 1992). There are expressions of the
same perspective within the policy sphere on a high authoritative level around 10 years
later, from an OECD council meeting at ministerial level (OECD 2001), and at the
intersection between science and the policy sphere through the Millennium Ecosystem
Assessment (MEA 2009). Concern for the sustainability of the human progress was
expressed also much earlier by important authors, see the comprehensive review by
Martinez-Alier (1987) and the writings of Georgescu-Roegen.
However, economical models including labour and capital, but not land are still guiding
economic policy in most industrial countries. Such models are indifferent to the ecological
dimension of sustainability. The fact that a report about policies to enhance a sustainable
development was produced at the OECD ministerial level (OECD 2001) is an expression of
the lack of policies in work efficiently promoting a sustainable development. This report
stressed the implementation gap regarding a sustainable development: It concludes that
though we quite well know and agree upon what as is needed to achieve a sustainable
development, policies at place are at a low and uneven level. The report also states that the
understanding of a sustainable development is well within the borders of economic theory.
We propose that one important reason for the implementation gap is that though the
economic discipline now in abstract terms are ‘‘recycling’’ land as production factor as a
function of the sustainability context due to overall general long-term policy objectives, the
core of the operative tools yet applied in public and private sphere are derived from
economic models ignoring the importance of land. This causes a gap between overall
objectives and the consequences of the total impact of everyday choices.
1.2 ‘‘Environmental analysis’’ and land
Another reason we propose causing the implementation gap is the following. In the
sequence of ecological succession, when new resources become available they are first
utilised by organisms and systems, which have their competitive advantage in the rate by
which they can colonise new resources. This is extensively treated in Odum (1989) and is
one important foundation for the maximum empower principle proposed by Odum (1988)
as a universal principle for self-organising systems. In metaphorical terms, the growing
priority given to the concept of sustainable development in private and public sphere
nationally and internationally triggered an increasing demand on management tools that in
a cost-efficient way could communicate to citizens and consumers that the issue was taken
care of.
• In the short term, that put a selection pressure in favour of approaches that combined
– the criteria of minimising problems in the business-as-usual actions within
authorities and in enterprises and
– appropriated little financial resources, and made the citizens and consumers happy,
that is minimised the short-term negative consequences.
A biophysically anchored production function
123

• Assume that a sustainable development in reality
– introduces something fundamentally new needed to consider in management
systems such as the consequences of mutual dependencies between systems and
system levels and the need of considering the values of different affected groups
now and in the future, resulting in the complexity of the systems in focus in a
sustainable development,1
– implies that the natural resource use and emissions in developed nations must be
reduced and
– that the ethical base in the concept a sustainable development is strong, as it concerns
some level of even distribution of resources within and between generations.
If so, the concept of a sustainable development will have substantial impact on the
everyday work of authorities, enterprises and individuals. Common and Perrings (1992)
found that a sustainable development is not per definition an objective that is expressed in
consumers preferences. Thus, a probable outcome of the made assumptions is that in the first
phase the demand on analytical tools andmanagement systems to copewith the new concept a
sustainable development is steered towards alternatives that support the illusion that nothing
really is needed to be changed in the everyday actions of authorities, enterprises and indi-
viduals, more than some insignificant choices with high symbolic value. Odum (1989) dis-
cussed the urban-industrialised landscape and its activities as a parasite on the cultural and
natural landscape from a system-ecological perspective. As the major part of the assets in
developed nations are located in the urban-industrialised landscape and owned by the actors
engaging in its activities, it is quite clear that the first phase of analytical tools will meet the
demand of the actors of the urban-industrialised landscape of results that communicate their
high sustainability performance profile. Oneway tomeet that demand is to develop analytical
approaches for analysis of the environmental impact of production
• based on existing analytical approaches regarding industrial production systems,
• focusing the technical, engineering aspects of production and
• ignoring vital parts of the ecological, economic and social dimensions, thus of the
sustainability limits in these dimensions.
In the most extreme variant, the approach of environmental analysis would be based on
such assumptions that locate the environment and ecosystems outside the system borders of
the analysis, thus the so-called environmental analysis become harmless, as in the analysis
the natural resources appropriated by and emissions from production cannot be linked to
any carrying capacity limit in any ecosystem affected by the production. A theme elabo-
rated in Daly and Cobb (1989) is economic models floating free from the biophysical
world. An ambition of this paper is to suggest how to anchor such economic models in the
biophysical world. The schematic discussion above points towards the conclusion that in
the first phase in the work for a sustainable development, approaches for ‘‘environmental’’
impact analyses might dominate which are indifferent to real impacts in real ecosystems.
Hellstrand et al. (2009) found that a central natural resource concept in physical
resource theory, exergy, is defined in a conceptual model of real world systems where all
process restrictions that define ecological, economic and social systems are ignored. It is
not possible within the frame of this paper to present an analysis of the guiding assump-
tions and characteristics of different more operative approaches for analysis of the
1 See Giampietro (2003) for an extensive overview.
S. Hellstrand et al.
123

environmental impact of production. In the following, a number of applications are listed
which have four factors in common,
1. the physiological and biological aspects of the carrying capacity limits of ecosystems
are ignored,
2. ecosystems affected by production and consumption are located outside the system
borders,
3. the variation in the conditions of ecosystems in space and time is ignored and
4. the capacity of ecosystems, managed and natural ones, to produce ecosystem goods
and services is ignored.
The examples are the following:
• the system of environmental and economic accounts in Sweden (Statistics Sweden
2009),
• analysis of the environmental impacts, quantifiable and non-quantifiable, from Swedish
agriculture, including upstream and downstream effects (Engstrom et al. 2007),
• sustainable pig production (Stern et al. 2005),
• sustainable milk production (Gunnarsson et al. 2005; Sonesson 2005),
• life-cycle assessment of milk production (Cederberg and Flysjo 2004; Cederberg et al.
2007),
• life-cycle assessment of seven different food items (LRF 2002),
• the Integrated Pollution Prevention and Control-directive and its BAT (Best Available
Technology) principle,2 supporting the development of sustainable industries in the EU,
• the Integrated Product Policy of EU (Wijkman 2004),
• the main streams approach in life-cycle assessment (Baumann and Tillman 2004), and
• the system conditions for sustainability of the Natural Step.3
The consequence is that none of these approaches comply with the principles for
sustainable development regarding its ecological dimensions as expressed by Millennium
Ecosystem Assessment (MEA 2009), OECD (2001) and the UN Millennium Goals (UN
2008). This follows from the factors (1) to (4) that they have in common.
The Swedish National Food Agency (see SNFA 2008, and Lagerberg Fogelberg 2008),
in their mission given by the government to integrate environmental and human health
aspects in recommendations for human food intake, rely heavily on the contributions of
Cederberg and Flysjo (2004), Cederberg et al. (2007) and LRF (2002), so does the Swedish
Board of Agriculture (SBA 2008) in their governmental mission to present a climate
change strategy for Swedish agriculture. The Swedish hamburger company MAX in their
environmental strategy focuses the climate change aspect based on results from life-cycle
assessment studies of the same type as the ones mentioned earlier (MAX 2009). A major
research programme in Sweden regarding sustainable food production is FOOD 21. Its
overall long-term goal is to define optimal conditions for sustainable food production that
generate high quality food products. The major part of the work was performed at the
Swedish University of Agricultural Sciences.4 The fundings summed to around 130 million
2 See http://eippcb.jrc.ec.europa.eu/index.html, and ftp://ftp.jrc.es/pub/eippcb/doc/ppm_bref_1201.pdf, acces-sed 2009-09-01.3 http://www.thenaturalstep.org/the-system-conditions, accessed 2009-06-14.4 From http://www-mat21.slu.se/eng/index.htm, accessed 2009-09-01.
A biophysically anchored production function
123

SEK,5 i.e. 13 million €, of which 120 million SEK emanated from MISTRA. The work
was performed in close cooperation with the food industry and the Swedish farmers
federation. MISTRA is a foundation. It shall promote the development of robust research
environments of the highest international class that will have a positive impact on Swe-
den’s future competitiveness.6 Cederberg and Flysjo (2004), Gunnarsson et al. (2005),
Sonesson (2005) and Stern et al. (2005) are all products of FOOD 21. Cederberg et al.
(2007) is basically a reproduction of Cederberg and Flysjo (2004), in another Swedish
region, in a cooperation between the Swedish food industries reserach institute SIK, the
Swedish University of Agricultural Sciences, and the Swedish Dairy Association (ibid.).
The typical characteristics of complex systems constituted by small subsystem (holons)
which system by system level are organised in an hierarchically integrated structure
(a holarchy) with mutual dependencies between systems and system levels implies that the
strength and weaknesses of individual analysis are reflected in studies operating on higher
system levels (see Giampietro 2003, for a detailed presentation regarding this issue). To the
same degree as typical features of ecological/environmental systems are ignored in indi-
vidual studies; studies that aggregates the results from such studies on more general levels
reflects the same ignorance. Here, we have a situation in the Swedish context where
authorities in their policy-generating process aiming at a support of environmental sus-
tainability rely on studies that ignore typical features of ecological/environmental systems.
At the same time, the national agricultural university generating such studies, in their
mission to increase the knowledge regarding the ecological base for sustainable food
production, utilises an approach that mainly is indifferent to the impact on real ecosystems
affected of the resource use and emissions from production.
In this paper, economic production functions are generated that reflect the significance of
the ecological dimension. They reflect the value of the production factor land, with its broad
meaning in economic theory. From such production functions, a system of ecological eco-
nomic accounts can be generated, that maintains the advantages of the methods used in the
earlier mentioned studies, while complementing them by integration with known properties
of ecological economic systems from nutrition physiology, economy and systems ecology.
1.3 Approach
The analytical framework is constituted by a conceptual model of the economic system in
its ecological and social context, constructed by integration of physical resource theory,
animal and human physiology, economics and systems ecology. It is easy to visualise that
physical resource theory, economic theory and systems ecology have important contri-
butions to make within the frame of a sustainable development. This is not that clear
concerning animal and human physiology.
On a more principal level, it can be argued that most if not all aspects of sustainability
contend an element of physiology: If there is no physiological process within plants,
humans or animals affected, it can be argued that no aspect of sustainability has been
affected. Even the well-being of individuals are reflected in their physiological status. In a
more operative sense, the focus of animal and human nutrition theory is the usefulness of
feeds/foods for the fulfilment of physiological requirements, taking into account relevant
5 From http://www.mistra.org/mistra/english/research/researchprogrammes/completedprogrammes/ ood21sustainablefoodproduction.4.1eeb37210182cfc0d680007079.html, accessed 2009-09-01.6 See See http://www.mistra.org/mistra/english/aboutmistra.4.11126f6102410ddca180002203.html, acces-sed 2009-09-01.
S. Hellstrand et al.
123

economic, environmental and physiological process restrictions within the individual and
its environmental and socio-economic context (Hellstrand et al. 2009).
The model visualises the limits of the relevance domains of traditional economic
models and more specialised models used in resource accounting economics with respect
to ecological sustainability. Biophysically anchored production functions (BAPFs) can be
derived from the conceptual model, in which production value is a function of
1. the use of non-renewable resources,
2. the use of renewable resources and
3. the impact on the life-support systems.
A BAPF is a proposal for how to internalise the ecological dimension of the economy
into standard economic models, resulting in tools supporting the operationalisation of an
ecologically sustainable development. Trends and current size of some parameters in a
BAPF are analysed. One version of the proposed BAPF is used in an analysis of economic
effects over time of material exponential growth of an economic system operating under
ecological source and sink restrictions.
2 Analysis
2.1 A model of the economy in its ecological and social context
Hellstrand et al. (2009) constructed a model of the economy in its ecological and social
context (Fig. 1) by integrating basic concepts in physical resource theory, animal and
human physiology, economic theory and systems ecology.
The model contains three compartments. Ecosystems including natural resources (NR)
constitute Compartment I. Sun, tide and processes providing heat in the depth of the Earth
are independent power sources driving processes in economic and ecological systems.
According to the first Thermodynamic Law, the amount of energy is constant while the
quality of energy is degraded in such processes. The amounts of elements are assumed to
Source-aspect Compartment I: Ecosystems including natural resources Sink-aspect
Compartment III:
Satisfaction needs & desires
SC
Compartment II:
“The economy”
Labour, capital
Payments
Payments
Goods, services
HouseholdsEnterprises
• Primary
• Secondary
• Tertiary
MMC HC
Sources
• Sun
• Tide
• Deep heat
• Elements
Nonrenewable
Renewable
Natural resources; renewable and nonrenewable Wastes
L i f e S u p p o r t
Sinks
Assimilative capacity restrictions via impact on:
• Thresholds
• Resilience
• Environ-ment
• Human health
• Productivity RNC
NC
Fig. 1 A conceptual model of the economy in its ecological and social context (from Hellstrand et al. 2009)
A biophysically anchored production function
123
be constant. Although this is not correct with regard to, e.g. nuclear processes, it is an
appropriate assumption for the purpose of this paper. In geobiophysical processes driven
by the independent power sources elements are rearranged into stores of natural capital
(NC). NC provides life support, that is, the physiological necessities for life (Odum 1989).
The economy consumes renewable and non-renewable natural resources (RNR and NNR,
respectively), appropriated from the stock of renewable and non-renewable natural capital
(RNC and NNC, respectively) that together provide the stock of natural capital (NC). The
availability of NR provides source restrictions to the economy. This is the source aspect of
ecological sustainability. Ecological sustainability includes, also, a sink aspect. The sink
aspect refers to the capacity of ecosystems to assimilate wastes from the economy without
such negative environmental impact that the life-support capacity is threatened. Land use
may also affect the life-support capacity and may thus be constrained by ecological sink
restrictions. Regarding sink restrictions, the impact of the economy on thresholds, resil-
ience, environment, human health and the productivity of RNC should be considered. In
Compartment II, energy and other resources are transformed to goods and services mea-
sured in terms of GDP (gross domestic product) in processes steered by man made and
human capital (MMC and HC, respectively). HC refers to the capacity of the individual to
contribute to production in Compartment II. It is a measure of the productivity of the
individual. The primary sectors7 act as a bridge between the first and second compart-
ments, making NR available to the rest of the economy. In Compartment III, ecologicalgoods and services produced in Compartment I as well as goods and services produced in
Compartment II are consumed, satisfying human needs and desires. Social capital (SC) is
related to the degree of social sustainability and is connected to aspects such as democracy,
legitimacy of authorities and distribution of resources. At the interface between Com-
partments II and III, consumer prices and production values are established. Compartment
II, including the interfaces to Compartments I and III, respectively, is the primary focus in
economics. It can be called the GDP economy. Prices plus consumer surpluses describe the
social value of the goods and services consumed and invested. GDP is an estimate of
production, not of welfare.
Sustainable development is a development within ecological carrying capacity limits.
When the economy is very small, biophysical growth can be part of a sustainable devel-
opment. When the economy is (close to) trespassing ecological carrying capacity limits,
sustainable development can still be achieved through increased efficiency in the use of
limited natural resources such as land, water and energy from Compartment I for the
satisfaction of human needs in Compartment III.
The limits and possibilities of basic concepts within physical resource theory, animal
and human physiology, economic theory and systems ecology, respectively, to contribute
to the understanding of a sustainable development can be discussed in more detail (see
Hellstrand et al. 2009).
2.2 Economic production functions and the missing production factor
General economic models discussed in economic textbooks and used in the design of
general economic policies, usually take this form:
QðtÞ ¼ AðtÞf ðLðtÞ;CðtÞÞ ð1Þ
7 Agriculture, forestry, fishery, mining and power production.
S. Hellstrand et al.
123

where t = time, Q(t) = production in GDP terms,8 A(t) = productivity as a function of
time, L(t) = input of labour and C(t) = input of capital. Capital here refers to HC and
MMC. The unit of production and inputs of labour and capital is money per time.
The relevance domain of (1) is the GDP economy per se in Fig. 1, i.e. Compartment II
and its intersections to Compartment I and III. The possibility of ecological source and sink
restrictions to the economy is not considered. Land, one of three production factors is no
longer assumed to have unique characteristics that make it necessary to provide a three-
dimensional model of the economy. It is assumed that the economic significance of land is
sufficiently well described in the dimensions labour and capital. Historically, these sim-
plifications may have been reasonable. The sustainability issue shows a need for analytical
tools and databases explicitly considering the possibility of the existence of ecological
restrictions to the human economy. In economic resource accounting literature, environ-
mental and resource constraint questions are dealt with.
2.3 Resource accounting efforts within the academic discipline of economics
Theoretical economic models are explicitly or implicitly used in resource accounting, in
order to properly account for qualitative and quantitative changes in the NC. What is
sought is often a (partially) environmentally adjusted net domestic product in which one
could take into account depletion and/or deterioration of NC in a similar way as depre-
ciation of real capital is accounted for. The appropriation of assimilative capacity is rarely
dealt with in economic resource accounting models.
Hicks (1939) can be said to be the modern founding father of the economic models used
in resource accounting as he discussed income as net return on total capital stock.
Weitzman (1976) developed the theoretical framework, showing how net domestic product
(NDP) under certain conditions can be interpreted as a perpetual (sustainable) income.
Hartwick (1977) showed that a sustainable income stream required that all returns from
expropriating non-renewable resources was reinvested in (preferably renewable) capital,
for the total capital stock not to decrease. In Hartwick (1990) and Maler (1991), accounting
rules for the use of renewable and non-renewable resources were established.
There was a growing recognition in the 1960s that economic growth could have det-
rimental effects on the environment and that many developing countries achieved their
economic growth at the expense of depleting their NC. An interest emerged in adjusting
the national accounts for externalities of economic activities (Daly and Cobb 1989;
Nordhaus and Tobin 1973). A few empirical studies have been carried out, mostly in
developing countries, primarily dealing with depletion issues (Repetto et al. 1989). The
approach is generally very pragmatic and takes the data availability as a starting point,
rather than the theoretically ideal environmentally adjusted net domestic product measure.
In the first years of the 2000s, both the academic society of resource economics (see e.g.
Heal and Kristrom 2000) and the network of statistical offices named the London Group on
Environmental Accounting were preparing handbooks in resource accounting.9 The UN
Committee of Experts on Environmental-Economic Accounting (UNCEEA) (UN 2009)
8 Q(t) in (1) denotes a flow. From (3) flows will be expressed in the form dQ
dt, emphasising that the economy
belongs to the class of dissipative systems together with, e.g. organisms and ecosystems, which structuresare maintained as long as the system manages to metabolise a sufficient amount of resources. Two importantcontributions are Odum (1988) and Giampietro (2003), who elaborate on this aspect of the economy and itssignificance for scientific contributions to a sustainable development.9 See http://unstats.un.org/unsd/envaccounting/londongroup/, accessed 2009-09-01.
A biophysically anchored production function
123

was established by the UN Statistical Commission at its 36th session in March 2005.
Ecological Economics devoted a special issue volume to the system of environmental-
economic accounting developed by the UN (Ecological Economics 2007).
Resource economics consider mainly the use of renewable and non-renewable resour-
ces, and the resulting emissions leading to environmental degradation, increased corrosion
of real capital, decreased labour participation from human health effects and leisure
welfare losses (ibid). Although the theoretical literature on the issue has grown extensively
since 1990, and accounting rules for depletion of resources have been established, the full
cost of eroding the ecological support system has not yet been resolved. The EU-initiative
Beyond GDP10 and the initiative by Sarkozy, gathering a number of Nobel Prize winners in
economy around the question about what GDP measures and do not measure,11 elaborate
on this aspect among other’s. Later, suggestions on how to resolve this question are made.
The importance of solving this question is stressed by the fact that economic models
guiding policy choices do not yet normally consider the implications of growth on eco-
systems and resource depletion.
2.4 Biophysically anchored production functions
The focal point when generating a BAPF is the relationship between Compartment I
(‘‘Nature’’) and Compartment II (‘‘the GDP economy’’) in Fig. 1. Values considered are
production values, measured in monetary terms on the market.
2.4.1 Physically anchored production functions
Hall et al. (1986) related production to energy use:
Q ¼ nE ð2Þwhere Q is monetary value of goods and services produced per year (GDP); E total amount
of energy used per year; and n the efficiency of energy use in GDP per unit energy used. nis a measure of the eco-efficiency of the studied system with regard to its energy metab-
olism. (2) focuses on the flux of NR, here energy, from Compartment I to II, and the value
of the production it supports.
Hubbert (1956) analysed the cycle of production of exhaustible resources, such as oil,
and defined the cumulative production Q to time t by:
Z t
0
dQ
dt
� �dt ¼
Z t
0
Pdt ð3Þ
where P is production rate. (3) differs from (1) and (2) in two ways. Q in (3) is production
in physical terms. Furthermore, it is the integral of the production rate, i.e. an amount not a
flux. Q in (1) and (2) actually concerns a flux: production per unit time. (3) is a physical
description of the support from Nature to the economy. A physical description is necessary
but not sufficient in an analysis of the ecological aspect of sustainable production. In our
effort to formulate biophysically anchored production functions, we integrate Eqs. (1)–(3).
10 See http://www.beyond-gdp.eu/, accessed 2009-09-02.11 See http://www.stiglitz-sen-fitoussi.fr/documents/draft_summary.pdf, accessed 2009-09-02.
S. Hellstrand et al.
123

2.4.2 Biophysically anchored production functions
General economic production functions (1) and the functions of Hall et al. (2) and Hubbert
(3) are used as a point of departure, in an attempt to provide a biophysically anchored
economic production function.
Equation 2 can be specified in continuous time and written:
dQg
dt¼ nðtÞdE
dtð4Þ
where Qg represents the cumulative amount of production, measured in monetary terms.
g stands for gross and shows that the production value is not corrected for environmental
degradation. Production per year in (4)dQg
dt
� �equals GDP in national accounts. To stress
the character of the economic system as a dissipative system, metabolising NR, annual
production is in the following expressed in the form dQ
dt. (4) can be applied on other system
levels than national. E is cumulative amount of work extracted from the environment,
measured in biophysical terms. It is assumed that the smallest common denominator of NR
is a capacity for work in thermodynamic terms (see Daly and Cobb 1989). Within physical
resource theory, measures of resource quality such as (low) entropy (Kaberger and
Mansson 2001) and exergy (Kaberger and Mansson 2001; Wall 1986) have been sug-
gested. Within systems ecology, emergy is proposed as a measure of resource quality
(Odum 1988). Within nutrition theory, energy available to feed physiological processes is
at the core. The mentioned resource measures have different relevance borders that define
their relevance in the implementation of a sustainable development (Hellstrand et al. 2009).
Here, we simply assume that E is an appropriate measure of NR.
Rules of partial derivation suggest that (4) should contain the term EðtÞdndt. However, if
so, changed conversion efficiencies (n) would affect the production value obtained from
resources already used up. This is not possible, thus the term EðtÞdndt
is excluded from (4).
In Eq. (4), NNR are not distinguished from RNR. The value of production is not
corrected for the impact on the environment. Considering these aspects gives:
dQn
dt¼ nsðtÞ dEs
dt
� �þ nf ðtÞ dEf
dt
� �þ l
dLsudt
ð5Þ
where dQn
dtis value of net production per time unit, considering the environmental impact.
The indices s and f stand for stores and flows, respectively. dEs
dtdenotes NNR metabolised
by the economy, whiledEf
dtrefers to RNR metabolised. dLsu
dtconcerns the sum of current and
future impact on the life support of the production that occurred at one time, discounted to
the time of production. l is the value per unit life support. Welfare effects are not con-
sidered. Thus, l relates to the part of the environmental impact that affects future pro-
duction of RNR and the productivity of MMC and HC.
An alternative and more general BAPF is:
dQ
dt¼ f ðL;C;Es;Ef ;W; Lu;Cso;CsiÞ ð6Þ
Inputs of L, C, Es, Ef have already been defined. Markets exist where these inputs can be
valued in monetary terms. W, Lu, Cso, Csi, respectively, stand for wastes, land use, carrying
capacity of ecosystems regarding supply of resources (source restriction) and carrying
capacity regarding assimilative capacity (sink restriction). Carrying capacity limits that
may restrict patterns of land use are also included in Csi. When the economic significance
A biophysically anchored production function
123

of W, Lu, Csi, respectively, is not accurately considered, the economy runs the risk of
transgressing ecological sink restrictions. If Cso is not sufficiently well considered, the
economy may inflict ecological source restrictions as well. Equation (6) indicates some of
the complexity in the interactions between the human economy and ecosystems. In the
following, a somewhat more simple approach is used.
2.4.3 Life support as a function of natural resources used
Use of NNR and RNR results in wastes. Wastes and land use patterns affect the envi-
ronment. When the rent of RNC is used, the size of the stock itself is affected, and thus the
production of life support from RNC. If the rent was not used, it would have increased the
size of the stock. RNC such as forest- and agro-ecosystems produces RNR such as fibre,
bioenergy and food in processes in which the photosynthesis is a key process. In parallel to
the production of these for the economy significant RNR, the very same processes pro-
duces other forms of life support. Therefore, use of some types of RNR will affect the
capacity to produce life support. Thus, dLsudt
in (5) is a function of the use of RNR and NNR.
Hence, (5) can be reformulated:
dQn
dt¼ nsðtÞ dEs
dt
� �þ nf ðtÞ dEf
dt
� �þ g
dEs
dt
� �;
dEf
dt
� �� �ð7Þ
where g dEs
dt
� �;
dEf
dt
� �� �¼ ldLsu
dt. Equations (1) and (7) can be combined to:
dQn
dt¼ AðtÞf dL
dt;dC
dt
� �þ l
dLsudt
¼ AðtÞf dL
dt;dC
dt
� �þ g
dEs
dt
� �;
dEf
dt
� �� �
¼ nsðtÞ dEs
dt
� �þ nf ðtÞ dEf
dt
� �þ g
dEs
dt
� �;
dEf
dt
� �� �
In this expression, the production value is a function of labour, capital,12 NNR, RNR
and the impact of production on the life support. The expression can be rearranged in
different ways to show, e.g. the productivity (A(t)) as a function of inputs of labour, MMC
and NR, considering or not considering the value of the environmental impact of the
production. In combination with empirical data and statistical analysis, this points towards
a route to increase our knowledge of economic growth and growth accounting, and its
biophysical dependencies. This type of general relations can be explored through impre-
dicative loop analysis (Giampietro 2003) to increase
• the understanding of environmental prerequisites for economic and social development
as well as
• the mutual dependencies within and between ecological and socio-economic systems
and between system levels.
However, that is beyond the scope of this paper.
12 Inputs of labour and capital are presented in the form dLdtand dC
dt, respectively, to stress the character of the
economy as a dissipative system, which structures are a function of resources metabolised, such as, e.g. theproducts of past and current photosynthesis.
S. Hellstrand et al.
123

2.5 The size of some parameters in the BAPF
2.5.1 Conversion efficiencies
The different types of n in (5) and (7) are conversion efficiencies showing the value of goodsand services produced divided by NR used. They can be estimated on an aggregated level or
with a high level of resolution. A high aggregation is obtained if GDP is divided by national
supply of primary energy. Different studies (Hall et al. 1986) showed strong relationships
between energy use and value of production in monetary terms within nations over time,
between nations and between sectors within nations. Figure 2 shows the result whenGDP per
capita (purchasing power parities) was plotted against supply of primary energy per capita for
EU, Japan, Sweden and USA, respectively, during the period 1962–1997. Table 1 shows the
results from regression statistics (GDP dependent variable, supply of primary energy inde-
pendent variable) for the same economies and periods. Figure 2 suggests a quite close
relationship between GDP per capita and primary energy supply per capita within nations.
The relationship is confirmed in the statistical analysis; within each nation, the R2 values
and significance levels are high ([0.85 and\0.001, respectively).
However, this is no proof of a causal relationship. An underlying temporal trend may
affect GDP as well as energy supply. In order to avoid jumping to conclusions about
causality between GDP and energy supply, regression analysis was performed on yearly
change in primary energy supply (independent variable) and yearly change in GDP
0
5
10
15
20
25
30
0 1 2 3 4 5 6 7 8 9
Tonne oil equivalents/capita
1,00
0 U
S 9
0 $/
cap
ita
SwedenJapanEUUSA
Fig. 2 GDP/capita plottedagainst total primary energysupply (TPES) in tonne oilequivalents/capita. Data concernthe EU, Japan, Sweden and USA1962–1997. Source: Ownprocessing of data from IEA(1999)
Table 1 Some results from regression analysis between total primary energy supply and GDP in pur-chasing power parities in the EU, Japan, Sweden and USA 1962–1997
Regression coefficient,US 90 $/kg TPES oil equivalent
Intercept R2-value
GDP and energy use
EU 4.81 -938 0.90***
Japan 5.61 -286 0.95***
Sweden 2.96 -0.05 0.95***
USA 3.84 -2 269 0.86***
Source: Processing of data from IEA (1999). TPES, see Fig. 2. *** p\ 0.001
A biophysically anchored production function
123

(dependent variable). The statistical relationship was still strong, though somewhat weaker
(see Table 2).
The statistical analysis suggests that the general structure of the BAPF suggested (Eq. 5)
with regard to use of NR and conversion efficiencies regarding GDP obtained through NR
used is relevant. The NR primary energy is of primary interest.
Figure 3 shows that the Swedish economy 1970–2000, with respect to energy, was
oriented towards the use of NNR, which provided 70–80% of the total primary energy
supply. Thus, in terms of influx of primary energy, dEs
dtin this period dominated in the
BAPF describing the Swedish economy.
It should be noted that the Swedish economy compared to most developed economies to
a higher extent is fuelled by energy from renewable energy carriers.
2.5.2 The value of environmental impact
The impact of the economy on the ecological system and then back on the economy is a
complicated issue, e.g. a simple dose–response function often does not exist. Holling
Table 2 Some results from regression analysis between change in total primary energy supply and GDP inpurchasing power parities, respectively, from 1 year to another, in the EU, Japan, Sweden and USA,respectively, 1963–1997
Regression coefficienta Intercept (Y when X = 0) R2-value
Change in GDP and change in energy use
Japan 0.55 0.024 0.69***
USA 0.54 0.018 0.55***
EU 0.33 0.021 0.58***
Sweden 0.22 0.018 0.25**
a Change in GDP in US 90 $/change in TPES in kg oil equivalents. Sources and further explanations, seeFig. 2 and Table 1. *** p\ 0.001, ** p\ 0.01
0,00
0,10
0,20
0,30
0,40
0,50
0,60
0,70
0,80
0,90
1970
1975
1980
1985
1990
1995
2000
FlowsStores
Fig. 3 Energy supply in Sweden from flows and stores 1970–2000 in fractions of total supply. Included instores are crude oil and oil products, natural gas and gasworks gas, coal and coke and nuclear power (gross).Included in flows are biofuels and peat, heat pumps in district heating, hydropower (gross) and wind power.Imports and exports of electricity not considered. Source: Own processing of data in Swedish NationalEnergy Administration (2001)
S. Hellstrand et al.
123

(1973, 1986) introduced the resilience concept. The concept of resilience has been used as
a point of departure for later studies of the economic significance of changes of the
environment (Common and Perrings 1992; Scheffer et al. 2001) and human well-being
(MEA 2009). Resilience can be understood as the balance between organising and dis-
organising forces. When disorganising forces exceed organising ones, a system moves to a
new state or stability region. Regarding ecological systems, this may have substantial
economic effects (Scheffer et al. 2001). Two main points in Scheffer et al. are
1. Ecosystem state shifts may cause large losses of ecological and economic resources
and restoring a desired state may require drastic and expensive intervention.
2. Efforts to reduce the risk of unwanted state shifts should address the gradual changes
that affect resilience rather than merely control disturbances.
The challenge is to sustain large stability domains rather than to control fluctuations.
Stability domains typically depend on slowly changing variables such as land use, nutrient
stocks, soil properties and biomass of long-lived organisms. These factors are related to a
physically growing economy. Following their line of argumentation, a physically growing
economy increases the risk for what they call ‘‘catastrophic’’ changes in ecosystem states.
Thus, one way to analyse the value of the environmental impact of a physically growing
economy is via the increase in the risk cost due to economic growth.
Table 3 Some results from regression analysis between GDP (independent variable) and different emis-sions in Sweden 1900–1990
GDP Fission-energy free GDP
Slope, g/SEK R2 Slope, g/SEK R2
To air
CO2 58 0.81*** 78 0.93***
NOx 0.26 0.96*** 0.33 0.97***
SO2 0.16 0.32*** 0.26 0.55***
CO 1.2 0.82*** 1.5 0.94***
VOC 6.4E-2 0.14*** 7.1 E-2 0.11**
CFC 1.1 0.87*** 1.3 0.81***
Pb 1.7E-3 0.13*** 2.5E-3 0.17***
HM 3.8E-3 0.25*** 6.4E-3 0.47***
To water
BOD7 NS 0.24 0.13***
Solid wastes
Radioactive matter (dm3) 1.7E-6 0.92*** -3.2E-6 0.79***
SEK, Swedish crowns, price-level 1991. Abbreviations: CO2, carbon dioxide; NOx, nitrogen oxides; SO2,sulphur oxide; CO, carbon monoxide; VOC, volatile organic compounds; CFC, chlorine fluorine carbonates;Pb, lead, HM, the heavy metals Cu, Zn, An, Ni, Cr, Kd; BOD7, organic matter discharged in water measuredby a certain method. Statistical analysis based on GDP 1900–1949 from Johansson (1967), 1950–1990 fromtime series regarding Swedish National Accounts extracted in 1999 from the EMEC model at SwedishNational Institute of Economic Research. Time series transferred to price-level 1991 by living cost indexesfrom Swedish National Institute of Economic Research (2002). Emissions 1900–1990 in Sweden on whichthe analyses in Lindmark (1998) are based, obtained as excel file from the author 2000. Energy supply fromSwedish National Energy Administration (1998), radioactive wastes estimated via energy supply and theproduction of wastes from fission power estimated by the LCA-program LCA Inventory Tool 2.0
*** p\ 0.001, ** p\ 0.01, NS non-significant
A biophysically anchored production function
123

For the investigated time periods and economies, Tables 1, 2, 3 and 4 show strong
statistical relationships between use of the NR primary energy and GDP; GDP and some
emissions; and use of primary energy and some emissions.
This suggests that it is relevant to describe GDP as a function of the metabolism of NR,
and the environmental impact of production as a function of the NR used, as is done in
Eq. (7). The results in Tables 1, 2, 3 and 4 do not support a quantification of the value of
the environmental impact of production. However, the results suggest that for investigated
economies and time periods GDP growth has been achieved through means increasing the
environmental pressure and decreasing stability domains of ecosystems. The risk for
catastrophic shifts of ecosystems, of the type Scheffer et al. (ibid.) describe, has increased.
2.6 Effects of material exponential growth on future production
In this section, the effects on production value of exponential material growth of an
economic system when transgressing ecological source and sink restrictions are analysed.
The paths investigated are impacts on future availability of (1) NNR and (2) RNR,
respectively, and on (3) resilience of ecosystems.
2.6.1 Use rate and non-renewable natural capital
Let dQs
dtdenote the value of the metabolic processes in society as measured by GDP driven
by a flux of NNR. Index s shows that production is based on stored resources (i.e. NNR).
Combined with (4) this gives:
dQs
dt¼ nsðtÞ dEs
dt
� �ð8Þ
Table 4 Some results from regression analysis between energy supply (independent variable) and differentemissions in Sweden 1970–1990
Energy supply Fission-energy free energy supply
Slope, g/kWh R2 Slope, g/kWh R2
To air
CO2 -230 0.64*** 450 0.93***
NOx NS NS
SO2 -2.3 0.73*** 3.9 0.83***
CO -4.4 0.72*** 6.6 0.63***
VOC -0.10 0.22* 0.21 0.36**
CFC NS NS
Pb -1.2E-2 0.83*** 1.6E-2 0.64***
HM -5.4E-2 0.76*** 8.3E-2 0.71***
To water
BOD7 -2.7 0.72*** 4.3 0.74***
Solid wastes
Radioactive matter (dm3) 4.4E-6 0.89*** -6.2E-6 0.74***
Data sources, see Table 3. *** p\ 0.001, ** p\ 0.01,* p\ 0.05, NS non-significant
S. Hellstrand et al.
123

In the following analysis, the logistic curve is used in an effort to relate dQs
dt to (1) the use
rate of NNR; (2) the stock of NNC when exploitation starts; and (3) the stock of NNC that
remains at a certain time. Reasons for this choice are
1. The logistic curve is built on a simple assumption: at the beginning of the use of a non-
renewable resource, all is available, and at the end, all is used up (Hall et al. 1986;
Hubbert 1956).
2. The logistic curve has provided good predictions of future use of oil and gas in the
United States, as well as good predictions of the exhaustion of the stores of these
resources in the United States (Hall et al. 1986; Hubbert 1956). The Hubbert prediction
is the basis for more recent predictions of future global oil production by
petrogeological consultants (see e.g. Campbell and Laherrere 1998; IEA 1998a, b).
The Association for the Study of Peak Oil and Gas was formed in the first years of the
Third Millennium. Its theoretical approach is based on Hubbert (ASPO 2009).
3. Without energywith quality, therewill be no economic process. Different energy carriers
provide energy with quality with the capacity to power the metabolism of society.
4. In an energy budget for the global economy, fossil fuels dominate. In 2010, it is
expected that fossil fuels will account for almost 90% of total primary energy supply
on the global level (IEA 1996). Thus, the pattern of exploitation of fossil fuels will
have a globally dominating impact on the pattern of future energy supply.
5. A strong relationship between energy use and economic performance in monetary
terms has been shown for a variety of situations (see Sect. 2.5.1).
To simplify the reasoning, ns(t) is assumed to be constant. Adapting the logistic function
to the given assumptions gives:
dQs
dt¼ nscsEsðtÞðEsm � EsðtÞÞ ð9Þ
where cs = a rate constant, Esm = the stock of NNC when exploitation starts, and ns is aconstant, showing the efficiency in the transformation of NNR to goods and services
measured in monetary terms. Regeneration of NNC is not considered. Regeneration of
NNC does not affect the principal argumentation.
According to (9), GDP at time t is a function of the cumulative use of NNR (= the use
up of NNC as described by Es) and the remaining stock of NNC ðEsm � EsðtÞÞ at that time.
In the early phases of exploitation exponential economic growth of type
dQs
dt¼ ns
dEs
dt
� �¼ nscsEsðtÞ ð10Þ
is possible. Source restrictions are not yet operating.
In (10), cs equals ln (1 ? r), where r is the rate by which Qs grows. The link between the
rate constant cs and the interest rate r in (10), combined with the economic ecological
model in Fig. 1, provides a platform for analyses of positive and negative trade-offs
between traditional strategies for economic growth and different aspects of sustainability.
However, this is beyond the scope of this paper.
To force an economic subsystem, which otherwise would follow logistic growth, to
follow exponential growth, measures must be taken to replace the rate constant cs in (9),
with a rate variable, which cancels out the restricting effect of (Esm - Es(t)) in (9).
This results in:
A biophysically anchored production function
123

dQs
dt¼ ns
dEs
dt
� �¼ ns
asEsm � EsðtÞð ÞEsðtÞ Esm � EsðtÞð Þ ¼ nsasEsðtÞ ð11Þ
Esm � EsðtÞ[ 0:The rate-increasing variable that replaces cs is
asEsm � EsðtÞð Þ ð12Þ
where as is a constant.
At t = 0, when exploitation starts, the value of expression (12) equals cs in (9) and (10).When t[ 0, the value of this rate-increasing variable changes in such a way that it
precisely cancels out the growing restricting effect caused by the continuing depletion of
NNC, described by (Esm - Es(t)). In the experiment of thought described by (11), the
output of the economic subsystem follows the exponential curve, until all reserves of Es
(all NNC) are physically used up. This point is reached when the marginal costs in further
exploitation (in quality corrected energy terms) equal the benefits. If exploitation continues
after that point, it results in a net drainage of energy resources from the economy. This
mechanism is explored by e.g. Hall et al. (1986). It is the basis for their EROIE analysis of
resources (see later). In this hypothetical example, the exploitation goes from an all-time
high to zero in one infinitely small time step.
If exploiters are rational, reserves that contribute most per unit effort invested are used
first (Hall et al. 1986). The fraction of NR exploited needed to reinvest in the exploitation
process increases as a function of the depletion of the stock of NNC. The EROIE value, i.e.
energy return on invested energy, has been used in analysis of the change of resource
qualities as a function of exploitation, applied on several types of natural resource
exploitations, e.g. oil (Hall et al. 1986). Over time decreasing EROIE values in oil
exploitation was found (ibid.). Assume that this is a general trend. Then, an increasing
fraction of exploited NR must be reinvested in exploitation in order to keep up the capacity
to deliver NR with constant quality, despite the decreasing quality of NR exploited by the
primary sectors as a function of previous cumulative production. Thus, measures are taken
that are mathematically described by the insertion of:
EsðtÞEsðtÞ � EsrðtÞ ð13Þ
in (11) resulting in
dQs
dt¼ ns
dEsn
dt
� �¼ ns
bsEsðtÞEsm � EsðtÞð Þ EsðtÞ � EsrðtÞð ÞEsðtÞ Esm � EsðtÞð Þ
¼ nsbsEsðtÞ2
EsðtÞ � EsrðtÞð Þ ð14Þ
where EsðtÞ � EsrðtÞ[ 0, and Esm � EsðtÞ[ 0. bs is a constant. Esr(t) is the cumulative
amount of NR from stores that at time t has been reinvested in the exploitation of NR.dEsn
dt
� �is the net amount of NR from stores delivered from the exploiting sector feeding
the production in the rest of the GDP economy at time t, after the fraction of NR, dEsr
dt,
invested in the exploitation of NR due to decreasing resource quality has been accounted
for. The rate variable (12) in (11) is in (14) replaced by
S. Hellstrand et al.
123

bsEsðtÞEsm � EsðtÞð Þ EsðtÞ � EsrðtÞð Þ ð15Þ
Eq. (11) compensates for the resource restriction which power increases with the
depletion of a NNC. It is measured at the system border between Compartment I (Fig. 1)
and the primary sector exploiting that NNR. Equation (14) also compensate for the
increasing fraction of NNR exploited by the primary sector, which is needed to reinvest
in the primary sector, in order to meet the demand from the rest of the economy on NNR
of a certain quality delivered from the primary sector. It is measured at the border
between the primary sector exploiting the NNR in question, and the rest of the economy.
The difference between expression (11) and (14) expresses transformation losses in the
exploiting sector.
According to (14), cumulative production value is not affected by the exploitation rate
of NNC. Thus, decreasing efficiency in the use of NR as a function of increasing use rate is
not considered. However, examples of such a relation has been found (Hall et al. 1986),
and suggested (ibid.) as support to the maximum empower principle provided by Odum
(1988, 1996). There is, however, in (14) a transfer (redistribution) of production values
from the far future to the present and near future. The dynamics in this transfer (redis-
tribution) in time are indicated by the difference between the rate constant cs in (9), and therate variable (15). That redistribution affects the social sustainability of society. That effect
is located in Compartment III in Fig. 1.
2.6.2 Use rate and renewable natural capital
The earlier mentioned discussion on relations between use rate of NNR, NNC and the
production rate can be applied to RNR as well. When harvests of RNR exceed regenerative
capacity of RNC, the capital stock itself is used up. The RNR has become a NNR, thus (14)
also describe the erosion of RNC. Change of indices gives:
dQf
dt¼ nf
dEfn
dt
� �¼ nf
bf Ef ðtÞEfm � Ef ðtÞ� �
Ef ðtÞ � EfrðtÞ� �Ef ðtÞ Efm � Ef ðtÞ
� �
¼ nfbf Ef ðtÞ2
Ef ðtÞ � EfrðtÞ� � ð16Þ
whereEf ðtÞ � EfrðtÞ[ 0 and Efm � Ef ðtÞ[ 0.
The index f shows that the relations concern the part of the economy using NR from
flows that is commonly perceived as RNR. However, in the hypothetical example, they
become NNR. The loss of production value when the use rate depletes the stock of RNC,
summed over eternity, is infinitely high.
2.6.3 Impact on the resilience
We analyse the costs of the environmental impact of a materially growing economy
through increased risks for catastrophic shifts of ecosystem states due to a loss of resil-
ience. In Sect. 2.5.2, the reasons for that choice is delivered. We assume that the resilience
can be described as a balance between organising and disorganising forces. The balance
between organising and disorganising forces is affected by exponential growth in two
ways: (1) RNC decreases through, e.g. cutting down of forests and transfer of wetlands to
A biophysically anchored production function
123

agricultural land, which reduces production of life support such as assimilative capacity.
Thus, organising forces decrease as a function of a biophysically growing economy. (2) A
biophysically growing economy increases the wastes produced and, hence, the environ-
mental pressure. The disorganising forces grow.
Through (1) and (2), the stability domains of ecosystems decreases, increasing the risk
that stochastic events will push systems over critical thresholds.
2.6.4 Organising forces
Let dLsusdt
be supply of life support at time t. The pattern of use of RNR (and use up of RNC)
in an economic subsystem that in spite of ecological source restrictions is manipulated to
follow exponential growth is described in Eq. (16). We assume that decreasing RNC
decreases production of life support and thus the organising forces. The capacity of eco-
systems to supply the economy with life support corrected for the erosion of the stock of
NC providing this flux is thus:
dLsusdt
¼ dLsusdtt¼0
� hbf Ef ðtÞ2
Ef ðtÞ � EfrðtÞ� � !
ð17Þ
where Ef ðtÞ � EfrðtÞ[ 0. dLsusdtt¼0
is the production of life support at time t = 0. At that time,
the use of RNR exactly matches ecological source restrictions. The function h shows how
increasing use of RNR above sustainable harvest levels decreases production of life sup-
port. The expression in the parenthesis is the one in (16) showing the use rate of RNR.
2.6.5 Disorganising forces
Equation (7) contained the expressiong dEs
dt
� �;
dEf
dt
� �� �, where that expression equals ldLsu
dtin
(5). This gives
dLsuddt
¼g dEs
dt
� �;
dEf
dt
� �� �
lð18Þ
where dLsuddt
is the demand on life support, i.e. a measure of the disorganising forces that the
economy produces.
Inserting (14) and (16) in (18) gives the following expression:
dLsuddt
¼g dEs
dt
� �;
dEf
dt
� �
l¼
g bsEsðtÞ2EsðtÞ�EsrðtÞð Þ;
bf Ef ðtÞ2Ef ðtÞ�EfrðtÞð Þ
� �
lð19Þ
EsðtÞ � EsrðtÞ[ 0; Ef ðtÞ � EfrðtÞ[ 0 and l[ 0. Equation (19) shows the growth of dis-
organising forces, due to exponential growth of an economic system exposed to ecological
restrictions.
2.6.6 The resilience
We assume that the balance between organising (Eq. 17) and disorganising forces (Eq. 19)
gives the resilience:
S. Hellstrand et al.
123

RðtÞ ¼ dLsusdtt¼0
� hbf Ef ðtÞ2
Ef ðtÞ � EfrðtÞ� �
!�
g bsEsðtÞ2EsðtÞ�EsrðtÞð Þ;
bf Ef ðtÞ2Ef ðtÞ�EfrðtÞð Þ
� �
l
0BB@
1CCA ð20Þ
EsðtÞ � EsrðtÞ[ 0; Ef ðtÞ � EfrðtÞ[ 0 and l[ 0.
According to (20), a material exponential growth of the GDP economy results in a
growth of disorganising forces and a decline of organising ones following exponential
growth raised to the second power. The resilience is ‘‘eaten up’’ from two sides, via
increasing demand on life support and decreasing supply, both as a function of a materially
growing economy.
3 Concluding discussion
The model of the economy in its ecological and social context presented is the result of an
integration of descriptive domains of physical resource theory, animal and human physi-
ology, economic theory and systems ecology. It provides a conceptual model of the GDP
economy in its social and ecological context. The three versions of BAPF proposed (see
Eqs. 5, 6 and 7) provide a means to analyse relationship between production value and
inputs of land, capital and labour. Capacity of ecosystems to support the human economy
with resources, and other forms of life support is included in land. The BAPFs are means to
evaluate the importance of land to the economy. The results obtained indicate that there
might be a need to reflect on the hierarchy between general economic policies and land use
policies. General economic policies is subordinated to a good management of land (land in
a broad sense) when the socio-economic system is exposed to ecological source and sink
restrictions.
From the BAPFs, systems of ecological economic accounts can be generated that
comply with known properties of the type of complex systems (holarchies) that is the focus
in a sustainable development and, as a consequence, comply with the conditions for a
sustainable development as expressed by MEA, OECD and UN. That is a complement that
substantially increases the relevance of the group of methods and approaches for analysis
of the environmental impact and impact on ecological sustainability, which are based on
such assumptions that the analysis ignores the impact on the carrying capacity in the
environmental systems that actually are affected by the production.
The BAPF is a mean to evaluate under which economic and ecological conditions a
sustained interest is possible: If the economic subsystem has trespassed ecological carrying
capacity limits with regard to sink and/or source restrictions, Eqs. (16) and (20) suggest
that the net value of production is negative, thus the interest is negative. Equation (10)
introduces an explicit relation between the interest and the net value of production over
time, which is further developed in the following stages. The analysis performed suggests a
frame for further analyses of relations between traditional economic growth, sustained
welfare and the resilience of ecological economic systems. That supports increased
understanding of the conditions for sustainable interest levels and sustainable incomes. It
also supports increased understanding of the preconditions for a management of different
stocks of capital, supporting a sustainable development.
The analysis of temporal trends regarding conversion efficiencies from 1962 to 1997 in
the EU, Japan, Sweden and USA showed that GDP was quite well predicted by supply of
primary energy, assuming a linear relationship between energy supply and GDP.
A biophysically anchored production function
123

Differences between nations in level and trends regarding conversion efficiencies were
found, suggesting potentials for increased efficiency in the use of Nature. In Sweden, (the
only economy investigated for this type of relations) statistically significant correlations
were found between a number of emissions and GDP for the period 1900–1990. The
variation in GDP explained the major part of the variation in some emissions, while for
others the explanatory power was substantially lower, suggesting that for these emissions
the relationship between growth and environmental disturbances was broken. The analysis
of relations between GDP, energy use and emissions, respectively, represents an effort to
improve the knowledge about the source and sink restrictions to the human economy as a
contribution to the operationalisation of a sustainable development. It is a first effort to
identify important parameters in a BAPF.
In a theoretical approach, it was found that a continued exponential material growth of
an economic subsystem beyond the carrying capacity of the ecological economic system
causes negative environmental effects, which with a profound dynamics inflict future
production value.
The most profound dynamics were associated with the pattern in the loss of resilience in
the ecological economic system, following the pattern of exponential growth raised to the
second power. The dynamics in the loss of resilience describe the path of the ecological
economic system towards threshold points where it may experience catastrophic shifts
towards new state conditions, where the effects on future production value are unknown.
Regarding the impact on resilience, the cost explored was the increase in the risk for
ecological state shifts, due to material growth. However, it must be stressed that the results
are a product of the given assumptions, which represent drastic simplifications of the
complexity of real systems. Thus, there is a need to further probe the assumptions against
empirical data, improving the knowledge about costs and benefits of material growth of
real human economies.
OECD (2001) declare that a sustainable development has top priority among its member
nations. Regarding criteria for a sustainable development OECD stresses the importance of
• maintaining sufficient amounts and qualities of natural, man made, human and social
capital
• restricting the use of non-renewable natural resources within volumes possible to
substitute by renewable natural resources or resources from other capital forms
• efficient use of renewable and non-renewable natural resources
• restricting emissions within the assimilative capacity of ecosystems while paying
sufficient attention to phenomena such as thresholds and resilience within ecosystems.
Furthermore, OECD noted that the concrete implementation of policies for sustainable
development is lacking.
The conceptual model, the BAPF, the system of ecological economic accounts that can
be derived from the BAPF, the empirical analyses of different parameters in the BAPF and
the theoretical analysis of different costs of provoking an economic subsystem exposed to
ecological source and sink restrictions to follow the path of material exponential growth
presented in the paper represent a tool kit supporting the operationalisation of a sustainable
development. The tools are internally congruent and congruent with the criteria for a
sustainable development put forward by OECD. They are thus well suited to meet the
demand on tools needed for the concrete implementation of policies for a sustainable
development, on the general policy level as well as regarding land use policies, asked for
by OECD, increasing the biophysical productivity of the society, as a major means for a
sustainable development.
S. Hellstrand et al.
123

Acknowledgments Sten Ebbersten, Knut Per Hasund, AnnMari Jansson, and reviewer #1 providedvaluable comments on earlier versions. The work was partly funded by Ekhagastiftelsen.
References
ASPO. (2009). http://www.peakoil.net/. Accessed 6 Feb 2009.Baumann, H., & Tillman, A.-M. (2004). The hitch hiker’s guide to LCA: An orientation in life cycle
assessment methodology and application. Lund: Studentlitteratur.Campbell, C. J., & Laherrere, J. H. (1998). The end of cheap oil. Scientific American, March, 78–83.Cederberg, C., & Flysjo, A. (2004). Life cycle inventory of 23 dairy farms in south-west Sweden. SIK-Report
728, SIK-Institutet for Livsmedel och Bioteknik, Goteborg.Cederberg, C., Flysjo, A., & Ericson, L. (2007). Livscykelanalys (LCA) av norrlandsk mjolkproduktion. SIK-
rapport Nr 761, SIK-Institutet for Livsmedel och Bioteknik, Goteborg.Common, M., & Perrings, C. (1992). Towards an ecological economics of sustainability. Ecological Eco-
nomics, 6, 7–34.Costanza, R. (1994). Three general policies to achieve sustainability. In A.-M. Jansson, M. Hammer,
C. Folke, & R. Costanza (Eds.), Investing in natural capital: The ecological economics approach tosustainability (pp. 392–407). Washington, DC: Island Press.
Daly, H. E. (1990). Toward some operational principles of sustainable development. Ecological Economics,2, 1–6.
Daly, H. E., & Cobb, J. B. (1989). For the common good: Redirecting the economy toward community, theenvironment, and a sustainable future. Boston: Beacon Press.
Ecological Economics (2007). Special issue on environmental accounting: Introducing the system of inte-grated environmental and economic accounting 2003—SEEA-2003 S.I. Ecological Economics, 61(4),589–724.
Engstrom, G., Wadeskog, A., & Finnveden, G. (2007). Environmental assessment of Swedish agriculture.Ecological Economics, 60(3), 550–563.
Giampietro, M. (2003). Multi-scale integrated analysis of agroecosystems. Boca Raton: CRC Press.Gunnarsson, S., Sonesson, U., Stenberg, M., Kumm, K. I., & Ventorp, M. (2005). Scenarios for future
Swedish dairy production: A report from the synthesis group of FOOD 21. Uppsala: Swedish Uni-versity of Agricultural Sciences.
Hall, C. A. S., Cleveland, C. J., & Kaufmann, R. (1986). Energy and resource quality: The ecology of theeconomic process. New York: Wiley.
Hartwick, J. M. (1977). Intergenerational Equity and the Investing of Rents from Exhaustible Resources.American Economic Review, 66, 972–974.
Hartwick, J. M. (1990). Natural resources, national accounting and economic depreciation. Journal of PublicEconomics, 43, 291–304.
Heal, G. & Kristrom, B. (2000). Resource accounting. In J. Vincent & K. G. Maler (Eds.), Handbook ofenvironmental economics. North-Holland: Elsevier.
Hellstrand, S., Skanberg, K., & Drake, L. (2009). The relevance of ecological and economic policies forsustainable development. Environment, Development and Sustainability, 11(4), 853–870.
Hicks, J. R. (1939). Value and capital (2nd ed.). New York: Oxford University Press.Holling, C. S. (1973). Resilience and stability of ecological systems. Annual Review of Ecology and
Systematics, 4, 1–23.Holling, C. S. (1986). The resilience of terrestrial ecosystems: Local surprise and global change. In W. C.
Clark & R. F. Munn (Eds.), Sustainable development of the biosphere. Cambridge: Cambridge Uni-versity Press.
Hubbert, M. K. (1956). Nuclear energy and the fossil fuels. In Drilling and production practice (pp. 7–25).American Petroleum Institute & Shell Development Co, Publication No. 95.
IEA. (1996). World energy outlook. Paris: International Energy Agency, OECD.IEA. (1998a). World energy outlook 1998. Paris: International Energy Agency, OECD.IEA. (1998b). World energy prospects to 2020. In Paper prepared by the International Energy Agency for
the G8 Energy Ministers’ Meeting, Moscow, 31 March–1 April 1998. International Energy Agency,OECD, Paris.
IEA. (1999). Energy balances of OECD countries 1965–1997. Paris: International Energy Agency, OECD.Johansson, O. (1967). The gross domestic product of Sweden and its composition 1861–1955. Stockholm:
Almqvist & Wiksell.Kaberger, T., & Mansson, B. (2001). Entropy and economic processes—physics perspectives. Ecological
Economics, 36, 165–179.
A biophysically anchored production function
123

Lagerberg Fogelberg, C. (2008). Pa vag mot miljoanpassade kostrad—Vetenskapligt underlag infor mil-jokonsekvensanalysen av Livsmedelsverkets kostrad, Rapport 9 2008, Livsmedelsverket. http://www.slv.se/upload/dokument/rapporter/mat_naring/2008_livsmedelsverket_9_miljoanpassade_kostrad.pdf. Accessed 02 Nov 2009.
Lindmark, M. (1998). Towards environmental historical national accounts for Sweden. Methodologicalconsiderations and estimates for the 19th and 20th centuries. Umea Studies in Economic History 21.Ph.D. dissertation.
LRF. (2002). Maten och miljon. Skovde: Livscykelanalys av sju livsmedel.Maler, K. G. (1991). National accounts and environmental resources. Environmental and Resource
Economics, 1, 1–15.Martinez-Alier, J. (1987). Ecological economics: Economics, environment and society. Oxford: Basil
Blackwell.MAX. (2009). Metod (for klimatanalys bakom MAX’ klimatstrategi). http://www.max.se/download/
Metod%20Max%20klimat%20080506.pdf. Accessed 2009.MEA. (2009). http://www.millenniumassessment.org/en/About.aspx. Accessed 6 Feb 2009.Nordhaus, W., & Tobin, J. (1973). Is growth obsolete? Review of income and wealth (Vol. 38). New York:
National Bureau of Economic Research.Odum, H. T. (1988). Self-organization, transformity, and information. Science, 242, 1132–1139.Odum, E. P. (1989). Ecology and our endangered life-support systems. Massachusetts: Sinauer Associates,
Inc.Odum, H. T. (1996). Environmental accounting. New York: Wiley.OECD. (2001). Policies to enhance sustainable development. Meeting of the OECD council at ministerial
level, 2001. http://www.oecd.org/dataoecd/47/22/1869800.pdf. Accessed 29 Mar 2008.Perrings, C., Folke, C., & Maler, K.-G. (1992). The ecology and economics of biodiversity loss: The
research agenda. Ambio, 21, 201–211.Repetto, R., McGrath, W., Wells, M., Beer, C., & Rossini, F. (1989). Wasting assets: Natural resources in
the national income accounts. Washington, DC: World Resources Institute.SBA. (2008). Minska jordbrukets klimatpaverkan! Del 1. Introduktion och nagra atgarder/styrmedel
(‘‘Reduce the climate impact of agriculture! Part 1. Introduction and some measures/incentives’’) (inSwedish) see http://www2.sjv.se/download/18.677019f111ab5ecc5be80007018/klimat_delrapport_1.pdf. Accessed 25 Aug 2008.
Scheffer, M., Carpenter, S., Foley, J. A., Folke, C., & Walker, B. (2001). Catastrophic shifts in ecosystems.Nature, 413, 591–596.
SNFA. (2008). http://www.slv.se/templates/SLV_NewsPage.aspx?id=21729&epslanguage=SV. Accessed25 Aug 2008.
Sonesson, U. (2005). Environmental assessment of future dairy farming systems—quantifications of twoscenarios from the FOOD 21 synthesis work, SIK-rapport Nr 741, SIK, Gothemburg.
SOU. (1991). Produktivitetsdelegationens betankande, SOU 1991:82. Stockholm: Allmanna Forlaget.Statistics Sweden. (2009). The system of environmental and economic accounts, see http://www.
scb.se/Pages/Product____38161.aspx. Accessed 02 Sep 2009.Stern, S., Sonesson, U., Gunnarsson, S., Kumm, K.-I., Oborn, I., & Nybrant, T. (2005). Sustainable pig
production in the future—development and evaluation of different scenarios. Report FOOD 21 No 5/2005, Swedish University of Agricultural Sciences and SIK, Uppsala.
Swedish National Energy Administration. (1998). Energy in Sweden 1998. Eskilstuna: Facts and Figures.Swedish National Energy Administration. (2001). Energy in Sweden 2001. Eskilstuna: Facts and Figures.Swedish National Institute of Economic Research. (2002). Living-cost index 1841–2000. At www.konj.
se/statistik/Data/Inflation.xls. Accessed 21 Aug 2003.UN. (2008). UNmillenniumgoals. http://www.un.org/millenniumgoals/poverty.shtml. Accessed 25Aug 2008.UN. (2009). UN committee of experts on environmental—economic accounting. http://unstats.un.
org/unsd/envaccounting/ceea/. Accessed 7 Feb 2009.Wall, G. (1986). Exergy: A useful concept. Ph.D. Dissertation in Physics. Physical Resource Theory Group,
Chalmers University of Technology, Gothenburg.WCED (World Commission on Environment, Development). (1987). Our common future. Oxford: Oxford
University Press.Weitzman, M. (1976). On the welfare significance of national product in a dynamic economy. Quarterly
Journal of Economics, 90, 156–162.Wijkman, A. (2004). Report on the communication from the commission to the council and the European
parliament on integrated product policy—building on environmental life-cycle thinking (COM(2003)302—C5-0550/2003—2003/2221(INI))’’, from the Committee on the Environment, Public Health andConsumer Policy, Rapporteur, Anders Wijkman, FINAL, A5-0261/2004, 8 Apr 2004.
S. Hellstrand et al.
123

Paper III


A MULTI-CRITERIA ANALYSIS OF SUSTAINABILITY EFFECTS OF
INCREASING CONCENTRATE INTENSITY IN SWEDISH MILK
PRODUCTION 1989–1999
STEFAN HELLSTRANDDepartment of Ecology and Crop Production Science, Swedish University of Agricultural Sciences, SE - 750
07, Uppsala, Sweden
(Received 12 June 2004; Accepted 5 May 2005)
Abstract. The concept of sustainable development is forcing standard economic analysis to acknowledge
and address the existence of dimensions of performance, which are not reducible to monetary accounting.
In particular, the implementation of this concept in practice requires: (a) the simultaneous handling of
indicators developed in different disciplinary fields; and (b) an approach more related to the procedures
adopted by consultants (Participatory Integrated Analysis), rather than theoretical academic analysis
looking for ‘the’ optimal solution. The case study considered in this paper is a multi-criteria analysis of
changes, which occurred in the Swedish milk production sector for the period 1989–1999. Multi-criteria
impact matrices and multi-criteria representations are used to provide a transparent method of integrated
analysis. Changes are characterized and quantified in a way that makes it possible to relate the impact of
existing trends in relation to different sub-objectives (variation in performance in relation to social,
economic and ecological indicators). The results of this analysis confirm a few well known predicaments of
sustainability associated with agriculture. The growth of Sweden economy is driving a major increase in
material throughputs within its agricultural sector. The need of increasing agricultural throughput
(especially labour productivity) has moved the Swedish dairy sector in a clear situation of decreasing
marginal return (=large increases in inputs are not reflected in a proportional increase in output).
Therefore, sound policies of development of this sector aimed at increasing the goal of sustainability have
to be developed by considering several indicators of performance, and not only economic variables.
Key words: integrated assessment, milk production sector, multi-criteria analysis, sustainable animal
production, Sweden.
Abbreviations: AAT: = Amino acids absorbed in the small intestine; DM: =Dry matter; ECM: = Energy
corrected milk; GDP: = Gross domestic production; IA: = Integrated assessment; ME: = Metabolizable
energy; MCIM: = Multi-criteria impact matrix; MCR: = Multi-criteria representation; RAM: = Result
analysis milk-production; SEK: = Swedish crowns; TPES: = Total primary energy supply.
1. Introduction
1.1. The Methodological Issue
Sustainable development has been officially endorsed as a key priority objective for
OECD countries (OECD, 2001). It entails considering simultaneously, as equally
Readers should send their comments on this paper to: [email protected] within 3 months of
publication of this issue.
Environment, Development and Sustainability (2006) 8: 351–373 � Springer 2006
DOI 10.1007/s10668-005-6980-4

relevant, social, economic and ecological dimensions. After the general agreement
reached at the Rio Conference on Environment and Development, the concept of
sustainable development should have been included in standard economic analysis
(OECD, 2001). Unfortunately, such an inclusion, so far, has been far from satis-
factory. In particular innovative methods of analysis aimed at sustainable develop-
ment should result useful:
• In the design of policies that, wherever possible, can enhance the sustainability
of socio-economic development. This can be obtained only by considering so-
cial, economic and ecological dimensions simultaneously.
• In the selection and implementation of these policies. This can be obtained by
providing an open and transparent process about how to decide criteria (sub-
objectives within the frame of a sustainable development) and how to weigh
their relative importance in the case of trade-offs. This requires involving the
stakeholder in such a process.
Sustainable development is based on multi-criteria decisions following the Pa-
retoconcepts (Pareto, 1896).
This paper wants to explore the potential of multi-criteria analysis to the issue of
integrated analysis of sustainability. The approach followed in the case study is
based on my experience as consultant (integrated analysis of environment, economy,
agriculture, milk production, forestry) during a period of 20 years (Hellstrand 1988,
1989, 1996, 1997, 1998; Drake and Hellstrand 1998; Hellstrand and Landner 1998,
2001; Landner et al. 2000). A consultant is required to follow causal chains between
system levels and disciplines as far as the benefits (for the customer) are higher than
the costs. This approach requires often combining useful information, which refers
to different levels of analysis. For example, within agriculture, knowledge about
processes at field and animal level are studied in biological, ecological and economic
terms (i.e. technical coefficients studied and defined at the microlevel). This infor-
mation, however, is crucial for the understanding characteristics manifested at the
macro-level (economic, social and ecological viability). In the same way, changes at
the macro level (prices of commodities, government regulations) are crucial for
determining the feasibility or relevance of activities performed at the micro-level.
Therefore, the concept of sustainable development requires the ability of establishing
connections among processes occurring at the macro- and the micro-level as well as
the ability of understanding how these links are relevant in relation to policy
implementation.
One ambition of this paper is to investigate whether a consultancy approach may
contribute to the implementation in practice of the policies for sustainable devel-
opment according to the frame proposed by OECD (2001). Therefore, the analysis in
this paper follows OECD’s conceptualisation of sustainable development. A sus-
tainable development, based on the simultaneous consideration of social, economic
and ecological dimensions, implies the preservation of a sufficient stock of capital for
each of the four types: human capital, social capital, human-made capital and nat-
ural capital. This is identified as a precondition for a sustainable development, since
352 STEFAN HELLSTRAND

these different types of capital are crucial for the generation of each other. This also
means that improving the coherence between environmental and economic policies
would support economic development able to respect ecological carrying capacity
limits. In particular OECD (2001) indicates as related goals: efficiency in use of
renewable and non-renewable natural resources; restricting emissions within the
assimilative capacity of affected ecosystems, and acknowledging the significance of
thresholds and, associated to that, resilience in ecosystems. With regard to agricul-
ture, this implies that a major aspect of sustainable development is a high and
sustainable capacity to satisfy human needs of energy and protein per ha of
agricultural land.
Transparency and accountability are also crucial factors in this task. This implies
that the process through which decisions are reached should be open to the public,
which should be informed about the full range of possible consequences of a given
choice (OECD, 2001).
Thus, sustainable development, the way OECD presents it, is a quite a compli-
cated issue. It implies a major challenge for the scientific community. It requires re-
discussing traditional criteria of good science. Scientists have to provide an input
relevant for the understanding of the behaviour of complex systems operating on
different scales and relevant in relation to different dimensions of analysis. Even
more challenging is the request to provide anticipatory models and mechanisms of
control for steering the trajectory of development toward states considered benign
for humans.
For such a challenging task an approach inspired by consultancy is required but is
not enough. Good consultancy is not equal to good science. This is why in the field
of integrated analysis of sustainability, it is becoming crucial to develop procedures
of analysis, which combine the merits of good consulting (capability to dealing in a
holistic way with several relevant issue and capability to tailor the analysis on the
specific interest of the customer), with the merits of good science (capability to
provide useful and verified knowledge in relation to typologies of processes and
situations). For an overview of this issue see the book of Giampietro (2003). In
particular, Giampietro in the first part of his book discusses the problems associated
with Integrated Assessment (IA), Sustainability Impact Assessment, Strategic
Environmental Assessment, Extended Cost Benefit Analysis, when dealing with the
sustainability of agro-ecosystems. These analytical tools all deal with three huge
systemic problems:
1. It is not possible to formalise once and for all a definition of ‘the right set’ of
relevant criteria to be considered in a ‘sound analysis’ of sustainability. This
task can only be performed after having set a specific context of reference and
a set of stakeholders.
2. It is unavoidable to find legitimate contrasting views among different agents in
relation to what should be considered as an improvement or the best
alternative to select.
353A MULTI-CRITERIA ANALYSIS IN SWEDISH MILK PRODUCTION

3. Uncertainty and ignorance cannot be excluded from scientific analyses, which
are required for sustainability assessments. Not all data, indicators and models
required to consider different dimensions of analysis (to reflect the views of dif-
ferent agents at different levels) have the same degree of reliability and accuracy.
These problems, according to Giampietro, motivate the use of participatory
procedures of Integrated Analysis based on a multi-criteria characterization of the
performance of agro-ecosystems in relation to sustainability.
In conclusion, when adopting a conceptualisation of sustainable development as
suggested by OECD, it is necessary to develop analytical tools that combine the
experiences typical of consultancy and the capacity of standardize information
typical of science. An example of this approach is given in the rest of this paper.
The case study is an integrated analyses of sustainability aimed at characterizing
the changes, which occurred in the sector of Swedish milk production for the
period of 1989–1999. In particular, this paper will quantify and discuss the effects
that existing trends in the use of concentrate feeding generate in relation to dif-
ferent indicators of sustainability. The goal is to identify a set of indicators that
can translate into practice what the abstract concept of sustainable development
means in terms of milk production occurring within a developed country, like
Sweden. The results of this analysis, therefore, should identify areas in which
measures can be taken to improve sustainability in relation to social, economic and
ecological dimension.
Before going into such an Integrated Analysis, I present in the following section a
brief overview of the major changes and drivers of the Swedish milk and cattle
production system.
1.2. Swedish Milk and Cattle Production
In Swedish cattle production, the use of crop protein feeds in purchased feeds in-
creased 2.7 times for the period of 1991–1999 – this increase was mainly associated
with the use of soya bean meal (Statistics Sweden, 1997, 2000). This represents a
dramatic change in the meaning and role played by cattle within the Swedish
socio-economic system.
In fact, cattle-production has been a major element in the Swedish food system
for thousands of years. The quality of pasture in Sweden, in quantitative and
qualitative terms, is similar to that of other regions of the world from the south
to the northern parts, while only the southern parts of Sweden can compete in
grain production.1 The supply of chemical energy and crude protein of pastures is
very low for humans and for other mono-gastric animals, such as pigs and
poultry, while ruminants via the rumen microbes can transform the output of
pasture into high quality food such as milk and meat. This is the physiological/
historical reason why most Swedes belong to the global minority of populations,
where most adults tolerate intake of lactose.2 Animal products for Sweden were a
way for using resources that otherwise could not be used by humans. Whereas, a
354 STEFAN HELLSTRAND

massive increase in the use of crop protein feeds purchased to feed cattle (mainly
imported soya bean meal from outside Europe) implies a major change in
strategy. Resources that could be used directly by humans to satisfy physiological
requirements of energy and protein are used to feed animals with the only goal to
increase economic profit. Moreover, the feeding value of low quality feeds is
higher for ruminants than for mono-gastric animals, whereas the feeding value of
high quality feeds is lower for ruminants compared to mono-gastric animals due to
fermentation losses in the rumen.3 All these considerations seem to indicate that
actual trends may provide conflicting assessment of performance when different
objectives for sustainable development (different criteria of performance) are
considered.
In particular technological changes in agriculture are a function of (Giampietro,
2003):
(i) changes in the socioeconomic system to which the farming system belongs;
(ii) the characteristics of the ecosystem managed for agricultural production; and
(iii) farmers feelings and aspirations.
Therefore, economic growth (on the macro-level) pushes for increases in the
throughput per ‘hour of labour’ at the farm level (Giampietro, 2003). In developed
countries, such as Sweden, in the long term, the growth of the economy, when as-
sessed in GDP-terms – tends to be associated with the growth of energy consumption
in the society. Hall et al. (1986) provided a detailed review of different studies
available at that time showing strong connection between economic growth and the
use of energy. Data from IEA (1999) show that this relation is valid when considering
the performance of developed economies such as Japan, EU and USA. In conclusion,
when looking at the changes occurring in the milk production system of Sweden, we
can explain the increase in the use of concentrates (=crop protein feeds and grains) in
dairy production as an increase in the material throughput of the production process,
which is required to increase the economic productivity of labour in this economic
sector in order to remain competitive with the rest of Swedish economy.
1.3. Goals of the Case Study
The goals of this case study are:
(i) To verify the usefulness of Integrated Analysis based on multi-criteria charac-
terization of performance for a deeper understanding of the implications of
‘‘sustainable development’’ for animal production systems operating in devel-
oped countries; and
(ii) To provide useful information over the recent trends in one important animal
production branch, milk production, in Sweden. The set of data organized in
multi-criteria impact matrices and multi-criteria representations provide a
transparent method of integrated analysis to study changes in relation to soci-
etal objectives of sustainable development.
355A MULTI-CRITERIA ANALYSIS IN SWEDISH MILK PRODUCTION

2. Materials and methods
2.1. Data on Trends 1962–1995 in Swedish National Economy and Milk Sector
The physical throughput and economic output per labour hour in the Swedish
economy 1962–1995 has been estimated using the following data: (a) total primary
energy supply (TPES) and (b) purchasing power parities in fixed prices from IEA
(1999); (c) labour data from the EMEC–model, Swedish National Institute of
Economic Research.4 Biological throughput and economic output, respectively, per
labour hour in Swedish milk production sector 1960–1990, has been estimated using
the following data: (a) supply of Metabolizable Energy (ME), (b) milk yield, (c)
input of labour; from SHS (1991). Revenues from milk production, fixed price, were
estimated in relation to milk prices (ibid.) and Swedish consumer price indexes from
Statistics Sweden.5 In SHS (1991) the size of cow herd is assumed constant over time.
Thus, the impact of lower labour costs per cow due to advantages of scale is not
considered. Incomes from dairy cows are estimated via revenues from the product
milk. Other incomes are from calves and from meat sold out from the dairy farm.
However, milk contributed with 80% of total incomes on the dairy farm in 1990
(ibid.), thus this simplification is a minor source of error.
2.2. Nitrogen Influxes Via Purchased Feeds to Cattle 1989–1999
Nitrogen influxes to Swedish agricultural sector via purchased feeds to cattle 1989–
1999 has been estimated via amounts of different feed stuffs used in the production of
purchased feeds (Swedish Board of Agriculture, 1992, 1995, 1997, 2001) and the
content of crude protein in these feed stuffs (Sporndly, 1991). The influx of crude
protein has been divided by 6.25 (ibid.) to obtain the influx of nitrogen. In 1991 we
found the lowest record for nitrogen influx. In that year the officially recommended
system to evaluate protein content in feeds and to estimate protein requirements was
substantially changed. The official tables and feeding standards closest before and
after this shift are in the report of Sporndly (1989, 1991). In 1995, the procedure to
estimate energy and protein requirements to lactating cows was changed. The first
official representation of energy and protein requirements to lactating cows after the
changes in 1995 is reported by Sporndly (1995). Due to the changes in protein
evaluation system in 1991 combined with the fact that the lowest nitrogen influx to
Swedish cattle via purchased feeds was obtained in 1991, the rest of the analysis was
focused on the period 1991–1999.
2.3. Multi-Criteria Analysis of Trends in Concentrates Feeding 1989–1999
According to the procedure proposed by Giampietro (2003) to evaluate simulta-
neously social, economic and ecological effects in an Integrated Analysis, several
criteria of performance – and relative indicators – have been considered to
356 STEFAN HELLSTRAND

characterise the effect of changes in the use of concentrate feeding to cattle in Sweden
for the period of 1991–1999. In particular, the analysis focuses on crop protein feeds
and grain products in purchased feeds. Common cereals dominate grain products.
E.g., for 1999, contribution to ‘‘grain products’’ from different sources were: 70%
oat, barley, wheat and rye; 12% other cereals, while remaining 18% are by-products
from milling (Swedish Board of Agriculture, 2001). The results of such an integrated
analysis are presented in the form of a multi-criteria impact matrix (MCIM), in
which quantitative estimates are provided for the years 1991, 1995 and 1999 in
relation to 14 indicators (Tables I and II). The same results are also presented in the
form of a multi-criteria representation (MCR) – a spider-web graph (Figure 3). Both
tables and figures will be discussed in detail in Section 3. For 1991 the value in the
MCR for each variable in the MCIM, is set to 1.0. The values for the years 1995 and
1999, respectively, show the proportional change compared to the situation 1991.
In the rest of this section, I provide for each variable/indicator included in the
MCIM the reason of its choice and the path through which its numeric value is
estimated. Data sources covering the time period 1991–1999 are presented below.
Some of the sources indicated in Section 2.1 for the time period 1962–1990, and 1995
may differ.
Indicators of throughput
Information on throughput in the national economy and in the milk-producing
sector, are required to verify the hypothesis that throughput trends in the milk sector
1991–1999 are driven by throughput trends on the national scale, resulting in in-
creased incomes.
• Material throughput in the Swedish economy is measured in terms of energy
use (Swedish Energy Agency, 2001), in accordance with international standards
regarding energy statistics.
• Gross Domestic Production – GDP – provides information about the economic
output from the material throughput on the national scale. Trend for GDP,
price-level 1995, is from Statistics Sweden.6
Indicators of inputs
• Material input to the Swedish milk sector is estimated using two variables: (a)
Energy use in milk production. The energy input considered is used to feed physi-
ological processes of dairy cows. (b) Protein input to feed. This second variable
represents a key indicator for an integrated analysis of changes of this sector.
Moreover, the performance of feeding requires a balanced supply of energy and
protein. This requires considering both the energy and protein requirements of
the animal.
• Data on the amount of grains and forages fed to dairy cows, which are pro-
duced on the own farm (or on neighbour farms and traded directly to the dairy
farms) are not available on the national level in Sweden (Tomas Ericsson,
357A MULTI-CRITERIA ANALYSIS IN SWEDISH MILK PRODUCTION

Swedish Board of Agriculture; personal communication 2003). Furthermore, re-
cords of milk production for cows outside the official milk record programme
are not available. Thus, the supply and use of energy and protein to the milk
production had to be estimated for these cows. For the rest, energy and protein
need for maintenance (assumed live-weight 600 kg/cow) and milk production in
1991 was estimated using: (a) total number of dairy cows in Sweden (Statistics
Sweden, 1997); (b) milk yield, expressed in ECM (Energy Corrected Milk) per
cow, as resulting from the official milk record programme (ibid.); and (c) official
feeding recommendations for maintenance and milk production (Sporndly,
1991). In any case, estimating national averages using average production values
of the cows included in the official milk record program is a defendable choice.
In fact, while not all dairy cows are within this program, the program covers a
large fraction of them. In 1991, the fraction of dairy cows included in the milk
record programme was 77% (Statistics Sweden, 1997). The fraction became 87%
in 1999 (Statistics Sweden, 2000). Moreover, it is unlikely that differences be-
tween the cows included or outside the programme is so dramatic to invalidate
such an estimate. The calculations of nutritive needs were based on 12 months
calving intervals and 6 weeks dry period. The length of the dry period affects the
length of the lactation period, and thus the estimated nutritive needs for mainte-
nance during lactation. ‘‘Gestation needs’’ and ‘‘maintenance needs’’ during dry
period were not considered. These requirements are to a minor part fulfilled via
purchased feeds. Furthermore, of the total nutritive needs during one year, the
needs during the dry period play a marginal role. Thus, all energy needs for ges-
tation plus maintenance during dry period sum to only 6% of the total energy
requirements of a cow producing 8000 kg ECM. Assumed forage ration was
8 kg dry matter (DM) per cow and day with the average energy and protein con-
tent of analysed forages in 1991 (Swedish Dairy Association, 2001).
• Benchmark level for needs of energy and protein to dairy cows. It was assumed
that in 1991 the supply of energy and protein to the dairy cow stock was exactly
100% of the needs. Thus, the estimate of the nutritive needs of the Swedish
dairy cow stock for this year is also an estimate of the supply of nutrients. This
provides a fixed level of amount of energy and protein fed the dairy cow stock
used as reference. The fixation of a benchmark level in a specific year facilitates
the analysis of observed trends.
• Actual supply of energy and protein to dairy cows compared with requirement.
The supply of energy and protein, given by SHS (1992), for 823 dairy herds
within the program result analysis milk-production (RAM) is equal to 109%
and 110%, respectively of requirements in 1991. The RAM-herds represent a
positive selection from the total population of dairy herds. Hellstrand (1988) in
a field investigation on 15 dairy farms representing high-, middle- and low- pro-
ducing herds found that the allowances of energy and protein, respectively, was
12 and 17% above requirements. In the study, all feeds fed were weighted and
analyses of nutritive content of feeds were performed.
358 STEFAN HELLSTRAND

• Supply of energy and protein to the milk sector in 1995 and 1999 was estimated
via the changes in the allowances of energy and protein from 1991, added to the
estimate of the level of supply in 1991. The change in the allowance was calculated
by assuming 8 kg DM forages per dairy cow and year with the average nutritive
content as of analysed forages that year (Swedish Dairy Association, 2001). Total
amount of energy and protein to the dairy stock provided from grain and crop
protein feeds that was not included in purchased feeds was assumed to be the same
as in 1991. Change in energy and protein from purchased feeds was estimated via
change in total amounts of grains products and crop protein feeds in purchased
feeds (Swedish Board of Agriculture, 1992, 1995, 1997, 2001), respectively, multi-
plied by the nutritive content of grain products and crop protein feeds, respec-
tively. In these calculations it was assumed that the nutritive content of grain
products and crop protein feeds, respectively, equalled the one of barley (Sporn-
dly, 1991) and soya bean meal (ibid.), respectively.
Indicators of the Level of Grain and Crop Protein in Purchased Feeds
Levels of grain and protein-crops, and trends regarding the use of purchased feeds
are crucial for the integrated analysis of this paper. Changes in the level of grain and
crop protein used in the feeds dominate trends for purchased feeds in the period
1991–1999. In 1991 the contribution from grain products and crop protein feeds
together was 62% of purchased feeds and in 1999 it was 72%. In the period, 1991–
1999 grain products and crop protein feeds contributed 88% of the total increase in
use of purchased feeds to cattle in Sweden. Data on grain products and crop protein
feeds are from Swedish Board of Agriculture (1992, 1995, 1997, 2001). The proce-
dure for estimating nitrogen in purchased feeds has been described in Section 2.2.
The cost of purchased feeds to cattle indicates an investment of economic re-
sources in the agricultural sector that otherwise could have been used for other
purposes. Mainly, this cost has to be attributed to the milk sector, since the major
fraction of purchased feeds to cattle is used for milk production. Thus, during the
period 1991–1998, 87–89% of purchased feeds to cattle were categorised as feeds to
dairy cattle, while in 1999 such a fraction was 86.3% (Swedish Board of Agriculture,
1992, 1995, 1997, 2001).
Ideally, the costs of purchased feeds (fixed price) should be estimated using the
average price over the total amount of purchased feeds sold. However, official sta-
tistics do not provide this information. Statistics Sweden (2002a) provides the total
cost of purchased feeds referring to poultry, pigs and cattle together. Swedish Board
of Agriculture (1992, 1995, 1997, 2001) has data on total amount of purchased feeds.
Division gives the average price per kg. Multiplication by consumer price indexes
(Statistics Sweden7) gives average price on purchased feeds 1991, 1995 and 1999,
price level 1991. In this study the price of purchased feeds to cattle is assumed to be
equal to the average price on all purchased feeds to cattle, poultry and pigs. Thus, an
estimate of the costs for purchased feeds to cattle has been obtained by multiplying
the amount of purchased feeds to cattle (Swedish Board of Agriculture, 1992, 1995,
1997, 2001) by such a price.
359A MULTI-CRITERIA ANALYSIS IN SWEDISH MILK PRODUCTION

Indicators of Outputs: Useful Products
Revenues in milk production show the economic output from the material
throughput in milk production. The source is Statistics Sweden (2002a). Multipli-
cation by consumer price indexes gives a fixed price-level.
Material output. The input of feeds is transformed in the production system into
an output of valuable products such as meat and milk. The amount of milk produced
is measured in kg ECM. The method for estimating the national production of milk
has been presented before, in the section referring to the assessment of inputs. Data
are estimated starting from the information available on the cows included in the
official milk record programme (Statistics Sweden, 1997). Meat production is esti-
mated from Statistics Sweden (1997, 2000). The total meat production from cattle is
partitioned in one flux of meat from the stock of dairy cows and one from the stock
of cows used for meat production only. The partitioning is based on the assumption
that the fluxes are proportional to the fraction of total number of cows used for dairy
production and for meat production only.
Indicators of Outputs: Losses of Nitrogen
Losses of nitrogen are an important indicator of negative ecological effects. In fact,
emissions of ammonia contribute to acidification and eutrophication. The Oslo-Paris
convention (OSPAR) has provided a method for estimation of nitrogen balances in
the whole agricultural sector, so-called farm gate balances (Statistics Sweden,
2002b). The objective for participating countries are to reduce discharges of nitrogen
to the North Sea by 50% compared to the level of 1985. Considered influxes to the
agricultural sector are commercial fertilisers; feeds; sewage sludge; atmospheric
deposition; and fixation through leguminouses. Considered effluxes are crops and
animal products exported from farms; emissions of ammonia; leaching of nitrate to
water systems; and denitrification (ibid.).
The nitrogen efficiency in the Swedish agricultural sector 1985, 1991, 1995, 1997,
and 1999, respectively, was 32, 35, 32, 35, and 32%. The efficiency is the ratio of
outputs in crop and animal products out from the agricultural system through total
influxes. The difference between (i) sum of influxes and (ii) effluxes through crops and
animal products, respectively, measures surplus influxes. In 1999, the surplus was
71 kg nitrogen per ha. Of this surplus, 46% leached as nitrate, 26% was emitted as
ammonia in the animal production system, and 28% was accumulated in top soil.
Farms with intensive animal production had higher surplus influxes than others,
despite higher crop yields. This increases the risk for losses to the environment (ibid.).
In the situation described, with a nitrogen efficiency in the agricultural sector from
1985 to 1999 of 32–35% reported years, and where (for 1999) 46% leached to water
systems as nitrate, and 26% was emitted as ammonia from the animal production
system, one can clearly state the following:
Increased loads of nitrogen to the Swedish agricultural system through increased
content of nitrogen in feeds to dairy cattle will in a situation with constant effluxes
of nitrogen in meat and milk contribute to an increased load to top soil. This
increased load will directly contribute to increased leaching of nitrate, and also
360 STEFAN HELLSTRAND

indirectly result in increased leaching through mineralization of nitrogen in organic
matter when ley is succeeded by grain in the crop rotation. It will also increase
ammonia emissions.
The amount of milk and meat produced from the dairy stock is quite constant
from 1991 to 1995 and 1999 (see Table I). This translates into the obvious fact that
the nitrogen output associated with these products has been constant too. Therefore,
the increased input of nitrogen associated with the increasing use of purchased feeds
is associated with an increase in the emissions/discharges of ammonia and nitrate
into the Swedish environment. Of the nitrogen effluxes in manure and urine, 30% is
emitted as ammonia (Danell, 2001), while the rest contributed to increased dis-
charges of nitrate to water systems. The relationship between the weight of nitrogen
and the weight of ammonia with the same amount of nitrogen is 17/14=1.21.
Indicators Referring to the Ecological Opportunity Cost of Milk
As discussed in the introduction, a major aspect of sustainable development
(Regeringen, 2001, and OECD, 2001, respectively, provide late expressions of the
interpretation of a sustainable development on the national and international level,
respectively) within agriculture is a high and sustainable capacity to satisfy human
needs of energy and protein per ha of agricultural land.
To this respect using grain products and crop protein feeds in purchased feeds for
dairy production implies reducing the possibility of using these products as food for
humans. Therefore, in this paper, I propose the use of an indicator, which is rep-
resented by the number of people whose energy and protein requirements could have
been supplied by the amount of grain products and crop protein feeds used in
purchased feeds to cattle. Since the production of these grain products and crop
protein requires the use of arable land, the higher is the use of these input as feeds
(especially when not necessary), the lower is the capacity of satisfying human needs
per ha of agricultural land. More discussions on this point are given later on.
The indicator is based on the following assessments. Nutritive needs in terms of
energy and protein are the ones of moderate occupational work as average for men
(70 kg) andwomen (60 kg) (WHO, 1985). The protein requirementswere corrected for
the lower content of essential amino acids in grain products and crop protein feeds
compared to egg, milk and meat in accordance with the procedure recommended by
WHO (ibid.). The chemical content of grain products is assumed to equal the chemical
analysis of barley (Sporndly, 1991) and the chemical content of crop protein feeds is
assumed to equal the one of soya beanmeal (ibid.). In this way, the calculation of grain
products and crop protein feeds in purchased feeds can be directly linked to an estimate
of how many people could be fed if the same quantity of these products were used as
food.Here, I only consider needs and supplies of energy andprotein. The aspect ofmilk
as an important source of calcium, e.g., is not considered. Sporndly (1991) provide
direct values on crude protein content. Division by 6.25 gives the nitrogen content.
Available energy, when used as food for humans’ per kg barley and soya bean meal,
respectively, was estimated by applying the Atwaters factors (WHO, 1985) to the
chemical composition of the mentioned crop products in Sporndly (1991).
361A MULTI-CRITERIA ANALYSIS IN SWEDISH MILK PRODUCTION

3. Results
Figure 1 shows changes over the value taken by biophysical throughputs and eco-
nomic output in the Swedish economy and milk production sector per labour hour
1965–1990/95.
From 1962 (the reference year) to 1995 the growth on the national level of material
throughput measured as TPES and GDP measured as purchasing power parities per
labour hour followed each other’s quite closely. These trends confirm that increased
welfare in Sweden during that period (measured in GDP-terms) was associated to an
increase in the material throughput in the milk production sector.
From 1962 to 1990 the growth of material throughput (MJ ME) and economic
revenues in milk production in Sweden per labour hour increased in a similar way.
Furthermore, they followed the same paths as material throughput and economic
output on the national level (Figure 1). Thus, the results in Figure 1 confirm that
during this time window, in a growing national economy, the sector of milk pro-
duction had to increase material throughput per labour hour. This resulted in a
corresponding increase in the value of the major output; milk.
Figure 2 shows trends regarding use of different kinds of feeds in purchased feeds
to cattle in Sweden expressed in terms of nitrogen influxes 1989–1999.
In the period 1991–1999 the use of crop protein feeds in purchased feeds to cattle
increased by a factor 2.7 in Sweden. The major part of this influx was purchased
feeds to dairy cows.
Table I shows the results for the 14 variables included in the MCIM for Swedish
milk production 1991, 1995 and 1999 in quantitative terms.
Figure 1. Biophysical throughput in the Swedish economy and milk production respectively, measured as
MJ primary energy supply per labour hour (MJ TPES/h) and MJ metabolisable energy per labour hour
(MJ ME/h), respectively. Economic output per labour hour in the Swedish economy and milk production
respectively, measured as GDP fixed price (GDP 90 US$/h) and revenues milk production fixed price
(revenues 90 SEK/h), respectively. For the reference year 1962, all numerical values are 1.0.
362 STEFAN HELLSTRAND

Table II shows the results for the 14 variables included in the MCIM for Swedish
milk production 1991, 1995 and 1999 in relative terms.
While the energy use in Sweden increased by 3% from 1991 to 1999, the GDP in
fixed prices increased by 21%. This suggests a positive trend on the national level with
a substantial increase in the amount of GDP achieved per unit energy used (+17%).
However, in the milk-producing sector, the development was in the opposite
direction, with a decrease in the revenues per unit energy used with 25%. The
energy use in milk production increased by 9% in the same period, while the
revenues decreased by 18%. Looking at the information given in Tables I and II
we can notice the peculiar effects of post-industrialisation in terms of economic
growth and biophysical intensity of the economic process. An increase in the
Figure 2. Annual nitrogen influxes (kg) to Swedish agriculture via purchased feeds to cattle. 1989–1999.
Values are expressed in the form 10 Eta, which equals 1.0·10a
TABLE I. Multi-criteria impact matrix of Swedish milk production 1991–1999, quantitative terms.
1991 1995 1999
1. Energy use Sweden, E+9MJ 2.13 2.16 2.20
2. GDP, E+12 SEK (price–level 1995) 1.65 1.77 1.99
3. Energy use, Swedish milk production, E+10 MJ ME 3.13 3.36 3.40
4. Revenues milk, E+9 SEK (price–level 1991) 10.8 9.00 8.82
5. Grain in PF, E+8 kg DM 2.59 2.82 3.40
6. Crop protein feeds in PF, E+8 kg DM 1.77 3.95 4.71
7. Nitrogen, PF, E+7 kg 1.90 3.51 4.18
8. Costs PF, E+9 SEK (91) 1.99 2.27 2.37
9. Milk, E+9 kg. 3.90 3.90 3.76
10. Meat, E+8 kg 1.11 1.06 1.02
11. Ammonia, PF, E+6 kg 6.94 12.8 15.2
12. Nitrate-N, PF, E+7 kg 1.33 2.46 2.93
13. Food security, energy, E+6 No adults 1.72 2.65 3.18
14. Food security, protein, E+6 No adults 3.58 8.34 10.21
363A MULTI-CRITERIA ANALYSIS IN SWEDISH MILK PRODUCTION

throughput of productive sectors (in this case the fast increase in use of purchased
feeds to cattle between 1991 and 1999) is translated into an increased welfare
(expressed in GDP-terms) for the whole country, which was not accompanied by a
corresponding increase in energy use. This apparent paradox can be explained by
the fact that the productive sectors experiencing a major increase in energy
intensity per hour of labour (agriculture, manufacturing, energy and mining) are
also the sectors that experienced the most dramatic reduction of labour input.
Therefore, the ability of moving human activity to leisure, education and work in
the service sector – where the energy intensity per hour of labour is much lower –
was able to more than compensate such an intensification of the productive process
(Giampietro, 2003).
In the milk-producing sector, the increase in energy use occurred at the same time
as the revenues from milk decrease substantially. The amount of grain products in
purchased feeds increased by 31% (Table II), while the input of crop protein feeds
increase by 2.66 times from 1991 to 1999. In price-level 1991, the costs for purchased
feeds to cattle increased by 380 million SEK. In physical terms, the amount of milk
produced declined by 4% while the amount of meat declined by 8% from 1991 to
1999. Thus, also when measured in physical terms it appears that the increase in the
use of grain products and crop protein feeds in Swedish milk production – i.e. the
increase of this material influx to the milk-production system – has not resulted in an
increased output of valuable products. This confirms the well known law of
decreasing marginal return in biophysical processes, according to which we should
expect that after passing a certain level of throughput, further intensification of the
rate of production no longer pays. In this situation, an increase of material input,
which is not associated with an increase in expected output, must result in an in-
crease of unwanted effluxes. In fact, Table II indicates that the increase of nitrogen
influxes associated with purchased feeds has not resulted in a corresponding increase
of nitrogen associated with valuable products. Rather, it contributed to increased
effluxes of ammonia to air and nitrate to water systems by 2.2 times.
TABLE II. Multi-criteria impact matrix of Swedish milk production 1991–1999, relative terms.
1991 1995 1999
1. Energy use Sweden, MJ 1.00 1.02 1.03
2. GDP, SEK 1.00 1.08 1.21
3. Energy use, Swedish milk production, MJ ME 1.00 1.07 1.09
4. Revenues milk, SEK 1.00 0.84 0.82
5. Grain in PF, kg DM 1.00 1.09 1.31
6. Crop protein feeds in PF, kg DM 1.00 2.23 2.66
7. Nitrogen, PF, kg 1.00 1.84 2.20
8. Costs purchased feeds, SEK 1.00 1.14 1.19
9. Milk, kg 1.00 1.00 0.96
10. Meat, kg 1.00 0.95 0.92
11. Ammonia, PF, kg 1.00 1.84 2.20
12. Nitrate-N, PF, kg 1.00 1.84 2.20
13. Food security, energy, No adults 1.00 1.54 1.84
14. Food security, protein, No adults 1.00 2.33 2.85
364 STEFAN HELLSTRAND
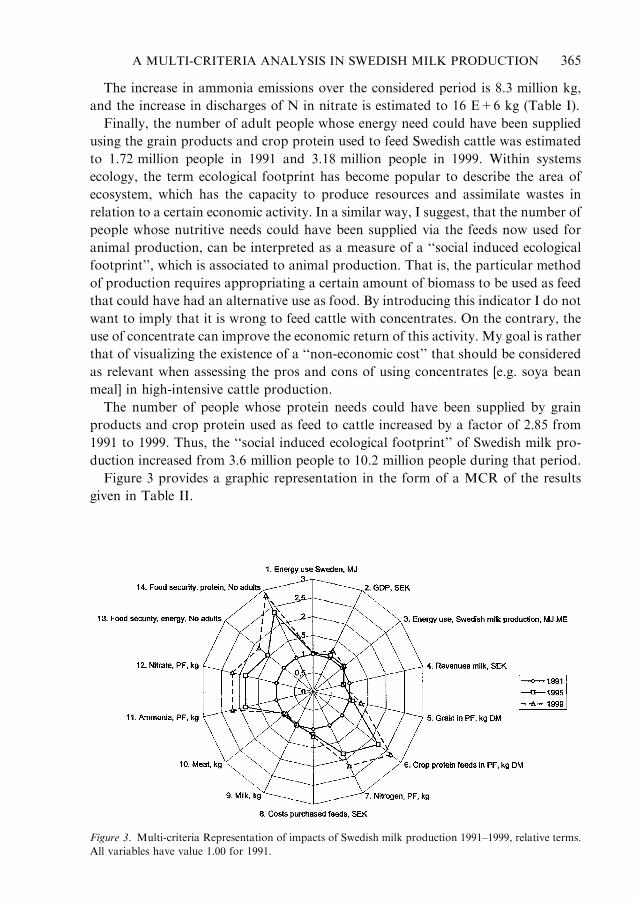
The increase in ammonia emissions over the considered period is 8.3 million kg,
and the increase in discharges of N in nitrate is estimated to 16 E+6 kg (Table I).
Finally, the number of adult people whose energy need could have been supplied
using the grain products and crop protein used to feed Swedish cattle was estimated
to 1.72 million people in 1991 and 3.18 million people in 1999. Within systems
ecology, the term ecological footprint has become popular to describe the area of
ecosystem, which has the capacity to produce resources and assimilate wastes in
relation to a certain economic activity. In a similar way, I suggest, that the number of
people whose nutritive needs could have been supplied via the feeds now used for
animal production, can be interpreted as a measure of a ‘‘social induced ecological
footprint’’, which is associated to animal production. That is, the particular method
of production requires appropriating a certain amount of biomass to be used as feed
that could have had an alternative use as food. By introducing this indicator I do not
want to imply that it is wrong to feed cattle with concentrates. On the contrary, the
use of concentrate can improve the economic return of this activity. My goal is rather
that of visualizing the existence of a ‘‘non-economic cost’’ that should be considered
as relevant when assessing the pros and cons of using concentrates [e.g. soya bean
meal] in high-intensive cattle production.
The number of people whose protein needs could have been supplied by grain
products and crop protein used as feed to cattle increased by a factor of 2.85 from
1991 to 1999. Thus, the ‘‘social induced ecological footprint’’ of Swedish milk pro-
duction increased from 3.6 million people to 10.2 million people during that period.
Figure 3 provides a graphic representation in the form of a MCR of the results
given in Table II.
Figure 3. Multi-criteria Representation of impacts of Swedish milk production 1991–1999, relative terms.
All variables have value 1.00 for 1991.
365A MULTI-CRITERIA ANALYSIS IN SWEDISH MILK PRODUCTION
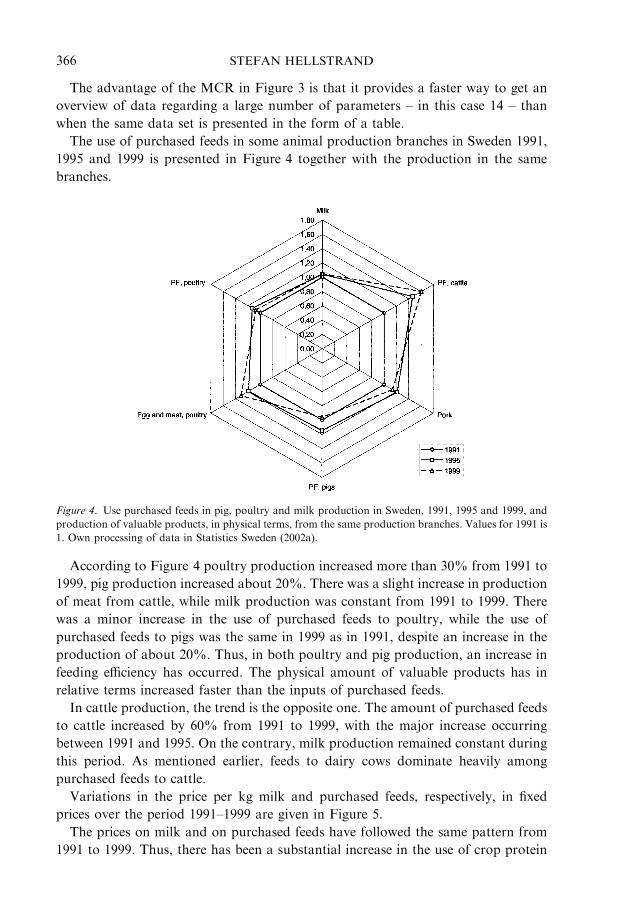
The advantage of the MCR in Figure 3 is that it provides a faster way to get an
overview of data regarding a large number of parameters – in this case 14 – than
when the same data set is presented in the form of a table.
The use of purchased feeds in some animal production branches in Sweden 1991,
1995 and 1999 is presented in Figure 4 together with the production in the same
branches.
According to Figure 4 poultry production increased more than 30% from 1991 to
1999, pig production increased about 20%. There was a slight increase in production
of meat from cattle, while milk production was constant from 1991 to 1999. There
was a minor increase in the use of purchased feeds to poultry, while the use of
purchased feeds to pigs was the same in 1999 as in 1991, despite an increase in the
production of about 20%. Thus, in both poultry and pig production, an increase in
feeding efficiency has occurred. The physical amount of valuable products has in
relative terms increased faster than the inputs of purchased feeds.
In cattle production, the trend is the opposite one. The amount of purchased feeds
to cattle increased by 60% from 1991 to 1999, with the major increase occurring
between 1991 and 1995. On the contrary, milk production remained constant during
this period. As mentioned earlier, feeds to dairy cows dominate heavily among
purchased feeds to cattle.
Variations in the price per kg milk and purchased feeds, respectively, in fixed
prices over the period 1991–1999 are given in Figure 5.
The prices on milk and on purchased feeds have followed the same pattern from
1991 to 1999. Thus, there has been a substantial increase in the use of crop protein
Figure 4. Use purchased feeds in pig, poultry and milk production in Sweden, 1991, 1995 and 1999, and
production of valuable products, in physical terms, from the same production branches. Values for 1991 is
1. Own processing of data in Statistics Sweden (2002a).
366 STEFAN HELLSTRAND

feeds in Sweden in purchased feeds to cattle from 1991 to 1999. This has caused a
number of impacts detectable in different variables, which are important for sus-
tainable development when considering its social, ecological and economic dimen-
sions. The increase in the use of purchased feeds is exclusive for cattle production.
Pig and poultry production has not experienced a similar trend. As the relative price
of milk and purchased feeds has followed a quite similar path between 1991 and
1999, the increase in use of purchased feeds cannot be motivated by changed relative
prices between purchased feeds and milk.
4. Discussion
The main purpose of this paper is to illustrate the potentiality of the approach of
Integrated Analysis, which means (a) the simultaneous handling of indicators devel-
oped in different disciplinary fields to cover different and non-reducible dimensions of
sustainability; and (b) an approach more related to the procedures adopted by con-
sultants (selecting and tailoring the set of relevant indicators on the special issue dealt
with), rather than theoretical academic analysis looking for ‘‘the’’ optimal solution
based on the consideration of a standard set of sustainability indicators.
The analysis in this paper focuses on the effort to track vital relations between
systems and system levels by applying methods of IA. Researchers at Wageningen
University have investigated the capacity of life cycle assessment as a tool to assess
the integrated environmental impact of conventional and organic animal production.
Figure 5. Price per kg milk and purchased feeds, respectively, in fixed prices 1991, 1995 and 1999, Own
calculations based on data in Statistics Sweden (2002a) and consumer price indexes from Statistics Swe-
den, www.scb.se.
367A MULTI-CRITERIA ANALYSIS IN SWEDISH MILK PRODUCTION

For example, in order to illustrate this aim, Boer (2003) provided a pilot study
comparing conventional and organic milk production. This is an example of a more
detailed analysis of different environmental impacts such as contribution to global
warming, acidification, eutrophication, pesticide use, and land use. This approach
complements the one presented in this paper.
The presentation of the results illustrated so far and quite clearly that when
structuring the problem in this way – the discussion of the trends in the use of
purchased feeds in the milk sector of Sweden is actually an excellent case study – it
becomes evident that the issue of sustainability entails facing always incommensu-
rable trade-offs. Rather than pretending to look for win–win–win solutions, it is
better to acknowledge the need of discussing how to reach compromising solutions.
Coming to relevant information related to the trends in the sector of milk pro-
duction, there are three relevant observations:
4.1. Nitrogen Losses
One of the major negative environmental impacts from Swedish milk production is
the emission of ammonia, contributing to problems such as eutrophication and
acidification. Out of the total emissions of ammonia in Sweden in 1999, cattle
production contributed 31,900 metric tonnes, i.e. 58% of the estimate of total
emissions (Statistics Sweden, 2001). The increase of nitrogen influxes via purchased
feeds to cattle 1991–1999 of 22.8 E + 6 kg (Table I) is estimated to result in an
increase of ammonia by 8.3 million kg. This corresponds to 15% of total ammonia
emissions in Swedish society in 1999 (ibid.).
4.2. Use of Natural Resources
One of the major fractions of renewable resources used in milk production is feeds.
In the section of Materials and methods, I presented an approach to estimate the
amount of energy and protein supply which is above the requirement of 1999, which
was adopted as a benchmark.
The value of 1999 energy requirement for dairy cows in Sweden was 2.88E + 10
MJ Metabolizable Energy (ME), whereas the protein requirement was 2.15E + 8 kg
Amino Acids Absorbed in the small intestine (AAT). AAT is the dimension in which
the protein requirement of dairy cattle is expressed in Sweden since 1991 (Sporndly,
1991). The system is also used in the other Nordic countries. If the dairy cows in 1991
were fed exactly according to their needs, the above-requirements content of the
rations in 1999 was 5.2E + 9 MJ ME and 5.6E + 7 kg AAT. The estimates of
energy and protein correspond to 18% and 26% energy and protein, respectively, fed
above requirements in 1999.
This paper focuses fluxes of energy (and protein) in feeds to dairy cows in
Sweden. However, the amount of e.g. auxiliary energy required is another aspect
368 STEFAN HELLSTRAND

that must be considered in an analysis of the sustainability of animal production
systems. Pimentel (2004) found for another industrialised nation, USA, the fol-
lowing relations. The average fossil energy input per unit energy in protein pro-
duced in animal production was 25:1. This was about ten times the corresponding
ratio in grain production. The ratio for chicken–broiler production was 4:1, for
turkey production 10:1 and for milk production 14:1. As food to humans, animal
protein had about 1.4 times higher biological value compared to grain proteins.
Nearly all feed protein consumed by broilers was grain, whereas it for milk pro-
duction was about two-thirds. However, milk production can be based entirely on,
forages (ibid.).
4.3. Economic Effects
Costs for purchased feeds to cattle increased by 380 million SEK from 1991 to 1999
(Table I). In terms of the price-level 1999, this equals 440 million SEK. Table I,
Figures 2 and 3, provide information implying a substantial increase in influxes of
purchased feeds to cattle. As already noted, this increase was not associated with a
corresponding physical increase in valuable products (useful output) from the dairy
stock herd, or an increase in economic value per physical unit of useful output. Thus,
it is possible to calculate the reduction in the economic cost for purchased feeds to
dairy cows in 1999, if in that year, the milk sector of Sweden had used the same
amount of purchased feeds of 1991. According to the Materials and methods section
and using the data about total amounts of purchased feeds to cattle in 1991 and
1999, the difference between the estimates of the costs for purchased feeds in 1999
and in 1991 ( ¼ the increase in the amounts used multiplied by the price 1999) is a
measure of the potential reduction of the economic costs in milk production in 1999.
Such a reduction can be estimated around 1000 Million SEK. In fact, considering
that 88.5% and 86.3% of purchased feeds to cattle in 1991 and 1999 (Swedish Board
of Agriculture, 1992, 2001), respectively, was classified as feeds to dairy cows, the
estimate of the potential for reduced costs for purchased feeds in Swedish milk
production 1999 of 840 Million SEK price-level 1999. This corresponds to 1880
SEK. per dairy cow, which corresponds to 23% of the total payments for inputs of
own labour and capital in the agricultural sector in Sweden in 1999 (see Statistics
Sweden, 2000). Payment for milk constituted 32% of the total income of Swedish
farmers in 1999 (ibid.).
This estimate of the potential for reduced feeding costs is slightly higher than the
720 million SEK obtained by Hellstrand (2002). It should be noted that based on the
assumptions provided in Material and methods, the requirements of energy and
protein through purchased feeds to the Swedish dairy stock herd in 1999 was 1.4%
higher and 0.7% lower, respectively, than 1991. Thus, it is quite fair to use the use of
purchased feeds in 1991 as reference value in an estimate of the potential to reduce
costs for purchased feeds in milk production in 1999.
369A MULTI-CRITERIA ANALYSIS IN SWEDISH MILK PRODUCTION

5. General conclusions
The results obtained in this paper support the conclusions that:
– Tools and approaches developed from the field of consultancy may support
transparent analyses of complicated issues such as sustainable development.
– In a scientific context, adoption of the consultancy experience to the procedure
of Integrated Assessment and Multi-criteria analysis improves the quality of the
analysis. Multi-criteria impact matrix and multi–criteria representation provide
a form to present results from analysis of complex issues that helps the commu-
nication with stakeholders.
– The classification of capital in the forms social, human, natural and human-
made helps a characterization of the issue based on multiple indicators. This
structured analysis can show how a particular trend may affect the different
objectives associated with sustainable development at different system levels and
in relation to the social, economic and ecological dimension, A procedure for
integrated assessment based on classification of capital forms, the consultancy
approach (tailoring the selection of indicators on the specific situation) and the
scientific characterization of the various trade-offs seem to be appropriate for
supporting a two-way integration of abstract models and practice.
– The results of this case study regarding the use of purchased feeds in Swedish
milk production 1989–1999, especially 1991–1999 suggest that the existing trend
has implied an increased appropriation of:
– Natural capital (in terms of land supporting a constant amount of milk produc-
tion and in terms of waste assimilative capacity);
– Human-made capital (in terms of technology needed to produce more pur-
chased feeds resulting in a constant milk production, and in terms of an in-
creased appropriation of rents from own capital in milk production due to
increased costs in production that have not resulted in increased incomes); and
Social capital due to the alternative cost of grain products and crop protein
feeds used in milk production that otherwise could have supplied human needs.
– Thus, the ecological, economic and social footprint of Swedish milk production
1991–1999 increased while the production remained constant.
– The results of this case study imply a trend towards a transformation of the tra-
ditional role of ruminants in Sweden. From transformer of energy and protein
in feeds of low or no nutritive value for humans and other mono-gastric ani-
mals into valuable products, to transformer of nutrients in feeds that already
have a high nutritive value for humans and other mono-gastric. The advantage
of this change of role is doubtful, especially when considering the integrated set
of goals associated with the concept of sustainable development. This would im-
ply the possibility that restrictions in availability of non-renewable resources as
well as renewable resources could imply the need of imposing restrictions on the
goal of optimizing the economic criteria. This possibility should be seriously
considered when acknowledging the obvious fact that land (in a broad sense) is
370 STEFAN HELLSTRAND

a form of renewable natural capital of major importance, as the surface area on
Earth, where most ecological and economic processes occur, is fixed.
– The trends considered in this case study in relation to the use of purchased feeds
to cattle in Sweden 1991-1999 are in conflict with a number of important sub-
objectives associated with the concept of sustainable development. This implies
that action should be taken to adjust them.
Acknowledgement
Valuable comments and support have been received from Jan Bertilsson, Erling
Burstedt and Sten Ebbersten. Remaining mistakes are my own. The work was
financially supported by Ekhagastiftelsen.
Notes
1 Regarding grain, see e.g. mean barley yields 2000–2004 for Africa, France and Sweden, http://
apps.fao.org/faostat/servlet/XteServlet3?Areas=359&Areas=361 &Areas=210Items&=44&Elements=
41&Years=2004&year=2003&Years=2002 &years=2001&years=2000&Format=Table&Xaxis=Years
&Yaxis=Countries& Aggregate=&Calculate=mean&Domain=SUA&ItemsTypes=Production.Crops.
Primary&language=EN, last accessed March 2005. There is a lack of international statistics regard-
ing ley yields. In the northern agricultural production areas in Sweden (latitude 66�) the annual yield
per ha of spring barley and ley is 2800 kg and 6200 kg dry matter (DM), respectively, In the south-
ern production area (latitude 56�), the corresponding values are 5900 kg and 8200 kg DM, respec-
tively (Swedish University of Agricultural Sciences, 1995a, 1995b).2 http://www.livsmedelssverige.org/halsa/all-lakto.htm, last accessed April 2005 (in Swedish). The
Swedish National Food Administration provides the information at this link: In Sweden 2–3% of the
adult population suffers from lactose intolerance, while the figure for our neighbouring country Finland
is 15–20%, in the Mediterranean countries is ca. 50% and in areas in Asia up to 100%.3 See e.g. the nutritive contents for the same feeds when fed cows and pigs, respectively, in Eriksson
et al. (1976); during :1976–1989 this was the official Swedish feeding table.4 Presentation of the EME-Cmodel; http://www.konj.se/4.2f48d2f18732142c7fff 5393.html.5 See www.scb.se.6 See http://www.scb.se/statistik/nr0102bnp1950dial.asp.7 See attp.//www.scb.se/statistik/pr0101/pr0101dia7.asp.
References
Danell, S.: 2001, ‘‘Vaxtnaring’’, in Miljoredovisning for svenskt jordbruk 2000, Stockholm, SCB och LRF.
De Boer, I.J.M.: 2003, �Environmental impact assessment of conventional and organic milk production�,Livestock Production Science 80, 69–77.
Drake, L. and Hellstrand, S.: 1998, The Economics of the Swedish Policy to Reduce Cadmium in Fertilisers,
Kemikalieinspektionen PM no 2, Solna.
Eriksson, S., Sanne, S. and Thomke, S.: 1976, Fodermedelstabeller och utfodringsrekommendationer till
idisslare, Stockholm, hastar och svin.
Giampietro, M.: 2003, Multi-Scale Integrated Analysis of Agro-Ecosystems, Boca Raton, CRC Press, pp.
437.
371A MULTI-CRITERIA ANALYSIS IN SWEDISH MILK PRODUCTION

Hall, C.A.S., Cleveland, C.J. and Kaufmann, R.: 1986, Energy and Resource Quality: the Ecology of the
Economic Process, New York, John Wiley & Sons, Inc.
Hellstrand, S.: 1988, Kan ekonomin i mjolkproduktionen forbattras - en modell for biologiskekonomisk
analys av mjolkproduktionen och dens resultat for 15 gardar i Varmland, Rapport 175, inst. for husdjurens
utfodring och vard, SLU, Uppsala.
Hellstrand, S.: 1989, Bakgrund och kommentarer till 1989 ars fodermedelstabeller och naringsrekommen-
dationer for idisslare, Rapport 191, inst. for husdjurens utfodring och vard, SLU, Uppsala.
Hellstrand, S.: 1996, The Environmental Impact of Milk Production-From the Field to the Entrance to the
Dairy, Technical Report no. 22 1996, Department of Systems Ecology, Stockholm University,
Stocholm.
Hellstrand, S.: 1997, Reduction of the Discharges on the Local Level not Always Sustainable: — A
Swedish Example, In Proceedings of Pulp & Paper Conference, March 9–13, 1997, Orlando, Florida.
Hellstrand, S.: 1998, Marken:–Den livsviktiga resursen, en forstudie. Del 1. Analys, Svenska Lantmner och
Lantbrukarnas Riksforbund, Stockholm, Lantbrukarnas Riksforbund.
Hellstrand, S.: 2002, Ecological and Economic Effects of Increasing Concentrate Intensity in Swedish Milk
Production 1989–1999, AF-MFG report F002/21, Fryksta.
Hellstrand, S. and Landner L.: 1998, Cadmium in Fertilizers, Soil, Crops, and Foods – the Swedish
Situation. In Cadmium exposure in the Swedish Environment, KEMI report no. 1/1998, Solna.
Hellstrand, S. and Landner L.: 2001, ‘Role of phosphorus in sustainable agriculture and the cadmium
issue’, in J.K. Syers and M. Gochfeld (eds.), Proceedings of the SCOPE-workshop, Belgian Academy
of Sciences, Brussels, Belgium, 13–16 September 2000, financially supported by the Royal Academy of
Sciences of Belgium, the Institute Mondial du Phosphate (IMPHOS), and the U.S. National Institute of
Environmental Health Sciences.
IEA: 1999, Energy Balances of OECD Countries 1965–1997, International Energy Agency, OECD.
Landner, L., Walterson, W. and Hellstrand, S.: 2000, Copper in Sewage Sludge and Soil, A Literature
Review and Critical Discussion of Disposal of Copper-containing Sludges to Agricultural Land, New York,
International Copper Association Ltd.
OECD: 2001, Policies to Enhance Sustainable Development, Meeting of the OECD Council at Ministerial
level, 2001.
Pareto, V.: 1896, Cours d’economique politique, Rouge, Lausanne.
Pimentel, D.: 2004. ‘Livestock Production and Energy Use’, in C.J. Cleveland, (ed.) Encyclopedia of
Energy, Elsevier Academic Press Volume 3: 671–676.
Regeringen: 2001, Nationell strategi for hallbar utveckling, Regeringens skrivelse till riksdagen 2001/02:172,
Stockholm.
SHS: 1991, Mjolkproduktionens lonsamhet 1989/90. 1. Lonsamhetsutveckling 1960–1990. 2. Resultat fran
RAM kontrollaret 1989/90, Meddelande nr 169, Eskilstuna, Svensk Husdjursskotsel.
SHS: 1992, RAM-resultat 1990–91, Bilaga 1, Eskilstuna (http://www.svenskmjolk.se).
Sporndly, R.: 1989, Fodertabeller for idisslare 1989, Speciella skrifter 39, Uppsala, Sveriges lantbruks-
universitet.
Sporndly, R.: 1991, Fodertabeller for idisslare 1991, Speciella skrifter 44, Uppsala, Sveriges lantbruks-
universitet.
Sporndly, R.: 1995, Fodertabeller for idisslare 1995, Rapport 235, inst. for husdjurens utfodring och vard,
Sveriges lantbruksuniversitet, Uppsala.
Statistics Sweden: 1997, Yearbook of Agricultural Statistics 1997, Stockholm.
Statistics Sweden: 2000, Yearbook of Agricultural Statistics 2000, Stockholm.
Statistics Sweden: 2001, Utslapp till luft av ammoniak i Sverige 1999, Statistiska meddelanden MI 37 SM
0001, Orebro.
Statistics Sweden: 2002a, EAA — Economic Accounts for Agriculture, Statistiska meddelanden JO 45 SM
0202, SCB (ln Swedish).
Statistics Sweden: 2002b, Nitrogen and phosphorus balances in arable land and agricultural sector in Sweden
1999. Statistiska meddelanden. MI 40 SM 0101, SCB (in Swedish).
Swedish Board of Agriculture: 1992, Foderstatistik 1991, Jonkoping.
Swedish Board of Agriculture: 1995, Foderstatistik 1994, Jonkoping.
Swedish Board of Agriculture: 1997, Foderstatistik 1996, Jonkoping.
Swedish Board of Agriculture: 2001, Feed control by the Swedish Board of Agriculture. Controls 1996–1999,
Manufacture, import and supervision 1999, Rapport 2001:6, Jordbruksverket, Jonkoping.
372 STEFAN HELLSTRAND

Swedish Dairy Association: 2001, Cattle Statistics 2001, Hallsta.
Swedish Energy Agency: 2001, Energy in Sweden. Facts and Figures 2001, Eskilstuna.
Swedish University of Agricultural Sciences: 1995a, Production branch calculus Northern Sweden, Report
195, Research Information Centre, Uppsala (in Swedish).
Swedish University of Agricultura1 Sciences: 1995b, Production branch calculus Plain Districts Southern
Sweden, Report 188, Research Information Centre, Uppsala (in. Swedish).
WHO: 1985, Energy and Protein Requirements, Report of a joint FAO/WHO/UNU Expert Consultation.
World Health Organization, Technical Report Series 724, Geneva.
373A MULTI-CRITERIA ANALYSIS IN SWEDISH MILK PRODUCTION


Paper IV


1
An animal production simulation model and its results in production biological and economic terms when applied on an ecological and a
conventional system by
Stefan Hellstrand* * School of Sustainable Development of Society and Technology, Mälardalen University;
correspondence address Tolita 8, SE- 665 92 Kil, Sweden, tel: +46 554 21159, e-mail: [email protected]
Abstract A simulation model for evaluation of production biological and economic performance of different management strategies in animal production is generated by integrating knowledge and tools in animal production biology and agricultural economics developed and extensively applied during the 20th century in Sweden. The model is a contribution within agroecology and integrative assessment. With modifications to national characteristics the simulation models has general international applicability. The model is used to estimate inputs needed (all variable costs) for one ecological and one conventional system in physical and monetary terms producing the amount of milk and meat from cattle and pigs consumed in Sweden. The model supports choices among alternatives with regard to their capacity to fulfil objectives of farmers and society. It is one link in a chain of tools supporting the identification of (i) the role of animal production in sustainable development and (ii) obstacles for the development of this role. Key words: Animal production, production biology, production economics, simulation model, sustainable agriculture, agroecology.
1 Introduction In this paper a simulation model of animal production is developed and its results presented. Its focus is traditional production biological and economic effects studied by methods that have been developed and successfully applied within agriculture, especially animal production and agricultural economic sciences and practice, during many decades in Sweden. Early roots to the simulation model within agricultural economics are the contributions by Nanneson et al. (1945), Renborg (1957), and Johnsson et al. (1959). The basic frame of their work is in later time expressed in the production branch calculus and systems for optimising the production on farm level based on these calculus from the Swedish University of Agricultural Sciences (for version 1989 see SLUa,b; for current version see www.agriwise.org). Important roots in animal science are Nanneson et al. (1945), and Wiktorsson (1971, 1979). Methods and results provided by these sources were the core in the huge transformation of the Swedish agricultural, animal production, and dairy production sectors after the Second World War, given the overall objective of economic growth. Thus, the relevance of their concepts has been successfully and extensively empirically and scientifically tested over decades, given the societal context of the time. The paper expresses an effort to further develop and integrate the mentioned contributions within agricultural production biology and economics into a tool that is adapted to the current societal context expressed by sustainable development. The rationale is that the huge empirical application has resulted in analytical structures with the capacity to manage the complexity of farming

2
systems. These methods now need to be updated to the societal context given by a need for sustainable development. The updating process contains two elements: A deepened understanding of the societies demand on agriculture in the sustainability context (Hellstrand et al. 2009a,b); and a deepened understanding of the consequences of this demand within the agricultural system (Hellstrand 2006). This paper focuses an internal agricultural perspective, increasing the capacity of agriculture to support a societal traditional growth strategy, as well as a sustainable development strategy. The arguments for such methods in perspective of a sustainable development are further presented below. Ecological and socioeconomic process constraints affect choices of farming systems (Giampietro 1997). Choices on farm level are dependent on constraints provided by the local ecosystem as well as by the socioeconomic context of the farm (ibid.). In analyses of farming systems there is a need for using biophysical and socioeconomic analyses in parallel to identify the performance of the system in relation to both ecological and socioeconomic constraints. Furthermore, agricultural systems operate on several hierarchical levels, with parallel processes definable only on different spatiotemporal scales. Agricultural effects on different spatiotemporal scales and the complexity inherited in the sustainability concept imply high probability for conflicts between objectives. Sustainability in agriculture has to do with conflict management and with providing adequate support for decision making in the context of complexity. Methods that link actions at one scale to consequences at other scales are a prerequisite for achieving this (ibid.). Animal production is an important part of the global food system. In 2007, total meat production was 43 kg per capita, meat from pigs and cattle contributed by 62%, total milk production was 102 kg per capita, of which cow milk provided 83%. The production of egg, milk and meat corresponded to 28 g protein per capita and day the same year. Of that, 88% came from milk and meat. As just shown, milk from cows and meat from pigs and cattle dominate in these fractions. The estimates are based on production levels from FAOSTAT (2009); population from GeoHive (2009); and assuming that the protein levels are as follows; in milk 3.4 % (Swedish Dairy Association 2009), meat 13% (Gunnar Malmfors 2009; personal communication) and egg 12.6% (Livsmedelsverket 2009). Animal production has vital direct and indirect economic and environmental effects (FAO 2006). Its influence on global food security is strong. Thus, the understanding of animal production is one piece of information contributing to the understanding of the social, economic and ecological aspects of a sustainable development. Many studies have been performed during the recent decade, analysing the sustainability of animal production systems in Sweden and internationally. The purposes of the paper are to
analyse the level of the production biological and economic basis in some studies of the sustainability of animal production systems in Sweden, Brazil and globally,
develop a simulation model of animal production based on pigs and cattle through an integration of knowledge and tools in animal production and agricultural economics developed and extensively applied in agricultural sciences and practice in Sweden during the 20th century, and
use the simulation model for analysis of the outcome in production biological and economic terms when producing the same amount of milk and meat from cattle and pigs that was consumed in Sweden in 1989 from one conventional and one ecological production system.

3
There are three reasons to locate the analysis to 1989. (i) The major work in constructing the model was done in spring 1991. When taking up the model in 1999 a major question was the accurateness of the model, given that the system of feeding standards in Sweden had undergone three major changes from 1991 to 1999. In order to evaluate whether this was a minor or major problem for the relevance of the model, major trends in Swedish milk production was analysed. The results were presented in Hellstrand (2006). (ii) Those trends showed a substantial decline in nitrogen efficiency in Swedish milk production from 1991 to 1999 causing major sustainability costs in economic, ecological and social dimensions from individual cow to global food supply level, i.e. during the time of three major changes of feeding standard and feed evaluation systems. Hellstrand (2008) reports the results from an investigation of the causes behind these increasing sustainability costs on the behalf of the Swedish Environmental Protection Agency. (iii) That showed that the changed system of feeding standards in combination with the way they were applied at farm level, explained substantial parts of the increasing sustainability costs of Swedish milk production during the 1990s. Substantial internal logic conflicts were detected, as well as it was found that the level of scientific probing was low. Thus, the changed energy standard in 1995 was based on a student work, while the changed protein standard the same year was based on an internal PM at a department at the Swedish University of Agricultural Sciences, which no longer can be found (ibid.). Thus, updating the simulation model to the feeding standards of current time would not improve its quality rather decrease it. The following sections present the sustainability context of animal production in Sweden and globally; results from an analysis of the gap between the knowledge level expressed in some studies of the sustainability of animal production with regard to agricultural and animal production sciences compared to established knowledge within these fields; material and method, and results for the animal production simulation model; discussion; and conclusions.
2 Sustainability significance of animal production The importance of a fair understanding of animal production systems in the context of a sustainable development is elaborated below. I. Of the total area of arable and pasture land used in Sweden in 2007, 58% produced
forages and pasture and 20% barley and oats (Statistics Sweden 2008), hence, crops including forages and pasture mainly used as feeds were produced on 78% of agricultural land. One of the major negative environmental impacts from Swedish milk production emanates from the emission of ammonia, contributing to eutrophication and acidification. Of the estimated total emissions of ammonia in Sweden in 2005, cattle production contributed 30 000 metric tonnes (Statistics Sweden 2007a), i.e., 57%. Of total incomes to the Swedish agricultural sector in 2006 from agricultural products, milk provided 27%, meat from pigs 10% and meat from cattle 11% (Statistics Sweden 2008). Hence, cattle and pigs in Sweden in 2006 provided 48% of total incomes from agricultural products in Swedish agriculture.
II. From I follows that animal production provides a substantial part of the total demand on crop production, which affects the economic and environmental profile of crop production.
III. Hellstrand (2006, 2008) analysed temporal trends in Swedish cattle production 1989-1999. From 1991 to 1999 he found a substantial increase in the use of purchased feeds to cattle where the increase in use of crop protein feeds dominated. That had major negative impacts on sustainability objectives in the social, economic and ecological dimensions, such as global food supply, farmer incomes and emissions of ammonia

4
(Hellstrand 2006 provide the estimates). Regarding nitrogen leaching the results in Hellstrand (2008) imply increased nitrogen leaching from agricultural soils by around 8 million kg, after considering the retention of around 6 million kg which will add to the eutrophication of the seas. This is 14% of total annual discharges from agricultural land. The estimated increased in pressure on tropical forests was 160 000 ha (ibid.). Following the route of calculations in FAO (2006) this on the margin results in an increase in contribution to climate change by 112 million ton carbon dioxide, which are twice the Swedish annual emissions (see SEPA 2009). The welfare costs of this contribution to climate change is 168 billion SEK (Swedish Crowns, around 17 million €), if applying the price on carbon dioxide emissions used by Swedish authorities when estimating external costs of emissions (SIKA 2002). No economic reasons for these trends could be found (Hellstrand, 2006). They were to a major part explained by changed feeding standards and the way they were applied (Hellstrand, 2008). A concern is that a common new feeding standard system, the NorFor-system, is now being launched in the Nordic Countries except Finland, where available data suggest that the feeding efficiency may decrease, that way increasing the sustainability costs from farm economic to global food security level presented above (ibid.). Different findings suggest that the situation and trends in Sweden are not unique, rather they reflect a common international situation (ibid.).
IV. A special aspect achieving wide attention is the methane-emissions of ruminants. FAO (2006) estimated that livestock are responsible for 18 percent of total greenhouse gas emissions, a bigger share than that of transports. One significant contribution is through the methane emissions from ruminants. Although important, that is not the major concern for FAO. Due to trends regarding feeding, production, level of industrialised rearing systems, FAO expressed a deeper concern regarding global pig and poultry production. About one third of the estimated total climate change impact of animal production is related to deforestation linked to increased production of feeds like soya. FAO concluded that pig and poultry production are more important driving forces.
Aspects I – IV express a demand on a tool that from a solid base in agricultural sciences, support analysis of measures increasing the contribution to a sustainable development from animal production.
3 Studies of sustainability in animal production Here, the knowledge gaps between common knowledge in agriculture regarding production biology and economy in milk production and the way it is presented in studies that have their methodological foundations mainly within the engineering sciences are evaluated.
3.1 The FPD-ALBIO-model
The purpose of the Food Phytomass Demand-model (the FPD-model) (Wirsenius 2000; 2003a,b), later called the ALBIO-model, is to identify where in the global food supply system efficiency-gains can be made. A (i) crucial element is the conversion efficiency measure introduced, which measures the gross energy (GE) in food consumed through GE in the plant biomass appropriated. It is assumed that high such efficiency-ratios denote efficient food production pathways, while low such ratios show the opposite. Another crucial element (ii) is that the topsoil layer in agricultural land is located outside the system borders. (i) and (ii) decreases the relevance of the developed measures:
5
GE is not a relevant dimension of the numerator in an efficiency-ratio between fulfilment of human nutrition-physiological requirements through appropriation of the renewable natural capital agricultural land (see, e.g., WHO 1985). The nutritive value of poisonous mushrooms, wheat, or oil is not expressed by their GE-content; therefore this is not a suitable dimension of the numerator in a conversion efficiency measure of food system.
GE is not a relevant dimension of the denominator in such an efficiency-ratio, as different types of agricultural land and crops can produce quite similar amounts of gross energy in phytomass, while their nutritive value may differ widely between crops, and between different paths through, e.g., animals, in the transformation to high quality human food (Hellstrand et al. 2009a; McDonald et al. 1981; NRC 2001; WHO 1985).
Around 50% of the biomass appropriated in the production of food is recycled to the fields in the form of manure and crop residues (Wirsenius, 2000). This enhances the productivity of the topsoil layer through positive effects on organic content and nutritive status. The condition of the topsoil layer in global crop and pasture land is crucial for global food security. As the top soil layer is not included in the FPD-ALBIO-model, the significance of these refluxes for long term soil fertility and food security cannot be detected. Therefore, provided estimates of inefficiencies in the global food supply system due to these refluxes (ibid.) is substantially biased due to the set assumptions.
In conclusion, the FPD-model is abstracted far away from human nutritional and agroecological context. The relevance for the development of agricultural systems that fulfils the objectives of a sustainable society as expressed by, e.g., UN Millennium Development Goals (UN 2008), the Millennium Ecosystem Assessment (2005), and OECD (2001) is limited.
3.2 Life-cycle assessment
FOOD 21 was a major research program in Sweden regarding sustainable food production in 1997-2008 (FOOD 21 2009). LCA was a major tool in their analysis of environmental sustainability (see, e.g, Cederberg and Flysjö 2004; Gunnarsson et al. 2005). The way FOOD 21 treated the production biological and economic aspects in their analysis of milk production, reflects to a substantial part how the research program treated these aspects in relation to the total Swedish agricultural sector. A synthesis report (Gunnarsson et al. 2005) presented the sustainability profile of two future scenarios for milk production, obtained by the application of LCA. One is similar to current conventional production system, and the other to ecological milk production, called conventional and ecological in the following. A detailed analysis of assumed production levels and feed consumption levels shows disturbing facts. The conventional cows are fed energy approx. 10% below the official feeding requirements while the ecological ones are fed 35% above. The amount of feeds used per kg milk is 48% higher in the ecological system. As the environmental impact and the economic result is a function of the feeding efficiency, this severely distorts the environmental and economic analyses. Cederberg provided two studies of the environmental performance of milk production. One was a contribution within FOOD 21 (Cederberg and Flysjö 2004). In this study 23 farms in

6
the south-western parts of Sweden were investigated, of which 6 had ecological production. Cederberg et al. (2007) followed the same analytical approach in a study of milk production in the northern parts of Sweden. Here 23 farms were studied, of which 7 had ecological production. The consumption of feeds produced on the farm (forages, pasture and grain) was estimated by the amount of diesel consumed as noted in the accounts of the farms. Typically 50-75% of the feeds are produced on the own farm. This measurement point is too distant from the parameter in the real system estimated, the consumption of feeds produced on the farm considering their nutritional content, to be relevant. For example, due to taxation rules, diesel that is declared to be used in agriculture, can in reality be used for the cars of the farm family, if so, this would increase the estimate of the consumption of feeds. Data regarding purchased feeds were based on the accounts of the farm. Thus data regarding the animal production system were obtained by indirect measurements, and not on data on the animal production system, which quite easily could have been obtained through the management tools in milk production most farmers uses. In both studies the influxes of nitrogen through purchased feeds were substantially lower on the ecological farms than on the conventional ones. This gives lower nitrogen content in manure. Lower values give lower emissions of ammonia, contributing to acidification and eutrophication; N2O, a powerful climate change gas; and nitrate leaching, contributing to the eutrophication of seas. These impacts are significant. This information was not used: Cederberg and Flysjö (2004) and Cederberg et al. (2007) estimated the nitrogen content in manure for both conventional and ecological systems through the STANK-program from the Swedish Board of Agriculture. That program provides estimates of nitrogen in manure from dairy cows, based on standardised feeding rations for conventional cows from1996, assuming a significantly higher protein feeding than the official standards. Thus, the emissions of ammonia and of N2O from ecological farms in these studies from 2004 and 2007 are based on feeding rations for conventional farms produced about ten years earlier, with a substantial over-feeding of protein (Hellstrand 2008). As ecological farms uses much less protein feeds, this results in substantially too high estimates of their contribution to climate change, acidification, and eutrophication. Not surprisingly both studies found no differences in contribution to climate change and acidification between ecological and conventional farms, and higher contribution to eutrophication at the ecological farms, where this reflects the anomaly introduced by the chosen method as discussed. In conclusion, in the analysed applications of LCA the analyses have been abstracted so far away from the animal production system that the relevance for a sustainable development is restricted. The way the animal production system has been treated in production biological terms compared to common knowledge within animal production shows such gaps, that the relevance of these studies for the development of agricultural systems that fulfils the objectives of a sustainable society as expressed by UN Millennium Development Goals (UN 2008), the Millennium Ecosystem Assessment (2005), and OECD (2001) is limited.
3.3 Potential to integrate milk and sugarcane production in Brazil
Sparovek et al. (2007) analysed the possibility to expand sugarcane ethanol production in Brazil through a model in which sugarcane and milk production was integrated. The objective was to see if that simultaneously could provide local socio-economic and global environmental advantages, where the environmental aspect focused was climate change. They concluded that the expansion model was feasible at current market conditions and should have good prospects for complying with sustainability criteria within various

7
certification schemes presently under development. A case study in Pontal do Paranapanema region (state of São Paulo, Brazil) illustrated the model in agrarian reform settlements (ibid.). Egeskog and Gustafsson (2007) provide extensive information about the case-study. The information (ibid.) is that
Positive socio-economic effects are achieved assuming that o the ethanol plant produces a full ration feed from by-products from the ethanol
production, and sell it to the farmers that combine sugarcane and milk production for half the market value the coming 25 years,
o the farmers increases the milk production with a factor 7 up to 105 cubic meter of milk per year to be milked by hand, with no payment for the extra work, and
positive climate change effects will occur assuming that o an increase in feed consumption by a factor 3 for an increase in milk
production by a factor 7 does not affect land use, o the increase in methane emissions by a factor 3 due to the increase in feed
consumption for 7 times more milk produced results in a decreased climate change effect (sic!).
The analyses has been abstracted so far away from the animal production system studied, that the relevance of its results for the development of agricultural systems that fulfils the objectives of a sustainable society as expressed by UN Millennium Development Goals (UN 2008), the Millennium Ecosystem Assessment (2005), and OECD (2001) is limited.
4 Material and method
4.1 The simulation model
The core of the simulation model is the dairy cow subsystem. Thus, the following presentation is focused on this subsystem. The simulation model is the product of an integration of agricultural economics regarding production branch calculus and the system to integrate
such calculus in the analysis of the performance on the individual farm from the Swedish University of Agricultural Sciences (SLU 1989a,b; 2009) and
animal nutrition theory and practise (Hellstrand 1988, 1989; Spörndly 1989; Wiktorsson 1971, 1979).
Production branch calculus are tabulated point estimates of production functions. Simulation of effects in production biological and economic terms of, e.g., feeding rations, is not possible. Hence, for some production branches in the simulation model, sub-models called feeding-plans are constructed. They express the production functions that produced the production branch calculus. In the feeding plans the amount of feeds needed and the biological production achieved are estimated as a function of nutritive values of feeds and of feeding rations, as well as of animal dependent factors such as breed, size, sex and lactation phase. Via the feeding plans the impact on dependent production biological and economic parameters of changes in independent production biological variables is simulated.

8
The simulation model is applied on one conventional and one ecological animal production system producing the same amount of meat and milk from cattle and pigs as was consumed in Sweden in 1989. The conventional and the ecological production system are both products of the structure of the simulation model, in interaction with the guiding principle in the production strategy chosen in each system. In both systems, the first choice is to produce the assumed amount of meat and milk. In the conventional system, the second choice is to maximise profit given market-based prices of capital and labour. In the ecological system, the second priority is to produce the assumed amount of meat and milk (almost) exclusively using forages as feed. In both systems, an equal and high technological level is applied. Table 1 presents the production branches in the two systems and the production branches for which feed-plans have been developed. If nothing else is noted, values of production biological and economic parameters are the ones as in SLU (1989a).

9
Table 1. Production branches in one conventional and one ecological animal production system; the products of the production branches; and the production branches with feeding plans embedded
Products out from the farm Production branch
Milk production
Meat
production
Products used on the farm:
Feeding plan included
Ecological Dairy cows1 XX X Calves: heifers
and steers X
Dairy breed heifers
X Cows X
Dairy breed steers
XX X
Remaining meat need
Beef breed cows2
X Calves: heifers and steers
Beef breed heifers
X Cows X
Beef breed steers
XX X
Conventional Dairy cows1 XX X Calves: heifers
and steers X
Dairy breed heifers
X Cows X
Dairy breed steers
XX
Remaining meat need
Sows X Piglets: fattening pigs
and recruitment gilts
Fattening pigs XX Recruitment gilts
X Sows
Sires 1Swedish Read and White, 2Charolais In the production branches with feeding plans, the amount of feedstuffs and the production (milk or meat) are calculated as a function of the nutritive value of the feeds used, and of appropriate animal factors such as sex, breed, size and lactation phase. The other inputs are from the Swedish University of Agricultural Sciences (SLU, 1989a). For the others, no modifications were made to the production

10
branch calculus from Swedish University of Agricultural Sciences (ibid.). XX denotes main product, X co-product.
5 Results
5.1 The structure of the simulation model
Fixed amounts of meat and milk are produced. The average milk yield per cow is estimated as a function of the nutritive values of feeds and feeding strategy chosen. From this yield, the number of cows needed to produce the required amount of milk is calculated. The recruitment-rate in milk production determines the number of recruitment heifers to produce. A co-product from the cows are calves, another is meat from slaughtered cows. Female calves not needed for recruitment and steer calves are used for meat production. This route of calculation estimates the number of the different animals in each production branch within the dairy cow subsystem. From the average carcass weight at slaughter and the number of animals slaughtered, the amount of meat from heifers, steers from the dairy cow stock and slaughtered cows is estimated. This is the meat-production which directly or indirectly emanates from the dairy cow herd. By multiplying the number of animals by the inputs needed per animal, the inputs behind the meat and milk production in the dairy cow subsystem are obtained. This is the structure of the dairy cow subsystem in both the ecological and the conventional system. In the conventional system, the remaining demand for meat is supplied via pigs. Here, sows produce piglets, which are used either in the production of fattening pigs or recruitment gilts. The numbers of sires and fattening pigs are a function of the number of sows, as is the number of recruitment gilts. Thus, the amount of meat, which is produced directly and indirectly per sow and year, can be estimated via information of the number of animals in each category per sow and the meat production per animal and year within each category. By this path, the amount of meat produced from fattening pigs, sows, gilts and sires expressed in kg per sow and year is estimated. The value obtained is used to estimate the number of sows needed to fill up the remaining meat demand in the model. With the number of sows fixed, the number of sires, gilts and fattening pigs, respectively, is determined. By multiplying the number of each type of animal by the inputs needed per animal in the production branch calculus, the inputs supporting the pig production system are obtained. This is the meat-supplementing subsystem. In the ecological system, Charolais cows are used instead of pigs in the meat-supplementing subsystem, assuming that this will maximise the use of forages in the production system, thus, maximising the use of feeds from crops that, given Swedish conditions, has high production levels without inputs of pesticides and mineral fertilisers. Here artificial insemination is used, thus no bull production branch calculus is included. The number of Charolais animals in each production branch is estimated in the same way as the number of pigs in the pig subsystem. Here the production branches are cows, steers and heifers. The Charolais heifers are either used for recruitment or for meat production. These are “brought up” in the same way, thus one production branch calculus is used, as delivers the products recruitment heifers and meat. The same is the case for the dairy heifer in the ecological system and the recruitment gilt in the conventional system.

11
5.2 In- and outputs
Tables 2-5 summarise the results of the simulation model when applied to the conventional and the ecological production systems. Table 2 shows some production biological characteristics of the two systems. Table 3 presents the number of animals, production per animal and price of animal products in the ecological and the conventional animal system. Table 4 provides the amounts of different feeds used in the two production systems. Table 5 presents inputs in the two systems in monetary terms and outputs in physical and monetary terms. Table 2. Some production biological characteristics in the different animal production
branches in an ecological and a conventional farming system
MJ/kg DM1
Decrease kg FCM2/
month
Growth kg/day
MJ/kg growth of
carcass weight
Repr. no of offspring/ dam and
year
Births per year and
dam
Kg feeds per kg live-
weight growth
Ecological Dairy cow 10.83 0.374 Dairy heifer 10.3 0.79 179 Dairy steer 10.9 1.13 133 Beef breed
cow 10.0 0.95
Beef breed heifer
10.0 0.65 229
Beef breed steer
11.0 1.285 134
Conventional Dairy cow 12.15 2.2 Dairy heifer 10.3 0.79 179 Dairy steer 0.91 88 Sow 21 Gilt Sire Fattening pigs 2.8 2.8 1MJ = MegaJoule metabolisable energy, DM = Dry matter. 2FCM = Fat corrected milk. 3At peak lactation, first three months after calving. 4After peak lactation, i.e. after the three first months after calving. During peak lactation, no decrease in daily milk yield is assumed to occur. 5After weaning at approx. 6 months.
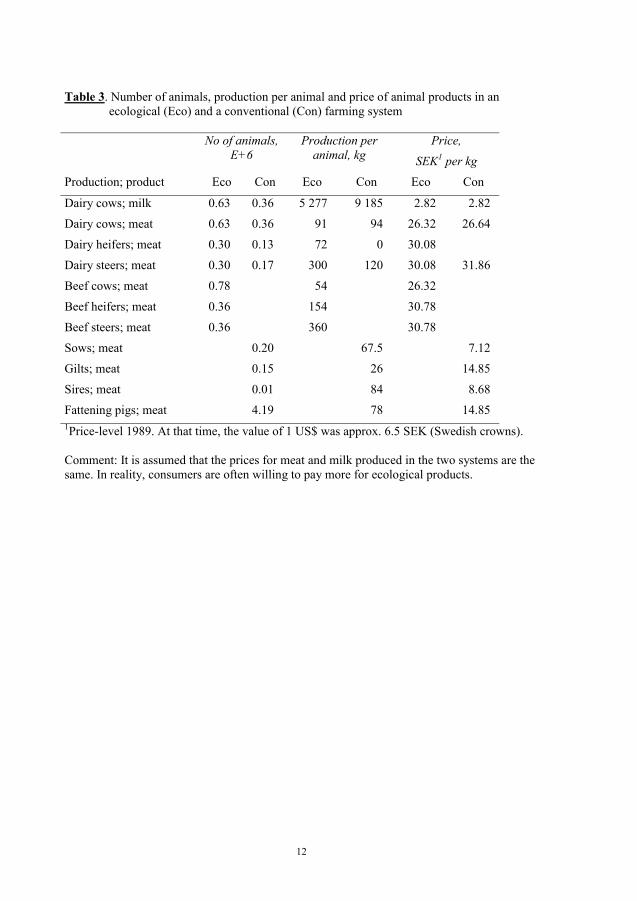
12
Table 3. Number of animals, production per animal and price of animal products in an ecological (Eco) and a conventional (Con) farming system
No of animals,
E+6 Production per
animal, kg Price,
SEK1 per kg
Production; product Eco Con Eco Con Eco Con
Dairy cows; milk 0.63 0.36 5 277 9 185 2.82 2.82
Dairy cows; meat 0.63 0.36 91 94 26.32 26.64
Dairy heifers; meat 0.30 0.13 72 0 30.08
Dairy steers; meat 0.30 0.17 300 120 30.08 31.86
Beef cows; meat 0.78 54 26.32
Beef heifers; meat 0.36 154 30.78
Beef steers; meat 0.36 360 30.78
Sows; meat 0.20 67.5 7.12
Gilts; meat 0.15 26 14.85
Sires; meat 0.01 84 8.68
Fattening pigs; meat 4.19 78 14.85 1Price-level 1989. At that time, the value of 1 US$ was approx. 6.5 SEK (Swedish crowns). Comment: It is assumed that the prices for meat and milk produced in the two systems are the same. In reality, consumers are often willing to pay more for ecological products.

13
Table 4. Feeds used in the animal production in one ecological and one conventional farming system in dry matter
Ecological Conventional E-K
Type of feeds E+6 kg % E+6 kg % E+6 kg
Forage 9 739 86.6 1734 40.1 8 005
Straw1 1 344 12.0 277 6.4 1 067
Grain 35 0.3 1646 38.0 -1 611
Purchased feeds2
125 1.1 672 15.5 -547
Total 11 243 100.0 4329 100.0 1Including straw for bedding. 2Mineral feeds and some concentrates (mix of protein feeds, mineral feeds, fat and by-products from sugar industry).

14
Table 5. Inputs and outputs in animal production in one ecological (Eco) and one conventional (Con) farming system in kg (E+6) and in SEK (E+6)1 and the difference in economic performance between the systems
Kg SEK
Eco Con Eco Con Eco - Con
Outputs Milk 3 314 3 314 9 346 9 346 0
Meat from cattle 400 55 11 818 1 577 10 241
Meat from pigs 0 345 0 5 164 -5 164
Sum outputs 21 163 16 086 5 077 Inputs
Recruitment 53 211 -158
Delivering fee 0 0 0
Breed-premium 0 0 0
Feed preparation 1 14 -13
Purchased feeds 579 2 366 -1 787
Farm produced feeds 9 251 4 364 4 887
Health/production control 131 122 9
Artificial insemination 528 209 319
Electricity/oil 0 147 -147
Risk/ insurance 29 36 -8
Death 87 84 2
Diverse inputs 792 383 409
Interest; animal capital 1 060 305 755
Interest; circulating capital 599 171 428
Buildings, maintenance 1 791 1 194 598
Buildings; depreciation and interest on building capital
7 787 5 041 2 746
Labour 6 635 3 220 3 415
Sum inputs 29 322 17 867 11 455 Contribution to common costs on firm-level
-8 159 -1 781 -6 378
1Price-level 1989. At that time, the value of 1 US$ was approx. 6.5 SEK (Swedish Crowns).

15
6 Discussion
6.1 Production biological and economic results
The net contribution from milk production to the economic result on farm level was in the conventional system 377 SEK per cow and year, and in the ecological system –5 727 SEK. Here, costs for labour and buildings are considered. The same milk price is assumed. The average production was 9 185 and 5 277 kg FCM, respectively (Table 3). In 2006, 0.50 SEK was paid extra per kg ecological milk, and 1 600 SEK was paid extra per ecological cow (SLU 2006). Considering this premium for ecological production, the net contribution on farm level from the ecological cow is – 1 488 SEK. In SLU (1989a), the highest production level was 7 100 kg FCM/cow, resulting in a net contribution on farm level of – 3 151 SEK/cow and year, after correction to the same forage-price as in the simulation model. Thus, the economic result in the simulation model was 3 528 SEK higher per cow than the best alternative in SLU (ibid.). The results imply that the manager in the conventional system was quite successful. Her/his first priority was to produce milk, the second to maximise the profit. The answer whether the ecological manager has been successful in relation to her/his objectives cannot yet be delivered. In terms of the fraction of forages in the feeding rations she/he has been successful, the feeding rations consisted of close to 100% forages (Table 4). Whether this contributed to a production system that more efficiently delivers the goods and services demanded in a sustainable development, cannot be answered before an extended analysis has been applied. The results delivered are needed inputs in such an analysis.
6.2 Contributions towards operationalising a sustainable agriculture
The simulation model quantifies inputs and outputs needed to produce a fixed amount of meat and milk from cattle and pigs in production biological and monetary terms. It can follow causal chains from low physiological levels to impacts on national level in terms of the demand on crop products from animal production, and the economic result in animal production. It also provides the opportunity to analyse economic impacts on single farm-levels of choices on the national scale, affecting prices on products or subsidies to different production branches. Thus, it supports analysis of possible adoption strategies on the micro-level of measures taken on the macro-level. The analysis of alternative studies of sustainability in animal production systems in Sweden, Brazil, and on global scale, clearly shows that their relevance were severely distorted due to too low quality in their design of the animal production systems. Their results are to substantial degree artefacts, due to the gap between the knowledge level regarding animal production they expressed, and common knowledge within the field. Since 1996 a model called Totfor has dominated the construction of the production biological basis in national analyses of the ecological and economic performance of milk production in Sweden. It provided the basis for
a major study of the sustainability in Swedish agriculture performed by the Swedish Environmental Protection Agency (Naturvårdsverket 1997),
the dairy cow subsystem in the STANK program (Janne Linder, personal communication, January 2007), a program with the ambition to support measures

16
decreasing nutrient leaching from individual farms provided by The Swedish Board of Agriculture, and for
a study regarding the possibilities to increase the amounts of feeds to Swedish milk sector produced in Sweden and/or in Europe performed by the Swedish Dairy Association (Emanuelson et al. 2006).
Totfor through the STANK-program has a substantial impact on official statistics regarding national nitrogen balances and ammonia emissions (Statistics Sweden 2007b, 2009), as well as on measures taken on individual farm level to increase nitrogen efficiency in the program Focus on Nutrients (Swedish Board of Agricultural 2009). Focus on Nutrients is the largest single undertaking in Sweden to reduce losses of nutrients to air and water from livestock and crop production (ibid.). Therefore, Totfor has a substantial influence on measures to increase the sustainability of Swedish agriculture, as expressed by the system of national environmental quality objectives regarding acidification and eutrophication. It is important that it provides relevant results. Figure 1-4 are based on the results that Totfor provided in the most recent of the applications mentioned. Figure 1 shows a substantial difference in milk production during lactation months 1-4 between the two alternatives “Europe” and Sweden”, which is totally eliminated in lactation months 5-10. That is not in agreement with common knowledge within dairy production science and practice. Higher production levels during early lactation result in higher production during the rest of the lactation.
Figure 1. Lactation curves lactation months 1-10 produced by Totfor in two alternatives in
Emanuelson et al. (2006). Figure 2 shows the difference between alternatives “Europe” and “Sweden” in total consumption per cow and day; production of milk (ECM) per cow and day; and energy
0
5
10
15
20
25
30
35
40
45
50
0 2 4 6 8 10 12
ECM EuropeECM Sweden

17
concentration of the daily feeding rations during lactation. Here, a higher milk production for “Europe” during lactation months 1-4 is accompanied by a higher energy concentration of the feeding ratio and higher feed intake. In lactation months 5-10 higher energy concentration for “Europe” results in lower feed intake, where the combined effect is identical milk production. For the total lactation, alternative “Europe” is assumed to produce 641 kg ECM more, with 7 kg milk per day more as most. This implies that 1 kg milk more per day during top lactation in total provide around 90 kg milk more during the whole lactation. A rule of thumbs in extension services says that one kg milk more in top yield per day results in around 200 kg more in total production during lactation. Burstedt (2001, pers. communication) investigated the impact on peak lactation and total production of different levels of energy supply in MJ metabolizable energy (ME)/kg FCM during lactation weeks 4-12. In lactation weeks 13-40 they were fed 5 MJ ME/kg FCM. He found a response of around 260 kg ECM more for the whole period of one kg more in top production per day, where 77% of the variation in total production was explained by peak yield. The lactation curves produced by Totfor (Figure 1 and 2) disagree with these findings.
Figure 2. The difference in lactation months 1-10 between alternative “Europe” and
“Sweden” in total consumption per cow and day, production of milk (ECM) per cow and day, and energy concentration of the daily feeding rations as estimated by Totfor in Emanuelson et al. (2006).
The results in Figure 2 regarding impact on milk yield conflict the ones of Bertilsson (2005). In a feeding trial comparing feeding rations based entirely on Swedish feedstuffs and a traditional one including soya meal, average milk yield were 34.6 kg ECM in both groups. Thus, no difference in production was shown. Figure 3 shows the difference in milk yield; total consumption; energy concentration of the feeding rations; and consumption related to live-weight for two other alternatives produced by Totfor in the same study (Emanuelson et al. 2006). When comparing Figure 3 with Figure 2,
Alternative Europe minus Sweden
-1
0
1
2
3
4
5
6
7
8
Lactation month
Consumption, kg dry matter per cow andday
1,9 2,9 2 1,1 0 -0,4 -0,4 -0,3 -0,4 -0,2
Production, kg ECM per cow and day 5,5 7 5,5 3 0 0 0 0 0 0
Energy concentration, MJ/kg dry matter 0,3 0,4 0,3 0,3 0,2 0,2 0,2 0,1 0,1 0
1 2 3 4 5 6 7 8 9 10

18
something interesting emerges. Figure 2 shows a positive relation between energy concentration, feed intake and milk production during lactation month 1-4. For the alternatives compared in Figure 3, differences in feed intake and in energy concentration result in identical milk production. Instead a negative relation between energy concentration and feed intake is expressed. The reason why Totfor in the same study in some comparisons shows that a higher energy concentration result in a higher feed intake and milk production, while for others it results in a lower fed intake with no impact on milk production is not provided.
Figure 3. The difference in lactation months 1-10 between alternative “Skåne” with maize-
silage, grain and protein concentrate; and “Västergötland” with grass silage, and complete concentrate mix regarding milk production (ECM) in kg per cow and day), dry matter intake (Total consumption, kg dry matter) per cow and day, energy concentration of daily feed rations (MJ ME/kg dry matter), and consumption as kg dry matter per 100 kg live-weight as estimated by Totfor (Emanuelson et al. 2006).
Figure 4 shows the total consumption of feeds for four alternatives, with the assumed limit in consumption capacity of 3.8 kg dry matter per 100 kg live-weight for the alternatives “Europe” and “Sweden” that the study set (Emanuelson et al. 2006, p. 19). In lactation month 2, the consumption in alternative “Europe” is 4.5 kg, i.e., 0.7 kg more than the set limit. The argument why the study introduces a limit, and then not follows it, is not provided.
-2
-1,5
-1
-0,5
0
0,5
1
1 2 3 4 5 6 7 8 9 10 ECM
Total consumption, kg dry matter
MJ ME/kg dry matter
Consumption, kg dry matter per 100kg live-weight

19
Figure 4. Consumption in alternatives “Västra Götaland”, “Skåne”, “Europe” and “Sweden”
in lactation months 1-10 in kg dry matter per 100 kg live-weight according to Totfor (Emanuelson et al. 2006). The maximal consumption of 3.8 kg dry matter (“Given limit”) set in the study is also shown.
The results of Totfor express major internal logical conflicts, and conflicts with common knowledge within dairy production sciences. The influence of Totfor on national level (see above) is a concern. The quality of the results on aggregated national level in the three applications mentioned above is a function of the quality in the basic production biological relations that constitutes Totfor. The analysis above shows that there are major problems in Totfor in this area. Hellstrand (2006) showed an increase of nitrogen influxes in Swedish cattle production from 1991 to 1999 with 22.8 million kg nitrogen due to increased use of purchased feeds, where the dominating part was due to increased use of crop protein feeds. In 1991 201 million kg was used, in 1999 536 million kg (Hellstrand (2008). Section 3 presents the sustainability drawbacks from this trend. Despite all the measures by authorities and the milk-producing sector (see also Gustafsson 2001) to increase nitrogen efficiency in milk production, the use of crop protein feeds to cattle in 2006 had increased to 644 million kg (Swedish Board of Agriculture 2007). Partly, this is a function of major production biological weaknesses in tools used on national scale as well as on single farm level to increase nitrogen efficiency, such as Totfor and the way it is applied in STANK. STANK cannot detect the impact of an increasing protein intensity in milk production, therefore national systems for the evaluation of trends regarding ammonia emissions from agriculture and nitrogen surpluses in agriculture, are blind for this aspect. This severely distorts the results in this national reporting. Hellstrand (2008) analysed this in detail. There are production biological problems of a similar and severe magnitude as well in the third national context mentioned where Totfor formed the production biological basis for evaluation of economic and/or environmental aspects of Swedish milk production.
0,0
0,5
1,0
1,5
2,0
2,5
3,0
3,5
4,0
4,5
5,0
1 2 3 4 5 6 7 8 9 10
Dry
mat
ter
inta
ke, k
g pe
r cow
and
day
Lactation month
Consumption, kg dry matter per 100 kg live-weight
"Västra Götaland"
"Skåne"
Europe
Sweden
Given limit

20
Another important cause for the decreasing nitrogen efficiency in Swedish milk production 1991-1999 is the changed feeding standards the same period. The studies which provided the arguments for the changes contain important internal inconsistencies (ibid.) and expresses conflicts with basic production physiological, biological and economic principals. The level of the scientific probing for two of three major changes is low. The change of a fundamental principle behind the energy standard in 1995 was based on a work by a student, a change of a fundamental principle behind the protein standard the same year was based on an stencil at the department of Animal Nutrition and Management, Swedish University of Agricultural Sciences, which no longer can be found (Hellstrand 2008). The Totfor-example, together with the results from the analysis of the FPD-model, the cattle-sugarcane example, and LCA-studies of milk production underlines the importance of analytical tools with a good anchoring in animal production biology and economics that can provide a sound production biological and economic platform for sustainability analysis of meat and milk production. That will benefit work for improved economic result in milk production and for a better environment. The situation in Sweden and the Nordic countries is not unique, but may well reflect a global potential for improved feeding efficiency in milk production (ibid.). The simulation model is an important tool in order to identify measures that through increased feeding efficiency in animal production simultaneously increase farmers incomes, support global food security, decrease ammonia emissions and nitrate leaching; and decrease the appropriation of land for animal production. This is of international interest. It is suitable in evaluation of economic and ecological effects of alternative feeding standard systems.
7 Conclusions In the animal production simulation model production is described in production biological and economic terms as a function of the composition of the daily feeding plan, the nutritive values of used feeds, and of animal dependent factors such as breed, sex, size and lactation phase. The simulation model supports analyses on single farm as well as on national animal production sector level. The outputs of the model can be used in extended analyses in combination with other concepts and models, thus supporting the operationalising of animal production supporting a sustainable development. When applied on a conventional animal production system, a substantial potential for improved economic result in Swedish milk production was identified, by a more skilful utilisation of the production potential of the animals and of high quality feeds. The simulation model is a tool suitable for evaluation of economic and ecological consequences of alternative feeding standards in milk production. Although the version of the simulation model here presented is applied to Swedish conditions, it can quite easily be adopted to the conditions of other nations by applying national variants of formulations of feeding requirements and feeding strategies. Compared to other approaches used when analysing sustainability of animal production systems such as the FPD/ALBIO model of the global food production system; an integrated model for cattle and sugarcane/ethanol production in Brazil; and LCA of Swedish milk production the simulation model has strong advantages since it is based in science and experiences that have been developed during decades and centuries of application within animal and agricultural production. The mentioned alternatives were found to be weak in their

21
representation of basic production biological and economic conditions, where this severely distorted their analyses. The animal simulation model expresses an effort to once again increase the integration of production biology and economy in animal production sciences. It is a contribution in bridging traditional agricultural management tools and methods and concepts within Integrative Assessment. This is crucial in order to develop methods that better than current ones, can improve the contribution of, e.g., animal production systems worldwide towards a sustainable development, considering the site-specific biophysical and socio-economic contexts at hand.
8 Acknowledgements Valuable comments on earlier version have been received from Jan Bertilsson, Erling Burstedt, Sten Ebbersten and David Pimentel. Remaining mistakes are my own. Fundings was obtained from the Swedish Environmental Protection Agency and Bergen University.
9 References Bertilsson, J. 2005. Jämförelse av en foderstat till mjölkkor med enbart närproducerat foder och en där
proteinkompletteringen skett med importerat foder. Internrapport. Institutionen för husdjurens utfodring och vård. SLU. Uppsala
Cederberg, C., & Flysjö, A. 2004. Life Cycle Inventory of 23 Dairy Farms in South-West Sweden. SIK-Report 728, SIK - Institutet för Livsmedel och Bioteknik. Göteborg.
Cederberg, C., Flysjö, A., & Ericson, L. 2007. Livscykelanalys (LCA) av norrländsk mjölkproduktion. SIK-rapport Nr 761, SIK - Institutet för Livsmedel och Bioteknik. Göteborg.
Egeskog, A., & Gustafsson, S. 2007. Socioeconomic and environmental effects from sugarcane expansion in to the Pontal do Paranapanema region (state of São Paulo, Brazil): -A model-based analysis. Thesis for the Degree of Master of Science in Industrial Ecology. Department of Energy and Environment, Division of Physical Resource Theory, Chalmers University of Technology. Gothemburg.
Emanuelsson, M., Cederberg, C., Bertilsson, J., & Rietz, H. 2006. Närodlat foder till mjölkkor – En kunskapsuppdatering, Rapport nr 7059-P. Svensk Mjölk.
FAO. 2006. Livestock’s long shadow. Rome. FAOSTAT. 2009. http://faostat.fao.org/site/569/DesktopDefault.aspx?PageID=569#ancor. Accessed
2009-02-25. FOOD 21. 2009. http://www-mat21.slu.se/eng/thisis/presentation.htm. Accessed 2009-02-27. GeoHive 2009. http://www.geohive.com/earth/his_history3.aspx. Accessed 2009-02-25. Giampietro, M. 1997. Socioeconomic pressure, demographic pressure, environmental loading and
technological change in agriculture. Agriculture, Ecosystems and Environment 65, 201-229. Gunnarsson, S., Sonesson, U., Stenberg, M., Kumm, K.I., & Ventorp M. 2005. Scenarios for future
Swedish dairy farming. A report from the Synthesis group of FOOD 21. Report FOOD 21 no 9/2005. Swedish University of Agricultural Sciences. Uppsala.
Gustafsson, A. 2001. Högre kväve-effektivitet i mjölkproduktionen genom ändrad utfodring – vad är möjligt att uppnå? Rapport nr 4999 2001-08-30. Svensk Mjölk.
Hellstrand, S., 1988. Kan ekonomin i mjölkproduktionen förbättras - en modell för biologisk - ekonomisk analys av mjölkproduktionen och dess resultat för 15 gårdar i Värmland. Report 175, Department of Animal Nutrition and Management, Swedish University of Agricultural Sciences. Uppsala.
Hellstrand, S., 1989. Bakgrund och kommentarer till 1989 års fodermedelstabeller och näringsrekommendationer för idisslare. Report 191, Department of Animal Nutrition and Management, Swedish University of Agricultural Sciences. Uppsala.
Hellstrand, S., 2006. A Multi-Criteria Analysis of Sustainability Effects of Increasing Concentrate Intensity in Swedish Milk Production 1989-1999. Environment, Development and Sustainability, 8(3), 351 – 373.

22
Hellstrand, S., 2008. Ekonomisk och miljömässig optimering av svensk mjölkproduktion, report to the Swedish Environmental Protection Agency.
Hellstrand, S., Skånberg, K., & Drake, L. 2009a. The Relevance of Ecological and Economic Policies for Sustainable Development. Environment, Development & Sustainability, 11 (4), 853-870..
Hellstrand, S., Skånberg, K., & Drake, L. 2009b. A biophysically anchored production function. Environment, Development & Sustainability, DOI: 10.1007/s10668-009-9212-5.
Johnsson, H., Renborg, U., & Säfvestad, V. 1959. Resultatmaximering i lantbruket. Meddelande från jordbrukets utredningsinstitut, 3-59. Stockholm.
Livsmedelsverket. 2009. Livsmedelsverkets livsmedelsdatabas version 2009-01-23. http://192.121.81.11/livsmedelsok/sok.aspx?epslanguage=SV. Accessed 2009-03-01.
McDonald, P., Edwards, R.A., & Greenhalgh, J.D.F. 1981. Animal Nutrition (Third edition), Longman Group Limited.
Millennium Ecosystem Assessment. 2005. http://www.millenniumassessment.org/en/About.aspx. Accessed 2008-08-25.
Nanneson, L., Nilsson, H., & Ytterborn, G.R. 1945. Jordbruksekonomi för jordbrukets ungdomsskolor och för självstudier. 5:e upplagan. Lantbruksförbundets Tidskriftsaktiebolag. Stockholm.
Naturvårdsverket. 1997. Det framtida jordbruket: Slutrapport från systemstudien för ett miljöanpassat och uthålligt jordbruk”, rapport 4755. Naturvårdsverket. Solna.
NRC. 2001. Nutrient requirements of dairy cattle. Seventh revised edition. NRC. National Academy Press. Washington.
Odum, H.T. 1988. Self-organization, transformity, and information. Science, 242, 1132-1139. Renborg, U. 1957. Lineär planering använd i lantbruksekonomiska driftsplaneringsproblem,
Meddelande från jordbrukets utredningsinstitut, 3-57. Stockholm. SEPA. 2009. Utsläppsstatistik av växthusgaser. http://www.naturvardsverket.se/sv/Klimat-i-
forandring/Utslappsstatistik-och-klimatdata/Utslapp-av-vaxthusgaser/. Accessed 2009-02-26. SIKA. 2002. Review of cost benefit calculation. Methods and valuations in the transport sector.
English summary. Report 2002:4. SLU. 1989a. Områdeskalkyler Jordbruk Ss 1989/90. Report 157, Konsulentavdelningen, Swedish
University of Agricultural Sciences. Uppsala. SLU. 1989b. Databok för driftsplanering. Speciella skrifter 37, Swedish University of Agricultural
Sciences. Uppsala. SLU. 2006. Agriwise. www.agriwise.org. Accessed 2007-09-14. SLU. 2009. Agriwise. www.agriwise.org. Accessed 2009-03-01. Sparovek, G., Berndes, G., Egeskog, A., de Freitas, F.L.M., Gustafsson, S., Hansson, J. 2007.
Sugarcane ethanol production in Brazil: an expansion model sensitive to socio-economic and environmental concerns. Biofuels, Bioprod. Bioref. 1:270–282.
Spörndly, R., 1989. (Ed.) Fodertabeller för idisslare 1989. Speciella skrifter 39, Swedish University of Agricultural Sciences. Uppsala.
Statistics Sweden. 2007a. Utsläpp av ammoniak till luft i Sverige 2005. Statistiska meddelanden MI 37 SM 0701. (Emmissions of ammonia to air in Sweden in 2005).
Statistics Sweden. 2007b. Kväve- och fosforbalanser för jordbruksmark och jordbrukssektor 2005 (Nitrogen and phosphorus balances in agricultural land and agricultural sector in 2005). Statistiska meddelanden. MI 40 SM 0701. http://www.scb.se/statistik/MI/MI1004/2007A02/MI1004_2007A02_SM_MI40SM0701.pdf, accessed 2010-09-14.
Statistics Sweden. 2008. Yearbook of Agricultural Statistics 2008 including food statistics. Elinders AB.
Statistics Sweden. 2009. Utsläpp av ammoniak till luft i Sverige 2007 (Emissions of ammonia to air in Sweden in 2007). Statistiska meddelanden. MI 37 SM 0901. http://www.scb.se/Statistik/MI/MI0103/2009A02/MI0103_2009A02_SM_MI37SM0901.pdf. Accessed 2010-09-14.
Swedish Board of Agriculture. 2007. Feed control by the Swedish Board of Agriculture 2006, Rapport 2007:3, Jordbruksverket. Jönköping.

23
Swedish Board of Agriculture. 2009. Focus on Nutrients. http://www.greppa.nu/ovrigt/kontakt/english.4.1c0ae76117773233f780001230.html. Accessed 2009-11-02.
Swedish Dairy Association. 2009. http://www.svenskmjolk.se/ImageVault/Images/id_1156/scope_128/ImageVaultHandler.aspx. Accessed 2009-04-17.
UN. 2008. UN Millennium Goals. http://www.un.org/millenniumgoals/poverty.shtml. Accessed 2008-08-25.
WHO. 1985. Energy- and Protein Requirements. Report of a joint FAO/WHO/UNU expert consultation. WHO Technical Report Series 724. Geneva. WHO.
Wiktorsson, H. 1971. Studies on the effect of different levels of nutrition to dairy cows. Swedish J. Agric. Res. 1:83.
Wiktorsson, H. 1979. General plan of nutrition for dairy cows. In Feeding strategy for the high yielding dairy cow (Eds. W.H. Broster & H. Swan). London.
Wirsenius, S. 2000. Human use of land and organic materials. Modelling the turnover of biomass in the global food system. PhD-dissertation, Department of Physical resource Theory, Chalmers University of Technology. Göteborg.
Wirsenius, S. 2003a. Efficiencies and biomass appropriation of food commodities on global and regional level. Agricultural Systems, 77 (3), 219-255.
Wirsenius, S. 2003b. The biomass metabolism of the food system: A model based survey of the global and regional turnover of food biomass. Journal of Industrial Ecology, 7 (1), 47-80.


Paper V


The First International Conference on Applied Energy (ICAE09) 5 – 7 January 2009, Hong Kong
1
THE POTENTIAL TO INCREASE SUSTAINABLE GLOBAL GREEN ENERGY
PRODUCTION THROUGH INCREASED EFFICIENCY IN MILK AND CATTLE
PRODUCTION: - A SWEDISH CASE
Stefan Hellstrand 1, Jinyue Yan 1,2
1 School of Sustainable Development of Society and Technology, Mälardalen University, Västerås, Sweden
2 KTH - Royal Institute of Technology, Stockholm, Sweden
Email: [email protected] (Corresponding author) ABSTRACT:
This paper addresses the potential of sustainability improvement by increased efficiency in milk and cattle production. The experience of Swedish improvement over the last half century reveals the global potential for the sustainable management of land use, nutrition balance and bioenergy supply.
Ruminants are an important part of the global food production system. Ruminant production has the potential to substantially increase land area available for bioenergy production. They can use energy in foodstuffs with none human nutritive value and simple nitrogen compounds in the production of high quality feeds. They can convert renewable natural resources from ecosystems, that otherwise have low capacity to transform solar energy fluxes to food, to high quality food.
Globally, the area of pasture is 2.5 times larger than the area of cropland. Ruminants are an important part of the global food system, supplying human energy metabolism. Due to the competition for land, the skilfulness in rumen production affects potentials for green energy production supplying the energy metabolism in the technical systems of society.
This paper discusses two aspects of ruminant production affecting the potential for green energy production:
(i) The impact of increased nutritional physiological efficiency, i.e., better feeding strategies, and
(ii) The importance of utilising ruminants as ruminants, where they transform solar energy fluxes to high quality foodstuffs from ecosystems with low capacity to produce food through other paths.
The focal point is the impact on the land remaining for green energy production supplying the technical systems of society, after food supply needs are met. Estimates are provided on the impact on other sustainability aspects at different system levels as well as in the three sustainability-dimensions. The results are provided through the application of a methodology within the frame of integrated assessment for analysis of sustainability effects in systems with mutual dependencies between systems and system levels. This is of general interest as a methodology, supporting the development of sustainable green energy production and meeting the needs of society. It contributes with concrete results, supporting an increased sustainable production of green energy due to increased efficiency within a sector that competes for land

The First International Conference on Applied Energy (ICAE09) 5 – 7 January 2009, Hong Kong
2
KEYWORDS: Bioenergy potentials; Ruminant production; Agroecology; Food security: Integrative Assessment 1. INTRODUCTION
1.1. The issue
The impact of animal production on global environmental problems has been highlighted on a high policy level. Thus, the contribution to anthropogenic global climate effect is estimated at 18%, while other huge environmental impacts such as eutrophication and loss of biodiversity are also stressed [1]. This has inspired work in Sweden aiming at reduction of the environmental impact of agriculture, especially climate change effects. Three exponents for this ambition are
• the cooperation between the certification systems for the Swedish Farmers Association Swedish Seal, and the one for the organic farmers KRAV, respectively, in the development of certification rules considering climate impact of food products [2],
• the work of the Swedish National Food Administration (SNFA) aiming at a system of advices to consumers supporting choices that reduces the environmental impact of food consumption, especially climate change effect [3] and
• the process within the Swedish Board of Agriculture (SBA), aiming at incentives reducing the contribution to global climate change from Swedish agriculture [4].
The main greenhouse gases (GHG) emissions in agriculture sector are carbon dioxide from combustion of fuels and fertilizer production, methane from enteric fermentation in livestock and nitrous oxide from agricultural land and production of nitrogen fertilizers.
The authorities, SNFA and SBA, stress in their public communication the contribution of ruminants to climate change through emissions of methane: “Meat from cattle generates one hundred times more greenhouse gases than the corresponding amount of beans” according to SNFA [3]. “The origin to emission of methane which contributes to climate change is largely due to the digestion of animals”. For example, meat from cattle generates 14 kg CO2-equivalents per kg meat, while meat from pork and chickens generate 5 and 2 kg, respectively [4]. This discussion concerns the sink aspect of the sustainability limits to agriculture. The key question is: are the emissions/discharges within the assimilative capacity of affected ecosystems?
The resource aspect is another important sustainability aspect of agriculture, thus also of animal production and ruminant production. Emissions from livestock and agricultural soils represent a loss of valuable carbon and nitrogen resources. Thus, these emissions show the strong link between resource issues and environmental disturbances. The resource aspect relates to the capacity of agriculture to supply the metabolism of humans with food, and the metabolism of the society with energy. Of course, resources needed in the agricultural production such as fossil oil and phosphorus fertilisers are also crucial. Reductions in agricultural emissions will therefore also lead to productivity benefits for agricultural industries, and provide a win-win for agricultural production and environmental sustainability.

The First International Conference on Applied Energy (ICAE09) 5 – 7 January 2009, Hong Kong
3
Figure 1 shows the price development of oil 1998-2008.
Oil price 1998-2008 US$/bbl
0
20
40
60
80
100
120
140
160
1998 1999 2000 2001 2002 2003 2004 2005 2006 2007 2008
BP, US$ 07
Bloomberg, US$ 08
Figure 1. Price-trend oil 1998-2008 US$ per bbl. Source, own processing of data from BP covering the period 1998-2007 [5], the value for 2008 concern 1 of July 2008 [6].
Increased oil price (Figure 1) and the responses to climate change increased the demand from society on bioenergy produced in the agricultural sector. The price of oil in 2008 was 8 times higher than the price in 1998. The doubling time for the price was 5, 3, and 2 years, respectively.

The First International Conference on Applied Energy (ICAE09) 5 – 7 January 2009, Hong Kong
4
Figure 2 shows the amounts of commercial energy used, and the gross energy in biomass appropriated in the global food system. That refers to the amount of phytomass that is used to feed the global food supply system, to that part that it is based on agriculture, measured in gross energy terms.
0,00E+00
5,00E+19
1,00E+20
1,50E+20
2,00E+20
2,50E+20
3,00E+20
3,50E+20
4,00E+20
4,50E+20
5,00E+20
Commercial energy use 2007 Oil use 2007 Biomass appropriated in food
system
Losses through manure and crop
residues
Figure 2. Total use of commercial energy and of oil in 2007 [5]; and amount of gross energy in biomass appropriated in global agricultural production of food and in losses through manure and crop residues [7]. The measure 1.00E+20 equals 1.00 *1020 J equals 100 EJ.
Figure 2 provides information about the size of the use of oil, e.g., in relation to losses in the food system. Figures 1 and 2 explain the growing interest in production of bioenergy from agriculture: With a fast increase in the price of oil, and a global production of biomass in agriculture that in gross energy terms (GE) is greater than the current use of oil, the interest in agriculture for production of bioenergy is quite natural. This offers a new opportunity to integrate energy production through biomass with food production to address issues in not only energy supply but also climate change. If the fluxes of biomass in agriculture not used are substantial, the commercial interest is further increased. When bioenergy from agriculture substitutes fossil fuels, emissions of climate change gases are reduced at the same time as the dependency of fossil fuels.
Wirsenius [7] estimated the conversion efficiency in the global agricultural system to 8.7% as the ratio between amount of gross energy (GE) in food consumed and GE in the plant biomass appropriated for the production of food. The purpose of this measure is to provide an overall measure of the efficiency in the food supply system, where gross energy in food consumed by all humans is divided by the gross energy in the total amount of plant phytomass supporting the food system. Low conversion efficiencies suggest huge potentials to redirect

The First International Conference on Applied Energy (ICAE09) 5 – 7 January 2009, Hong Kong
5
fluxes of biomass to, e.g., bioenergy purposes. Later, Wirsenius has slightly modified the estimates [8] [9]. The found conversion efficiency in the animal production system was profoundly low, since the system accounted for roughly two-thirds of the total appropriation of phytomass, but only contributed about one tenth to the human diet [7] Thus, the estimated conversion efficiency in animal production was only 5.6% of that of crop and vegetable production for human consumption.
The feed conversion efficiencies of cattle meat systems were estimated at about 2 percent in industrial regions, and only 0.5 percent in most non-industrial regions (on gross energy basis). The conversion efficiencies for pig and poultry production were about a factor ten higher (ibid.). The estimated losses due to manure and crop residues were 51%, i.e. appr. 110 EJ. In a report to the Swedish government, it was concluded that on global level 50 EJ of bioenergy could be produced from crop residues and dung in agriculture [10]. The challenges to in real world systems realize the suggested potential include issues regarding impact on:
• soil fertility, as in the used model refluxes of manure and crop residues could not provide positive feedback on future harvests, as the soil compartment was not included in the model,
• the relevance of the used measure of conversion efficiency gross energy in food through gross energy in plant biomass appropriated, as it does not reflect the positive feedback of manure and crop residues on future harvests, neither the different physiological values of one unit gross energy in food consumed in the form of, e.g., grain or meat and
• to what degree used model and measures recognize the importance of the different types of feeds that different types of animals utilizes.
Studies about contribution to climate change in terms of GHGs emission per kg product, as well as of feed conversion efficiencies in different systems for producing meat, found that pig and poultry production are substantially more efficient with regard to the sink aspect (climate change) and the resource-aspect (efficiency in use of feeds) than ruminant production. Emissions of GHG are substantially higher per kg meat produced for cattle than for meat from pigs and poultry [4]. One reason is that cattle need more feeds per kg meat produced.
The information provided this far suggests that major measures for increasing the sustainability in the global agricultural system would be to
• substitute animal products with crop products,
• substitute ruminant products with pig and poultry products and
• increase the efficiency in remaining ruminant production systems for production of milk and meat.

The First International Conference on Applied Energy (ICAE09) 5 – 7 January 2009, Hong Kong
6
1.2. The wider perspective: including food security and an agroecological perspective
However, the picture presented needs to be balanced. This far, results from studies where the sustainability in food production systems have been estimated in terms of
• emissions of GHG per kg product,
• conversion efficiencies measured as gross energy in food consumed divided by gross energy in food biomass appropriated and
• amount of feeds consumed per kg meat produced
have been discussed. The sustainability of food systems are something more.
The relationship between population and lactose is of interests to address the energy and climate change issues in connection to the food supply. The Swedish population is genetically extremely adopted to ruminant production, thus of the total population only 3-5 % is lactose-intolerant, in Finland 15-20, in the Mediterranean 50%, and in parts of Asia up to 100% [11]. Lactose is milk sugar. This illustrates the fact that within Sweden (and the other Scandinavian nations) milk and meat from the stock of dairy cows and other ruminants, since at least the time of the Vikings, has played a major rule in the supply of the nutritional physiological needs of the population. Ruminants have been a prerequisite for the Scandinavian civilisation. The power of this dependency is now expressed in the Scandinavian genome. The reason is that in Scandinavia, the climatic conditions are such that compared to other regions, forages and pasture provide comparative advantages, while crop production provide comparative disadvantages. Pigs and hens like other monogastric animals (to which humans belong) have low capacity to transform energy and protein in forages to high quality food, while ruminants have high such capacity. This is the beneficial side of the rumen fermentation capacity, where the methane emissions are an energy-cost for this capacity. The biomass of ruminants, and other animals like horses that have other solutions for achieving the same capacity through collaboration with microbes, of total biomass of farm and wild animals signs the value of this capacity to utilise this trophic level in ecosystems and agroecosystems, which without this cooperation with microbes, would not have been available.
This situation is not restricted to Sweden. On global level, of total land area of 13 billion ha 27% is pasture, and 11% is cropland [12], i.e. pasture covers 2.5 times more land. The production of biomass per ha pasture is estimated at 3.4 tonnes dry matter (DM), while on cropland the corresponding estimate is 5.1 tonnes. Pasture not eaten/crop residues are estimated at 52% on pasture, and 14% on cropland [7]. This gives a net yield after residues per ha of 1,6 tonnes for pasture and 4,4 tonnes DM on cropland; i.e. 2.8 times higher. This clearly shows the higher biological productivity on cropland, reflecting the lower quality of land used for pasture. Grazing ruminants have in these areas an important role transforming low quality pasture, which pigs and poultry cannot use, to high quality food. That way, they increase the total global capacity to produce food. By doing that, they decrease the pressure on cropland to produce food, i.e. they increase land area available for production of bioenergy, everything else equal.

The First International Conference on Applied Energy (ICAE09) 5 – 7 January 2009, Hong Kong
7
1.3. Climate change and food security policies
On high-policy level a trade-off between production of bioenergy and food has been identified. The first of the Millennium Development Goals of the UN is to eradicate extreme poverty and hunger [13]. Climate effect is one aspect under one target under the seventh Millennium Development Goal. Thus, UN values food security substantially higher than the climate effect on a general societal level. If so, within the agricultural sector the priority rank would be even more favourable for food production compared to climate objectives. This rank of priorities correspond well with the one of Millennium Ecosystem Assessment (MEA), a major study of state and trends of major ecosystems globally and their capacity to produce ecosystems services, thus providing the ecological base for sustained welfare. MEA was initiated by former Secretary General of the UN, Kofi Annan, and involved more than 1 360 experts: The list of ecosystem services presented at the homepage is: clean water, food, forest products, flood control, and natural resources [14].
A discussion has evolved whether policies to substitute fossil fuels with biofuels might have resulted in increasing food-prices, increasing the number of people in poverty, experiencing hunger. Thus, a high level conference on world food security and the challenges of climate change and bioenergy was held in Rome, 3 -5 June 2008 [15]. From this information the following conclusions are important for the scope of the paper. Some national authorities now put a high priority on reducing climate impact of agriculture. This will work in favour of increasing production of biofuels. UN-related bodies prioritise food supply and the fulfilment of other basic physiological needs. Another important aspect of climate change and food security is how the utilization of the carbon sink capacity in agriculture can provide a buffer that have an importance for economic and for ecological systems increasing the time span for adoptions, and at the same time increasing soil fertility, thus, improving food security. Climate change also affect food security through increasing levels of carbon dioxide, temperatures, sea levels, and the impact of the pattern of rains [1].
Within the borders of this paper, we have no intention to solve the issue about the possible tension between objectives regarding production of biofuels and of food respectively. However, we conclude that all activities that can decrease this tension are welcome. To identify some such options within the field of ruminant production is the overall ambition of the paper.
More specific questions studied in this paper are:
1. What are the sustainability effects of substituting food produced from ruminants in more marginal agricultural areas, with food produced from pigs, studied through the Swedish example? In more specific terms, what is the implication for land available for bioenergy purposes?
2. What are the potentials to improve the efficiency in ruminant production, and how will that affect land available for bioenergy production?
The answer to the first question relies on the results from an analysis of impacts on different system levels in the ecological, economic and social dimension of sustainability of a system with mutual dependencies between systems and system levels. This indicates a way to provide analysis, supporting decisions for sustainability.

The First International Conference on Applied Energy (ICAE09) 5 – 7 January 2009, Hong Kong
8
2. MATERIAL AND METHODS
The conceptual framework for the analysis is Hellstrand et al. [16]. They present a conceptual model of the economic system in its ecological and social context. Stocks of natural capital, man-made capital, human capital and social capital are included. The importance of thresholds, resilience, irreversibilities, life-support systems, assimilative capacities, interdependencies between systems and system levels are acknowledged. The contribution is based on 1) principles for sustainable development in ecological economics, 2) integrative assessment, a methodology that provided the analytical backbone of Millennium Ecosystem Assessment [14], and 3) traditional farm management tools in agriculture and agricultural sciences.
The methodology agrees with the principle for sustainable development presented by OECD [17]. The analysis of the sustainability impacts of changes in animal production follows the methodology developed by Hellstrand [18], which was then further developed by Hellstrand [19]. This implies an approach where material fluxes from fields to animals to humans are analysed, taking into consideration real world variation in production levels among production regions. Resources (feeds) not used, results in emissions or discharges. Knowledge within animal and human nutrition physiology is applied, enabling an analysis of when animal production competes with human nutritional objectives, and when it enhances food supply.
The feeding standards and tables for ruminants in Sweden as of 1989 [20] [21] provide the core in the calculations of the contribution to food supply from ruminant production. The material and data used is from agricultural production data for 2006. The production region focused is the northern part of Sweden including the forest sub-regions in the region Svealand and the whole of Norrland [22], which is here called Northern Sweden. This geographic area has the same altitude as the northern half of Hudson Bay. Due to the Gulf Stream, the climate is somewhat milder. Still the production alternatives are limited. The production alternatives compared are
A. Total production of milk that is supplied in Northern Sweden by current production of grain, forages and pasture
B. The same production of protein through pigs instead of through milk.
Regarding B, this production will occur in traditional agricultural regions, i.e. in other production areas than Northern Sweden: That region is not suitable for production of feeds to pigs, which is clearly shown in the official agricultural statistics [22] regarding regional distribution of farm animals, as well as production of crops, suitable as feeds to pigs. Thus, an realistic outcome of the alternative to produce the same amount of protein through pigs implies that this production occur in districts in southern Sweden or EU, suitable for grain and pig production, while current agricultural land in the northern part of Sweden become forests. That way, indirectly, this example informs about the general importance of using pasture for ruminant production globally. The alternative use of the agricultural land in Northern Sweden, somewhat simplified, is as forest or pasture for reindeers (also a ruminant), not other forms of agriculture.
The results are based on advanced analysis in animal production sciences. In the context of a presentation in the field of applied energy we have made the choice to focus on the general principles and results. If more detailed information is wanted about the animal production systems, contact the corresponding author.

The First International Conference on Applied Energy (ICAE09) 5 – 7 January 2009, Hong Kong
9
3. RESULTS
Main results on sustainability effects of
• increasing or ceasing dairy production in Northern Sweden,
• increasing feed efficiency in Swedish milk production based on real world values,
• an example of the importance of increasing feed efficiency in milk production on global level and
• improving productivity in milk production globally
are presented.
The results are strongly related to the bioenergy uses, food supply and climate change issues.
3.1 Sustainability effects of ceased dairy production in marginal agricultural areas
Table 1 shows some sustainability effects of substituting milk produced in Northern Sweden, with pork produced somewhere else. Two scenarios are included:
A. Increased milk production in Northern Sweden.
B. Same amount of protein produced by pigs in major agricultural districts in EU.
A represents an ambition to in regions with high capacity for forage production utilise ruminants to convert the energy in feeds with low value for monogastric animals and humans to high quality food.

The First International Conference on Applied Energy (ICAE09) 5 – 7 January 2009, Hong Kong
10
B represents an ambition to decrease the contribution to climate change from Swedish consumers by consuming meat from pigs instead of protein from ruminants.
Table 1. Some sustainability effects of substituting milk produced in Northern Sweden, with pork
produced somewhere else. Data from Statistics Sweden [22], production year 2006.
Alternative
A. Dairy cows in Northern Sweden
B. Same amount of protein produced by pigs in good
agricultural districts in Sweden or in the EU
Acreage, ha, northern Sweden 400 000
No of dairy cows, 261 980
Milk production, ECM (energy corrected milk), tonnes 2 163 083
Energy need, no of humans 1 600 000
Protein need, no of humans 3 720 000
Meat from slaughtered dairy cows, carcass weight, tonnes 31 400
Contribution to climate change, through methane, ton CO2-equivalents 718 000
Slaughter pigs, no 8 172 000
Meat, tonnes 368 000
Barley, used as feed, tonnes 1 462 807
Area for barley production in good agricultural districts, ha 293 000
Soya bean meal, tonnes 258 100
Area for soya production Brazil, ha 131 000
The number of people whose protein-need would have been supplied with these amounts of barley and soya 14 145 000
Table 1 shows that in alternative A, Northern Sweden can produce 2.16 million tonnes of milk, fulfilling the total protein needs of 3.7 million people. The emissions of methane have a climate change effect of 718 000 kg CO2. 400 000 ha of land that otherwise have a low value for agricultural production is used.
In alternative B, the same amount of protein is produced through pigs. That demands 293 000 ha land in good agricultural districts in southern Sweden or other parts of EU, and 131 000 ha land in Brazil for production of soya bean meal. As pigs and humans (when humans consumes vegetables) from an ecosystem-perspective compete on the same trophic level, it is relevant to
The First International Conference on Applied Energy (ICAE09) 5 – 7 January 2009, Hong Kong
11
analyse the number of people whose nutritive requirements could have been supplied if the feeds to the pigs had been directly used as food to humans. In this example 14.1 million people´s protein requirements could be met with the grain and soya bean meal used by the pigs. Thus, marginal land used for ruminant production can on the margin increase global food supply and/or land available for bioenergy production. In this case, 400 000 ha land in the northern parts of Sweden used for milk production could on the margin provide 5.2 millions peoples need of protein, and make 147 000 ha good agricultural land in the EU and 65 000 ha in Brazil, available for bioenergy purposes, if the land area made available are split in equal parts for the fulfilment of the human metabolism and the societal metabolism.
In comparison between A and B, main observations can be drawn:
• Land use: Utilizing 400 000 ha (A) in a region that is normally defined as marginal agricultural land for a production form that is suitable, releases 424 000 ha good agricultural land in EU and in Brazil for production of, e.g., biofuels and food. If used for food, 14.1 million people more could be supplied with their total protein needs.
• Climate change: The climate change benefit of producing meat from pork (B) through the decrease in methane emissions sums to 718 000 tonnes.
• Bioenergy supply/production: The maximal marginal contribution to increased bioenergy production potentials through alternative A, is defined by the production levels of 293 000 good agricultural land in EU, and 113 000 ha land in Brazil
3.2. Potentials to improve the efficiency in milk production
3.2.1. Increasing feeding efficiency in Swedish milk production
Hellstrand [18] found that the increased use of purchased feeds, and especially crop protein feeds such as soya bean meal in the fraction purchase feeds to dairy cows between 1991 and 1999, increased production costs for farmers with 840 million Swedish Crowns (SEK) (140 million US$). The influx of nitrogen in purchased feeds to the stock of cattle increased with 22.8 million kg. Appr. 85% of purchased feeds to cattle are diverted to dairy cows. As the production of milk and meat were constant that period, the amount of nitrogen effluxes through manure increased with the same amount. The amount of ammonia emissions that the increase in nitrogen effluxes caused corresponded to 15% of reported total ammonia emissions in Sweden in 1999. The increase in the amount of energy above the feeding requirements was estimated at 18%. The increase in protein feedings was estimated at 26% above the nutritional requirements. Relative changes of prices and of purchased feeds and milk was equal, thus, economic reasons did not motivate this trend. The increased use of crop protein feeds had, if used to humans, instead meeting the total protein requirements of 6.6 million people. These measures express increasing ecological, economic and social footprints of Swedish milk production the investigated period.
Hellstrand [19] expanded the analysis to 2003. Regarding the period 1989-1999 the estimate of the costs for the farmers increased with 370 million SEK to 1.21 billion SEK, after also considering the impact of the change in the composition of the purchased feeds. In 2003, 70% of the increase in nitrogen influxes remained, thus the situation was better compared to 1999 but still not good.

The First International Conference on Applied Energy (ICAE09) 5 – 7 January 2009, Hong Kong
12
The 26% protein fed above feeding requirements in 1999 corresponded to an extra area of land in Brazil for soya meal production of 160 000 ha (ibid.) As different protein sources substitute each others, and soya meal is the most important one globally, it is reasonable to express all in terms of soya meal; at the margin, more or less protein affects volumes of soya meal traded on the world market, everything else equal.
In a comparison of the feeding standards in the Swedish system, with those in Denmark, France, The Netherlands, and USA, a significant and interesting result evolved. All of these feeding standards except the Swedish would have further increased the feeding intensity, that is the amount of feeds used per kg milk produced, for the high yielding dairy cows (ca 35-40 kg ECM per cow and day). This would increase land area needed to support dairy production in proportion, i.e., decrease areas available for, e.g., bioenergy purposes.
This suggests that the potentials for improvement found in Swedish milk production could be also very relevant on global level. Thus, 15% decrease in land area supporting global milk production could be obtained as a one-time effect (1.0 divided by 1.18), with a higher share for land area producing protein feeds.
3.2.2. Global implications and possibilities
Total global production of milk in 2007 was 635 billion kg. Cow milk provided 83% of that amount. Buffalo, sheep, goats, and camels contributed the rest. Annual yield per cow was 2 249 kg [23]. Thus, global production of milk is about 200 times the Swedish production [19]. This implies that if the global feeding efficiency is similar to the Swedish one, there is a global potential to
• increase the revenues from milk production by appr. 40 billion US$ per year,
• decrease nitrogen emissions to air and water by appr. 4 000 million kg per year and
• decrease the pressure on forests in Brazil to produce soya bean meal by appr. 32 million ha in total or increase global food security through an increased capacity to fulfill human needs of protein for 1.3 billion people.
Assume that Swedish feeding standards are relevant across the world, that cows produce all milk, and that the average live-weight of cows was 500 kg (Holstein Frisian have a weight of 600-700 kg). The amount of energy needed for this production is, then, 8.70 E+12 MJ ME (Metabolizable Energy). Assuming 10 MJ ME per kg DM biomass, this correspond to 870 million tonnes of biomass DM. Given the production levels of biomass (in DM per ha) and the acreages of cropland and pasture [7], this amount correspond to 6.9% of total biomass production supporting global food production, i.e. 340 million ha.
The energy content per kg DM in gross energy (GE) terms is appr. 17 MJ (ibid.). The difference between the content of ME and GE, indicate the size of energy not used up in dairy production, which is still available in the effluxes of e.g. manure. Thus, (17-10)/17, i.e. 40% of the 6.9% appropriation of total agricultural biomass used in milk production are still available in manure to support some part of the total system, that can be as fertilising refluxes to agricultural land as well as energy resources to be used for society. Thus, the amount of energy appropriated

The First International Conference on Applied Energy (ICAE09) 5 – 7 January 2009, Hong Kong
13
for current global milk production is here estimated at 6,9 * 0,60 ≈ 4% of the total amount of gross energy in the biomass supporting global food production.
The estimation has not considered the energy needed to produce recruitment heifers, and energy needed for gestation. However, the amount of energy for gestation is quite marginal [20]. Energy for production of recruitment heifer is treated as an energy cost for production of the meat from the slaughtered cow that the heifer replaces, thus is not dealt with here.
Figure 3 shows the trends of milk production per cow on global level and in Sweden. Year 1 is 1900 for the Swedish trend, and 1961 for the global.
kg Milk per cow over time
0
1 000
2 000
3 000
4 000
5 000
6 000
7 000
8 000
9 000
0 20 40 60 80 100 120
Year no
World
Sweden
Figure 3. Milk per cow over time. Year 1 is 1900 for the Swedish trend, and 1961 for the global trend. Sources, own calculations based on Swedish Dairy Association [24] and FAO [23], respectively.
The production level per cow in Sweden in 1900 was the same as on the global level in 1961. After 40 years the two trends have quite similar positions. The increase in production in Sweden after the first 40 years was quite dramatic. Assume that a similar trend is possible to achieve on global level. What would that imply in terms of biomass needed to support a constant production of milk? Expressed in other words, how much energy in biomass would then be released that could be used for bioenergy purposes?

The First International Conference on Applied Energy (ICAE09) 5 – 7 January 2009, Hong Kong
14
Figure 4 indicates the answers to the above questions. It shows the amount of energy needed to fulfil the physiological needs of the cow for maintenance and milk production, expressed in MJ (ME) per kg milk for three production levels: current global level, twice the current global level, and the Swedish production level of 2000.
MJ per kg milk
13,7
9,7
7,7
0,0
2,0
4,0
6,0
8,0
10,0
12,0
14,0
16,0
0 1000 2000 3000 4000 5000 6000 7000 8000 9000
kg milk per cow and year
Figure 4. The amount of energy needed to fulfil the physiological needs of the cow for maintenance and milk production [20], expressed as MJ (ME) per kg milk.
At current (2007) global level, every kg milk costs 13.7 MJ (ME) to produce. If the production level is doubled, the amount of energy needed is decreased to 9.7 MJ. At the Swedish production level (2000) one kg milk on average costs 7.7 MJ to produce. The mechanism behind Figure 4 is the following. When production levels increases, the amount of energy needed for basal metabolism (60 MJ per cows and day if the weight is 600 kg) is allocated to more milk. Then, the total energy need per kg milk produced decreases. At the same time the impact on climate change through emissions of methane decreases in the same pattern, as the emissions of methane is proportional to the amount of feeds consumed. The energy need per kg milk is reduced with 44% when going from the current global level in production per cow, to the level in Sweden in 2000. This is an exact estimate of the reduced land requirements, given a constant production of milk, “just” through increasing yields per cow, everything else equal. Thus, 44% of current land area for milk production on global level would be made available for other purposes, e.g. bioenergy purposes, by such an increase in production per cow. That is 150 million ha, assuming that the reduction of pasture and crop land used, respectively, is proportional. Expressed in GE terms this corresponds to 6.7 EJ.

The First International Conference on Applied Energy (ICAE09) 5 – 7 January 2009, Hong Kong
15
In the calculations of Figure 4, it is assumed that the cows also gain weight, from 500 kg over 550 to 600 kg live-weight, when going from lower to higher production levels. Thus, increasing needs for maintenance are considered.
4. DISCUSSION
Table 1 shows a spectrum of sustainability effects of closing down ruminant production in the more marginal agricultural areas in Sweden, compared to the option of using current production of forages, pasture and grains for milk production. 400 000 ha land in the northern part of Sweden can produce milk that supplies 3.7 million people with their total protein need.
If that amount of protein instead would be produced by pigs, it demands a further 293 000 ha good agricultural land in southern Sweden or the EU to produce grain, and 131 000 ha of land to produce soya bean meal, e.g., in Brazil. This is an increase of the demand on land that already is in short supply, due to the assumed ceasing of production on marginal agricultural land. This illustrates trade-offs between agricultural land in marginal production areas, and good agricultural land in the EU and in Brazil. Thus, in this example, 1 ha land in Northern Sweden less supporting milk production increases the use of high quality crop land in the EU with 0.73 ha, and land in Brazil for soya production with 0.33 ha. Thus 1 ha land feeding milk production in northern Sweden substitutes 1.1 ha highly productive land in the EU and Brazil producing the same amount of protein through pigs. The reason for this is the combined effect of
• comparably high production levels for forages in the northern parts in Sweden,
• higher nutritive value (the short summer nights result in higher levels of ME per kg DM, which supports higher production levels in milk production) and
• the high capacity of dairy cows to utilise these feed resources, that have so low nutritive value for monogastric animals.
These comparative advantages in ruminant production in Northern Sweden, where the capacity to produce food otherwise is quite limited, is not acknowledged by the studies of SNFA and SBA [3, 4]. Referring to the earlier quotation from SNFA, beans are not an option in Tornedalen at the border between Sweden and Finland, at the same latitude as Angmagssalik on Greenland.
This stresses the importance of not making the analysis to narrow, when processing proposals for policies in agriculture aiming at a reduction of climate effects. Impact on global food supply might still be of interest to include. The priorities of the UN suggest that this is the case. Furthermore, increased pressure on land in other areas might well, through deforestation or less land available for bioenergy production, result in indirect emissions of CO2, which counterbalance the reduced emissions of methane from dairy cows.
The amount of extra grain and soya meal that in this case must be diverted to pig production, to fully compensate for the closing down of milk production in the northern part of Sweden, would by itself support 14,1 million people with protein. The environmental gain is a reduction of the emissions of methane corresponding to 718 million kg CO2. That provides a trade-off, where a measure that decreases climate change, also decreases global food security.

The First International Conference on Applied Energy (ICAE09) 5 – 7 January 2009, Hong Kong
16
The key-figure is 718 million kg CO2 less divided by 14,1 million peoples protein supply, which equals 50 kg CO2 per person-equivalent less regarding global food supply capacity of protein.
Globally, the production level of biomass per ha pasture is 30% (DM-terms) of that of cropland [7]. Of that yield, 52% of biomass produced on pasture is not eaten, and 14% of biomass produced on cropland is not harvested. That gives a net yield per ha for pasture that is 17% of that of cropland. Globally, the production of biomass on pasture is 40% (GE-terms) of the total biomass production on agricultural land, after reduction for crop residues and pasture not eaten [7]. This reflects the marginal character of pasture. For such marginal production areas pasture often are, the high level (52%) of biomass not eaten plus the dung from the animals grazing, is significant for their resilience, thus their long term production capacity, as well as their function as habitats providing biodiversity.
The results from the Swedish example combined with the production data on global level suggest that the major use of pasture in the global agricultural system should be as producer of feeds to ruminants. That way, the fragility of these areas can be coped with (if overgrazing is avoided), and they can support production of animal products. This production adds to production of other animal products such as egg, chicken and pork, it does not compete. The latter compete directly with production of crops and vegetables for human consumption, and with the use of agricultural land for biofuels. Thus, by maintaining and improving ruminant production in these marginal areas, they may substantially decrease the pressure on more productive land, thus increasing the capacity to simultaneously supply food security and societal needs of bioenergy. The Swedish example shows that the impact can be quite substantial, see Table 1.
The efficiency measures provided by Wirsenius [7] are based on fluxes of GE. However, GE is a poor estimate of the physiological value of biomass. It implies that the physiological complexity of animals and humans is reduced to the same level as a combustion engine, or even further. In animal and human nutrition, measures such as digestible energy, metabolizable energy, and net energy is used. By using GE as a measure of conversion efficiency, an impression is created that oil is as good a feed or food as straw, wheat, and meat, as the content of GE per kg is quite high. The efficiency measures provided by Wirsenius ignores the different physiological functions of energy in the form of sugar in beets and sugar cane; starch in grain and potatoes; pectin in fruits; fat in butter and vegetable oils; protein in meat, egg and cheese; not to mention the importance of minerals and vitamins; essential fatty acids; and essential amino acids. Furthermore, the topsoil layer is not within the system borders of Wirsenius model. Thus, re-fluxes of crop residues and manure to agricultural soils are by the model treated as losses, as there is no soil that could benefit from refluxes of organic matter and plant nutrients. A third limitation is that biomass production on permanent pasture is assumed to have the same quality as crop production.
The First International Conference on Applied Energy (ICAE09) 5 – 7 January 2009, Hong Kong
17
These three circumstances;
(i) use of energy measures suitable for physical analysis of energy fluxes while ignoring the physiological context
(ii) the location of top soils outside the system borders
(iii) the ignorance of the fundamental differences between poor permanent pasture and productive cropland
limit the usefulness of the model. Due to these circumstances, the model will
• underestimate the value of animal products for human nutrition
• overestimate losses in the food system, especially regarding pasture land, as the importance of refluxes of organic matter for future production is not considered
• overestimate the potential to redirect fluxes of crop residues and manure for bioenergy production.
The model is valuable. However, it must be used with recognition of important characteristics of crop producing systems, animal producing systems, and the nutritive needs of humans, taking into consideration short and long term effects.
The results in Table 1 also imply that policies to reduce the climate change contribution from agriculture, should consider other sustainability objectives as well.
Figure 1 and 2 explain the interest in agricultural land for production of bioenergy. It is important that use of agricultural land for bioenergy purposes does not deteriorate future production capacity through production methods decreasing soil carbon content. The 50 EJ possible to use for bioenergy purposes from crop residues and manure earlier reported, correspond to a decrease in refluxes of biomass to agricultural land of 0.6 tonnes of an average yield globally of 2.6 tonnes per ha cropland and pasture, where the production level on pasture is 1.3 tonnes. This would affect the topsoil content of organic matter, thus future yields, as well as a reallocation of carbon in soils to carbon as CO2 in the atmosphere. It is important that the impact of such a use is evaluated by models that include the topsoil layer in a relevant way.
The results provided in the paper are related to dairy production. The major fraction of meat from cattle production in Sweden is from the stock of dairy cows. Therefore, when analysing the efficiency in this system it is vital to recognise that meat and milk are products from the same production system.

The First International Conference on Applied Energy (ICAE09) 5 – 7 January 2009, Hong Kong
18
5. CONCLUSIONS
The major conclusions are:
• Ruminant production has an important role in future food production systems.
• A conscious use of ruminants in marginal areas decreases the pressure on more productive land and supports global food security and other sustainability objectives, that way substantially decreasing the pressure on traditional cropland. Thus, use of 400 000 ha land in northern Sweden for milk production was estimated to
o support the total protein needs of 7,1 million people more, and at the same time,
o make 146 000 ha good agricultural land in the EU and 65 000 ha in Brazil available for bioenergy purposes,
compared to the alternative that the same amount of high quality protein should be produced by pigs.
As the area of pasture globally is 2.5 times the one of cropland, ruminant production is a general important means supporting food supply and bioenergy production.
• Increasing feeding efficiency at current production levels may substantially increase feeding efficiency, that way decreasing the demand on land, releasing areas for bioenergy production. In a numeric example, it was calculated that this could decrease the pressure on land in Brazil with 32 million ha.
• If global production of milk per cow 2007 reached the Swedish production level of 2000, the decrease in need of energy given a constant total milk production corresponded to 150 million ha that could be used for other purposes e.g. production of bioenergy.
• It is important that policies within agricultural sphere are based on a sufficient understanding of agricultural systems.
• Integration of agricultural and technological skills is valuable in the development of sustainable green energy systems.
ACKNOWLEDGEMENT: The results presented are from different studies funded by
• Nutek - the Swedish Agency for Economic and Regional Growth, project Result Analysis Enterprices for Increased Eco-Efficiency
• The Nordic Council of Ministers, project Ecosystem market, project Incentives for Social and Economic Development within Ecological Carrying Capacity Limits
• The Swedish Environmental Protection Agency, survey regarding the greening of milk production,
• The University of Bergen, project Efficient Green Support
Valuable comments on draft have been delivered by
• Sten Ebbersten

The First International Conference on Applied Energy (ICAE09) 5 – 7 January 2009, Hong Kong
19
• David Pimentel.
REFERENCES:
[1] FAO, Livestock’s long shadow, Rome, 2006. [2] KRAV, 2008, http://www.krav.se/sv/Klimat/, accessed 2008-08-25. [3] SNFA, 2008, http://www.slv.se/templates/SLV_NewsPage.aspx?id=21729&epslanguage=SV, accessed 2008-08-25. [4] SBA, 2008, for information about the process, see http://www2.sjv.se/nyhetsarkiv/nyheter/delrapportomjordbruketsklimatpaverkan.5.677019f111ab5ecc5be80006921.html, (in Swedish); for the first report delivered, Minska jordbrukets klimatpåverkan! Del 1. Introduktion och några åtgärder/styrmedel (”Reduce the climate impact of agriculture! Part 1. Introduction and some measures/incentives”) (In Swedish) see http://www2.sjv.se/download/18.677019f111ab5ecc5be80007018/klimat_delrapport_1.pdf; both accessed 2008-08-25. [5] BP, Excel workbook with information presented in the 2008 BP Statistical Review of World Energy, http://www.bp.com/liveassets/bp_internet/globalbp/globalbp_uk_english/reports_and_publications/statistical_energy_review_2008/STAGING/local_assets/downloads/spreadsheets/statistical_review_full_report_workbook_2008.xls, accessed 2008-07-01. [6] Bloomberg. http://www.bloomberg.com/markets/commodities/energyprices.html, accessed 2008-07-01. [7] Wirsenius S, Human use of land and organic materials: Modelling the turnover of biomass in the global food system, diss., Chalmers University of Technology, Göteborg, 2000. [8] Wirsenius, S, Efficiencies and biomass appropriation of food commodities on global and regional level, Agricultural Systems 2003, 77 (3): 219-255. [9] Wirsenius, S, The biomass metabolism of the food system: A model-based survey of the global and regional turnover of food biomass, Journal of Industrial Ecology 2003, 7 (1): 47-80. [10] Swedish Environmental Advisory Council, Scenarios on economic growth and resource demand: Background report to the Swedish Environmental Advisory Council memorandum 2007:1, Swedish Ministry of the Environment, Stockholm, 2007. [11] SNFA, see http://www.livsmedelssverige.org/halsa/all-lakto.htm, accessed 2008-08-25. [12] FAOSTAT. Food and Agricultural Organization, United Nations, Rome, 2001. [13] UN Millennium Goals, see http://www.un.org/millenniumgoals/poverty.shtml, accessed 2008-08-25. [14] Millennium Ecosystem Assessment, see http://www.fao.org/fileadmin/user_upload/foodclimate/HLCdocs/HLC08-inf-3-E.pdf, accessed 2008-08-25. [15] Underpinning report to high-level conference on world food security: The challenges of climate change and bioenergy, Rome, 3 -5 June 2008, see
http://www.fao.org/fileadmin/user_upload/foodclimate/HLCdocs/HLC08-inf-3-E.pdf, accessed 2008-08-25. [16] Hellstrand S, Skånberg K, Drake L, The relevance of ecological and economic policies for sustainable development; Environment, Development and Sustainability, published online 6 June 2008.

The First International Conference on Applied Energy (ICAE09) 5 – 7 January 2009, Hong Kong
20
[17] OECD, Policies to enhance sustainable development, OECD Paris, 2001. [18] Hellstrand S, A Multi-Criteria Analysis of Sustainability Effects of Increasing Concentrate Intensity in Swedish Milk Production 1989-1999, Environment, Development and Sustainability 2006, 8, (3), 351 – 373. [19] Hellstrand S, Ekonomisk och miljömässig optimering av svensk mjölkproduktion (Economic and environmental optimisation of Swedish milk production) (in Swedish), report to Swedish Environmental Protection Agency, 2008. [20] Hellstrand S, 1989, Bakgrund och kommentarer till 1989 års fodermedelstabeller och näringsrekommendationer för idisslare (Background and comments to the Swedish feedstuff-tables and feeding standards for ruminants) (in Swedish), 1989, Rapport 191, inst. för husdjurens utfodring och vård, Sveriges lantbruksuniversitet (Swedish university of Agricultural Sciences), Uppsala. [21] Spörndly, R, Fodertabeller för idisslare 1989, (Swedish feedstuff-tables for ruminants 1989) (in Swedish), 1989, Speciella skrifter 39, Sveriges lantbruksuniversitet (Swedish university of Agricultural Sciences), Uppsala [22] Statistics Sweden, Yearbook of agricultural statistics 2007, Elanders AB, 2007. [23] FAO, FAOSTAT, see http://faostat.fao.org/site/569/default.aspx#ancor, accessed 23 August 2008. [24] Swedish Dairy Association, Cattle Statistics 2001, Hållsta, 2001.

Paper VI

Animal production in a sustainable agriculture
Stefan Hellstrand
Received: 31 May 2012 / Accepted: 26 October 2012 / Published online: 7 December 2012� Springer Science+Business Media Dordrecht 2012
Abstract This paper discusses the role of animal production systems in a sustainable
society; sustainability problems within animal production systems; and four measures for
the improvement of the contribution to societal sustainability from animal production.
Substantial potentials for improvements are identified that were not previously known. The
methodological basis is multi-criteria multi-level analysis within integrated assessment
where elements in Impredicative Loop Analysis are integrated with management tools in
Swedish agriculture and forestry developed during thousands of years, during which the
well-being of the Swedish society and its economic and military power were functions of
the land-use skill. The issue—the sustainability footprint of global animal production—is
complex and available data are limited. The Swedish case is used as a starting point for an
analysis of international relevance. Data from FAO and OECD support the relevance of
extrapolating results from the Swedish case to level. The four measures are (i)decrease the
consumption of chicken meat in developed nations with 2.6 kg per capita and year; (ii)
develop the capacity of ruminants to produce high-quality food from otherwise marginal
agroecosystems; (iii) improve milk production per cow with a factor four on global level;
and (iv) increase feeding efficiency in milk production globally would substantially
improve the societal contribution in terms of increased food supply and decreased pressure
on land. The impact of measures (i), (iii) and (iv) on increased global food security was
estimated to in total 1.8 billion people in terms of protein supply and a decreased pressure
on agricultural land of 217 million ha, of which 41 relate to tropical forests. The 41 million
ha of tropical land are due to a decreased demand on soymeal, where this represents more
than a halving of total area now used for the production of soymeal. These impacts are of
the character either or. The quality of the measures is as first-time estimates, supporting
choices of where to direct further efforts in analysis. Two areas were identified as critical
for achieving this potential: Feeding strategies to dairy cows as well as methods commonly
used to evaluate the sustainability contribution of animal production needs adjustment, so
that they comply with the ‘‘laws’’ of diminishing returns, Liebig’s ‘‘law’’ of the minimum
S. Hellstrand (&)School of Sustainable Development of Society and Technology, Malardalen University,Box 883, 721 23 Vasteras, Swedene-mail: [email protected]
123
Environ Dev Sustain (2013) 15:999–1036DOI 10.1007/s10668-012-9423-z

and Shelford’s ‘‘law’’ of tolerance, that is, in agreement with well-known principles for
efficient natural resource management and the priorities of UN Millennium Development
Goals. If not, global food security is at risk.
Keywords Agroecosystems � Integrative assessment � Animal production � Sustainableanimal production � Food security � Climate change
1 Introduction
There is a growing concern regarding the capacity of global terrestrial ecosystems to
support humanity given
1. socio-economic trends regarding urbanisation, population, material welfare, change of
diets towards more animal products;
2. biophysical trends regarding
a. depletion of non-renewable natural resources, such as fossil fuels and phosphorus;
b. increased demand of renewable resources such as water, food, fibre and fuels
produced from forest and agricultural land; and
c. increased environmental impacts such as climate change, eutrophication, loss of
biodiversity due to emissions and land-use changes.
Aspects 2.a and b relate to ecological source restrictions due to different sets of
availability limits for non-renewable and renewable natural resources; 2.c relates to eco-
logical sink restrictions. Hellstrand et al. (2009, 2010) treat this in detail with references to
original work in this area.
In that context, animal production systems and ruminant production systems are of
special interest. Of total global agricultural land of around 4.9 billion ha, 3.4 billion ha
(&70 %) are classed as permanent pasture (FAOstat 2009). Furthermore, quite huge shares
of arable land, for example, in Scandinavia and Northern Europe are best used for the
production of feeds to ruminants. The reason is that ley and pasture produce well where
ruminants have the capacity to convert the energy and nitrogen compounds in forages to
high-quality food. For substantial parts of arable land, the alternative in this region is
forestry. Increased cereal production is no option due to climatic conditions. The impor-
tance is reflected in the low prevalence of adult native people that lack tolerance to lactose
(Hellstrand 2006). Lactating ruminants has for so many 1,000 years improved the capacity
of land to support people with food so much, that it has caused a thorough genetic
adaptation.
The reason why ruminants substantially expand global food production capacity is a
trick that the enzymes of the rumen microbes allow ruminants to perform, which mono-
gastric animals such as pigs, poultry and people cannot perform. Due to optical isomerism,
the enzymes of rumen microbes can split the long chains of the polysaccharide cellulose
built by units of glucose. The symbiosis between rumen microbes and the host animal
allows ruminants to support their own physiological demands of energy and protein from
fibre and simple nitrogen compounds such as urea. That explains why ruminants offer a
path by which the products of the photosynthesis can be upgraded to high-quality food in
regions where the biophysical conditions are such that the capacity to carry humans
otherwise is poor or lacking. The domestication of ruminants has in these types of agro-
ecosystems substantially improved the carrying capacity regarding sustainable human food
1000 S. Hellstrand
123
supply. A price that ruminants pay for this unique ecological niche is emissions of methane
from the processes in the rumen. Another is that high-quality protein is broken down in the
rumen. Thus, one aspect to handle in the current discussion about climate change and
ruminants is the trade-off between benefits to global sustainability through increased food
supply and costs in terms of increased emissions of methane which contributes to global
warming. One guideline from the international community is the first Millennium
Development Goal, to end poverty and hunger. Climate change is in that structure found as
one of fifteen aspects at the level below four sub-goals to the seventh of eight Millennium
Development Goals (UN 2012). Another aspect relates to the issue of the reference value.
What is the natural rate of emissions of methane from ruminants before humans become a
major ecological player? Smith et al. (2010) found that within 1,000 years after the arrivals
of humans to North- and South America by 11,500 years ago, 80 % of large-bodied
herbivores such as mammoths, camelids and giant ground sloths were extinct. They esti-
mated that this reduced annual enteric emission of methane by 2.3–25.5 Tg. Johnson
(2009) suggests that this was a general pattern, showing that at different continents, the
arrival of humans coincided with a substantial loss of megafauna, often its extinction. He
concludes: ‘‘Living large herbivores are a small remnant of the assemblages of giants that
existed in most terrestrial ecosystems 50,000 years ago. …. In several parts of the world,
palaeoecological studies suggest that extinct megafauna once maintained vegetation
openness, and in wooded landscapes created mosaics of different structural types of
vegetation with high habitat and species diversity. Following megafaunal extinction, these
habitats reverted to more dense and uniform formations.’’ FAO (2006) estimated global
enteric emissions of methane from dairy cattle to 15.7 Tg and suggested that animal
production in total contributed to the emission of 7.1 Gt CO2 equivalents annually of a
total anthropogenic contribution of 40 Gt. Of that, 1.8 Gt is estimated to originate from
enteric fermentation, due to the emissions of 85.6 Tg methane.
The findings of Smith et al. (2010) and Johnson (2009) suggest that before humans in a
substantial way affected populations of larger wild animals, (i) the natural level of emis-
sions of methane from wild animals globally might have been at the same level as current
emissions from wild and domesticated animals together; (ii) global storage of carbon in
plant biomass in forests and grasslands increased after the extinction of megafauna, that is,
the level of carbon dioxide in the atmosphere decreased. Thus, systems of grazing cattle
might have a higher potential to mimic natural ecosystems than other land-use alternatives
in agriculture.
FAO (2006) identifies mitigations options within animal production systems regarding
climate change through carbon sinks where grasslands dominate of the same size as the
estimate of total contribution to emissions.
Together, this indicates that in optimal solutions satisfying societal demands regarding
food security, biodiversity and climate change, cattle production systems may play a
positive and vital role. As illustrated in Hellstrand (2006), cattle production may also harm
sustainability goals. The point here is that cattle production has a contribution to make, if
well designed.
In this paper, I investigate the capacity to through four measures increase the sustain-
ability performance of global animal production systems: (i) decrease the consumption of
chicken meat in developed nations; (ii) utilise the full potential of ruminants to produce
valuable food from otherwise marginal agricultural land that way improving global food
security and releasing good agricultural land for biofuel production (when food supply
needs have been met); (iii) improved milk yield per cow as global average that way
Animal production in a sustainable agriculture 1001
123

decreasing feed (i.e. land) appropriation per kg milk produced; (iv) increase feed efficiency
in milk production in developed nations while maintaining high production levels per cow.
Section 2 provides context, approach and points of departure. The role of animal pro-
duction in a sustainability context is defined in Sect. 3. Section 4 gives an overview of
animal production in a broader societal and environmental perspective. It is based on FAO
(2006). Section 5 presents four examples of how to enhance the contribution from global
animal production systems to the sustainability base of society. Section 6 treats method-
ological aspects regarding feeding standards and methods to measure the sustainability
performance of animal production systems where corrections substantially can improve the
sustainability delivery. Section 7 provides final conclusions.
2 Contexts, approach and points of departure
The paper follows the perspective of a sustainable development as expressed in the con-
tributions from the policy sphere through,
• On global scale: UN Millennium Development Goals (UN 2010), OECD’s perspective
of a sustainable development (2001) and Millennium Ecosystem Assessment (MEA
2009);
• On regional scale: the Baltic Sea Action Plan regarding a sustainable Baltic Sea
(HELCOM 2009); and
• On national scale: the Swedish environmental objectives with the ambition to secure
the ecological foundation for a sustainable Sweden (SEPA1 2009a).
Scientific contributions of importance are the ones within systems ecology and eco-
logical economics from Odum (1988, 1989, 1991), Daly (1990), Daly and Cobb (1989) and
Costanza (1994); in agricultural production biology and economy from Nanneson from the
first half of the twentieth century (e.g. Nanneson et al. 1945), Renborg from 1950 to 1985
(Renborg 1957; Johnsson et al. 1959), Ebbersten (1972), and Wiktorsson (1971, 1979)
from around 1970–2005; and in agroecology from Pimentel and Pimentel (2008) and
Giampietro (2003).
Contributions from these sources have been integrated in a process generating a toolkit
for the analyses and management of any production system, not the least animal production
systems, supporting a sustainable development (Hellstrand 1998, 2006; Hellstrand and Yan
2009; Hellstrand et al. 2009, 2010).The tools within this toolkit have generated the results
presented in the following.
3 Role of animal production
The major role of animal production systems is to act as a means that enhance the food
support capacity of global ecosystems, mainly from arable land and permanent pasture.
Other functions are as sources of traction power, wool, skin and assets. This indicates that
the evaluation of the contribution from animal production to global sustainability pre-
supposes a sufficiently developed combined eco-agricultural and agricultural-social per-
spective ending up in an eco-agro-social perspective. Without that, the capacity to improve
human needs per unit ecological resource at hand, given factual ecological source and sink
1 Swedish Environmental Protection Agency.
1002 S. Hellstrand
123

restrictions at hand, cannot be accurately estimated. As an example, Rockstrom et al.
(2009) estimated nine biophysical limits that humanity had to obey in order to maintain a
safe operating space. They end their paper with the conclusion that if doing so, the
possibilities for a sustainable economic and social development were good. That conclu-
sion has a weakness. The restriction regarding nitrogen implied that an annual application
rate of 87 kg nitrogen per ha arable land as the sum from fertilisers and N-fixating crops
should be reduced to 20 kg per ha. That would severely decrease yields globally,
increasing starvation and social tension. In their analyses, agriculture was not included.
They lacked the link agriculture in the eco-agro-social perspective required in this type of
analysis.
Of total terrestrial land of 13 billion ha, 1.4 billion ha is arable land and 3.4 billion ha is
permanent meadows and pasture (FAOstat 2009).2 In total, agricultural land covers 4.9
billion ha (ibid.). Through feeds, animal production systems appropriate 70 % of the total
amount of biomass produced on agricultural land (permanent pasture plus arable land) that
supports the global food production system (Wirsenius 2000). Of these 70 %, two-thirds
actually are recycled to agricultural land as manure and crop residues, supporting future
production. The huge appropriation of agricultural biomass by animal production systems
is reflected in the appropriation of land: 30 % of the land surface of the planet supports
animal production systems (FAO 2006).
4 The FAO perspective
Livestock’s Long Shadow (FAO 2006) has synthesised a substantial amount of knowledge
about animal production systems globally and on regional level, considering aspects such
as environmental impacts, geographical areas, animal production systems and level of
industrialised animal production systems.
On global scale, animal production has a major influence on emissions/discharges
contributing to climate change, eutrophication and acidification, while it through land-use
changes is an important factor behind loss of tropical forests and biodiversity, and a major
contributor to climate change. Pollution of antibiotics and hormones contribute, for
example, to the emergence of antibiotic resistance and may cause feminisation or mas-
culinisation of fish (ibid.).
During recent decades, the poultry production has shown the highest growth, while pig
production also has grown substantially. Milk and meat from ruminants have increased at a
slower pace. FAO concludes that as pig and poultry production compared to ruminants has
a substantially higher dependency on high-quality feeds which can be used as food directly
such as wheat and soya, and due to their higher growth-rate in human consumption, they
are more important factors behind animal production driven deforestation in tropical areas.
This conclusion needs modification. FAO (2006) does not analyse actual feeding rations to
dairy cows. It is not unusual in dairy production in developed nations that the amount of
concentrates to dairy cows is 50 % or more on a dry matter basis and that soymeal is a
substantial part of the concentrates. Thus, dairy cows do not demand feeds that can be used
as food as well. However, it is not uncommon that they are feed such high-quality feeds.
The physiological aspect is stressed, where ruminants through the rumen microbes have
the capacity to utilise feeds and thus ecosystems that for monogastrics such as poultry, pigs
2 FAOSTAT (2009), http://faostat.fao.org/site/377/DesktopDefault.aspx?PageID=377#ancor, accessed 2009-07-17.
Animal production in a sustainable agriculture 1003
123

and people are useless or of low nutritive quality. They can convert biomass from more
marginal and often fragile production systems such as permanent pastures to food. In
poorer regions, this is not a question of maximal economic output per hour of labour, but a
question of survival. Of course, the grazing system if not managed well may cause over-
grazing. Regarding other environmental problems such as eutrophication and acidification,
FAO stresses the contribution from pig and poultry systems as they are mainly indus-
trialised, and they quite commonly have higher level of geographical concentration.
The substantial carbon sink capacity in pastures supporting ruminant production is
identified.
Although economically not a major global player, the livestock sector is socially and
politically very significant. It accounts for 40 % of agricultural gross domestic product. It
employs 1.3 billion people and creates livelihoods for one billion of the world’s poor
people. Growing populations and incomes, along with changing food preferences, are
rapidly increasing demand for livestock products, while globalization is boosting trade in
livestock inputs and products. Global production of all meat is projected to more than
double from 229 million tonnes in 1999/2001 to 465 million tonnes in 2050, and that of
milk to grow from 580 to 1,043 million (FAO 2006).
The global supply of whole milk per capita and day was in 2006 132 and 109 g meat
(FAOstat 2009). Animal protein per person per year makes up 37 % of a person’s protein
diet. To provide the animal protein for the world human population, humans in 2006 raised
58 billion poultry, 1.3 billion pigs and around 540 million cattle worldwide (FAOstat
2009).
5 Enhanced sustainability contribution from animal production
Four measures enhancing the contribution from animal production to global sustainability
are presented below. They represent substantial potentials for win3 solutions (i.e. eco-
logical, economic and social sustainability) not earlier known, where the same measure
substantially improves
• Economic sustainability through farmers net incomes, thus the viability of rural
societies,
• Ecological sustainability through decreased ecological footprints for the same
production regarding natural resource use as well as emissions, and
• Social sustainability through improved food security.
The measures are as follows: (1) decreased amounts of chicken meat consumed in
developed countries; (2) utilise the full potential of ruminants to produce valuable food
from otherwise marginal agricultural land that way improving global food security and
releasing good agricultural land for biofuel production (when food supply needs have been
met); (3) improved milk yield per cow as global average that way decreasing feed (i.e.
land) appropriation per kg milk produced; (4) increase feed efficiency in milk production in
developed nations while maintaining high production levels per cow.
(1) The first measure was chosen, due to two reasons. In the debate regarding climate
change and animal production, it is often claimed that if animal products are to be con-
sumed, chose pork or chicken meat due to the higher feeding efficiency compared to
ruminant products. Often, it is then ignored that monogastrics such as pigs and poultry,
compete with humans about food/feed. Furthermore, as monogastric animals demand quite
high shares of soymeal (or soymeal substitutes) in their feeding rations, they on the margin
1004 S. Hellstrand
123

may cause tropical deforestation. (2) Of agricultural land, 3.4 billion ha are classed as
permanent pastures of a total of 4.9 billion ha. Of arable land of 1.4 billion ha, a substantial
fraction, which often is poorer in quality, is used to produce ley and coarse grains as feeds,
e.g., to ruminants. The case of agriculture in the northern parts of Sweden is used to
illustrate how otherwise marginal agroecosystems through ruminant production may
contribute to a spectrum of sustainability assets, where this type of production systems are
important on global scale, not the least for the close to 1 billion of the poorest people,
dependent on cattle production in marginal socio-ecological systems. Northern Sweden, of
course, does not belong to this class. However, the general significance for global food
security of this kind of marginal agroecosystems can be illustrated by this example. (3) In
the debate, a common proposal is that through decreased ruminant production, land earlier
used to produce feeds can be released to produce crops for human consumption or bio-
energy purposes. In developed nations, the increase in milk yield per cow during the
twentieth century is quite amazing. This has substantially improved the natural resource
efficiency in production. A corresponding development of milk yields per cow can be
anticipated globally. This illustrates how improved ruminant production may at the same
time produce the same amount of products and decrease land appropriated. (4) Hellstrand
(2006) shoved a fast increase in the use of crop protein feeds in Swedish cattle and milk
production 1991–1999, with associated substantial negative sustainability impacts. In an
effort to probe whether this was a change towards a lower feeding efficiency level common
globally; data from international official sources were combined, suggesting that the
Swedish trend was towards a situation that is common in milk production in OECD
nations. Of total cow milk produced globally, 48 % come from OECD nations (analysis of
data from FAOstat3). This suggests that it is alright to utilise the results from Sweden
(Hellstrand 2006) to get a first-time measure on global level of sustainability improvements
to obtain by increased feeding efficiency at constant milk yield. As the presentation above
shoves these choices partly are a function of the own pre-understanding of global animal
production systems, thus has an element of arbitrary choices.
Cattle and milk production are focused. The first reason is the significance of cattle
production globally. On global scale, milk alone provides 36 % of total consumption of
energy from animal products, milk and meat from ruminants 47 % while products from pig
meat, poultry meat and eggs together represent 42 %. For protein, the corresponding values
are 28 % for milk, products from ruminants 38 %, and pig meat, poultry meat and eggs
together 35 %. Among the 20 most valuable agricultural products in 2007, animal products
contributed with 50 %, and among the contribution from animal products, ruminant
products represent 58 % (milk alone contributed with 34 % of the whole) while meat from
poultry and pigs together with egg represented the remaining 42 %. The significance of
ruminant production in terms of food supply and in economic values is reflected in the area
of agricultural land appropriated. Permanent pasture corresponds to 69 % of all agricultural
land where ruminants are the dominating ‘‘harvesting equipment.’’4 The second reason is
that a common interpretation is that the high share of agricultural land supporting ruminant
production systems reflects genuinely inefficient choices among the native population as kg
of food produced per ha is low compared to other agroecosystems (see Azar 2011; Chum
et al. 2011; Wirsenius et al. 2010, 2011). I suggest that it is the other way around: The high
share of global agricultural land supporting ruminant production systems illustrates that
thousands of years of selection of farming systems supporting human societies has proven
3 http://faostat.fao.org/site/569/DesktopDefault.aspx?PageID=569#ancor, accessed 2012-10-18.4 Based on own processing of data from FAOstat (2009).
Animal production in a sustainable agriculture 1005
123

that this is efficient land use. Other land-use options have not been competitive in these
eco-agro-social contexts.
A third reason to focus cattle and milk production is to provide some data regarding the
resource efficiency of ruminant production systems in a broader sustainability context than
otherwise common. As just shown, it can be argued that ruminant production is resource-
efficient both in developing and developed nations where the production options in
available agroecosystems otherwise are limited. Lindberg and Wiktorsson (1995) who
analysed the efficiency by which protein in feeds were converted to food (see Table 1),
showed that this was the case in the Swedish context.
Conversion efficiencies in milk, and integrated milk and cattle meat production, are
high compared with any other production system. This is despite the lower quality of the
feeds they consume compared to other animal systems. Ruminants can maintain high
conversion efficiencies for protein while using protein of lower quality than monogastric
animals. The authors provide similar results with high energy conversion efficiencies for
milk production compared to pig and poultry.
Table 2 summarises impacts on land appropriated, global food security and climate
change of the four measures analysed.
Based on Swedish production technology, measure 1 estimates the impact of reducing
chicken consumption by 7 g per capita and day in developed nations. The climate change
effect through decreased pressure on tropical forests was estimated using methodology and
data from FAO (2006). FAO estimates the amount of carbon in soils and in living biomass
for forests, pastures and arable land. At deforestation, a huge amount of carbon in the
biomass of forests are oxidised to carbon dioxide. That process may take decades.
Eventually, all carbon has been oxidised. FAO allocates the cumulative amount of carbon
dioxide emitted through this path to the year of clearing the land. This approach can be
criticised as it implies that in the same accounts, figures regarding stocks are added to
figures regarding fluxes. Furthermore, this measure is essential for the overall results in
FAO (2006). Of total emissions of greenhouse gases, 34 % relates to deforestation. In
Table 2, the expression ‘‘one-time event’’ is used to distinguish estimates related to the
oxidisation of a stock of carbon from estimates of annual fluxes.
Impacts are estimated on global scale. Measure 2 investigates the importance of uti-
lising ruminants as ruminants, that is, forages dominate the feeding rations. In the northern
Table 1 Efficiencies in the conversion of proteins in feeds to protein in food in some animal productionbranches, given Swedish conditions around 1990 (based on Lindberg and Wiktorsson 1995)
Protein in animal productsthrough protein in feeds
Milk 0.37
Cattle meata 0.18
Meat and milk from the dairy cow stock 0.33b
Cattle meat, cows only for meat production 0.07
Egg 0.34
Chicken meata 0.36
Pig meata 0.18
a The terms ‘‘cattle meat,’’ ‘‘pig meat’’ and ‘‘chicken meat,’’ respectively, are used, as these are the termsused in FAOstatb This is the average value estimated for the protein from the mix of meat and milk delivered from the stockof dairy cows
1006 S. Hellstrand
123

Table
2Sustainabilityim
pactsoffourmeasuresin
anim
alproduction
Measure
Agriculturallandreleased,
millionha
Foodsecurity,
millionpeople,
protein
supply
Climatechange,
gigatonCO2
equivalents
Comment
1.Decreased
consumption
chicken
meat,7gper
capitaandday
developed
nations
16.0
(9.1
soybeans;7.0
wheat
production)
470
-5.2
asaonetim
eevent
Landestimated
throughglobal
averageyieldsfor
concerned
crops
2.Ruminants
usedas
ruminants
onotherwise
marginal
agroecosystem
s(400,000ha)
0.42,ofwhich0.29isin
Europeand0.13in
Brazil
14.1
-0.09as
aonetim
eevent
?0.0007
Swedishlevel;decreased
clim
atechangeim
pactthrough
decreaselandpressure
andincreasedthroughmore
methaneem
issions;onglobal
level,thereare3.4
billion
hamarginal
landas
pastureland
3.Increasedmilkproduction
per
anim
alglobally
with
constanttotalproduction
150
44%
ofcurrentappropriationformilkproduction
released,divided
onpasture
landandarable
land
proportionally
4.Increasedfeeding
efficiency
51ofwhich32aretropical
forests
1,300
-22.4
asaonetim
eevent
Increasedeconomic
resultwitharound40billionUS$
Summed
effectsmeasure
1,3
and4
217ofwhich41aretropical
forests,67arearable
land
specified
1,770
-27.6
67millionhaspecified
asarable
land,150notspecified
Fordetailsofalternative2–4,seeHellstrandandYan
(2009);foralternative1contact
theauthor
Animal production in a sustainable agriculture 1007
123

parts of Sweden, 400,000 ha arable land produce forages and coarse grain. If the total
production was used for milk production, the milk production could increase with a factor
3.5. The measure was originally developed in order to illustrate the importance of a
combined eco-agro-social perspective of animal production. The northern part of Sweden
is located at the same latitude as the northern half of Hudson Bay. Although the Gulf
Stream makes the climate milder, the agroecosystems of this area are marginal. They are
best suited for the production of forages (pasture, hay, silage) and to some extent coarse
grains (oats and barley). Through ruminants, these areas can make substantial contributions
to a sustainable development, not the least to global food security (Hellstrand and Yan
2009). Measure 3 examines the importance of increasing the production capacity per cow
assuming constant total production of milk globally. At the global production level of
2007, every kg milk produced cost 13.7 MJ (ME) (Metabolizable Energy). The production
is slightly less than 2,000 kg per cow. If the production level per cow is doubled, the
amount of energy needed per kg milk produced is decreased to 9.7 MJ ME. At the Swedish
production level in 2000 (8,000 kg milk), one kg milk on average costs 7.7 MJ ME to
produce. This level can be achieved on feeding rations with a high share of forages with an
energy content of[10 MJ ME per kg dry matter (DM), and coarse grains supplemented
with some crop protein feeds. The measure shows the sustainability gains of increasing the
average global production level with a factor four to the Swedish level around 2000
(Hellstrand and Yan 2009).
Measure 4 presents the results of increased feeding efficiency in global milk production
at constant production level per cow. The basis is the spectrum of sustainability costs
associated with the increase in concentrate feeding, especially crop protein feeds, in
Sweden to cattle from 1991 to 1999 identified by Hellstrand (2006, 2008a). Although cattle
have the capacity to utilise protein in forages in the production of food, the reality is that
high amounts of high-quality feeds such as soymeal, rape meal and other crop protein feeds
often are used in cattle production. From 1991 to 1999, the amount of crop protein feeds in
purchased feeds to cattle (85 % of purchased feeds to cattle go to dairy cows) in Sweden
increased from 201 million kg to 536 million kg (Hellstrand 2006). In 2006, the amount
was 644 million kg, following the same route of estimation. This results in an application
of 320 kg of crop protein feeds per dairy cow in 1991, increasing to 1,020 in 1999 and
1,410 in 2006. This did not increase yields and thus depressed the economic result (ibid.).
Official statistics suggest that the nitrogen efficiency in Swedish milk production from
1991 to 2006 moved towards a lower level common in developed nations.
Thus, of total influxes of nitrogen on farm level in Sweden in 2006 of 72.6 million kg
through purchased feeds, 66 % was through feeds to cattle. Protein feeds to cattle such as
soymeal alone contributed with 52 % of the total of this nitrogen influx (Fig. 1).
Figure 2 shows that the high influx of nitrogen on farm level through purchased feeds to
cattle in 2006 is in line with a fast increase from 1991 and onwards. As milk production
over this period was constant, this reflects a decreased feeding efficiency in terms of
amount of milk produced per kg protein feed. An important question is why this occurred.
My proposal is that the overall effect of three major changes of official feeding standards in
Sweden during the 1990s in combination with how organisations dominating extension
services in this area to commercial farms applied the same standards caused this decrease
in feeding efficiency. This is further treated in Sect. 6. It can be noted that the dominating
firm producing purchased feeds, Lantmannen, in the second half of the 1990s introduced
their own feeding standards and feed evaluation system in Sweden called the LFU system.
Quite surprisingly, their ambition was to press down the amount of crop protein feeds, that
is, their own products, in the feeding rations (see Lantmannen 2003). The LFU system
1008 S. Hellstrand
123

steers towards a higher feeding efficiency. This follows from the comparison of feeding
standard systems in Norfor (2004).
A few of the leading national researchers in rumen physiology in Sweden had around
1995 left SUAS and started to work at Lantmannen, E. Lindgren and M. Murphy. They
Mill
ion
kg
N
0
10
20
30
40
50
60
70
80
Cattle,milk Cattle, meat Pig Poultry Total
Grain, sum
6 1 4 5 17
Protein feeds from crops, sum
32 6 6 9 52
Protein feeds, animal products, sum
0 0 0 0 0
Sugar feeds
3 0 0 0 3
Total sum
41 7 11 14 73
Fig. 1 Influxes of nitrogen on farm level through purchased feeds in Swedish animal production systems in2006. Material and method Hellstrand (2006), analysis updated by data for 2006
Fig. 2 Nitrogen influxes through purchased feeds to cattle production in Sweden 1989–1999 and 2006.Source: See Fig. 1. Of purchased feeds to cattle, 85 % are feeds to dairy cows
Animal production in a sustainable agriculture 1009
123

constructed the LFU system. Thus, by their actions, they showed such a low confidence in
the official feeding standard system in Sweden, after three major changes 1991–1995, that
they rejected the whole system and constructed another one from other points of departure.
This suggests another possible cause behind discussed trends in feeding of purchased feeds,
especially protein feeds. Two substantially different systems regarding feeding standards
and feed evaluation for dairy cows are in charge in Sweden since around 1997, one is used
by the organisation that dominates the production of purchased feeds when they design
what they believe will be optimal for the farmers, another and very different system are
used when the organisation dominating extension services actually from their believe try to
optimise the feeding rations to farmers. National trends regarding the use of crop protein
feeds, the increase in milk yield per cow and total production of milk show that this has not
worked out well. Thus, the word ‘‘believe’’ is relevant. For the Swedish farmers, it should
be a concern that they through two of their own organisations pay twice for the mainte-
nance of two conflicting feeding standard systems that in combination results in suboptimal
feeding strategies.
As shown in some more detail later, the trend in Swedish milk production is towards a
lower nitrogen efficiency earlier established in other OECD nations. Milk production per
kg feed (dry matter) consumed, and the nitrogen efficiency is higher in diets in Northern
Europe than in North America (Huhtanen and Hristov 2009).
The impact of an increased production level per cow, releasing 150 million ha of
agricultural land, would substantially improve the capacity to support global food security
and/or the carbon sink capacity. This measure has been obtained by assuming that milk
yield on global level was increased a factor four per cow and year. That would decrease the
energy demand per kg milk produced, thus also the total feed requirements for a constant
global production that is transferred to an area of land supporting the feeds required. For
details, see Hellstrand and Yan (2009).
As the 150 million ha is not divided in pastureland and arable land, estimates partitioned
on these different qualities of agricultural land cannot be provided.
FAO (2006) estimated the contribution from the livestock sector to climate change
emissions to 7.1 gigaton of a total anthropogenic contribution of 40 gigaton. Compared to
those estimates, the potentials to decrease the contribution to climate change through
measures 1–4 in Table 2 are significant. It shall be noted that here the mitigation option
that FAO (2006) identified through the carbon sink capacity in grassland and rangeland of
6.2 gigaton carbon dioxide (87 % of the FAO estimate of total contribution from livestock
sector to emissions of climate change gases) is not considered. Nor the discussion earlier
presented in this paper about the accurate reference value to use, before humans become
major ecological actors (Sect. 1).
The release of 217 million ha agricultural land, of which 67 are specified as arable land
(Table 2), are of global importance, given that total area of arable land is 1.4 billion ha.
The reduced need of 41 million ha of soybean production as estimated is compared to the
use of soymeal as feeds that in 2003 corresponded to 70 million ha soybean production (see
below).
The increased feeding efficiency would increase farmer’s incomes by 1.2 billion SEK5
(Hellstrand 2008a). On a principal level, the route for achieving this is discussed in Sect. 6.
SEPA (2009b) has presented a proposal for how Sweden should reduce its nitrogen and
phosphorus discharges to the Baltic Sea with 21 million kg. In their proposal, 5.5 million
kg nitrogen reduction is lacking. The marginal cost for reduced discharges is around 1,000
5 Currently (October 2012), 6.5 SEK correspond to around 1 US$ and 8.5 SEK correspond to around 1 €.
1010 S. Hellstrand
123

SEK per kg nitrogen. Reclamation of the same efficiency in the use of purchased feeds in
Swedish milk production from the lower level in 1999 to the higher level as of 1991 would
result in annual societal benefits from reduced contribution to global climate change,
acidification, and eutrophication from emissions of N2O and ammonia of 2.7 billion SEK.6
If allocating the cost of yearly using of the natural capital tropical forests over a period of
50 years, and valued through the emissions of carbon dioxide the deforestation causes, and
assuming Swedish preferences for avoiding such emissions used by authorities, the annual
cost is 3.4 billion SEK (assuming zero interest rate). Thus, the societal value of increasing
the feeding efficiency sums to 6.1 billion SEK to be added to the estimated value of its
contribution (2.5 million kg N) in the reduction of nitrogen discharges to the sea in that
part of the Baltic Sea where the proposals from SEPA do not meet the set objectives, with a
marginal price of 1,000 SEK per kg/N that is estimated at 2.5 billion SEK. This gives in
total 8.6 billion SEK.7 To that, the reduced production costs for the farmers of 1.2 billion
SEK shall be added to get an estimate of the welfare-economic impacts, through mentioned
factors and given preferences, expressed in the Swedish socio-economic system. Thus, in
total, this measure—reclaiming the higher nitrogen efficiency in Swedish milk production
in 1991 from the lower level in 1999—is estimated to increase the welfare-economic value
of Swedish milk production by 9.8 billion SEK (slightly more than 1 billion €), allocatedon approximately 400,000 dairy cows. This corresponds to the value of the total milk
production in Sweden. In this calculation, the value of a reduction of nitrogen discharges
with 3.5 million kg in other parts of the Baltic Sea is not considered.
Of course, this is a theoretical approach. One can ask if anyone really cares about, for
example, deforestation. Swedish authorities use this kind of estimates in connection to
agricultural policies, environmental policies and when ranking infrastructural investment
alternatives. It is one way to evaluate the size of external effects. It shall be remembered
that this relates to preferences in the Swedish society. Preferences are context-dependent in
time and space. They can hardly be used as a basis for the evaluation of global impacts.
Their relevance is to show whether the welfare impacts are substantial or not.
Other estimates provided in this paper, where production economic effects of
improvements in milk production are estimated, are substantially stronger related to the
production biological as well as the natural resource base. Such measures have a stronger
relevance on global scale, also due to the balancing effect of the world market. The
majority of sustainability impacts analysed relate to the analysis of causal chains in terms
of natural and agricultural sciences. They have the highest general relevance of the
mentioned level of measures. In general, the analysed systems are complex. Therefore, all
estimates provided should be interpreted with an appropriate level of common sense.
Similar substantial potentials for reduced discharges of phosphorus are obtained when
the same route of calculations is performed, keeping track of fluxes of phosphorus.
The eutrophication issue is interesting. Increased feeding efficiency in Swedish milk
production in terms of a higher milk output per kg crop protein feed in combination with a
reallocation of milk production to areas with low contributions of nitrogen discharges to
the Baltic Sea per kg milk produced (due to a combination of agricultural practices and
environmental conditions) is estimated to decrease nitrogen discharges to the sea with
6 ? 6.4 million kg (Hellstrand 2008a, b). The importance of these measures is not com-
monly known; neither to reclaim a higher feeding efficiency; nor the regional ecological
structural rationalisation indicated. Other sustainability gains such as conservation of
6 For details in the calculations, contact the author.7 This is based on prices expressed in the Swedish society and economy.
Animal production in a sustainable agriculture 1011
123

tropical forests, preservation of the cultural landscape in marginal areas in Sweden, the
conservation of biodiversity and a more efficient use of the non-renewable resource
phosphorus are favoured.
In 2007, global production of soybeans appropriated 90 million ha,8 of which 70 million
ha were used to produce feed. Table 2 identifies a potential to reduce this appropriation by
9 million ha if reducing the consumption of chicken meat consumed in developed nations,
and by 32 million ha with an increased feeding efficiency in milk production. The esti-
mates are rough but they indicate the magnitude of potentials, since they are based on solid
knowledge within agricultural sciences especially animal husbandry. Still, this is new
knowledge to most people in the field of agriculture and environment.
On the other hand, the results presented are basically a product of applying the same
methods and knowledge that I successfully used when being the main responsible for
extension services regarding animal production in the county of Varmland in Sweden
1982–1986. At that time, that represented the main stream in animal husbandry in Sweden
and dairy production science and had been doing so during most of the twentieth century.
At individual farms, improvements in production biological and economic terms up to
twice the size per animal were achieved (see Hellstrand 1988), as the ones that give the
potentials for improvements presented in Tables 2 and 3. The core of the model for the
analysis of production biological and economic performance in milk production generating
the results presented in this paper was first presented in two publications from the Swedish
University of Agricultural Sciences more than 20 years ago (Hellstrand 1988, 1989). This
proven empirical relevance shows that the philosophy underpinning the analyses presented
in this paper is relevant on real-world farms. The proposals regarding feeding standards as
well as methods for the analysis of environmental impacts criticised below either have
Table 3 Sustainability gains by reclaimed feeding nitrogen efficiency in Swedish cattle production as of1991 from the level 2006, regarding nitrogen from crop protein crops in purchased feeds (based onHellstrand 2006, 2008a, b, 2010)
Dairyproduction
Cattlemeat
Sum cattleproduction
Ecological gains
Decreased nitrogen influx, million kg 21.9 4.4 26.4
Decreased appropriation of crop protein feeds,million kg soymeal equivalents
269 55 323
Decreased eutrophication of the Baltic Sea, million kg N 6.5 1.2 7.7
Deceased contribution climate change, onetime event,million ton CO2
108 22 129
Tropical reforestation, potential in ha 154,000 31,000 185,000
Economic gains
Increased farmers economic result, billion SEKa 1.5 0.30 1.8
Social gains
Increased food supply capacity, protein supply million people 6.3 1.3 7.6
a SEK is Swedish Crowns, 1 US$ corresponds to around 6.5 SEK; 1 € to 8.5 SEK
Not all effects are additive
8 From FAOstat, http://faostat.fao.org/site/567/DesktopDefault.aspx?PageID=567#ancor, accessed 2009-08-16.
1012 S. Hellstrand
123

records from real-world systems that sign problems, or have not been probed against
reality.
6 Methodological issues
There are two methodological issues needed to review further:
• Do feeding standards to dairy cows in developed nations result in feeding strategies that
are suboptimal in terms of farmer’s economic result and the sustainability
performance?
• What are the sustainability risks of extrapolating methods developed within engineer-
ing sciences in the evaluation of the sustainability performance of production systems
in general and ruminant production systems in particular?
Feeding standards are the rules used to estimate the feeding rations that meet the
physiological nutritive requirements of the individual animal. Feeding standards are rel-
evant when cows are fed in cowshed as well as during pasture.
6.1 Feeding standards to dairy cows
The use of crop protein feeds in Swedish cattle production increased dramatically from
1991 to 2006, from 201 million kg to 644 million kg. Sustainability aspects of these trends
are analysed in the following. Furthermore, the international relevance of the Swedish
trends is examined. Then, the issue whether this is caused by the design of feeding
standards to dairy cows is treated.
6.1.1 Feeding trends and sustainability impacts
Figure 1 shows the influxes of nitrogen through purchased feeds to different animal pro-
duction systems in Sweden in 2006. Fluxes of nitrogen and of protein are similar measures.
Crude protein in feeds to dairy cows is defined as amount of nitrogen multiplied with 6.25.
In the Swedish system, 66 % of these influxes relates to cattle production.
Figure 2 shows the trends regarding nitrogen influxes through purchased feeds within
cattle production in Sweden 1989–1999 and 2006. A phase of fast decrease in nitrogen
influxes via purchased feeds to cattle 1989–1991 was abruptly changed to a period of a fast
increase from 1991 to 1999 with a prolongation to 2006. Of the total amount of purchased
feeds to cattle, approximately 85 % are classed as feeds to dairy cows. The dominating part
of the increase was due to the increased use of crop protein feeds (Fig. 2).
In Fig. 3, the results in Fig. 1 are expressed in terms of soymeal equivalents in million
kg, allocated on the major animal production branches in Sweden. The reason is that
soymeal has a similar role as oil on the global energy market. In 2002, the feed demand for
soymeal was 130 million tonnes, while it was 20.4 million tonnes for rape and mustard
seed meal, the second largest oilcake (FAO 2006). Thus, based on the crude protein content
of different crop protein feeds, standardization can be made to soymeal equivalents. Here,
two allocation problems have been treated. It is assumed that feeds for milk production
relates to the dairy cow, that is, feeds for milk and maintenance. Feeds for the production
of the recruitment heifer are treated as a cost for meat production, which is eventually
delivered when the dairy cow is slaughtered. Feeds for gestation, growth and maintenance
during the growth period are included. Gestation requirements are requirements for the
Animal production in a sustainable agriculture 1013
123

growth of the foetus, that is, for meat production. This implies that of the total nitrogen
influx to cattle via crop protein feeds in purchased feeds, 15 % is allocated to meat
production and 85 % to milk production.
Regarding poultry production, in the official feed statistics in Sweden, 44 % is classed
as feeds to laying hens, 40 is for chicken meat production and 2 % go to turkey production.
It is assumed that all purchased feeds are evenly allocated to egg and poultry meat pro-
duction. Feeding standards suggest that for per kg feed, the amount of crop protein feeds is
2.73 times higher in feeds to chicken meat production than for laying hens (30 % compared
to 11). This is assumed to be the case also in purchased feeds to poultry production. This
gives the results in Fig. 3.
By expressing the use of crop protein feeds in soymeal equivalents, and relating it to the
production levels, it is possible to estimate different sustainability impacts per kg animal
product. These measures support farmers to improve their sustainability efficiency, facil-
itate for authorities to establish relevant sustainability standards for farmers to meet and
can form a basis for payment systems, for example, within the European Agricultural
Policy, providing incentives that make it rational for farmers to contribute to a sustainable
development. Of course, they can be used in direct communication between producers and
consumers when reliable data regarding sustainability performance make a difference.
The basis for the analysis is Hellstrand (2006) with the methodology developed and the
results it generated in the analysis of sustainability impacts due to the increased use of
concentrates in Swedish milk production 1991–1999, combined with the information in
FAO (2006) regarding the impact on carbon dioxide emission when tropical forest are
converted to arable land. By considering yields of soybeans per ha and the fraction of total
yield that becomes soymeal, the results in Fig. 4 are obtained.
Figure 4 provides results regarding impact on deforestation and food security through
the impact on supply of protein for humans when protein feeds are fed to animals that can
be used by humans.
Figure 5 shows the impact on global climate change.
Fig. 3 Use of crop protein feeds in purchased feeds in soymeal equivalents in million kg in Swedish animalproduction in 2006. Source: Hellstrand (2010)
1014 S. Hellstrand
123

Table 3 gives sustainability gains, if the higher nitrogen efficiency in the use of crop
protein feeds in purchased feeds to cattle in Sweden of 1991 was once again obtained from
the lower efficiency level as of 2006. Here, the results are specified for milk and meat
production, respectively.
The information above implies that
• important sustainability aspects are closely related to the use of crop protein feeds,
• they are closely related to the nitrogen efficiency in animal production branches, and
• in the Swedish context, milk production plays a major role.
Figures 1, 2, 3, 4, 5 illustrate how the management of animals on the individual herd
level can be linked to global sustainability through impacts on climate change, food
security and tropical deforestation per kg product, that is, a contribution when considering
global impacts in the everyday operations in animal production on commercial herd level.
In the prolongation, it indicates how future payment systems, for example, in the European
Common Agricultural Policy, can be based on evaluating systems informing about the
contribution at individual farm level to societal objectives from local to global community
level.
Fig. 4 Sustainability impacts per kg animal product due to the use of crop protein feeds in Swedish animalproduction in 2006. Source: Hellstrand (2010). Deforestation concerns tropical deforestation because of theuse of crop protein feeds used in the production measured in soymeal equivalents. The amount of soymealequivalents represents an area of tropical deforestation on the margin, for producing more soymeal to theworld market that is eventually used in the concerned production. This relates to the concept of ecologicalfootprints. In a corresponding way, the use of crop protein feeds in animal production if directly used byhumans as feed can support global food security, in terms of human protein requirements fulfilled. Thesetwo effects are of the kind either or. Daily production per capita and day in Sweden was in 2006 41 g cattlemeat, 30 g chicken meat, 80 g pig meat, 30 g eggs and 954 g milk. Production from http://faostat.fao.org/site/569/DesktopDefault.aspx?PageID=569#ancor, Swedish population from http://www.ssd.scb.se/databaser/makro/SaveShow.asp, both accessed 2010-06-04
Animal production in a sustainable agriculture 1015
123

Figure 6 indicates the international relevance of the information in Figure Figs. 1,
2, 3, 4, 5. It presents the amount of nitrogen in manure from dairy cows in g per kg
milk produced in OECD nations. The estimates are the ration between nitrogen
Fig. 5 Impact on global climate change through deforestation due to the use of crop protein feeds inSwedish animal production in 2006. Source: Hellstrand (2010). For the production per capita and day in2006, see Fig. 4
0
5
10
15
20
25
30
35
0 2 000 4 000 6 000 8 000 10 000 12 000
g N
in m
anu
re p
er k
g m
ilk
Yield, kg milk
g N/kg milk
Trend
Fig. 6 The amount of nitrogen in manure from dairy cows in g per kg milk produced at different productionlevels among OECD nations. Source: Hellstrand (2010)
1016 S. Hellstrand
123

effluxes in manure per dairy cow9 and milk production per cow from FAOstat in
OECD nations.10
The nitrogen balances reflect the nitrogen/protein content in the feeding ration and the
total amounts of feeds consumed.
The figure shows that the nitrogen efficiency tends to increase with increasing yields, at
the same time as the relationship is not strong: other factors explain 78 % of the variation
in Fig. 6. Korea combines a high production level, around 9,500 kg per cow, with a high
nitrogen efficiency. The amount of nitrogen in manure (‘‘manure’’ here is manure ? urine)
is 8.8 g per kg milk, which is 3.3 g less than the expected value at this high production
level. USA has a somewhat lower production, 8,600 kg per cow and year, with 17.3 g
nitrogen in manure per kg milk, which is 4.0 g more than expected due to the milk yield
level. Among nations with high production levels ([7,000 kg per cow and year), the
Netherlands and Denmark have low nitrogen efficiencies; 3 and 2.3 g nitrogen more in
manure per kg milk than expected at their respective production levels. Finland is the only
nation in the group with high production levels with a lower value than the level predicted
from yield, 0.3 g below the trend. The Swedish value in Fig. 6 is close to the expected
based on the regression curve. Thus, Fig. 6 indicates that the decreasing nitrogen efficiency
in Swedish milk production from 1991 to 2006 is towards a lower efficiency level common
among OECD nations. That suggests that the decreasing efficiency in Sweden in that
period is an estimate of a potential for improvement, which can be used as a departure for a
first rough estimate of global potentials. Hellstrand (2006) investigated whether there were
good economic reasons for this decreasing efficiency in the use of crop protein feeds. He
found none. Hellstrand (2008a), in a study on behalf of SEPA, investigated the causes
behind this trend. The major reason (ibid.) was the abandon of basic principles ruling
feeding strategies in Swedish milk production during most of the twentieth century up to
the beginning of the 1990s, concerning how to utilise the ‘‘law’’ of diminishing returns and
Liebig’s ‘‘law’’ of the minimum (see Wiktorsson 1979; Liebig 1840) when searching the
economic optimal feeding intensity. Since 1995, the economic result at commercial herd
level no longer influences the design of feeding standards in Sweden. For a late example of
how to adjust feeding standards due to the variation in prices on feed inputs and milk
output in the Swedish system in order to support the economic result on farm level, see
Hellstrand (1989).
With a global production of 578 million tonnes cow milk in 200811 (FAOstat 2009;
Hellstrand 2010), the estimate for Korea suggests a possibility for a nitrogen efflux in
manure of 5,000 million kg, while with the lower efficiency of the USA, the nitrogen efflux
in manure would be 9,800 million kg, that is, 4,800 million kg nitrogen more. 4,800
million kg nitrogen related to nitrogen in soymeal, correspond to around 34 million ha
soybeans production. From that measure, the possible impact in climate change, on global
food security, and on farmers’ net income can be estimated through same route as earlier
used.
To some extent, the differences in values for Korea and USA can be caused by dif-
ferences in measuring methods and data accurateness. The objective of increasing the
sustainability contribution from animal production globally implies a need to further
9 From environmental performance of agriculture in OECD countries since 1990, http://stats.oecd.org/Index.aspx?datasetcode=ENVPERFINDIC_TAD_2008, accessed in August 2009.10 From http://faostat.fao.org/site/569/DesktopDefault.aspx?PageID=569, accessed 2009-08-08.11 FAOstat. http://faostat.fao.org/site/569/DesktopDefault.aspx?PageID=569#ancor, accessed at 2010-01-04.
Animal production in a sustainable agriculture 1017
123

analyse these values, their differences and causes. That supports methodological stan-
dardisation and improvement in international statistics, and the possibility to learn between
nations.
The Swedish trend (Fig. 2) and the significant variation in nitrogen efficiency among
nations (Fig. 6) are two arguments suggesting that the options for increased nitrogen
efficiency in milk production globally are substantial, where this can significantly improve
a spectrum of important sustainability aspects through paths discussed above.
6.1.2 Feeding standards feeding feeding trends
The sharp change of the Swedish trend, where a decreasing influx of nitrogen via crop
protein feeds to cattle in 1991 was changed to a fast increase, appeared at the same time as
a major change in protein evaluation and feeding standard system to dairy cows was
implemented. In 1995, the energy feeding standard system to dairy cows was fundamen-
tally changed, while at the same time, major changes of the new protein feeding standard
system were made. These changes in feeding standards, I suggest, were driving forces
behind the increasing influxes of nitrogen trough crop protein feeds (see also Hellstrand
2008a).
In 1991, the protein evaluation system was changed from digestible crude protein
(dcp) to the AAT/PBV system. Gustafsson (1990) probed the outcome of the new system
before its implementation in a field study covering 29 cow herds. Regression analysis
resulted in statistical significance for the relationship between milk yield (ECM; energy-
corrected milk) and consumption of dcp and PBV, respectively, but not between milk
yield and AAT. This was quite surprising, as AAT was supposed to provide better
estimates of the protein quality than dcp and PBV function as a waste fraction, not
supporting milk production. The results suggested that the old system was better than the
new system, and that the assumed waste fraction contained protein with a higher capacity
to support milk production than the assumed quality fraction. Furthermore, the study
showed that energy allowances were on average 14 % above assumed requirements
(according to official feeding standards) while the protein allowances were 13 % above
measured in terms of dcp. Measured in terms of AAT and using the standards that some
year later came into practise, the protein allowance was only 4 % above the feeding
standards. Thus, having the same cows, feeds and production levels, and only changing
the protein measure used to estimate the feeding rations that exactly would balance
assumed requirements of energy and protein, would result in a substantial reallocation of
concentrates from coarse grains to crop protein feeds such as soymeal. Assuming that the
cows in total consumed 135 kg nitrogen with the dcp system per lactation, and with
the number of dairy cows in Sweden, the year of the field study (1987/1988) of 564,550,
the total influx of nitrogen with feeds to dairy cows would be 76 million kg. If, with the
new system we arrive at the same apparent balance between energy and protein, the shift
from the dcp system to the AAT system would instantly increase the protein allowance
with 1.13/1.04, i.e., 8.65 %. That would increase the influx of nitrogen to the stock of
dairy cows with 6.6 million kg through concentrates. Hellstrand (2006) estimated an
increase of nitrogen influxes via purchased feeds to cattle of 22.8 million kg from 1991
to 1999. Of that, 85 % can be allocated to dairy cows, that is, 19.4 million kg. The
results of Gustafsson suggest that 34 % of the increased influxes of nitrogen through
purchased feeds to dairy cows were caused by the introduction of the AAT/PBV system
during the production year 1991.
1018 S. Hellstrand
123

Hellstrand (2006) estimated the impact of increasing use of purchased feeds 1991–1999
on feeding efficiency to dairy cows considering changes in production levels and the
nutritive quality of forages. Hellstrand (2008a) investigated how changes in protein feeding
standards 1991 and 1995, and the change of ruling principles in energy standards in 1995
affected nitrogen influxes to dairy cows. He also evaluated the impact of recommendations
to further increase the protein allowances per kg milk above the official standards. The
source for the later was a study of future and efficient Swedish agriculture performed by
the Swedish Environmental Protection Agency (SEPA 1997).
Different paths through which these changes in feeding standards (with supporting feed
evaluation system) would affect feeding efficiency are:
• The substantial reduction of assumed available protein in forages (‘‘available’’ in terms
having feeding value) with the introduction of the AAT/PBV system,
• The increase in assumed protein requirements for maintenance in 1991 further
increased in 1995 with the AAT/PBV system,
• The change of ruling principle in 1995 for the energy standards from supporting
economically optimal feeding intensity to predict milk yield from feed intake,
• The choice to formulate a new energy standard to dairy cows based on the regression
analysis of results from feeding trials where in most trials, the cows consumed above
economic optimal levels,
• The change of protein standards to a principle where the amount of protein per energy
unit was assumed to be constant independent of production level while physiological
common knowledge states that low-lactating cows have a lower protein requirement
per unit energy due to the higher part of total requirements that are related to
maintenance needs, and
• A fashion established in extension services that high-yielding dairy cows demand more
protein than the official feeding standards suggest per kg milk produced.
Added to these paths were weaknesses in the probing of the changes made before full-
scale implementation. Thus, there was a combination of weaknesses in the theoretical and
empirical foundations of made changes, where the control system that should filter against
such weaknesses had a corresponding flaw:
The new energy standards introduced in 1995 were based on a work by a student in
agronomy (Andresen 199412); the change of the protein standards in 1995 was based on an
unpublished memo that the author himself around 10 years later could not find (see
Hellstrand 2008a; Sporndly 1995). It is impossible to probe the quality of the analysis
resulting in the proposed change in protein standards in a process that follows standard
criteria of good scientific praxis simply as the analysis itself no longer exists.
The rationale for the change of the energy standards in 1995 was that high-yielding
cows demand more feeds per kg milk than low-lactation cows. The physiological mech-
anisms behind this assumption are clearly laid out in NRC (2001).13 That would result in a
curvilinear relationship between feed intake and milk production. The intention, therefore,
was to replace a linear relationship between energy intake and milk yield with a curvilinear
12 This is not a critique against this student work; it is a critique regarding the choice to base such afundamental change of such a fundamental relation in the most important production branch in Swedishagriculture on a work with such a low formal quality. This has an element of playing hazard with farmers’economy through decreased natural resource efficiency (feed efficiency) as well as with the environmentthrough the spectrum of environmental costs that may cause.13 The relevance of this assumption when designing feeding strategies on commercial herd level can bequestioned. However, it is outside the scope of this article to treat that issue.
Animal production in a sustainable agriculture 1019
123

one (Andresen 1994; Gustafsson 2000; Norfor 2004). When analysing the mathematical
expression used to transform the earlier linear relation to a curvilinear one (Hellstrand
2008a), it shows that the outcome is a new linear relation. In one sense, this is not
surprising, as the earlier linear expression was modified by multiplying it with a constant,
then reducing the new value with a term. What as is a concern is that this indicates a lack in
the capacity among the group of scientists and other professionals that at that time were
responsible for the feeding standards to transform assumed physiological relations in milk
production to mathematical expressions. As these expressions steer the programmes by
which the feeding rations are calculated for most of the dairy cows in Sweden, this is not of
marginal importance. Furthermore, if in such a principally simple task, there are such
problems that by itself deflate the credibility regarding other and principally more complex
aspects to handle in feeding standards and supporting feed evaluation systems. Such cir-
cumstances might contribute to an understanding why Lantmannen around 1997 launched
an entirely different feeding standard and feed evaluation system (see Sect. 5).
The mode by which the feeding standards were applied in practice might further have
decreased the feeding efficiency. In an evaluation of the international relevance, it was
found that the Swedish feeding standards moved towards systems that already were
implemented in Denmark, the Netherlands and USA (Hellstrand 2008a). The data behind
Fig. 6 show that these nations are the ones with the lowest nitrogen efficiency among
nations with high production levels per cow in 2004, while the Swedish efficiency is at an
intermediate level.
Reasons why the changed feeding standards caused these effects are (ibid.):
• The protein evaluation and feeding standard system introduced in 1991 was in conflict
with basic principles regarding typical features of such complex systems that the
protein metabolism of ruminants have. Strict linear causal relations were presupposed
in the applied model of this complex system with mutual dependencies between
systems and system levels. Long chains of calculations were provided where each step
in the calculations decreased the accurateness of obtained estimates. Values of
parameters in each step were taken from different trials in different nations with their
own specific context, within which the values are relevant, while the relevance is
deteriorated when the same numeric values are used outside the contexts defining them.
• The energy feeding standard system was until 1994 based on the principle of
diminishing returns. That was expressed in the objective to find that energy feeding
intensity, which at the margin caused an increase in yield that had precisely the same
value as the costs for the feeds causing that increase in yield. From 1995, the objective
of the feeding standard was instead to predict the yield from the feed intake. This may
be of interest for a researcher but it is not the prioritised objective for owners of
commercial herds. Here, the objective is to arrive at the feeding intensity, that is, the
energy allowance per kg of milk, which maximise the economic result. This principle
ruled during most of the twentieth century in Sweden, until 1995, in the formulation of
energy standards to dairy cows, and still rules the yearly upgrading of the official
recommendations regarding fertiliser application rates considering changed prices of
fertilisers and crop products.
The same situation as in Sweden is at hand regarding the ruling principles of protein and
energy feeding standards and feed evaluation systems in other important milk-producing
nations (ibid.). This is an indication that the results from Sweden are of international
relevance.
1020 S. Hellstrand
123

6.2 Engineering science and sustainable ruminant production
Hellstrand et al. (2009) found that a central natural resource concept in physical resource
theory, exergy, is defined in a conceptual model of real-world systems where all process
restrictions that define ecological, economic and social systems are ignored. As a matter of
fact, the mere concept resource becomes meaningless given the condition for its definition
of thermodynamic ideality (ibid.) To discuss natural resource management strategies on
global scale based on concepts that lack relevance in real-world systems may cause
problems (ibid.).
Hellstrand et al. (2010) investigated a number of applications aiming at supporting a
sustainable development at operative level. They all have emerged from the basis of
engineering sciences. They had four factors in common,
(i) the physiological and biological aspects of the carrying capacity limits of ecosystems
are ignored,
(ii) ecosystems affected by production and consumption are located outside the system
borders,
(iii) the variation in the conditions of ecosystems in space and time is ignored, and
(iv) the capacity of ecosystems, managed and natural ones, to produce ecosystem goods
and services is ignored.
The examples were the following:
• The system of environmental and economic accounts in Sweden (Statistics Sweden
2009),14
• Analysis of the environmental impacts, quantifiable and non-quantifiable, from
Swedish agriculture, including upstream and downstream effects (Engstrom et al.
2007),
• Sustainable pig production (Stern et al. 2005),
• Sustainable milk production (Gunnarsson et al. 2005; Sonesson 2005),
• Life cycle assessment of milk production (Cederberg and Flysjo 2004; Cederberg et al.
2007),
• Life cycle assessment of seven different food items (LRF 2002),
• The Integrated Pollution Prevention and Control-directive and its BAT (Best Available
Technology) principle,15 supporting the development of sustainable industries in the
European Union,
• The Integrated Product Policy of European Union (Wijkman 2004),
• The main streams approach in life cycle assessment (Baumann and Tillman 2004), and
• The system conditions for sustainability of the natural step.16
The consequence is that none of these approaches comply with the principles for
sustainable development regarding its ecological dimensions as expressed by Millennium
Ecosystem Assessment (MEA 2009), OECD (2001) and the UN Millennium Goals (UN
2010). This is the logical consequence for these approaches common factors (i)–(iv) above.
14 The ‘‘environmental’’ aspects concern natural resources entering the economic system and emissionsleaving it. The environment itself is located outside the system borders of the system of environmentaleconomic accounts.15 http://eippcb.jrc.ec.europa.eu/reference/BREF/ppm_bref_1201.pdf, accessed 2012-10-19.16 http://www.thenaturalstep.org/the-system-conditions, accessed 2009-06-14.
Animal production in a sustainable agriculture 1021
123

A number of the examples above concern animal production system. Hellstrand et al.
(2010) found that their impact on agricultural sciences and policies from national
authorities as well as in the private sphere were substantial. If that conclusion is valid, as
well as that the conclusion that these examples are in conflict with the principles for
sustainable development regarding its ecological dimensions as expressed by Millennium
Ecosystem Assessment (MEA 2009), OECD (2001) and the UN Millennium Goals (UN
2010), then there is a problem. The possibility and significance of this problem is some-
what elaborated on below.
There are two reasons for why the evaluation of the sustainability performance of
ruminant production systems based on engineering sciences in Sweden has failed. Typi-
cally, the handling of (i) the metabolism of the cow in interaction with the feeds and (ii) the
environmental impacts of the production systems could be better. The short reason is that
they are products of engineering sciences, and engineering sciences do not have the
competence of excellence regarding the physiology of dairy cows or the ecological, eco-
nomic and social dimensions of a sustainable development.
As is shown in the following, this may cause substantial impacts on policies from local
to global level which ultimately can inflict global food security. This conclusion is so
serious that the analysis performed in this study needs to be presented in some detail,
thereby facilitating the reader to evaluate the accurateness of the conclusion.
The following will treat both weaknesses in engineering-based approaches, as well as
weaknesses in the feeding standard systems in Sweden, and the way they have been applied
the latest 20 years. The reason to treat them together is that
• If having accurate methods for the analysis of environmental performance, the
increasing environmental load associated with an increase in the use of crop protein
feeds to cattle with a factor 3.2 from 1991 to 2006 for a constant or decreasing
production had been detected;
• The huge differences in nitrogen efficiency and feeding strategies between conven-
tional and organic milk production cannot be understood, without understanding the
problems in the changes in the feedings standard systems from 1991 and onwards,
forcing organic producers to manipulate the feeding standard systems in order to be
able to feed the cows the amount of forages as the rules of organic milk production
state;
• The understanding of the previous two points is needed to see why an evaluation of the
sustainability profile of milk production should be based on the animal production and
supporting plant production that actually is at hand.
Results and policy suggestions based on the results in Cederberg and Flysjo (2004),
Cederberg et al. (2007), Wirsenius (2000, 2003a, b), Wirsenius et al. (2010, 2011) and
Azar (2011) are a concern. By the same reasons as the sustainability relevance of a number
of engineer-based measures and methods are rejected by Hellstrand et al. (2010); these
examples are. Their results are in strong conflict with the perspectives and priorities of a
sustainable development expressed in UN Millennium Development Goals, OECD prin-
ciples for a sustainable development and Millennium Ecosystem Assessment. They focus
ruminant production as a major sustainability obstacle by arguments in conflict with the
perspectives of FAO (2006). Mainly, this expresses that these contributions are not based
on an expertise competence regarding the ruminant, ecological, economic and social
systems in which the sustainability contribution from grass ruminant systems are defined.
Some examples illustrate the problems:
1022 S. Hellstrand
123

Cederberg and Flysjo (2004) and Cederberg et al. (2007) estimate the quantity and
nutritive quality of feeds grown on the dairy farm, which typically constitute 40–90 % of
the feed intake on dry matter basis, by the amount of diesel used on the farm according to
the accounting books. In the analysis of fluxes of compounds through the dairy cows, the
law of mass constancy is violated. Cederberg and Flysjo (2004) and Cederberg et al. (2007)
use values from a theoretical calculation about 10 years earlier regarding the protein
efficiency in conventional milk production, as a starting point for the evaluation of
emissions of N2O and ammonia from manure from the organic milk production system. As
the feeding strategies differ substantially between these systems, this is not relevant. The
dominating system for certification in organic farming in Sweden is KRAV.17 They pro-
vide a detailed list of rules to comply with, presented on 156 pages.18
The rules state that for milk-producing animals, concentrates may be at most 40 % of
the daily dry matter intake. The official feeding standards to dairy cows in Sweden from
1995 (Sporndly 1995) is that lactating cows need 7.6 g protein per MJ ME (protein
measured as AAT). Swedish Dairy Association provides ‘‘Kvalitetssakrad mjolkproduk-
tion:—Kvalitetssakrad utfodring mjolkkor’’ (Svensk Mjolk 2003). That brochure delivers
rules of thumb to advisers regarding the feeding of cows during different lactation phases.
For cows in early lactation (the first 100 days), the recommendation is that the AAT
allowance ought to be 8.0–8.5 g AAT/MJ. The reference provided is ‘‘Mjolkkor’’ (Dairy
cattle in translation).
‘‘Mjolkkor’’ is a Swedish textbook about milk production. Gustafsson (2000), in a
contribution in this book, treats the issue of economically rational feeding. He argues that
by economic reasons, it can be rational to increase the protein allowance above the official
standard of 7.6 g AAT per MJ. He mentions that levels up to 8.5 g AAT/MJ are commonly
used. In 1991 when the AAT system was introduced, the protein requirement was set to
40 g AAT per kg milk ECM. Gustafsson states (p. 136) that the level 40 g AAT per kg
milk was supported by trials showing lower yields if lower allowances, while there were no
or small increase in milk production in trials if cows were fed more than 40 g AAT per kg
milk. The previous standard of 40 g AAT per kg ECM now is captured in the formulation
that the requirements for lactating cows are 7.6 g AAT per MJ ME as the cows need to
meet the energy requirements of lactation and maintenance together (ibid.).
Here, there is a contradiction: Empirical evidences showed no or small increase in milk
yield for protein allowances above 40 g AAT per kg ECM. A standard conclusion
regarding production functions based on dose–response functions in biological systems are
that the biological optimum is at a higher input of, for example, feed or fertiliser than the
economic optimum. If the biological optimum is at a protein allowance of 40 g AAT per
kg ECM or slightly higher, then the economic optimum will be at a lower allowance. And,
if the formulation of the protein requirement of 7.6 g AAT per MJ ME equals the one of
40 g AAT per kg ECM, then there can be no economic reason for increasing this protein
allowance when generating feeding rations at commercial herd level. Thus, the conclusion
by Gustafsson must be rejected: There are no empirical evidences that support the con-
clusions that by economic reasons, it can be rational to increase the protein allowance
above the official standard of 7.6 g AAT per MJ.
17 For information, see http://www.krav.se/System/Spraklankar/In-English/KRAV-/, accessed 2009-08-04.18 http://www.krav.se/Documents/Regler/englishEditions/Standards_for_krav-certified_produktion_january_2009.pdf accessed 2009-08-04.
Animal production in a sustainable agriculture 1023
123

Gustafsson presents the changed formulation of the energy requirement in 1995, where
one linear expression was replaced by another one (see above), as if the new liner rela-
tionship was a curvilinear one (ibid.: p. 134–135).
From this, three conclusions follow.
(i) It is in conventional milk production recommended to increase the protein allowance
with 5–12 % above official standards. This is supported by a textbook used in
agricultural education.
(ii) The understanding of the definition of the optimal level in production functions in
production biological and production economic terms is weak.
(iii) The understanding of how to represent a curvilinear relationship between energy
intake and milk yield in a mathematical expression is weak.
The latest example where the principle of the relation in (iii) is clearly demonstrated in
production biological and economic terms in the Swedish context is Hellstrand (1989).
Nanneson et al. (1945) and Wiktorsson (1979) thoroughly treat this subject. This points
towards the conclusion that the increasing protein allowances to dairy cows in Sweden
1991–1999, remaining at a high, possibly higher level in 2006 (see Figs. 1, 2) is a function
of a decreasing capacity to handle issues regarding optimal intensities in biological and
economic terms among the national expertise in Swedish dairy science.
The example here discussed regarding a believed rationality in overfeeding dairy cows
with protein in the organisation dominating extension services to farmers is similar with
the example in 6.1.2 regarding the feeding rations in milk production delivered by
Sporndly in 1996 to SEPA to a study of future, rational Swedish agriculture. The future
study was published in 1997(SEPA 1997). The task of the study was to outline what a
sustainable and environmentally well-adapted agriculture was, and how it could be con-
served, and further developed to the year 2021. The future study worked with two visions.
In both set, sustainability objectives were assumed to be possible to achieve. In the one
building on a development of conventional agricultural systems, the path towards sus-
tainability and a good environment was described in terms of precise use of commercial
fertilisers, pesticides and concentrates. Yields were high and animal production was
characterised by high-yielding cows and pigs and poultry with low feed consumption per
kg product.
A concern is the design of the feeding rations delivered regarding milk production. In
1995, the official protein standard in AAT terms was changed. The author for the publi-
cation where this is established is Sporndly (1995). In 1996, he had a task to provide SEPA
with feeding rations supporting an economically efficient and ecologically sustainable
Swedish milk production. The feeding rations provided19 cover the months 1–12 in the
lactation. For lactation month 9, the amount of energy and protein exactly matches the
requirements according to Sporndly (1995). Then, the production is on average 25 kg ECM
per cow. In lactation months 1 and 2, that is, one to 2 months after calving, the production
level is 45 kg ECM per day. At that high production level, the allowance of AAT is
2,674 g per cow and day, at the production level 25 kg ECM, it is 1,467. Thus, an increase
in production with 20 kg ECM increased the allowance of AAT with 1,207 g AAT, that is,
60.3 g AAT per kg ECM more. The feeding standard as of 1995, to be precise, implies an
allowance of 42.2 g AAT per kg milk. Here, the same author as in 1995 published a new
official feeding standard in Sweden regarding energy and protein, in a task for the SEPA
1 year later aiming at environmentally sound and economic efficient production for the
19 I got them from one of the authors some time after the report from SEPA was published in 1997.
1024 S. Hellstrand
123

future, increases the protein allowance with 60.3/40.2 per kg ECM, that is, with precisely
50 %. The energy allowance by Sporndly in this task follows close to the official one as of
Sporndly (1995). This implies that the amount of protein as AAT per MJ ME that Sporndly
in 1996 assumes that is needed at increasing milk yields are 10.6 and not the 7.6 as from
1995 is the official Swedish feeding standard (Sporndly 1995). Such an increase in the
assumed amount of protein required per MJ ME needed for milk production will heavily
change the solution in the system of linear equations used when determining the amount of
energy concentrates and protein concentrates, respectively, required to exactly match the
remaining requirements of energy and protein given the weight and production level for the
animal, and the allowances of energy and protein through fixed rations of forages.20 This
will cause a substantial substitution of grains typically produced on the farm or at near
farms, with purchased protein concentrates, that to a substantial part contain interconti-
nentally produced soymeal.
Gustafsson is one of the leading experts in the feeding of dairy cows at Swedish Dairy
Association the latest two decades, and Sporndly has had a corresponding position at
Swedish University of Agricultural Sciences (SUAS) for a similar period. Bertilsson is
another of the experts at SUAS. He is the source for the change of the formulation of the
protein standards in 1995 (Bertilsson 1994), where the source (se Sporndly 1995) is an
internal memo that no longer can be found (Hellstrand 2008a). Bertilsson and Sporndly
were supervisors to Andresen (1994) in his student work leading to a new energy standard
to dairy cows in 1995 (Sporndly 1995).
The paragraphs above suggest that the decreasing protein efficiency in Swedish milk
production since 1991 partly is a function of a decreasing quality in the contributions in
dairy science the same period.
The findings in Hellstrand (2008a) suggest that this reflects a movement
• From a good understanding of general principles for a resource-efficient and
economically competitive milk production in Sweden, that had a tradition of the
major part of the twentieth century, as expressed e.g. in Nanneson et al. (1945) and
Wiktorsson (1979),
• Towards a lower level common internationally.
One historical reason why Sweden evolved a higher competence in this field than most
nations is the socio-economic and biophysical contexts of the Swedish society over time.
Ruminants were a major path to convert sunlight to food. The capacity to nourish the
Swedish population was for a long period of time not sufficient. During the nineteenth and
the first half of the twentieth century, the development of ruminant production systems in
combination with crop rotations with leguminouses and grasses improved soil fertility and
food security.
The historically strong dependency of ruminants of the Swedish population for the ful-
fillment of basic physiological requirements may well have put a higher selection pressure in
favour of the development of efficient management strategies regarding milk production.
The changes in the way feeding strategies were constructed in Sweden during the 1990s
implied a movement towards approaches common internationally, for example, in Den-
mark, the Netherlands and USA. Some references for this are Andresen (1994), Berg and
Thuen (1991), NRC (2001). Other references are given in Hellstrand (2008a).
20 In reality, they are not fixed. When constructing a feeding plan, the steps taken normally imply anassumption of fixed rations of forages. This is a way to come around the problems of milk production andfeeding as a typical complex system with mutual dependencies between systems and system levels.
Animal production in a sustainable agriculture 1025
123

Compared with the previous dcp system, the AAT system implied that the value of
protein in forages in relative terms was decreased substantially more than for grains and
crop protein feeds. That follows from a comparison of the official feeding table for
ruminants in 1989 and 1995, e.g., (Sporndly 1989; 1995). At the same time, the assumed
requirements for maintenance per cow and day increased in g when going from the dcp to
the AAT/PBV system (ibid.). The typical way of constructing a feeding ration (see
Hellstrand 1988) implies in a mathematical way that forages are used to supply the
demands for maintenance purposes, and hopefully, the first kg of milk produced. Then,
remaining demands for remaining production are met by rations of energy (grains) and
protein concentrates (with high fractions of soymeal, respectively).
With the new system, two effects come into place at the same time. Every kg of forages
was assumed to have a substantially lower capacity to fulfil the protein requirements for
maintenance and the first kg of milk produced. And, the assumed protein requirements for
maintenance increased. This resulted in a situation where in the new solution of the system
of linear equations needed to theoretically exactly meet the remaining requirements of
energy and protein, substantial quantities of grains were substituted with protein feeds.
The rules for organic milk production state that concentrates may be at most 40 % of the
total daily dry matter intake. Thus, the fraction of total feed intake that is forages is 60 %
or more. (i) The assumed drastic reduction in feeding value of protein in forages in
combination with (ii) the higher maintenance requirements in terms of AAT compared to
dcp, and (iii) the rule in organic agriculture stating that[60 % of the daily feeding ration
should be forages created a situation where the official feeding standards become obsolete.
If following the official feeding standards, a well-functioning feeding ration could not be
constructed. That resulted in a quite odd situation:
While extension service organisations as well as the expertise at SUAS assumed that
conventional and high-yielding dairy cows needed substantially more protein per kg milk
than the official feeding standard stated, extension services directed towards organic milk
production assumed the opposite. In a similar text as the one advising extension officers to
increase the assumed requirements of protein for milk production in conventional milk
production, the advice when generating feeding rations in organic milk production was to
reduce it (Andresen). Andresen suggest 7–7.5 g AAT per MJ ME during the early phase of
lactation compared to the 7.6 that is the official standards; and the 8.0–8.5 recommended in
conventional milk production. Gustafsson (1990) in a field study got results, implying that
by going from the dcp system to the AAT/PBV system, the theoretically estimated protein
requirement would increase with about 10 %.The discussion above suggests some paths
that might have contributed to this effect. Here, Andresen proposes a reduction of protein
allowances with up to close to 10 %. Thus, the organic system in that sense can represent
the situation before the AAT/PBV system was introduced in 1991.
By Andresen’s recommendations regarding how to manipulate the official feeding
standards,21 reasonable relations can be maintained between grains and protein feeds also
21 A few years ago, I participated when a friend with organic milk production was visited by the extensionofficer. The feeding plan was constructed by these steps. First, the farmer told the extension officer how hewould like the feeding plan to look. Then, the extension officer reported needed data regarding animals andfeeds. In the last step in a trial-and-error mode, the extension officer probed different assumed proteinallowance levels as the protein standard. When a feeding plan as the farmer believed in was obtained, theofficer used the protein allowance behind as the protein feeding standard. This is quite a creative way ofusing feeding standards that have moved a long distance away from its original purpose, to condenseexperiences from feeding trials as a guide for farmers to achieve feeding plans fulfilling the physiologicaldemands of the animals and the economy of the farmer.
1026 S. Hellstrand
123

in organic milk production while feeding the cows high forage rations. One reason why this
can work is that in reality, ruminants through the selection advantage that rumination
provides over millions of years have developed the capacity to utilise energy and protein
from forages. Gustafsson (1990) (see Sect. 6.1.2) probed the outcome on commercial herds
of the new protein evaluation system AAT/PBV. The outcome was surprising. The ‘‘waste
fraction’’ PBV got statistical significance between level of PBV and milk yield, while
allowance of the assumed quality fraction of protein AAT did not. That result indicates that
the manipulation of the feeding standards recommended by Andresen can imply a cor-
rection of a flaw within the AAT system.
The following suggests one reason that might have caused the result in Gustafsson. A
simple statistical analysis of all forages in the official Swedish feeding table for rumi-
nants22 shows the following R2 values:
• MJ ME and crude protein 17 %,
• MJ ME and AAT 75 %,
• MJ ME and PBV 8 %,
• MJ and dcp 17 %,
• AAT and crude protein 8 %,
• AAT and dcp 8 %,
• PBV and crude protein 97 % and
• PBV and dcp 97 %.
So, with the new system AAT/PBV and talking in mathematical terms, a measure of the
protein dimension of the nutritive content of forages (here ‘‘forages’’ is ley and pasture)
was introduced, which mainly was a function of the energy, not the protein content of
forages. In mathematical terms, this implies that when in the system of linear equations
needed to balance the energy and protein requirements of the animal and when it comes to
forages, the protein requirement of the animal is balanced by values that actually reflects
the energy content of the feed, not the protein content. Then, the result of Gustafsson
(1990) is no longer surprising but expected. A protein fraction with a believed higher
quality, that to a substantial part actually is an energy measure not a protein measure, will
have limited capacity to fulfil the protein requirements of the cows.
The manipulation of feeding standards proposed by Andresen just described results in a
higher dependency of protein in the believedwaste-fraction PBV in forages. That fraction has
a high correlation with the protein contents of forages as determined by chemical analysis in
combination with digestibility trials as reflected in theR2 values above between PBV and dcp
and crude protein, respectively (97 % both cases). The corresponding R2 values for AAT are
low, 8 % for both. Therefore, the chances that this will work on real farms are good.
Thus, by reducing the assumed requirement of protein as Andresen suggests, organic
farmers might have corrected the aim of the rifle, so that the shot has a better direction.
The way of expressing the AAT value of forages as mainly a function of the energy
content implies that the precision of the ‘‘shot’’ has decreased compared to the previous
dcp system. The increase in protein allowances recommended in conventional milk pro-
duction by the organisation dominating in extension services, Svensk Mjolk and associated
organisations can be understood in terms of an insurance against the backlashes a
decreased precision might cause. Then, it reflects mistrust in the organisation of the quality
of the feeding standard system with associated feed evaluation system.
22 Fodertabeller for idisslare 2003, http://www.slu.se/sv/fakulteter/vh/institutioner/institutionen-for-husdjurens-utfodring-och-vard/verktyg/fodertabeller/fodertabell-for-idisslare-vallfoder/, accessed 2012-07-17.
Animal production in a sustainable agriculture 1027
123

The discussion above concerns the AAT/PBV system the way at it has been applied in
Sweden. The problems penetrated can be due to causes on lower system levels, as well as
to a principally invalid approach that is outside the scope of this study to evaluate.
The discussion above is needed to understand how it can be that organic and conven-
tional milk production in Sweden commonly uses so different protein allowances in milk
production, while the cows themselves most probably are not affected of whether the
nitrogen supply to the crops is from commercial fertilisers or from nitrogen-fixating
microbes. This knowledge also needs to evaluate whether there is a problem in using
values regarding the content of nitrogen in manure for conventional milk production as
estimates for organic one as, e.g. Cederberg and Flysjo (2004) and Cederberg et al. (2007)
do. The following evaluates the significance of the two opposing ways of manipulating the
official protein feeding standards. It also informs about the major differences in the feeding
strategies in organic and conventional milk production.
Table 4 presents data for producing the same amount of milk per cow in one organic
and one conventional system. The difference in energy concentration of feeding ration at
top lactation of 0.70 MJ per kg DM may theoretically support a higher milk yield per cow
and year of around 1,200 kg ECM in the conventional system.
The amount of milk produced per cow is constructed from the lactation curve for one
organic farm as reported in the official milk recording programme 1998, Hoglunda gard in
Kil in Varmland. The basis for the biological and economic profile is given by the pro-
duction branch calculi from SUAS, production year 2009,23 for the production area Plain
districts Svealand. The protein allowances per kg milk follows the feeding ration behind
the conventional milk production system in the future study of SEPA (1997) delivered by
Sporndly in 1996,24 where the dairy feeding expertise at SUAS at that time designed a
feeding strategy for the future, with the ambition to support a good economic result and
high environmental standards through ‘‘precise’’ use of concentrates. Thus, that feeding
plan expresses the perception at that time of leading national expertise regarding how to
design a good feeding plan in conventional milk production. Here, the protein allowances
per kg milk are substantially increased compared with the official feeding standards of that
time (see Sporndly 1995), as discussed above. In the organic system, the protein allow-
ances are decreased compared to the official feeding standards as proposed by Andresen.
The results in Tables 4 and 5 shall be interpreted as examples of conventional and organic
milk production.
Table 4 shows a substantial difference between the two systems in the feeding rations
when the amounts of forages, grain and purchased feeds are compared. The influx of
nitrogen through purchased feeds is 56 kg higher per cow and year in the conventional
system. Due to internal loops of nitrogen on the farm between cows—manure—forages,
the difference in the efflux of nitrogen out from the farm is around 20 kg per cow. Still, this
is a substantial difference, which will affect emission of ammonia and nitrous oxide to the
air, and discharges of nitrate to water systems. Thus, it is not appropriate to use about
10-year-old feeding ratios for conventional milk production as the source for data input
regarding the amount of nitrogen in manure among organic farms.
The production biological and economic profiles of the two systems are different.
‘‘Value of environmental services’’ relate to the level of payment for such services the way
it is defined within the Common Agriculture Policy of European Union.
23 www.agriwise.se, accessed 2012-10-15.24 Obtained from one of the authors of the future study.
1028 S. Hellstrand
123

If producing all milk in Sweden as organic (see Table 5), it will compared to con-
ventional production
• increase land use in Sweden for the production of grain and forages with around
373,000 ha,
• decrease land use in, for example, Brazil with 151,000 ha,
• increase total land appropriated for the same production of milk with 222,000 ha,
• increase economic result with 5.5 billion SEK, that is, 380 SEK per hour labour,
• increase the use of diesel with 13,800 m3,
• decrease the use of mineral nitrogen fertilisers with 8,500 tonnes,
• decrease the use of mineral phosphorus fertilisers with 1,250 tonnes,
• decrease the amount of nitrogen in manure with 8 million kg,
• decrease the nitrogen influx via purchased feeds with 21 million kg,
• decrease the use of insecticides and fungicides with 101 m3 in Swedish agriculture and
• decrease the number of herbicide tablets with 144,000.
Table 4 Production biological and economic profile of organic and conventional milk production, expla-nations see the text
Organic Conventional Organicminusconventional
Energy concentration (MJ per kg DM, at top lactation) 12.05 12.75 -0.70
Production (kg ECMa per cow and year) 9,272 9,272 0
Milk delivered (kg ECM per cow and year) 8,577 8,577 0
Forages (kg DM) 4,722 3,040 1,682
Grain (kg) 1,092 1,100 -8
Purchased feeds (kg) 593 2,027 -1,434
Economic result, milk production (SEK) 9,034 -2,723 11,757
Nitrogen in manure (kg) 97 117 -20
Nitrogen influx, purchased feeds (kg) 27 83 -56
Forages (ha) 1.5 0.8 1
Grain (ha) 0.5 0.2 0
‘‘Soya beans’’ (ha) 0.2 0.6 0
Sum (ha) 2.2 1.6 1
Diesel, field work ? silage packing (dm3) 91 55 36
Mineral fertilisers (kg N) 0 22 -22
Mineral fertilisers (kg P) 0 3 -3
Herbicide, no tablet Express 50 T 0.4 -0.4
Biocide (dm3 Pirimor) 0.07 -0.07
Fungicide (dm3 Tilt Top 500 EC) 0.2 -0.2
Value of environmental services 1,074 234 841
Result in crop production 2,394 -240 2,634
Sum result per cow, including supporting crop production, SEK 11,428 -2,963 14,390
Increase in results, SEK per hour (188 SEK per hour in calculus) 379
Value of SEK, see Table 3a Energy corrected milk
Animal production in a sustainable agriculture 1029
123

Note, the difference in nitrogen influx of 21 million kg nitrogen is similar as the
reported increase via purchased feeds to cattle from 1991 to 1999 of 22.8 million kg
(Hellstrand 2006). The modification of the protein standards in this example implies a
correction towards the situation just before the introduction of the AAT/PBV system. The
conventional system in the example is based on the feeding strategy that leading national
expertise chose at that time in a future study by SEPA, aiming at precise feeding sup-
porting economic and environmental sustainability objectives: The results, thus, support
the conclusion that changed feeding standards and the way they were used is a major
explanation for the decreased nitrogen efficiency in Swedish milk production 1991–1999.
The evaluation of the sustainability of the two production systems in Tables 4 and 5 is
not straightforward, as there is a conflict between productivity per ha and other sustain-
ability aspects. The issue is further complicated as the conventional system to a higher
degree utilises non-renewable natural resources. How the production levels would be in the
conventional system compared to the organic if assuming that only renewable natural
resources was used, is an open question.
This strongly inflicts the results in their comparisons between the two production sys-
tems given the situation 8 and 11 years later, respectively. In the analysis of the fertilising
effect of plant nutrients in biological systems, strict additive effects are assumed between
nutrients and between ecosystems globally irrespective of the situation in the concerned
ecosystems. The analysis floats free from the context of the system and issue focused. The
Table 5 Production biological and economic profile when producing 3.3 billion milk ECM, in an organicand a conventional system, respectively, assuming production profile per cow as in Table 4, furtherexplanations see Table 4
Organic Conventional Organic minusconventional
Delivered (billion kg ECM) 3.3 3.3 0
Forages (million kg DM) 1,817 1,170 647
Grain (million kg) 420 423 -3
Purchased feeds (million kg) 228 780 -552
Economic result, milk production (million SEK) 3,476 -1,048 4,524
Nitrogen in manure (million kg) 37 45 -8
Nitrogen influx, purchased feeds (million kg) 10 32 -21
Forages (ha) 586,072 299,931 286,141
Grain (ha) 182,750 96,190 86,560
‘‘Soya beans’’ (ha) 72,964 223,670 -150,706
Sum (ha) 841,786 619,791 221,995
Diesel, field work ? silage packing (m3) 34,826 21,048 13,778
Mineral fertilisers (tonnes of N) 0 8,465 -8,465
Mineral fertilisers (tonnes of P) 0 1,250 -1,250
Herbicide, no tablet Express 50 T 0 144,286 -144,286
Biocide (m3 Pirimor) 0 29 -29
Fungicide (m3 Tilt Top 500 EC) 0 72 -72
Value of environmental services (million SEK) 413 90 323
Result in crop production (million SEK) 921 -92 1,013
Result in milk production, including supportingcrop production (million SEK)
4,397 -1,140 5,537
1030 S. Hellstrand
123

complexity and variation of conditions in ecosystems in time and space is reduced to zero.
This is in strong conflict with the knowledge frontier regarding the same issue in agri-
cultural and crop production science since the contributions by Liebig (1840) and Shelford
(1913).
The model of the global system for food production developed by Wirsenius (2000)
named the FPD/ALBIO model uses an efficiency measure expressed as ratio between gross
energy in food consumed through gross energy in biomass appropriated. That way the
physiological complexity of humans is reduced to the same as wood stoves. In the model,
the top soil layer of agricultural land is not included. That implies that the 50 % of total
biomass produced annually that is recycled in crop residues and manure to agricultural land
in the model is classed as losses. That reflux is around 7 billion tonnes dry matter or 1.4
tonnes dry matter per ha. In reality, these refluxes are preconditions for maintained content
of organic matter and plant nutrients securing maintained productivity of agricultural soils,
that is, maintained quality of one of the most essential stocks of natural capital providing
the physiological necessities for the life of 7 billion people. Azar concludes that meat
production is responsible for about 18 % of global greenhouse gas emissions with refer-
ence to FAO (2007, should be 2006). The estimate of 18 % provided by FAO is for all
animal production not only meat, including emissions in the transportation and processing
from mines to food industry. That measure provided by FAO is before considering the
annual carbon sink capacity in grassland and rangeland of 6.2 gigaton carbon dioxide
(87 % of the FAO estimate of emissions) mainly supporting ruminant production that FAO
also identified. Furthermore, Azar concludes with reference to Wirsenius et al. (2010) that
a substitution of pork and/or poultry for 20 % of ruminant meat would ‘‘drop’’ pressure on
tropical forests. Given the construction of the FPD/ALBIO model (see below), the ana-
lytical tool that Azar and Wirsenius et al. rely on, this conclusion cannot be drawn. It is
also in conflict with the findings in FAO (2006): pork and poultry production depends on
substantial fractions of soymeal, ruminant meat production do not have to utilize high
rations of soymeal as their comparative advantage is the capacity to utilize forages
(although there are feeding regimes to ruminants dominated by concentrates). FAO (2006)
is clear about this and that the reason is that people, pigs and poultry are monogastric
creatures, ruminants are not. Given typical feeding rations for pork and poultry in Sweden,
one kg of pork or poultry meat replacing one kg of ruminant meat increases the con-
sumption of soymeal with 0.8 kg. That results in an extra pressure on tropical deforestation
of 3.6 m2, which increases the emissions of carbon dioxide with 250 kg according to the
route of calculations in FAO (2006).
Still though, a fact that can be confusing: In reality, cattle can use significant amounts of
crop protein feeds (Figs. 1, 2, 3), while this is not a physiological requirement. Thus, in
some production systems, cattle are reared as if they were pigs, and this is not efficient
from a sustainability perspective. The conclusion from that is not to decrease cattle pro-
duction but to improve its socio-ecological efficiency.
One reason why Azar has not realised this relation is that his argument is based on
Wirsenius et al. (2010), which is based on Wirsenius et al. (201125). The later is based on
results from different LCA studies regarding animal production systems, e.g., Cederberg
and Flysjo (2004). These LCA studies have not considered the impact of changed land use.
Thus, when Azar draws conclusions regarding the positive impact on climate change
mitigation and conservation of tropical forests of replacing ruminant products with prod-
ucts from pork and poultry, he provides an example of the risks of extrapolating results
25 The version available on line in 2010.
Animal production in a sustainable agriculture 1031
123

from a part of reality investigated, to other parts not investigated. The conclusion is based
on results from analyses that ignore the possibility of these impacts, while in reality, the
causal relations are strong. That is one reason why that conclusion is in conflict with FAO
(2006).
Wirsenius et al. (2011) have utilised the mentioned FPD/ALBIO model of global food
production. The most detailed description is Wirsenius (2000). One limitation in its use-
fulness is that it does not consider the protein requirements of animals. Another is that it
wrongly presupposes that dairy cattle do not use crop protein feeds. Therefore, when Azar
refers to work that is based on the results in Wirsenius et al. (2011), in claiming that a
substitution of pork and/or poultry for 20 % of ruminant meat would ‘‘drop’’ pressure on
tropical forests, this cannot be supported by the provided reference, as the used analytical
tool lack the capacity to on the margin link how changes between and within different
animal production systems will affect demand on protein feeds. Without considering the
physiological protein requirements of different animals used for different purposes, the
used analytical tool lack capacity to relate such changes to, for example, changed pressure
on tropical deforestation for soya production.
The work of Azar (2011) and Wirsenius et al. (2010, 2011) now influence or have the
ambition to influence policy work from local community level, over regional level to
Swedish Environmental Protection Agency to the EU level to the scientific committee of
IPCC regarding climate change, renewable energy, and the perception of how to meet
societal demands on food and biofuels (see also Chum et al. 2011 e.g. p. 230; SEPA 2011;
Lansstyrelsen i Varmland 2012). With its weak foundation in agricultural sciences, where
some of the weaknesses have been pointed out above, the issue at hand is whether the
capacity of agricultural soils to provide enough food will be harmed, if suggested policy
measures are enforced.
An epistemological issue is by what scientific criteria the professionals within one
discipline can claim the right to extrapolate their methods and concepts to pressing issues
in such fields of reality where they have no professional training.
More important, which this paper shows, development of ruminant production systems
may at the same time make a substantial contribution in improving global food security,
increasing land area available for bioenergy purposes, and supporting conservation of
biodiversity and forests. This is not to deny that there are sustainability problems in current
animal production systems. This stresses the need to handle them with accurate profes-
sional skills.
7 Conclusions
The paper shows that animal production is of great importance for global food production
and for environmental issues related to agriculture. Around 40 % of total production value
in agriculture relates to animals products. Of total land area of 13 billion ha, 1.4 billion are
arable land and 3.4 are permanent pastureland, in total 4.9 billion ha agricultural land.
Around 70 % of total biomass appropriated in food production from agriculture support
animal production systems. Two-thirds of these 70 % are re-circulated in system-rein-
forcing feedback loops through manure and crop residues.
Substantial potentials for sustainability improvements in animal production systems
have been identified through moderately decreased consumption of chicken meat in
developed nations; develop the capacity of ruminants to produce high-quality food from
1032 S. Hellstrand
123

otherwise marginal agroecosystems; increased milk production level per cow; and
increased feeding efficiency in milk production.
For example, better feeding of dairy cows on global level in terms of improved nitrogen
efficiency decreasing the assumed requirement of protein feeds would in rough terms, half
the total area of the current acreage now devoted for soymeal production for feed purposes.
The potential positive impacts on farmers result, conservation of tropical forest and of
biodiversity, climate change, eutrophication and acidification, deterioration of the strato-
spheric ozone layer, global food and bioenergy supply are substantial.
The development of sustainable animal production systems requires methods that can
measure ecological, economic and social impacts of production systems within a sus-
tainability context, and identify potentials for improvements. The paper provide examples
of such methods, basically through the upgrading of traditional management and analytic
methods in agriculture that over centuries have been used and through a process of trial and
error in the real world improved their capacity to successfully manage the complex eco-
logical economic production systems that agriculture and animal production are. This
upgrading has been achieved by integrating common tools for farm management with
contributions within post-normal science as Impredicative Loop Analysis, and the ana-
lytical approach in Millennium Ecosystem Assessment. Contributions from systems
ecology, economic theory and complex systems theories are integrated as well.
Furthermore, incentives on societal level are needed that support choices among
households and enterprises that support a sustainable development.
Within animal production sciences, two critical areas are (i) ruling principles behind
common systems for the formulation of energy and protein standards in milk production
and (ii) methods now commonly used with the ambition to measure the sustainability
performance in animal production systems. Interestingly, in general terms, the paper
suggests the same measures in (i) and (ii). In order to improve feeding regimes in dairy
production as well as general management strategies for sustainable natural resource
management, there is a need to consider the ‘‘laws’’ of diminishing returns, the minimum
and of tolerance in biological systems in such a way that economically feasible and
ecological sustainable production is achieved.
The paper stresses the importance of strengthening the role of agricultural sciences in
the sustainability context. That implies to go back to central findings in agricultural sci-
ences regarding production systems that meet demands on sufficient productive and sus-
tainable production systems; considering thresholds, irreversibilities and resilience
phenomenon that agriculture during thousands of years of practice has learnt to deal with;
and re-utilise this knowledge about the production factor land on societal level in the
general sustainability context. It is suggested that in that process, methods and concepts in
agricultural science are integrated with the latest contributions within the field of agroe-
cology such as Impredicative Loop Analysis, for improving management of complex
agroecosystems.
This is a prerequisite for the development of agricultural systems with increased
capacity to support a sustainable society. In this context, animal production is of a sig-
nificant importance. If not, global food security is at risk.
Acknowledgments Lars Drake, Pekka Huhtanen and David Pimentel have significantly improved thequality of the paper by valuable comments. Two anonymous reviewers made quite different but valuablecomments.
Animal production in a sustainable agriculture 1033
123

References
Andresen, N. (1994). Fodrets energivarde vid okande foderintag. SLU Info rapporter, Husdjur 76, SLU,Uppsala (Swedish).
Andresen, N. Utfodringsrekommendationer i ekologisk mjolkproduktion. Hushallningssallskapet iKristianstad.
Azar, C. (2011). Biomass for energy: a dream come true… or a nightmare?Wiley Interdisciplinary Reviews:Climate Change, 2(3), 309–323.
Baumann, H., & Tillman, A.-M. (2004). The Hitch Hiker’s guide to LCA: An orientation in life cycleassessment methodology and application, Studentlitteratur.
Berg, J., & Thuen, E. (1991). A comparison between some feed energy systems based on Nordic productionexperiments in cattle. Norwegian Journal of Agricultural Science, 5, 7–15.
Bertilsson, J. (1994). Forandringar av AAT—rekommendationer beroende pa ny fodermedelstabell och nyaenergirekommendationer. Stencil, institutionen for husdjurens utfodring och vard, SLU, Uppsala.(Swedish.)
Cederberg, C., & Flysjo, A. (2004). Life cycle inventory of 23 dairy farms in South-West Sweden. SIK-report728, SIK—Institutet for Livsmedel och Bioteknik, Goteborg.
Cederberg, C., Flysjo, A., & Ericson, L. (2007). Livscykelanalys (LCA) av norrlandsk mjolkproduktion.SIK-rapport Nr 761, SIK—Institutet for Livsmedel och Bioteknik, Goteborg (Swedish, Englishsummary).
Chum, H., Faaij, A., Moreira, J., Berndes, G., Dhamija, P., Dong, H., et al. (2011). Bioenergy. In I. P. C.C. Special (Ed.), Report on renewable energy sources and climate change mitigation (pp. 209–332).New York: Cambridge University Press.
Costanza, R. (1994). Three general policies to achieve sustainability. In A.-M. Jansson, M. Hammer, C.Folke, & R. Costanza (Eds.), Investing in natural capital: The ecological economics approach tosustainability (pp. 392–407). Washington, DC: Island Press.
Daly, H. (1990). Towards some operational principles of sustainable development. Ecological Economics, 2,1–6.
Daly, H. E., & Cobb, J. B. (1989). For the common good: Redirecting the economy toward community, theenvironment, and a sustainable future. Boston: Beacon Press.
Ebbersten, S. (1972). Pikloram (4-amino-3, 5, 6-triklorpikolinsyra) -studier av persistens i jord och vaxtersamt metodstudier rorande biologisk bestamning av pikloramrester. PhD-dissertation. Uppsala: Libris(Swedish, English summary).
Engstrom, G., Wadeskog, A., & Finnveden, G. (2007). Environmental assessment of Swedish agriculture.Ecological Economics, 60(3), 550–563.
FAO. (2006). Livestock’s long shadow. Rome. ftp://ftp.fao.org/docrep/fao/010/A0701E/A0701E00.pdf.Accessed June 15, 2010.
FAOstat. (2009). Several different datasets have been obtained from the website http://faostat.fao.org/default.aspx. The specific web-addresses and date for access for each data can be obtained from theauthor.
Giampietro, M. (2003). Multi-scale integrated analysis of agroecosystems. Boca Raton, NY: CRC Press.Gunnarsson, S., Sonesson, U., Stenberg, M., Kumm, K. I., & Ventorp, M. (2005). Scenarios for future
Swedish dairy production: A report from the synthesis group of FOOD 21. Uppsala: Swedish Uni-versity of Agricultural Sciences.
Gustafsson, A. (1990). Praktiska erfarenheter av smaltbart raprotein och AAT/PBV-systemet i svenskabesattningar. Meddelande SHS, 162, 36–39 (Swedish).
Gustafsson, A. H. (2000). Utfodring for ekonomisk mjolkproduktion. In A. Engstrom och & B.-M. Jafner(Eds.), Mjolkkor (pp. 127–160). Helsingborg: LTs forlag.
HELCOM. (2009). HELCOM Baltic Sea Action Plan. http://www.helcom.fi/BSAP/en_GB/intro/. AccessedJuly 16, 2009.
Hellstrand, S. (1988). Kan ekonomin i mjolkproduktionen forbattras—en modell for biologisk—ekonomiskanalys av mjolkproduktionen och dess resultat for 15 gardar i Varmland. Rapport 175, inst. forhusdjurens utfodring och vard, SLU. Uppsala (In Swedish).
Hellstrand, S. (1989). Bakgrund och kommentarer till 1989 ars fodermedelstabeller och naringsrekom-mendationer for idisslare. Rapport 191, inst. for husdjurens utfodring och vard, SLU. Uppsala(Swedish).
Hellstrand, S. (1998). Methods for operationalizing an ecologically effective and economically profitablesustainable development. Licentiate in philosophy thesis 1998:3 in Natural Resources ManagementMay, Department of Systems Ecology, Stockholm University.
1034 S. Hellstrand
123

Hellstrand, S. (2006). A multi-criteria analysis of sustainability effects of increasing concentrate intensity inSwedish milk production 1989–1999. Environment, Development and Sustainability, 8, 351–373.
Hellstrand, S. (2008a). Ekonomisk och miljomassig optimering av svensk mjolkproduktion. Report to theSwedish Environmental Protection Agency (Swedish, English summary).
Hellstrand, S. (2008b). Ansokan medel for forstudie hur utveckla hallbara idisslarproduktionssystem iSkandinavien, med fokus pa att kostnadseffektivt minska utslapp av kvave till Ostersjon (Swedish).
Hellstrand, S. (2010). Om den svenska animalieproduktionens och—konsumtionens hallbarhetsavtryckutomlands. Utredning pa uppdrag av Naturvardsverket (Swedish).
Hellstrand, S., Skanberg, K., & Drake, L. (2009). The relevance of ecological and economic policies forsustainable development. Environment, Development and Sustainability, 11(4), 853–870.
Hellstrand, S., Skanberg, K., & Drake, L. (2010). A biophysically anchored production function. Envi-ronment, Development and Sustainability, 12(4), 573–596.
Hellstrand, S., & Yan, J. (2009). The potential to increase sustainable global green energy productionthrough increased efficiency in milk and cattle production: A Swedish case. First InternationalConference on Applied Energy, January 5–7, 2009 Hong Kong.
Huhtanen, P., & Hristov, A. N. (2009). A meta-analysis of the effects of dietary protein concentration anddegradability on milk protein yield and milk N efficiency in dairy cows. Journal of Dairy Science, 92,3222–3232.
Johnson, C. N. (2009). Ecological consequences of Late Quaternary extinctions of Megafauna. Proceedingsof the Royal Society B, 276, 2509–2519.
Johnsson, H., Renborg, U., & Safvestad, V. (1959). Resultatmaximering i lantbruket. Meddelande franjordbrukets utredningsinstitut (pp. 3–59). Stockholm (Swedish).
Lansstyrelsen, i V. (2012). Underlag till Fardplan 2050. Rapport till Naturvardsverket 2012-03-23(Swedish).
Liebig, J. (1840). Chemistry in its application to agriculture and physiology. London: Taylor and Watson(Referred by Odum 1991).
Lindberg, J.-E., & Wiktorsson, H. (1995). Energianalyser i husdjursproduktionen—En jamforelse av olikaproduktionsgrenar. In ‘‘Lantbrukets energibalans—Energifloden i jord- och skogsbruk.’’ Kungl. Skogsoch Lantbruksakademins tidskrift, arg. 134, nr 6, 63–68 (Swedish).
LRF. (2002). Maten och miljon. Livscykelanalys av sju livsmedel. Skovde (Swedish).MEA. (2009). Overview of the Milliennium ecosystem assessment. http://www.millenniumassessment.
org/en/About.aspx. Accessed June 6, 2009.Nanneson, L., Nilsson, H., & Ytterborn, G. R. (1945). Jordbruksekonomi for jordbrukets ungdomsskolor och
for sjalvstudium, femte omarbetade upplagan, Stockholm.NorFor. (2004). Assessment of feed evaluation systems. NorFor (Nordic Feed Evaluation System). Report
number 1 (Swedish, abstract in English).NRC. (2001). Nutrient requirements of dairy cattle (7th ed.). Washington: National Academic Press.Odum, H. T. (1988). Self-organization, transformity, and information. Science, 242, 1132–1139.Odum, E. P. (1989). Ecology and our endangered life-support systems. Sunderland Massachusetts: Sinauer
Associates, Inc. Publishers.Odum, E. P. (1991). Fundamentals of ecology. First edition 1971 USA: W. B. Saunders Company 3rd
edition 1991. New Delhi: Natraj Publishers.OECD. (2001). Policies to enhance sustainable development. Meeting of the OECD council at ministerial
level 2001. http://www.oecd.org/dataoecd/47/22/1869800.pdf. Accessed March 29, 2008.Pimentel, D., & Pimentel, M. H. (2008). Food, energy and society (3rd ed.). Boca Raton, NY: CRC Press.Renborg, U. (1957). Linear planering anvand i lantbruksekonomiska driftsplaneringsproblem, Meddelande
fran jordbrukets utredningsinstitut (pp. 3–57). Stockholm (Swedish).Rockstrom, J., Steffen, W., Noone, K., Persson, A., Chapin, F. S., Lambin, E. F., et al. (2009). A safe
operating space for humanity. Nature, 461, 472–475.SEPA. (1997). Det framtida jordbruket: Slutrapport fran systemstudien for ett miljoanpassat och uthalligt
jordbruk, rapport 4755 (Naturvardsverket, Swedish).SEPA. (2009a). Swedish environmental objectives. http://www.naturvardsverket.se/upload/978-91-
620-1273-1.pdf. Accessed July 16, 2009.SEPA. (2009b). Sveriges atagande i Baltic sea action plan: Forslag till nationell atgardsplan.
http://www.naturvardsverket.se/upload/04_arbete_med_naturvard/Havsmiljo/Sveriges_atagandeBalticSeaActionPlan.pdf. Accessed July 29, 2009 (Swedish).
SEPA. (2011). Kottkonsumtionens klimatpaverkan: Drivkrafter och styrmedel. Rapport 6456 (The climateimpact of meat consumption: Driving forces and measures. Swedish, English Summary).
Shelford, V. E. (1913). Animal communities in temperate America. Chicago: University of Chicago Press(Referred by Odum 1991).
Animal production in a sustainable agriculture 1035
123
Smith, F. A., Elliott, S. M., & Lyons, S. K. (2010). Methane emissions from extinct megafauna. NatureGeoscience, 3, 374–375.
Sonesson, U. (2005). Environmental assessment of future dairy farming systems—quantifications of twoscenarios from the FOOD 21 synthesis work. SIK-report Nr 741, SIK, Gothemburg.
Sporndly, R. (Ed.) (1989). Fodertabeller for idisslare 1989. Speciella skrifter 39. Uppsala: Swedish Uni-versity of Agricultural Sciences.
Sporndly, R. (1995). Fodertabeller for idisslare 1995, Rapport 235, inst. for husdjurens utfodring och vard,SLU, Uppsala (Swedish).
Statistics Sweden. (2009). The system of environmental and economic accounts, see http://www.scb.se/Pages/Product____38161.aspx. Accessed 2009-09-02.
Stern, S., Sonesson, U., Gunnarsson, S., Kumm, K.-I., Oborn, I., & Nybrant, T. (2005). Sustainable pigproduction in the future—Development and evaluation of different scenarios. Report FOOD 21 No5/2005, Swedish University of Agricultural Sciences and SIK, Uppsala.
Svensk, M. (2003). Kvalitetssakrad mjolkproduktion: Kvalitetssakrad utfodring Mjolkkor. Eskilstuna.Svenska, L. (2003). Vardering av foder, En bok om LFU-systemet och Lantmannens Utfodringsrekommend
ationer, 2:a utgavan (Swedish).UN. (2010). UN millennium goals. http://www.endpoverty2015.org/en/goals. Accessed June 15, 2010.UN. (2012). UN millennium goals. http://www.un.org/millenniumgoals/environ.shtml. Accessed May 24,
2012.Wijkman, A. (2004). Report on the communication from the commission to the council and the European
Parliament on integrated product policy—Building on environmental life-cycle thinking (COM(2003)302—C5-0550/2003—2003/2221(INI)), from the Committee on the Environment, Public Health andConsumer Policy, Rapporteur: Anders Wijkman, FINAL, A5-0261/2004, 8 April 2004.
Wiktorsson, H. (1971). Studies on the effect of different levels of nutrition to dairy cows. Swedish Journal ofAgricultural Research, 1, 83–103.
Wiktorsson, H. (1979). General plan of nutrition for dairy cows. In W. H. Broster & H. Swan (Eds.),Feeding strategy for the high yielding dairy cow. London: Granada Publishing.
Wirsenius, S. (2000). Human use of land and organic materials: Modelling the turnover of biomass in theglobal food system. PhD-diss. Chalmers University of Technology, Goteborg.
Wirsenius, S. (2003a). Efficiencies and biomass appropriation of food commodities on global and regionallevel. Agricultural Systems, 77(3), 219–255.
Wirsenius, S. (2003b). The biomass metabolism of the food system: A model based survey of the global andregional turnover of food biomass. Journal of Industrial Ecology, 7(1), 47–80.
Wirsenius, S., Azar, C., & Berndes, G. (2010). How much land is needed for global food production underscenarios of dietary changes and livestock productivity increases in 2030? Agricultural Systems,103(9), 621–638.
Wirsenius, S., Hedenus, F., & Mohlin, K. (2011). Greenhouse gas taxes on animal food products: rationale,tax scheme and climate mitigation effects. Climatic Change, 108(1–2), 159–184.
1036 S. Hellstrand
123

