on weapons plutonium in the arctic environment (thule...
TRANSCRIPT
Risø-R-1321(EN)
On Weapons Plutonium in the Arctic Environment (Thule, Greenland) Mats Eriksson Risø National Laboratory, Roskilde, Denmark April 2002

Risø–R–1321(EN)
On Weapons Plutonium in the Arctic
Environment (Thule, Greenland)
Mats Eriksson
Risø National Laboratory, Roskilde, DenmarkApril 2002

AbstractThis thesis concerns a nuclear accident that occurred in the Thule (Pituffik)
area, NW Greenland in 1968, called the Thule accident. Results are based on dif-ferent analytical techniques, i.e. gamma spectrometry, alpha spectrometry, ICP-MS, SEM with EDX and different sediment models, i.e. (CRS, CIC). The scopeof the thesis is the study of hot particles. Studies on these have shown severalinteresting features, e.g. that they carry most of the activity dispersed from theaccident, moreover, they have been very useful in the determination of the sourceterm for the Thule accident debris.
Paper I, is an overview of the results from the Thule-97 expedition. This pa-per concerns the marine environment, i.e. water, sediment and benthic animalsin the Bylot Sound. The main conclusions are; that plutonium is not transportedfrom the contaminated sediments into the surface water in this shelf sea, the debrishas been efficiently buried in the sediment to great depth as a result of biologicalactivity and transfer of plutonium to benthic biota is low.
Paper II, concludes that the resuspension of accident debris on land has beenlimited and indications were, that americium has a faster transport mechanismfrom the catchment area to lakes than plutonium and radio lead.
Paper III, is a method description of inventory calculation techniques in sedi-ment with heterogeneous activity concentration, i.e. hot particles are present inthe samples. It is concluded that earlier inventory estimates have been under es-timated and that the new inventory is about 3.8 kg (10 TBq) of 239,240Pu.
Paper IV, describes hot particle separation/identification techniques using real-time digital image systems. These techniques are much faster than conventionallyused auto radiography and give the results in real time.
Paper V, is a study of single isolated hot particles. The most interesting result isthat the fission material in the weapons involved in the accident mostly consistedof 235U (about 4 times more in mass than 239Pu). This paper concludes that thereare at least two different source terms for the Thule accident debris. Another in-teresting feature is that it seems like uranium is leaching from the particles fasterthan plutonium and americium.
This thesis is submitted for the degree of Doctor of Philosophy, Department ofRadiation Physics at Lund University, Sweden.
Cover image: Hot Particle from the Thule sedimentISBN 87–550–3006–8;87–550–3007–6 (Internet)ISSN 0106–2840
Print: Pitney Bowes Management Services Denmark A/S · 2002

Contents
Preface 6
1 Introduction 101.1 The Thule accident 111.2 Project Crested Ice 131.3 Radioecological surveys 14
1.3.1 Water 151.3.2 Sediments 151.3.3 Biota 161.3.4 Some thoughts concerning the early investigations 16
1.4 Aims of the studies in the present report 16
2 Methods 172.1 Sampling techniques 17
2.1.1 Water 172.1.2 Sediment 182.1.3 Biota 18
2.2 Radiochemical separation techniques 182.2.1 The use of tracers 182.2.2 Sub-sampling 192.2.3 Solubilisation 202.2.4 Concentration 202.2.5 Separation and purification 212.2.6 Source preparation 22
2.3 Detection and detection limits 222.3.1 Radiometric methods 222.3.2 Indirect measurements of 239,240Pu 242.3.3 Sediment dating techniques 242.3.4 Hot particle separation technique 252.3.5 Scanning Electron Microscope, SEM 252.3.6 Mass spectrometry 26
2.4 Statistics 272.4.1 Distribution functions 28
3 Results and Conclusions 283.1 Source term 283.2 Seawater 313.3 Sediments 313.4 Resuspension on land 333.5 Biota 34
4 Concluding Remarks and Future Research 34
Paper I 43
Paper II 63
Paper III 85
Risø–R–1321(EN) 3

Paper IV 113
Paper V 123
Publications not included in the thesis 144
4 Risø–R–1321(EN)

Preface
This thesis reports the results of a Ph.D study on radionuclides originating fromthe Thule Accident. The work was carried out in the period from March 1998to March 2002 as a joint venture between the Radiation Research Department,Risø National Laboratory, Denmark, and Department of Radiation Physics, LundUniversity, Sweden. The thesis includes and summarizes the five articles outlinedbelow.
I. Dahlgaard H, Eriksson M., Ilus E., Ryan T., McMahon C.A. and Nielsen S.P.:Plutonium in the marine environment at Thule, NW-Greenland after a nu-clear weapons accidentIn: ”Plutonium in the environment”, Ed. Kudo A., Elsevier, Oxford, UK,15-30, 2001.
II. Eriksson M., Holm E., Roos P. and Dahlgaard H.:Flux of 238,239,240Pu, 241Am, 137Cs and 210Pb to High Arctic Lakes in theThule District (Greenland)Journal of Environmental Radioactivity, submitted (19 pp) 2001.
III. Eriksson M.:Plutonium Inventory Calculations in Sediments when Hot Particles are PresentManuscript, (25 pp), 2002.
IV. Eriksson M., Ljunggren K. and Hindorf C.:Plutonium hot particle separation techniques using real-time digital image sys-temsNuclear Instruments and Methods in Physics Research, A, in press (6 pp),2002.
V. Eriksson M., Roos P., Dahlgaard H., Lindahl P. and Holm E.:Isotopic ratios in Thule hot particles, source term of the Thule debrisManuscript, (18 pp), 2002.
Papers I and IV are reprinted with permission from the Elsevier Science Ltd, UK.
I wish to thank my superb supervisors Henning Dahlgaard and Elis Holm!
Moreover, I would like to thank my family, friends, colleges and coauthors, andespecially:Per Roos, Claus Andersen, Miranda Keith-Roach, Karen Mandrup, Pearl Baade-Pedersen, Jytte Clausen, Lis V. Kristensen, Sven P. Nielsen, Radiation ResearchDepartment, Risø National Laboratory, DenmarkPatric Lindahl, Torbjon Gafvert, Edvin Johansson, Thomas Hjerpe, Mathias Leisvik,Ronnie Wirestam, Kaj Ljunggren, Cecilia Hindorf, Birgitta Roos, Gertie Johans-son, Birgit Amilon, Christer Samuelsson, Carin Lingardh, Christoffer Ellmark,Peter Mannfolk, Juan Rioseco, Depatment of Radiation Physics, Lund University,SwedenRolf Odselius, Electron Microscopy Unit, Lund University, SwedenErkki Ilus, STUK, FinlandTom Ryan (Radiological Protection Institute of Ireland), Ciara McMahon, LuisLeon-Vintro (Dept. of Experimental Physics, University College Dublin), IrelandDeborah H Oughton, Lindis Skipperud, Brit Salbu, Agricultural University ofNorwayJohn Norton Smith, Bedford Institute of Oceanography, Dartmouth, CanadaThe NKS BOK-2 groupe
6 Risø–R–1321(EN)

This work was supported by grants from The Danish Research Agency (Min-istry of Research, Denmark, former The Danish Research Academy), The RoyalPhysiographic Society in Lund, Sweden, Dancea (Danish Co-operation for Envi-ronment in the Arctic), EC contract number FI4P–CT95–0035(ARMARA), NKS(Nordic nuclear safety research) framework program BOK-2.
Risø–R–1321(EN) 7

”Tack, ni svenska vakttorn.Med Plutonium tvingar vi dansken pa kna.Har – Danmark ...Utskitet av kalk och vattenDar – Sverige ...Hugget i Granit ...”
Dr. Stig Helmer (Ernst Hugo Jaregard)i Lars von Triers film Riget
To my lovely Pia and Julliana!
8 Risø–R–1321(EN)


————————————————————–
1 Introduction
The Thule accident has been studied for over 34 years to date. So, is there moreto say, one might ask? The present report gives a somewhat different view thanprevious conclusions. The differences are partly explained by the use of moresensitive analytical techniques and other methods, giving new knowledge of theradiological conditions in the Thule environment.
80 60 40 20
60
65
70
75
8068 45’ W
76 34’ N
Thule Air Base
Greenland
Figure 1. The position of Thule Air Base on Greenland.
Plutonium isotopes have been present in the universe ever since the first super-nova occurred, i.e. about 100 000 years after the Big Bang, and have constantlybeen produced in supernovas since then [1]. When the formation of our planettook place, plutonium was therefore a natural component in the earth material.Today, about 100 amol kg−1 (∼ 50 µBq kg−1) of natural 239Pu is left [2] in theearths crust.
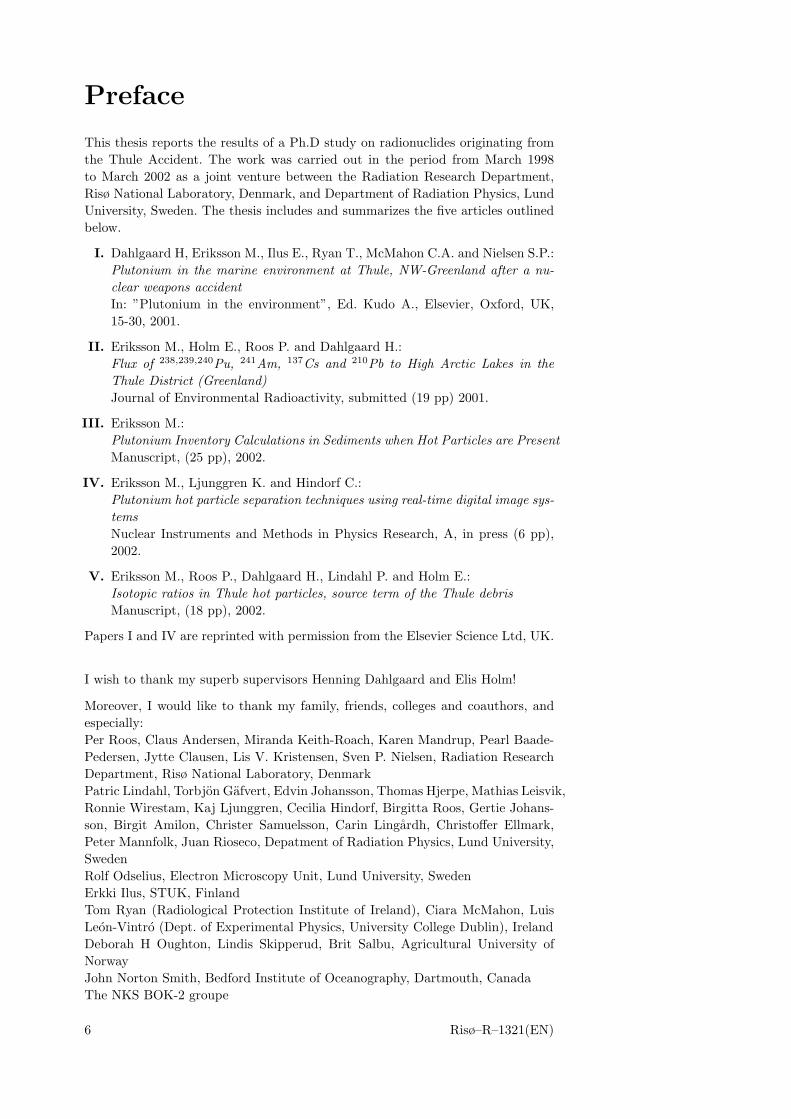
Plutonium is also known as a man-made (anthropogenic) element. The first an-thropogenic Pu was synthesized by Seaborg, McMillan, Kennedy and Wahl in theend of 1940 by bombardment of uranium with deuterium in a cyclotron [3]. Largeamounts of plutonium isotopes are products in the nuclear fuel cycle by neutroncapture (Figure 2). As 239Pu has one of the largest neutron cross sections (forfission) of all known nuclides, and as there is an interest in raising the efficiencyof nuclear reactors and increasing the power of nuclear weapons, enrichment ofthis isotope has been of pronounced interest. Different sources of plutonium, e.g.weapons plutonium, nuclear fuel, global fallout, effluents from plutonium repro-cessing plants, plutonium powered satellites, have different isotopic ratios which
10 Risø–R–1321(EN)

can often be used to identify a specific source of plutonium in the environment.In Table 1 some typical plutonium isotopic ratios from different sources can beeseen.
Table 1. Typical plutonium atomic ratios in different sources. Extracted data fromCooper et al.[4].
Source 238Pu/239Pu 240Pu/239Pu 241Pu/239Pua
Weapons grade (3.34 ± 0.89) · 10−5 0.0282±0.0001 (2.31 ± 0.06) · 10−4
(Kyshtym accident)Fallout from weapons test (1.77 ± 0.32) · 10−4 0.1808±0.0057 (2.64 ± 0.20) · 10−3
(Northern Hemisphere)Waste from Sellafield 1.18 · 10−3 0.1838 0.0116Bravo Test, Bikini Atoll (7.91 ± 0.92) · 10−6 0.32±0.03 (3.8 ± 0.2) · 10−3
Chernobyl accident 3.34 · 10−3 0.563 0.140Thule accidentb 0.027–0.057aDecay corrected to: 01/01/95bData from Paper I
The use of anthropogenic plutonium has caused the content in the biosphereto increase about five orders of magnitude compared to the natural level of 239Pu[2]. Dispersion has mainly been from nuclear test programs, nuclear facilities andaccidents. The present report concerns one such accident that occurred in NWGreenland in January 1968, called the Thule accident.
The following two sections are a summary of the joint report between Americanand Danish authorities and scientists, Project Crested Ice [5] (also published as aRisø Report, Risø–R–213).
1.1 The Thule accident
In the cold war period the super powers, USA and the former USSR, were pa-trolling the air space with aircrafts armed with nuclear weapons. One such aircraftwas the U.S. B52 bomber, HOBO 28. On the morning of the 21st of January 1968,HOBO 28 took off on a 24 hour airborne alert mission with 7 crew members. Af-ter refueling and crew shift, about 5 hours into the mission, a series of problemsstarted which later resulted in the aircraft crashing.
The temperature in the cabin was too low for the crews comfort, so to raisethe temperature, maximum heat on the rheostat was ordered. Soon after, the airtemperature was too hot and a decreased temperature of the rheostat was set.At this moment reports of fumes from burning rubber were reported. Soon, a firewas detected and an emergency landing on the Thule Air Base was started, asall attempts to extinguish the fire were unsuccessful. Shortly after the descentbegan, electrical power was lost and the aircraft became uncontrollable. Orderswere given for the crew to bailout, six of them survived.
At 4:39 p.m. (Atlantic standard time) on Sunday the 21st of January, 1968,the aircraft, with 4 thermonuclear weapons on board crashed onto the sea ice ofBylot Sound (also called North Star Bay), about 11 km west of the shore of theThule Air Base (Pituffik), see Figure 3. The aircraft crashed at a speed higherthan 500 knots and at shallow angle. At impact the recently refueled aircraft andthe weapons disintegrated in a powerful explosion. The accident was observed asflames on the ice in the polar mid winter darkness at the Thule air base (more than11 km from the point of impact). The explosion and disintegration of the weapons
Risø–R–1321(EN) 11
235U
235U
236U
236U
237U
237U
238U
238U
239U
232U
234U
231Th
232Th
234Th
233Pa
236Np
237Np
237Np
238Np
239Np
239Np
236Pu
238Pu
239Pu
238Pu
240Pu
239Pu
241Pu
240Pu
242Pu
243Pu
241Am
242Amm
242Am
243Am
244Am
242Cm
243Cm
244Cm
Decay mode
β−
EC
α
Reaction mode
(n,γ)
(n,γ)
(n,2n)
Figure 2. The nuclear fuel cycle of the transuranic element,[6].
12 Risø–R–1321(EN)

did not produce any fission yield. The surroundings of the point of impact were,however, contaminated with fissile material and tritium from the weapons andwreckage of the aircraft. The seabed under the crash site was also contaminated,since the impact broke up about 2500 m2 of the 60 cm thick ice, were an unknownamount of debris fell to the bottom of the bay. The plutonium contamination wasin the form of oxide particles with a log-normal size distribution, with the meandiameter of 2 µm. The official amount of plutonium involved in the accident is 6kg [7]. A more detailed description of the accident scenario and some informationabout the early investigations can be found in the report Project Crested Ice [5].
76°20'N
76°40'N
Wolstenholme Ø
Narsarssuk
Dundas
Thule Air Base
Kap Atholl
Wolstenholme Fjord
Saunders Ø
Figure 3. The last flight path of HOBO 28 on the 21th of January, 1968
Considering the political climate at that time, and the fact that a militaryaircraft with nuclear weapons from a foreign country crashed on Danish territory,it is not surprising if the official information released to the public was biased.Even today, some information on the incident is classified, and in Denmark thesubject is infected. In the present report the author will not give any opinionsabout the political argumentation around the so called ”Thule affair”. Instead thereport tries to give an objective view of the scientific conclusions, mostly derivedfrom the results of the Thule expedition in 1997.
1.2 Project Crested Ice
The Danish and U.S. authorities decided to investigate if there was any radia-tion hazard to the environment around the Bylot Sound. It was soon clear thatthe accident occurred without any fission yield of the weapons material. Initialhelicopter reconnaissance reported a blackend area approximately 150 × 850 m2
stretching in a southern direction from the point of impact. The black area was aAerial photograph of thecontaminated ice area.From [5]
soot contaminated snow sheet on the ice. It consisted mostly of unburned fuel and,
Risø–R–1321(EN) 13

according to the report Project Crested Ice [5], most of the weapons material wasto be found in this area. The first visit to the accident area was performed withdog sledges, as the ice conditions were unknown. Later it was concluded that theice was strong enough to carry large vehicles, which were used in the clean up op-eration. The first investigations were performed with gamma and X-ray sensitivedetectors; FIDLER (Field Instrument for Detection of Low Energy Radiation),PAC-1S instruments and Geiger-Muller instruments. The FIDLER used a 1/16inch thick NaI(Tl) crystal with a diameter of 5 inches and the PAC-1S used a zincsulphide scintillation detector. The investigations were troublesome because of thesevere weather in the area. The coldness, -40 – -29C, made the wires stiff andcaused the batteries in the instruments to run out of power quickly and stormsprevented occasionally outdoor work. From these investigations a contaminationpattern around the point of impact was obtained and it was estimated that about3.2 kg of Pu was within the blackend area. Ice cores were collected in the area,which were analyzed for alpha activity and results confirmed the first investigationthat most of the activity was to be found in the blackend area on the ice.
After the analysis of the first investigations were finished, it was mutually agreedon a joint meeting between American and Danish scientists (15-16 February, 1968)that the radiation hazard was minimal and that, if all of the radioactive materialin all of the weapons was allowed to sink into the water, the activity concentrationwould be well below the maximum concentration allowed for drinking water. Itwas agreed that, while no serious radiation hazard existed, good ”housekeeping”demanded that the area should be cleaned up.
After this meeting the clean up operation started, which was entitled ProjectCrested Ice. The aim was that all the contaminated black snow sheet and theaircraft wreckage should be removed from the ice and be transported to the USAfor disposal. Roads were built so that large vehicles could be used on the ice.Road grader, belt loaders and trucks were used to pile up, load and transport thecontaminated debris. On land the debris was unloaded into large, 95 m3 (25 000gallon) tanks in an area called the Tank Farm. Project Crested Ice was finalizedon Friday the 13th of September 1968, when the last tank was loaded onto a shipfor transport to the USA.
Picture taken at the endof Project Crested Ice.From [5]
Several different investigations were performed before, during and after the cleanup operation. These are presented in the report Project Crested Ice [5], however,not in detail. The content of the Project Crested Ice report is informational andnot construed as directive. For that reason no presentation of the investigationswill be given here.
1.3 Radioecological surveys
Soon after the accident it was decided to study the radioecological consequencesof the debris from the accident, and to follow the environmental impact overseveral years [5]. The investigations should include both the terrestrial and marineenvironments. The marine environment was considered as the most importantenvironment to study, as the inhabitants in the Thule region, the Inuits, mostlylive off food collected from the sea, i.e. seal, walrus, white whale, sea bird, fishand bivalve.
The wind vector at the time of the accident was southerly, which would probablygive contamination on land close to the Inuit settlement of Narsarssuk. Three daysafter the accident a easterly storm took place for 24 h with wind gusts up to 45knots (23 m/s), which probably resuspended some of the contaminated snow tothe Saundes Island and Wolstenholme Island. Later, contamination of these placeswas confirmed [5, 8, 9].
Elevated plutonium air concentrations in the eastern direction from the Thule
14 Risø–R–1321(EN)

Air Base were observed immediately and up to some month after the accident.Since the 239,240Pu/90Sr ratio was higher at Thule than in the other northernsampling stations at that time, it was concluded that this increased concentrationwas caused by the accident [10, 11]. The air sampling station at Thule is situatedabout 15 km to the east of the air base and at an altitude of 259 m. Air con-centrations and global fallout data for different radionuclides at the Thule stationand other northern sampling stations are available from year 1956 in the Envi-ronmental Measurement Laboratories (EML) open data base [10]. The increasedplutonium air concentrations indicate that the area between the point of impactand the air sampling station (i.e. the Thule Air Base) have been exposed to debrisfrom the accident. No reported investigations from this area are to be found in theliterature, unlike for the marine environment where numerus reports and articlescan be found.
The Bylot Sound has been visited by marine sampling expeditions 7 times overthe past 34 years, i.e. 1968, 1970, 1974, 1979, 1984, 1991 and 1997. These expedi-tions have been performed during the short arctic summer (August, September)when the Bylot Sound generally has open water. However, the sampling can bedifficult and sometimes even prevented by drifting ice passing Bylot Sound oc-casionally during the summer and severe weather with strong storms. On theseexpeditions water, sediment and biological samples have been collected and ana-lyzed. The results from the expeditions between 1968–1991 can be found in e.g.[11, 12, 13, 14, 15, 16, 17, 18, 19, 20] and the results from the 1997 expedition arepresented, excluding this thesis with enclosed papers, in [21, 22, 23, 24, 25].
1.3.1 Water
In the summer following accident, the average water concentration of 239,240Pu inBylot Sound was about 0.2 Bq m−3 [11, 20], based on about 25 samples collectedbetween the 6th and the 21st of August. This was about twice the concentrationmeasured on samples collected remote from the accident area, i.e. the Bylot Soundwater contained about 0.1 Bq m−3 excess accidental 239,240Pu. The filtered (1 µmmillipore filters) water samples showed that these consisted of dissolved Pu, or atleast attached to particles less than the filter pore size. Since the water volume ofBylot Sound is 50 km3, it was about 5 GBq of excess accidental 239,240Pu half ayear after the accident. From 1970, only 3 water samples are reported [12] and thewater 239,240Pu concentration were only slightly above the global fallout levels. Inall of the following expeditions the surface water samples have been of the sameconcentration as expected from the global fallout. In the bottom water there hasbeen increased concentration due to the accident. However, the activity has beenassociated with particles, which most probably have been resuspended from thecontaminated sediments.
1.3.2 Sediments
It has been understood that the plutonium contamination of Bylot Sound sed-iments mostly originates from the unrecovered fraction that was left on the iceafter the cleanup operation. It has been estimated that after scraping and removalof snow from the crash area, about 220 g plutonium were not recovered from theice surface. Additionally, in the refrozen ice (i.e. the area where the ice broke atimpact) it has been estimated that about 350 g was contained within the ice [5].The amount of 239,240Pu injected through the broken up ice to the water has beenimpossible to estimate, but the first thoughts considered it to be a small amount.In the summer it was observed that the ice from the site of the accident wasdrifting to the north before melting, implicating that the plutonium contamina-
Risø–R–1321(EN) 15

tion should mostly be found in a direction northwards from the point of impact.However, in all of the sediment investigations the highest contamination has beenfound beneath the point of impact, which can be an indication of that the Pu in-jected through the broken up ice could be considerable. The estimated inventoriesbetween 1968 and 1991 have been about 1 TBq 239,240Pu, i.e. the amount thatwas not recovered from the ice during the clean up operation.
1.3.3 Biota
Studies of radioactivity in biota in the Bylot Sound have been used to estimatethe absorbed dose commitment from consumption. The absorbed doses from con-sumption of marine biota from Thule were calculated from environmental analysisof Pu in bivalves, shrimps, fish, seabirds, seals and walrus collected at Thule fol-lowing the accident. By assuming an annual individual consumption by the Inuitsof 5 kg bivalves, 5 kg shrimps, 25 kg fish, 5 kg seabird and 30 kg of seal and wal-rus from the Bylot Sound the dose commitment from 1968 and 1995 becomes 143µSv from 239,240Pu and 10 µSv from 241Am [20]. The total committed dose (153µSv) corresponds to the dose received in about 3 weeks from the local backgroundradiation, i.e. an insignificant dose from a human health point of view.
1.3.4 Some thoughts concerning the early investigations
In the literature there has been no discussion about how much of the Pu activitythat has been transported out by water currents during the first 1.5 year after theaccident when measurable concentrations were detected. In Bylot Sound the watercurrent is predominantly tidal [5], pumping seawater in and out of the sound. So,by assuming that the whole volume of water in Bylot Sound is exchanged in 1 week(a guess probably near the upper limit) and that the water 239,240Pu concentrationin Bylot Sound has decreased exponentially since the accident, it is possible tocalculate the amount of 239,240Pu that has left the Bylot Sound with the water.By fitting the accidental excess 239,240Pu water concentration, C = 0.1 Bq m−3, atthe time, t = 0.5 year, and C = 0.01 Bq m−3 at t = 1.5 year to an exponentiallydecreasing function, the intercept (initial activity concentration, C0) and slope(decreasing rate,β) of the curve can be obtained:
C(t) = C0e−βt (1)
The coefficients C0 and β are calculated to 0.32 Bq m−3 and 2.3 y−1, respectively.The cumulated 239,240Pu concentration over time, C, is the concentration function,C(t), integrated over time,
C =
1.5y∫t=0
C0e−βt′ dt′ (2)
0.01
0.10
1.00
0 1 2
C[B
q/m
3]
Time [y]
C
The amount of 239,240Pu that left the Bylot Sound by water transport during thefirst 1.5 year is the cumulated concentration, C = 0.13 Bq y m−3, multiplied bythe water volume of Bylot Sound, V = 50 · 109 m3, divided by the exchange time(1/52 y), which equals to 0.35 TBq. This is a rough estimate, and should only beseen as an example.
1.4 Aims of the studies in the present report
The aim of this report was to continue with the study of the Thule accidentalplutonium in the marine environment. First transfer to the benthic animals, sedi-mentation processes and dispersion of the accidental plutonium in the Bylot Sound
16 Risø–R–1321(EN)

was studied, based on samples collected at the Thule-97 expedition, Paper I. Thesecond aim was to determine if the areas to the east of the accident point have beencontaminated by the debris either from close in fallout and/or from resuspendedmaterial from contaminated areas, Paper II. The third aim was to investigate thehot particle influence of the inventory in sediments of Bylot Sound and to studythe dispersion of accidental plutonium from the point of impact, Paper III. Thefourth aim was to investigate the source term of the Thule accidental debris, byusing hot particles as they can be considered to originate from unique sources,Paper V. To accomplish this study, a new separation and identification methodwas developed for plutonium hot particles, Paper IV.
2 Methods
2.1 Sampling techniques
2.1.1 Water
In Paper II lake water samples are reported which were sampled as follows. Two-hundred litres of filtered surface lake water (filter pore size of 1 µm) were collectedfor the determination of 137Cs, 238,239,240Pu and 241Am concentrations. 137Cs wascollected in two ways. For two of the samples, Cs was absorbed onto copper fer-rocyanide (Cu2[Fe(CN)6]) formed in situ upon the addition of K4[Fe(CN)6] andCu(NO3)2 solutions. The precipitate was collected in plastic carboys for furthergamma spectrometric analysis in the laboratory. The other two Cs samples werepassed, at a low flow rate (approximately 5 litres per minute), through a copper-ferrocyanide-impregnated cotton wound cartridge filter [26]. In the laboratory thefilters were incinerated and prepared for gamma spectrometric analysis. In boththese procedures, 134Cs was used as a yield determinant. To determine the possiblepresence of 134Cs originating from the Chernobyl accident, the 134Cs/137Cs ratiowas determined by pumping large volumes of water, more than 900 litres, througha copper-ferrocyanide-impregnated cotton wound cartridge filter. The filters weretreated in the way described above.
Plutonium and americium were coprecipitated as hydroxides at pH > 10. Firstthe water was acidified with concentrated HCl to a pH of about 2. The precipi-tation was then achieved by adding sufficient NaOH solution to the sample afteradding 100 mg of FeCl3 and about 5 g reducing agent (Na2S2O5), together withthe chemical yield determinants. As the lake water concentration of free ions wasvery low, the addition of Ca, Mg and Al ions was necessary to make hydroxideprecipitation possible. The precipitates were collected in plastic carboys for fur-ther chemical separation and alpha spectrometry in the laboratory. The isotopes242Pu and 243Am were used as radiochemical yield determinants for Pu and Am.
Surface and near bottom seawater samples were collected during the Thule 97expedition, which is reported in Paper I. The water sampler used had a volume of130 litres. The samples analysed at Risø were of about 180 litre unfiltered watersamples. The determination of Pu was performed as described above, however,without the addition of Ca, Mg and Al ions. Several other seawater samples werecollected for speciation of Pu in the water. These methods and results are publishedelsewhere [21].
Risø–R–1321(EN) 17

2.1.2 Sediment
The lake sediments were sampled by a kayak sediment sampler (HTH corer), witha core diameter of 6.4 cm. The sediment cores were sliced in 1 cm layers, which
The sediment corer usedin the lake survey.
were stored in plastic bags. On arrival at the home laboratory the wet/dry weightratio and loss on ignition (LOI) were determined.
Two different sediment corers were used for the marine sediments during theThule-97 expedition. Most sediment samples were collected with the Finnish Gem-ini Twin Corer, new version of the Niemisteo Corer, delivering two parallel 8 cmdiameter cores. Immediately after sampling, the cores were extruded and sliced,normally in 1 cm slices. In most cases, the same layer from the two cores collectedsimultaneously were pooled. At many sampling locations, stones hampered sedi-ment coring. At these locations, the HAPS corer, a 13.6 cm diameter steel corer,had a better success rate. HAPS cores without too large stones were divided in 3cm slices onboard. The samples were stored frozen in plastic boxes. On arrival atthe laboratory, the wet weight was determined followed by freeze drying.
2.1.3 Biota
Shrimps and starfish were caught, occasionally, with crab-cages. However, mostbenthic biota samples were collected by a Sigsbee trawl and a Van-Ween grab. Asfar as feasible, the sampled biota were allowed to purge in clean surface seawaterto reduce the importance of sediments in their guts. The seaweed (Fucus) sampleswere collected from the shore lines of the visited islands by using a Zodiac rubberboat.
2.2 Radiochemical separation techniques
When the radionuclides in the sample cannot be measured directly, it becomesnecessary to do a chemical separation. This is the case for all the alpha andmost of the beta emitting radionuclides. Firstly, the attenuating material mustbe separated from the studied nuclide and, secondly, the interfering radionuclides,with similar energy in the spectra must be removed. Separation techniques canalso be used if the concentration in a sample is low, but it is then more a questionof pre-concentration from a large sample volume. The final step is to prepare asource to the detector used for measurement of the radionuclide. The radiochemicalanalysis procedures used in the present work, with some modifications, are describeby Talvitie [27] and Holm [28]. The principal of a radiochemical chain is outlinedbelow.
2.2.1 The use of tracers
In the chemical separation procedure some of the radionuclides studied will belost in the different steps. To be able to determine the chemical yield, a knownamount of an isotopic yield determinant (also called tracer) is added to the samplein the beginning of the procedure. At the end, the yield is determined either byradiometrical or gravimetrical methods.
Some radionuclides do not have an isotopic tracer, then a nuclide with similarchemical properties is used instead, i.e. a non-isotopic tracer. It is assumed thatthis non-isotopic tracer behaves in the same way as the studied radionuclide inall the different separation steps. In Table 2 the yield determinants used in theenclosed papers of this report are listed.
An ideal tracer should only contain one specific nuclide not present in the studiedsample. However, often the actinide tracers contain trace amounts of impurities,
18 Risø–R–1321(EN)

usually of the same isotope or from the ingrowth from decay of the tracer to othernuclides. For that reason, in the determination of nuclide ratios in a sample, thechemical separation is often processed without any addition of tracers.
Table 2. Examples of chemical yield determinants are listed for different radionu-clide separations.
Analyte Yield determinant137Cs 134Cs, measured by gamma spectroscopy
210Po 208Po or 209Po, measured by alpha spectroscopy
234,235,238U 232U, measured by alpha spectroscopy
234,235,238U 233U, measured by alpha spectroscopy or mass spectrometry
237Np 239Np, measured by beta counting or gamma spectroscopy
237Np 242Np, measured by alpha spectroscopy or mass spectrometry
238,239,240Pu 242Pu, measured by alpha spectroscopy or mass spectrometry
241Am 243Am, measured by alpha spectroscopy
2.2.2 Sub-sampling
This is a critical step, which the result totally depends upon. Often the totalsample is much larger than the amount that can be processed in the chemicalseparation procedures, or the sample will be used to represent a large area. Totake an adequate sub-sample for the whole sample can be difficult, especially ifthe sample contains so called hot particles. Often the sampling regime are basedon the fact that the activity is homogeneously spread in the sample or area,which makes the evaluation of the results easier. In Bylot Sound sediments theactivity concentration is very heterogenous, but in the past the sampling has beenperformed as if the activity concentrations was homogeneous, i.e. small and fewsub-samples have been used to represent large areas.
One way to avoid taking an un-representative sample in an area with hot par-ticles is to increase the sub-sample size and/or by taking more aliquots from thesamples. However, this can be difficult as there are no good methods describingtotal dissolution of large sediment samples.
In Paper III a gamma screening method for sediments is presented. It is basedon that five 1 g aliquots (i.e. the normally used size of aliquots in the earlierinvestigations) are taken from each sediment slice in a sediment core. Further, ifone core is sliced in N slices, 5N permutations (different sets of core combinations)can be derived from one single core. The 239,240Pu is then determined by indirectgamma measurements on 241Am. By a Monte Carlo program, using replacement ofthe samples, the core inventory distributions were calculated. The advantages withthis technique are that the dissolution problem with the hot particles is excludedand it is faster and cheaper than radiochemical determination, resulting in moresamples being measured. Finally, the fluctuations in the inventory caused by theheterogenous activity concentration can be observed.
Risø–R–1321(EN) 19

2.2.3 Solubilisation
When the sub samples have been prepared, the separation starts. The dissolutionof samples containing radionuclides can be achieved either by leaching or by totaldissolution. If the sample is of solid material the procedure usually begins withashing in an oven. The ashing temperature depends on the nuclide, which is goingto be studied. In the ashing procedure the organic compounds are eliminated inthe sample. If the nuclide is volatile, wet ashing is preferred to minimize losses.After the ashing, leaching of the nuclides from the sample starts. Leaching is of-ten performed with Aqua Regia. This step solubilizes the nuclides from the sampleinto the solution. In some cases the radionuclide compounds are not ”opened up”by Aqua Regia, which is the case for refractory Pu-oxide particles . Then strongerregents must be used. An efficient mixture of hydrofluoric and nitric acid can beused to totally dissolve these particles [29]. The results from a small test (HFtest) performed to evaluate how effective the Aqua Regia leaching technique is todissolve Pu in Bylot Sound sediment, is presented below.
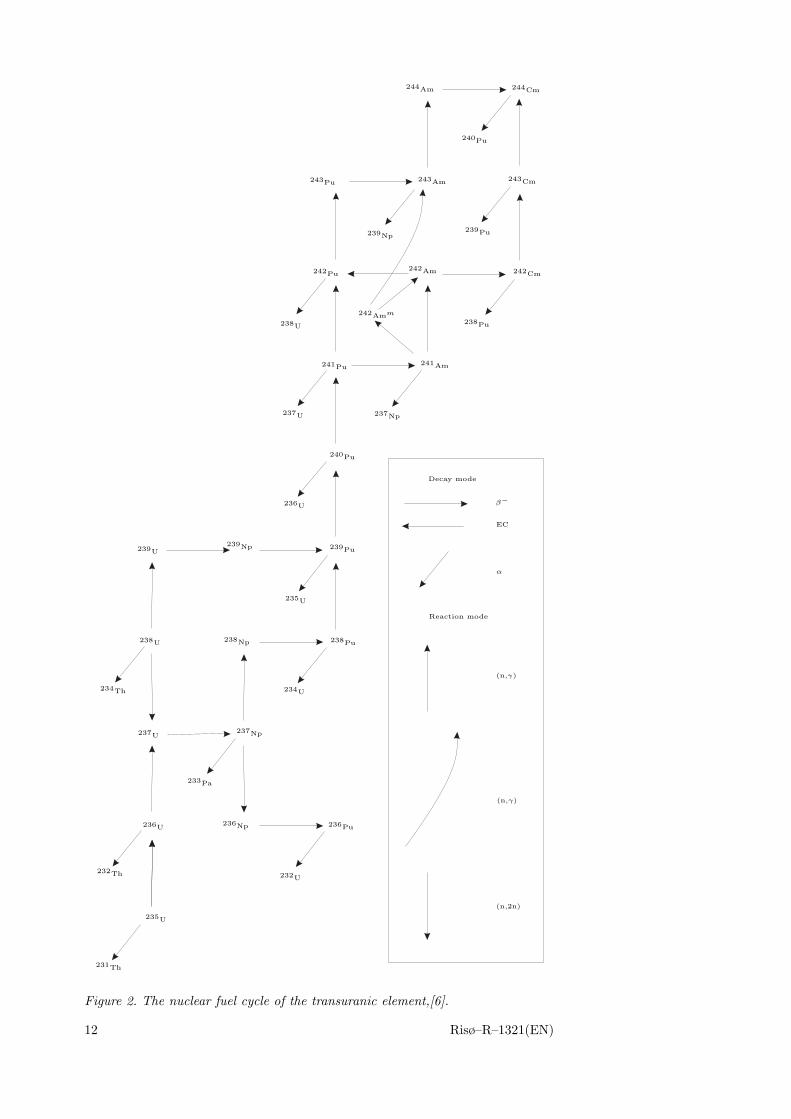
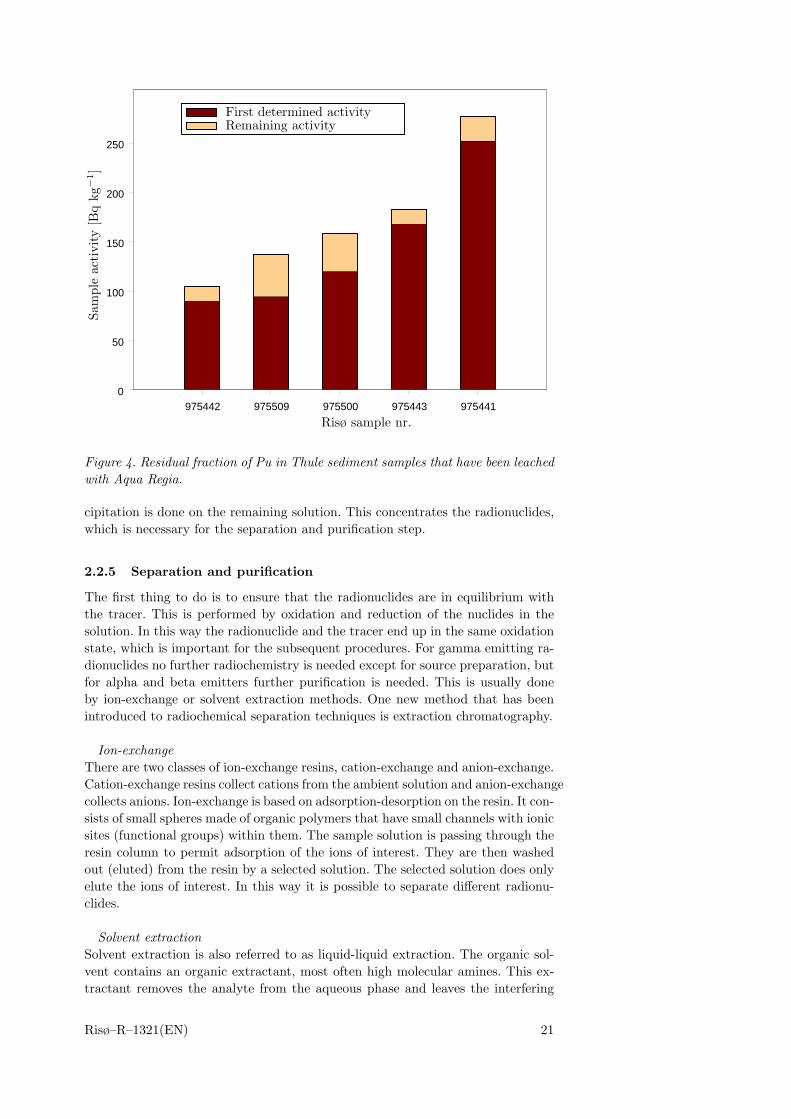
HF testThe chemical form of plutonium in the Thule debris is PuO2. This form is knownto be difficult to completely dissolve [29]. To investigate the Risø standard method(which is the method described by Talvite [27]) of dissolving plutonium in sedi-ment samples a small test was performed. The test assumed that if any plutoniumremained undissolved using the Talvitie method, it would be associated with theresidue sediment after the 2 h Aqua Regia leaching. In the test the residue wastotally dissolved in a mixture of HF and HNO3 (1:3 ratio). After that, a newamount of tracer was added. The samples used were all low activity samples fromThule sediments, where the activity concentration can be over 3 orders of magni-tude higher than the samples analyzed in the test. The maximum amount of Puleft in the residue was calculated from the chemical yield determined for the sam-ples that had been leached with Aqua Regia. This amount was subtracted fromthe Pu activity results of the residue fraction. If the tracer in the first activitydetermination is equal to that in the sample Pu, then the second result shouldbe of zero activity. The results from these experiments are seen in Figure 4. Itcan be seen that 8 – 31 % of the plutonium in the samples is missing when usingthe Aqua Regia method. The chemical yields were good for all the results of theAqua Regia method, indicating that a minimum of Pu was lost in the chemicalprocedure, a conclusion that is incorrect. It is also expected that in high activ-ity samples including hot particles, a larger fraction would be left out, and as aconsequence, the activity determination would be underestimated using the AquaRegia method. This is discussed in detail in Paper III. For samples from theThule area, the leaching method should not be used. Preferably a total dissolvingtechnique should be used, such as using a mixture of HF and HNO3 or an alkalinefusion technique. The HF/HNO3 dissolution method has been used on the sam-ples presented in Paper II, Paper V and to some extent in Paper III, while inPaper I the Aqua Regia method was used.
Another efficient method of total dissolution is alkaline fusion [30]. The sampleis placed, together with e.g. Na2O2/NaOH, in a vessel that is then placed in anoven (temperature around 900 C). The fusion melt is then dissolved in acid.
2.2.4 Concentration
After the dissolution there is a lot of bulk material that is not desired. This bulkmaterial can be solid or liquid residue from the leaching procedure. The solidmaterial is filtered or centrifuged so only the solution is left. Evaporation or pre-
20 Risø–R–1321(EN)
975442 975509 975500 975443 9754410
50
100
150
200
250
Risø sample nr.
Sam
ple
acti
vity
[Bq
kg−
1]
First determined activityRemaining activity
Figure 4. Residual fraction of Pu in Thule sediment samples that have been leachedwith Aqua Regia.
cipitation is done on the remaining solution. This concentrates the radionuclides,which is necessary for the separation and purification step.
2.2.5 Separation and purification
The first thing to do is to ensure that the radionuclides are in equilibrium withthe tracer. This is performed by oxidation and reduction of the nuclides in thesolution. In this way the radionuclide and the tracer end up in the same oxidationstate, which is important for the subsequent procedures. For gamma emitting ra-dionuclides no further radiochemistry is needed except for source preparation, butfor alpha and beta emitters further purification is needed. This is usually doneby ion-exchange or solvent extraction methods. One new method that has beenintroduced to radiochemical separation techniques is extraction chromatography.
Ion-exchangeThere are two classes of ion-exchange resins, cation-exchange and anion-exchange.Cation-exchange resins collect cations from the ambient solution and anion-exchangecollects anions. Ion-exchange is based on adsorption-desorption on the resin. It con-sists of small spheres made of organic polymers that have small channels with ionicsites (functional groups) within them. The sample solution is passing through theresin column to permit adsorption of the ions of interest. They are then washedout (eluted) from the resin by a selected solution. The selected solution does onlyelute the ions of interest. In this way it is possible to separate different radionu-clides.
Solvent extractionSolvent extraction is also referred to as liquid-liquid extraction. The organic sol-vent contains an organic extractant, most often high molecular amines. This ex-tractant removes the analyte from the aqueous phase and leaves the interfering
Risø–R–1321(EN) 21
ions in the aqueous phase. The analyte forms a complex which is more solublein the organic phase. The purified analyte is then back-extacted from the organicphase into a separate aqueous phase by adjusting the extraction conditions. Theseparation can also be done the other way around, i.e. the interfering ions areforming an organic soluble complex and leave the analyte in the aqueous phase.Some examples of organic extractants for Pu are thenoyltrifluoroacetone (TTA)and tri-butyl-phosphate (TBP).
Extraction chromatographyExtraction chromatography involves the use of resins of highly selective organicextractants. The resins are used as ion-exchange columns. However, due to thehighly selective nature of the extractant much smaller quantities of the resin areneeded and smaller volumes of the reagent which decrease the total separation timefor the whole radiochemistry procedure. There are resins for some radionuclides,and for separation of americium the two resins CMPO and Aliquat-336 are used[31, 32].
2.2.6 Source preparation
Before alpha and beta measurements, the nuclides are attached to a disc or trans-ferred to a liquid scintillation tube. When measuring the radionuclides in a scin-tillation device it is straight forward and no further chemical procedure is needed.In the alpha and beta device it is necessary to attach the radionnuclide to a disc.This can be performed using two methods. One of the methods is to precipitatethe nuclides and filter the precipitation onto a filter. This filter can then be mea-sured. The resolution is often poor in alpha systems when using this method, butit is sufficient for beta counting. The other principle is to deposit the radionuclideson metal discs by electrolysis [33], which was the technique used on the Pu, Amand U samples in the present report.
2.3 Detection and detection limits
2.3.1 Radiometric methods
In this section a brief explanation of how to measure the most common decayproducts is given. It is focused on the Alpha decay, Beta minus decay and theInternal conversion. Some disintegrations are followed by more than one radiationquantity, for example gamma-photons and beta-particle in the same disintegration.
Alpha spectroscopyThe most common technique to measure the actinide elements is by alpha spec-troscopy. Every isotope has its signature in form of the disintegrating energy emit-ted from one or several energy levels. Most of the actinides are alpha emitters. Bymeasuring the alpha-particles energy, the signature, the nuclide can be identifiedand the activity determined in a sample. The detectors used are often solid-statedetectors with a good preamplifier and a linear amplifier connected to a pulseanalyzer. Ionisation-chambers can also be used for alpha spectrometry. Since theresolution of alpha systems are poor compared to gamma systems using solid statedetectors, it is difficult to resolve multiple peaks in the spectra. For example, thetwo nuclides 239Pu and 240Pu have similar energies and the alpha spectra appearoften as one peak. This peak is a composition of five peaks. There are, how-ever, methods to resolve them. One of the methods is by using a deconvolutiontechnique [34, 35, 36, 37]. This technique requires a spectrum with fairly goodresolution (FWHM < 20 keV) and a well-known point-spread function of the de- FWHM, Full Width at
Half Maximum
22 Risø–R–1321(EN)

tector system. The point-spread function can either be a theoretically calculatedfunction or a separated mono-energetic peak in the spectra. By deconvolution, itis possible to get information about the contribution of individual peaks to thetotal peak and thereby also the nuclide activity ratio. This method has been usedfor instance to determine the source term and composition of the Thule debris[38]. A typical Pu alpha spectrum is seen in Figure 5. This Pu spectrum is froma high active Thule sediment sample.
As a note, measurements of alpha emitting nuclides can also be performed bya liquid scintillation system with a pulse shape analyzer. This device can distin-guish between alpha and beta particles, but the technique has rather poor energyresolution so the result gives total alpha activity in the sample [24, 39].
Figure 5. An alpha spectrum (log scale) from a sediment sample taken in the Thulearea (Greenland), 1997. This is a Pu-sample including a so called ”hot particle”.To the left is the tracer 242Pu peak, in the middle is the combined peak from239,240Pu and to the right is the 238Pu peak.
Gamma spectroscopyThis technique to measure the disintegrating energy is the only method that usu-ally does not need chemical separation before measurement. This is often true,but when the photon energy is low, attenuation in the sample can be significantand makes it difficult to determine the activity of the sample. Low energy pho-tons occur for example from internal conversion decay in form of monoenergeticX-rays. Beta decays often leave the daughter nuclide in an excited mode and inthe deexcitation the nucleus sends out a gamma photon. This photon can be mea-sured and the nuclide and the activity in the sample can thereby be determined.The most commonly used detectors are solid-state detectors of the type HPGeand scintillation detectors, often of NaI type. The detectors are connected to am-plifiers and a pulse height analyzer. This is the most commonly used technique fordetermining radionuclides and their activity in a sample. In Paper III a well typeHPGe detector have been used for measurements on 241Am in sediment samples.The well detector is suitable for measurements on samples when Pu hot particleare present, as the count-rate is less geometrical dependent of the particle posi-tion than a planar detector. Gamma spectrometric measurements combined withalpha spectrometry can be used to determine the 240Pu/239Pu ratios by measure-ments on the L X-ray for the different isotopes. This method is described in [40, 41]
Beta measurementsSome of the radioactive isotopes have no alpha or gamma emission when a dis-integration occurs. These nuclides are pure β-particle emitters. The beta decay
Risø–R–1321(EN) 23

always includes a neutrino with which the disintegration energy is shared. Thisresults in the beta particle having no discrete energy as for alpha particles andgamma photons. Instead there is a distribution from zero to maximum energy ofthe disintegrating energy, the so called endpoint energy. This makes it very diffi-cult to distinguish between different beta emitting radionuclides, without doing achemical separation before the measurements. The measurements are usually per-formed in a counting system, either by liquid scintillation counter, proportionalcounter or by a Geiger-Muller tube. 241Pu, 99Tc and 90Sr are examples of nuclidesthat are radiometrically measured by these techniques.
2.3.2 Indirect measurements of 239,240Pu
When it is difficult or expensive to measure a particular radioactive nuclide, mea-surements can be performed on the daughter nuclide or a nuclide with knownratio, to determine the activity. In Paper III, indirect measurements of 239,240Puhave been performed by measurements of the gamma emitting 241Pu daughter,241Am. The 241Am samples were absolute calibrated to 239,240Pu by selecting 20 ofthe 440 measured samples on which Pu radiochemistry were performed. This tech-nique is promising for the Thule area, as the 241Am/239,240Pu activity ratio is stillincreasing as all of the 241Pu has not decayed. The maximum 241Am/239,240Puactivity ratio has been estimated to take place around year 2035 in the BylotSound sediments [15]. This method is cheaper and faster, which means that moreand larger samples can be used to determine the activity.
2.3.3 Sediment dating techniques
Sediment is an environmental and historical archive containing information aboutevents and conditions in the past. To determine the chronology of sediments, onehas to look for historical markers, such as a single injection of radioisotopes orother well defined events like ash from volcanos. It is, however, possible to usenatural radioisotope 210Pb for dating purposes. The purpose of using sedimenta-tion models is often to determine the sedimentation rates and the mass flux inthe water. There are basically two models used for lake sediments today, the CIC(Constant Initial Concentration) and the CRS (Constant Rate of Supply) models[42]. In this way it is possible to date a specific sediment slice in the sediment core.For instance, there may occur a peak of a radionuclide or there may be some otherindication of an event that is of importance to date. These indications can alsobe a tool for checking the model if the time of the event is well known. The twomodels are based on the excess 210Pb in undisturbed sediment and the half-life ofthis radionuclide. The difference between the two models is that the mass flux mayvary in the CRS model while it is constant over the time in the CIC model. Thelater model (CIC) is hardly used anymore as the assumption of constant mass fluxis considered to be incorrect. The CIC model gives the age of a specific sedimentslice at a depth, x, as:
t =1λ
ln(
CPb,0
CPb(x)
)(3)
where CPb,0 and CPb(x) are the excess 210Pb activity concentration [Bq kg−1] atthe surface and the sediment slice at the depth x.
The CRS model gives the the age of a specific sediment slice at a depth, x, as:
t =1λ
ln(
A(0)A(x)
)(4)
24 Risø–R–1321(EN)
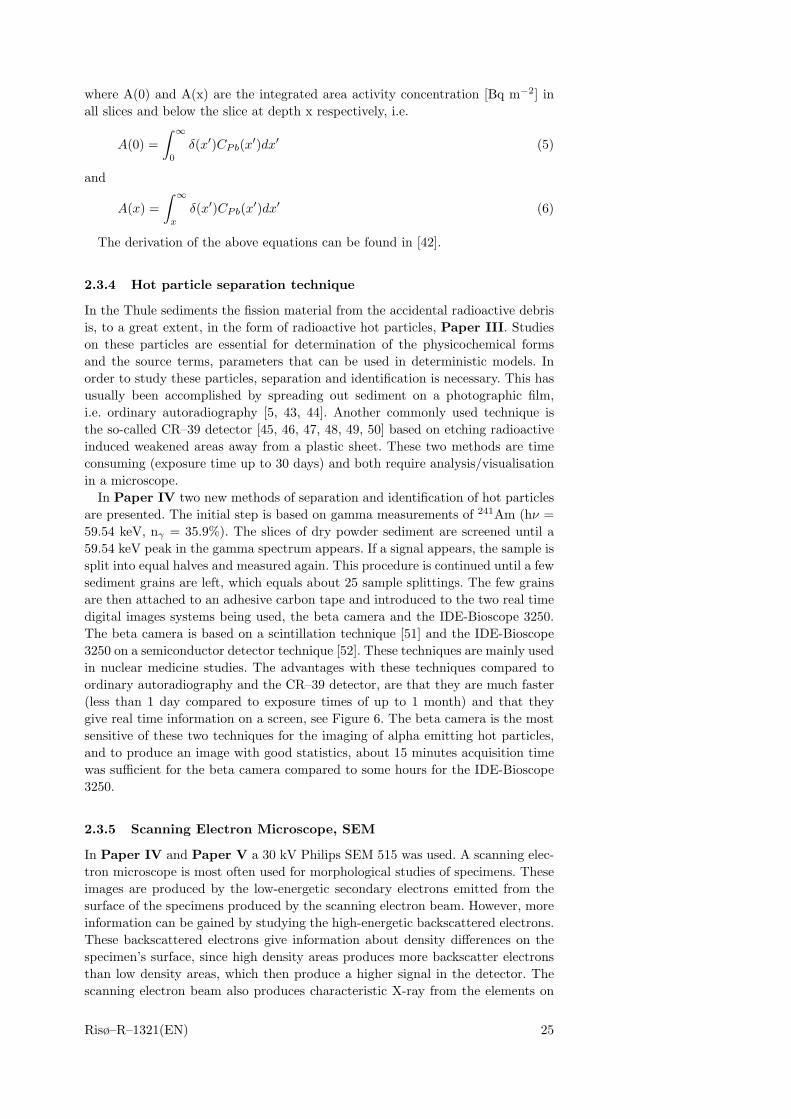
where A(0) and A(x) are the integrated area activity concentration [Bq m−2] inall slices and below the slice at depth x respectively, i.e.
A(0) =∫ ∞
0
δ(x′)CPb(x′)dx′ (5)
and
A(x) =∫ ∞
x
δ(x′)CPb(x′)dx′ (6)
The derivation of the above equations can be found in [42].
2.3.4 Hot particle separation technique
In the Thule sediments the fission material from the accidental radioactive debrisis, to a great extent, in the form of radioactive hot particles, Paper III. Studieson these particles are essential for determination of the physicochemical formsand the source terms, parameters that can be used in deterministic models. Inorder to study these particles, separation and identification is necessary. This hasusually been accomplished by spreading out sediment on a photographic film,i.e. ordinary autoradiography [5, 43, 44]. Another commonly used technique isthe so-called CR–39 detector [45, 46, 47, 48, 49, 50] based on etching radioactiveinduced weakened areas away from a plastic sheet. These two methods are timeconsuming (exposure time up to 30 days) and both require analysis/visualisationin a microscope.
In Paper IV two new methods of separation and identification of hot particlesare presented. The initial step is based on gamma measurements of 241Am (hν =59.54 keV, nγ = 35.9%). The slices of dry powder sediment are screened until a59.54 keV peak in the gamma spectrum appears. If a signal appears, the sample issplit into equal halves and measured again. This procedure is continued until a fewsediment grains are left, which equals about 25 sample splittings. The few grainsare then attached to an adhesive carbon tape and introduced to the two real timedigital images systems being used, the beta camera and the IDE-Bioscope 3250.The beta camera is based on a scintillation technique [51] and the IDE-Bioscope3250 on a semiconductor detector technique [52]. These techniques are mainly usedin nuclear medicine studies. The advantages with these techniques compared toordinary autoradiography and the CR–39 detector, are that they are much faster(less than 1 day compared to exposure times of up to 1 month) and that theygive real time information on a screen, see Figure 6. The beta camera is the mostsensitive of these two techniques for the imaging of alpha emitting hot particles,and to produce an image with good statistics, about 15 minutes acquisition timewas sufficient for the beta camera compared to some hours for the IDE-Bioscope3250.
2.3.5 Scanning Electron Microscope, SEM
In Paper IV and Paper V a 30 kV Philips SEM 515 was used. A scanning elec-tron microscope is most often used for morphological studies of specimens. Theseimages are produced by the low-energetic secondary electrons emitted from thesurface of the specimens produced by the scanning electron beam. However, moreinformation can be gained by studying the high-energetic backscattered electrons.These backscattered electrons give information about density differences on thespecimen’s surface, since high density areas produces more backscatter electronsthan low density areas, which then produce a higher signal in the detector. Thescanning electron beam also produces characteristic X-ray from the elements on
Risø–R–1321(EN) 25

Figure 6. Real-time images of the same particle using two different systems. Tothe left is the image obtained after 8 hours in the IDE Bioscope, and to the rightthe image after 1 hour of exposure to the beta camera. The five dots in the betacamera image are the superimposed position system. The distance between the dotsis 3 mm. Image from Paper IV.
the specimen’s surface, which can be analysed by an energy dispersive X-ray anal-yser (EDX). It can, however, be difficult to determine the elemental ratios in thespecimens, as, firstly, the cross sections for the same electron energy are differentfor different elements and the cross sections also differ for different electron shellsof the element. Secondly, the fluorescence yield must be taken into account. Theelements have different electron binding energies and as the electron beam, duringpassage into the specimens, will lose energy in collisions, the mean energy of elec-trons in the beam will decrease as a function of depth. This means that elementswith lower Z, and thereby lower binding energies, will produce X-rays in a largervolume than the high Z elements, resulting in the ratio derived from a spectrumbeing biased. There is a rule of thumb; when dong an elemental ratio estimateusing SEM, the mean energy of the electrons in the scanning beam must be threetimes higher than the binding energies of the element studied [53]. For a Pu/U hotparticle, analyzed by a 30 kV scanning electron beam, one could only use the MX-ray lines in the elemental ratio determination. This, since the L3 shell bindingenergies are 18.05 keV and 17.17 keV for Pu and U, respectively, i.e. about 2/3 ofthe mean energy of the scanning beam electrons.
2.3.6 Mass spectrometry
A method that gains more and more popularity in the measurements of actinidesis mass spectrometry. Mass spectrometry is more sensitive than alpha spectrom-etry and is a complement to this method when the sample activity is low and inthe determination of isotopic ratios. In general the principle is that the atoms areionized, accelerated and declined by a magnet and/or passing through an elec- F = qv× B
tric field created by a quadrupole lens, whereby the masses are sorted out. The F = qEnuclides, sorted by mass, are then counted by a collector. A relatively new massspectrometry technique, the so called ”time of flight”, uses the fact that ions ofthe same charge with different masses and with the same kinetic energy will havedifferent velocities (see Equation 7), i.e. they will reach the collector at differenttimes and thereby mass separation can be accomplished.
The general physics behind the mass spectrograph is simplified by the equations7–9.
26 Risø–R–1321(EN)

The energy furnished by the acceleration potential is
V · q =m · v2
2(7)
where q and m are the charge and mass of the ion, respectively. When the ionenters the magnetic field, the centripetal force furnished by the magnetic field is
m · v2
r= q · v · B (8)
Solving equation 7 and equation 8 simultaneously for m gives
m =r2 · B2 · q
2V(9)
Below is a presentation of the most common techniques in this field. The differ-ence between them is mainly how the device produces the ions that are injectedinto the accelerating tube.
Thermal Ionization Mass Spectrometer, TIMSTIMS is a very sensitive mass spectrometer and some configurations can measurefemtograms of one element in a sample. It is used to determine isotopic ratios ofuranium, but the technique has also started to be used in transuranic studies [54].After chemical separation the sample is either electrodeposited on the rheniumfilament or the solution is loaded on the filament and then dried. The ions areproduced when the filament is heated. With this technique most of the isobaricand molecular inteferences are eliminated.
Inductively Coupled Plasma Mass Spectrometer, ICP-MSWith this technique the ions are produced in a microwave tube. In this tubethe microwave produces a high temperature plasma of the injected sample. Foractinide studies the sample must be prepared by chemical separation to avoidmolecular or isobaric interference, which is a problem with this technique. Thedetection limits are in the order of picogram/milliliter. By applying an ultrasonicnebuliser the limit can go down to femtogram/milliliter. The ultrasonic nebuliserproduces a spray of small aerosols that are injected into the microwave tube. Crossflow nebulizers are also commonly used in ICP-MS techniques. In the cross flownebulizer the argon gas flow also produce a spray of small aerosols but a smallerfraction reaches the plasma. In Paper V, two types of ICP-MS machines havebeen used, one Quadrupole ICP-MS (ELAN 6100) and a high resolution-ICP-MS(PlasmaTrace2).
Accelerator mass spectrometry, AMSThis is the most sensitive device today, and the mass separation is about 1000times better than the two methods described earlier. The device is a tandem ac-celerator, working with MeV energies. The ion source can be of different types.Most common is a sputtering source, where a beam of Cs-ions is focused on thesample, resulting in production of multiple charge ions of the nuclide that is stud-ied. The samples are prepared in advance with chemical separations. The techniquehas hardly any problems with isobaric, isotopic or molecular interference. It is themost expensive method for measuring the nuclides. At some places in the worldalso transuranic elements are measured with success using this technique [55, 57].
2.4 Statistics
The uncertainty limits reported in the present paper have been determined usingthe error propagation hypotheses where the standard deviation can be calculated
Risø–R–1321(EN) 27

as in equation 10.
σ2y =
(∂y
∂a
)2
σ2a +
(∂y
∂b
)2
σ2b +
(∂y
∂c
)2
σ2c + ... (10)
where a, b and c are the variables of the determined quantity y (mass, activityor ratio). Typical variables are: sub sample size, tracer concentration, number ofcounts in the peak, etc. The uncertainty of the isotopic ratios derived from thesame spectra only includes the counting statistics, as the ratio is independentof the tracer and sample size. For mean values the standard deviation (SD) andnumber of samples (n) are reported.
2.4.1 Distribution functions
In Paper III the results are given in form of distribution functions. Since thedistributions are skew, the standard deviation has less meaning, and for thatreason the median value, together with the first and third quartile are presented,i.e. the interval where 50% of the results, centered around the median value, areincluded.
In Paper III there is also a discussion on the particle size distribution reportedfor the Thule debris [5]. The particle size distribution measured was a log-normaldistribution with a standard deviation of 1.7 and a mean diameter of 2 µm. Thiswould result in that a few large particles carry most of the activity. The probabilityof sampling such large particles in a log-normal particle distribution is very low.This must be considered in the sampling strategy in order to obtain representativesamples. In the earlier investigations a few grams of dry sediment in these activityheterogeneous sediments were extrapolated to represent an area from 0.5 km2 toseveral square kilometers. The values reported can for that reason not be used forinventory estimates with good credibility.
3 Results and Conclusions
3.1 Source term
To a scientist doing investigations, the source terms are equally important toknow as the fingerprints of criminals are for the court of law. By knowledge of thesource terms, estimates of the excess amount of one specific source contributionwithin a sample can be made. The source term is often a ratio of elements thatthe debris consists of. The Thule debris was soon realized not to contain anyfission products as no fission occurred. In the first investigations it was assumedthat the Thule debris consisted of one single source, and in the first reports theisotopic ratio of 238Pu/239Pu was used to characterize the debris [5, 11]. Laterthe nuclides 240Pu, 241Pu and 241Am were included in the characterization [12,13, 14, 15, 17, 19]. It was, however, assumed that only one unique source termwas present in the debris. One investigation in 1997 [38], using a deconvolutiontechnique on alpha spectra derived from five sediment samples from the Thulearea, received scattered 240Pu/239Pu activity ratios, leading to the suggestion thatmore than one unique source is present in the Thule debris. These samples werelater, in 1998, measured in a HR-ICP-MS and the isotopic ratios were more or lessconfirmed [23, 58]. These results started an investigation of several Thule sedimentsamples to evaluate if there were more than one unique source, or if the 5 sampleshad been contaminated in the laboratory, not from fallout but rather from hotsamples collected in the Mayak area (Russia). About 50 one gram aliquots from
28 Risø–R–1321(EN)

sediment samples close to the impact point, i.e. fallout inventory is insignificant,were measured in a HR-ICP-MS instrument. The results indicate that more thanone source was present in the debris Paper I, [23]. The 240Pu/239Pu ratios werescattered, but the high activity samples were split into two groups, see Figure 7.These results are based on bulk sediment samples which probably contain fractions
0 500 1000 1500 2000 2500
0.035
0.040
0.045
0.050
0.055
mBq
240Pu/239Pu
mass
rati
o
101 102 1032 3 4 5 6 7 8 2 3 4 5 6 7 8 2 3
0.035
0.040
0.045
0.050
0.055
0.060
mBq
240Pu/239Pu
mass
rati
o
Figure 7. The two plots show the 240Pu/239Pu mass ratio in bulk sediment samples.The two plots consists of the same data and the ratios are plotted against theactivity in the sub sample. To the left is a linear scale and to the right a logarithmicscale for the sub sample activity. The mass ratios are grouped in two groups around0.056 and 0.035. From Paper V.
of all the sources present. It is probable that other elemental and isotopic ratioswould vary between different sources. In Paper I the correlation between the238Pu/239,240Pu and 241Am/239,240Pu to the 240Pu/239Pu ratio were examined.There was a weak correlation, which could partly be explained by the fact thatthe counting statistics of 238Pu for some samples were low and the interference inthe peak from 228Th could be of significance. The 241Am/239,240Pu ratio, on theother hand, had scattered ratios partly because the nuclide activity concentrationswere sometimes determined from different aliquots, which is a fatal procedure asthe activity concentration is heterogenous in the Thule sediments (see discussionbelow). A report on scattered 241Am/239,240Pu activity ratios in Thule sedimentshave been presented, in which the suggestion of different sources were addressed[24].
As mentioned above, the measured 238Pu/239,240Pu ratio was scattered, whichcan be an indication of different sources. In Paper V the 238Pu/239,240Pu ratio wasobtained from samples collected during the last three Thule expeditions in 1984,1991 and 1997. The mean ratio from 328 samples close to the point of impact, i.e.the global fallout plutonium is insignificant, was 0.014 ± 0.004 (decay corrected to2002). However, by applying certain criteria to the samples studied to ensure thatthe activity originated from one source, some valuable information was gained.One criteria was that sub-samples with the highest activity would most probablyoriginate from one source. The second criteria was that an abnormal activityconcentration peak should appear in the sediment depth profiles. About 20 of the328 samples satisfied these two criteria. The interesting observation is that noneof these samples had the mean ratio of 0.014, instead the 238Pu/239,240Pu activityratios were grouped around 0.016 and 0.010.
At the time when the results discussed above were reported, limited attentionhad been paid to hot particles present in the sediments of the Bylot Sound. Oneoptimal procedure to confirm if the debris consists of different sources, would be tostudy single isolated hot particles, which most probably would originate from oneunique source. One such study has been performed in Paper V on five particles
Risø–R–1321(EN) 29
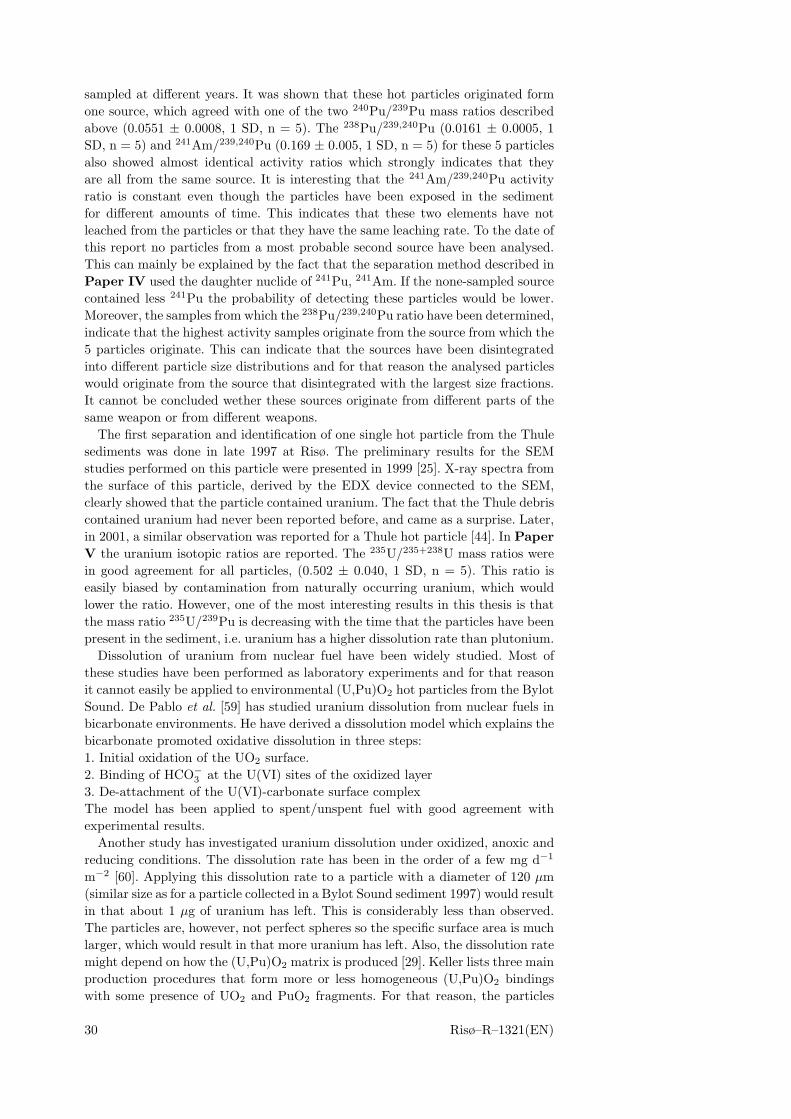
sampled at different years. It was shown that these hot particles originated formone source, which agreed with one of the two 240Pu/239Pu mass ratios describedabove (0.0551 ± 0.0008, 1 SD, n = 5). The 238Pu/239,240Pu (0.0161 ± 0.0005, 1SD, n = 5) and 241Am/239,240Pu (0.169 ± 0.005, 1 SD, n = 5) for these 5 particlesalso showed almost identical activity ratios which strongly indicates that theyare all from the same source. It is interesting that the 241Am/239,240Pu activityratio is constant even though the particles have been exposed in the sedimentfor different amounts of time. This indicates that these two elements have notleached from the particles or that they have the same leaching rate. To the date ofthis report no particles from a most probable second source have been analysed.This can mainly be explained by the fact that the separation method described inPaper IV used the daughter nuclide of 241Pu, 241Am. If the none-sampled sourcecontained less 241Pu the probability of detecting these particles would be lower.Moreover, the samples from which the 238Pu/239,240Pu ratio have been determined,indicate that the highest activity samples originate from the source from which the5 particles originate. This can indicate that the sources have been disintegratedinto different particle size distributions and for that reason the analysed particleswould originate from the source that disintegrated with the largest size fractions.It cannot be concluded wether these sources originate from different parts of thesame weapon or from different weapons.
The first separation and identification of one single hot particle from the Thulesediments was done in late 1997 at Risø. The preliminary results for the SEMstudies performed on this particle were presented in 1999 [25]. X-ray spectra fromthe surface of this particle, derived by the EDX device connected to the SEM,clearly showed that the particle contained uranium. The fact that the Thule debriscontained uranium had never been reported before, and came as a surprise. Later,in 2001, a similar observation was reported for a Thule hot particle [44]. In PaperV the uranium isotopic ratios are reported. The 235U/235+238U mass ratios werein good agreement for all particles, (0.502 ± 0.040, 1 SD, n = 5). This ratio iseasily biased by contamination from naturally occurring uranium, which wouldlower the ratio. However, one of the most interesting results in this thesis is thatthe mass ratio 235U/239Pu is decreasing with the time that the particles have beenpresent in the sediment, i.e. uranium has a higher dissolution rate than plutonium.
Dissolution of uranium from nuclear fuel have been widely studied. Most ofthese studies have been performed as laboratory experiments and for that reasonit cannot easily be applied to environmental (U,Pu)O2 hot particles from the BylotSound. De Pablo et al. [59] has studied uranium dissolution from nuclear fuels inbicarbonate environments. He have derived a dissolution model which explains thebicarbonate promoted oxidative dissolution in three steps:1. Initial oxidation of the UO2 surface.2. Binding of HCO−
3 at the U(VI) sites of the oxidized layer3. De-attachment of the U(VI)-carbonate surface complexThe model has been applied to spent/unspent fuel with good agreement withexperimental results.
Another study has investigated uranium dissolution under oxidized, anoxic andreducing conditions. The dissolution rate has been in the order of a few mg d−1
m−2 [60]. Applying this dissolution rate to a particle with a diameter of 120 µm(similar size as for a particle collected in a Bylot Sound sediment 1997) would resultin that about 1 µg of uranium has left. This is considerably less than observed.The particles are, however, not perfect spheres so the specific surface area is muchlarger, which would result in that more uranium has left. Also, the dissolution ratemight depend on how the (U,Pu)O2 matrix is produced [29]. Keller lists three mainproduction procedures that form more or less homogeneous (U,Pu)O2 bindingswith some presence of UO2 and PuO2 fragments. For that reason, the particles
30 Risø–R–1321(EN)

formed at Thule should be treated as site-specific particles and be regarded as aunit of their own. Knowledge on their dissolution and corrosion rates may only bederived from experiments conducted with the very same material.
3.2 Seawater
The plutonium in the debris was in the unsoluble chemical form PuO2 and theearlier reported data on unfiltered surface water have not detected any significantactivity concentrations above the fallout levels [12, 15], confirming that Pu is fixedto the sediment. The first study in Bylot Sound, performed during the summerfollowing the accident, observed higher Pu seawater concentrations, about twicethe global fallout level. In near bottom water close to the point of impact, elevatedPu concentrations compared to the fallout level have been observed. Since theanalysis have been performed on unfiltered water this has been understood as aneffect of that resuspended sediments have been included in the samples, Paper I.As the water samples only reflect the concentration of Pu at the sampling dates,bio-indicators such as brown-alga, Fucus, can be used to reflect the time integratedwater concentration. There have been significantly higher Pu concentrations thanthe global fallout levels in these [15], indicating that Pu water concentrations couldbe temporarily elevated, e.g. after storms.
Plutonium speciation in seawater has shown that 43% of the activity from sam-pling sites near the point of impact was particulate, i.e. resuspended from thecontaminated sediments [21]. Plutonium in the dissolved phase was to 68%± 6%(n=6) in the Pu(V-VI) oxidation states. However, it is concluded that the dis-solved plutonium has a global fallout origin, as the 238Pu/239,240Pu activity ratio(0.06±0.02) is similar to the global fallout ratio at this latitude (∼ 0.04).
3.3 Sediments
The Bylot Sound sediments, as has been mentioned above, are highly contami-nated by fissile material from the accident. To model the fate of this material itis necessary to know the input function, i.e. the total released amount of materialwhich sank to the sea floor in this area. In order to determine the input function,estimates of the total amount of plutonium have been reported [12, 15, 17, 19, 25].The inventory of 239,240Pu shows a range from 1 to 1.8 TBq. However, these esti-mates can be considered as underestimates because the sample dissolution methodused does not dissolve all the plutonium in the sample (Section 2.2.3), and nonerepresentative samples have been used (Section 2.2.2). A weakness in these es-timates are that no uncertainty limits of the calculated total inventory can begiven, more than guesses. The activity concentrations have been scattered, andreplicate aliquots from the same sample have shown differences of up to 2 ordersof magnitude and not unusually 1 order of magnitude differences in the 239,240Puactivity concentrations. This is, however, a problem close to the point of impact(within a radius of ∼ 10 km). The variation is due to the presence of hot plutoniumparticles, although they have not been considered to influence the total inventory.For that reason small sub-samples have been used for activity determination inan area with homogeneous activity concentration. Techniques for determining ac-tivity concentrations in samples with gamma emitting hot particles have beenreported, e.g. [61, 62, 63].
In Paper III a comparison is performed between the conventional analyticaltechnique of determining the 239,240Pu activity concentration used on the Thulesediment and a non destructive technique, measuring Pu indirectly, as describedearlier. The differences between the two activity determination methods is mostpronounced closed to the point of impact where the gamma measurements show
Risø–R–1321(EN) 31

higher concentrations. This is explained by that the conventional technique usedat Risø do not totaly dissolve the plutonium in the samples and that too few sub-samples in the activity determination were used. The gamma measuring techniqueused five times more samples than the conventional technique. More sub-samplesshould, however, be used for the two sites V2 and P as no even inventory distri-butions were obtained. Instead, the inventory distributions are highly dependenton some hot particles, see Figure 8. At the sampling sites Hnø and C, 6.4 km and17 km from the point of impact respectively, either of the activity determinationmethods can be used, while at the sampling site Ny-3 the alpha spectrometricmethod should be used. One interesting observation is that location P is situatedin the same direction as the maximum tidal current (0.4 knots to the south-west),and the particles found at this location were all of similar activity, i.e. around 2Bq. At location V2 (the point of impact) the dominating particles had consider-ably higher activity (50 and 153 Bq). This could be an indication of that the tidalcurrent has transported the smaller particles, with low sedimentation velocity inthe water column, to greater distances than the lager particles.
Location V2, r= 0km
Fre
quen
cy
0 1000000 2000000
050
010
0015
00
Location Y, r= 0.94km
Fre
quen
cy
10000 30000 50000
010
020
030
040
050
060
0
Location P, r= 4.01km
Fre
quen
cy
0 20000 40000 60000
020
040
060
0
Location Hnö, r= 6.4km
Fre
quen
cy
10000 30000
020
040
060
080
0
Location C, r= 17km
Fre
quen
cy
0 2000 4000 6000 8000
010
020
030
040
050
060
0
Location Ny−3, r= 66.6km
Fre
quen
cy
0 200 400 600 800
010
0030
0050
00
Bq m−2Bq m−2Bq m−2
Bq m−2Bq m−2Bq m−2
Figure 8. 239,240Pu inventory distributions calculated from 10 000 sediment corecombinations (permutations). It is clear that the distributions for locations V2 andP are highly influenced by hot particles. From Paper III
Of the three different fits applied to the conventional determined activity ateach location, the bi-exponentially decreasing function resulted in the best fit tothe data. The fast component is probably describing the initial dispersion (thedebris which went into the water at the accident and also the dispersion of thedebris that occurred when the contaminated ice was drifting from the acciden-
32 Risø–R–1321(EN)
tal site and melted). The slow component reflects, probably, resuspension of thecontaminated sediment in Bylot Sound out to uncontaminated areas. In order tocalculate the total accidental Pu inventory in the sediments, integration of thefitted function was performed. The upper integration limit (dispersion distance)was determined from the 239,240Pu/137Cs equalling the global fallout ratio. Theestimated dispersion distance determined for samples collected at the Thule-97expedition is 99.3 km, i.e. the dispersion rate is about 3.4 km y−1 (99.3 km/29 y).
The total accidental Pu inventory determined by the conventional method ishigher than earlier estimates, 3.9 TBq 239,240Pu compared to about 1–1.7 TBq.This is explained by that in this estimate a high resolution alpha spectroscopicset up was used, enabling accurate activity determination of high activity discs.Secondly, the integration was performed on a lager area, as a bi-exponentiallyfunction was used to describe the dispersion. However, the inventory of 3.9 TBqis underestimated, since the radiochemical technique do not totaly dissolve thePu in the samples and only one 1 g sub-sample have been used in the activitydetermination. Additionally, at some sampling stations, the sampled sedimentcore have not been sufficient long, i.e. have not sampled down to zero accidentallevels in the sediment. This is the fact for 4 of the 16 sites (see Figure 2 in PaperI), all close to the point of impact. The activity concentrations in these cores arealmost constant down to a depth of 15–20 cm.
The new total accidental inventory is about 10 TBq (6.7 TBq, 1st quartile, 13.2TBq 3rd quartile) or about 3.8 kg 239,240Pu derived from the screening investi-gation in Paper III. This might, refereing to the discussion above concerningthe sampled core length, be an underestimation. The estimation is based on coresfrom six sites, and to include more sites would be preferable. Development of thistechnique should be done and this technique should be used for determining thetotal inventory in upcoming expeditions.
A consequence of the new estimate must be that a considerable amount of Pumust have entered through the broken up ice at impact, as it was estimated thatonly about half of a kg was unrecovered from the ice during the decontaminationoperation.
3.4 Resuspension on land
When the B-52 bomber crashed and exploded on the sea ice of Bylot Sound, a cloudwith some of the fissile material rose up in the sky. This cloud drifted south withthe wind and contaminated an area around the settlement of Narsarssuk [8, 9].In air samples collected to the east of the point of impact, elevated plutoniumconcentrations, probably originating from the accident, were observed [11, 10].Another land area that was contaminated was the so called ”Tank Farm”, wherethe contaminated snow and debris were loaded into large tanks. In Paper II asurvey in the area east of the Thule air base is reported. The aim was to determineif there was any contamination originating from the Thule accident, either fromclose-in fallout or from resuspension from other contaminated areas, in this easternarea. The study focused on the undisturbed lake sediments, as they have a well-defined chronology. However, the time resolution, determined by the CRS-model,was too low to separate a possible accidental peak in the sediment depth profilefrom the global fallout peak [64]. The 239,240Pu/137Cs ratio was in good agreementwith the global fallout ratio, so the conclusion was that the contamination wassmall, if any at all.
Risø–R–1321(EN) 33

3.5 Biota
The Bylot Sound has a rich animal life with a food web that includes, in the lowerparts of the food chain, plankton and benthic biota, through fish, seabirds, seals,walrus, whales up to the top predator of the food chain, the Inuits. In the sedimentsof Bylot Sound the biomass of benthic biota is high, about 450 g m−2, includingover 150 species of lower animals [65]. The main concern has been to study ifthere is a bio-magnification of Pu from the sediments up through the food chaincausing a radiation hazard for native Inuits in the Thule area. Earlier investigationsshowed that transfer of plutonium to higher trophic levels was very small, thatno bio-magnification has occurred [11, 12, 14, 15] and that no radiation hazardfrom food to native people exists. The highest Pu levels were found in benthicspecies feeding on sediment. The Pu concentrations in these species were about1–2 orders of magnitude lower than the concentrations in the sediment, Paper I,which was a confirmation of earlier studies [11, 12, 13, 14, 15, 17]. It has also beenobserved that 241Am had a higher concentration ratio to the biota than 239,240Pu.However, the reported concentration ratios, CR, (Bq kg−1
biota/Bq kg−1sediment) are
probably overestimated since the sediment concentrations are underestimated dueto exclusion of hot particles, as described above.
4 Concluding Remarks and FutureResearch
I think it is sad that still after 33 years, such information as the source term andthe amount of debris dispersed in the accident is classified, as this information isessential for all model work and predictions. If this information was available theThule area could be a very interesting experimental area where a lot of valuableknowledge could be gained. Instead, today, the area is a sad memory of the coldwar era and an accident where limited knowledge has been gained.
However, in my opinion, some future subjects to focus on in the Thule areacould be to continue the study of hot particles. First of all these studies couldprovide an answer to the source term question. When such a determination isdone, the inventory can be estimated more easily and cheaply. This would alsomean that the resuspension rate/translocation of the sediment in Bylot Sound touncontaminated areas could be determined.
Another interesting subject to study would be the particle surface chemistry(i.e. oxidation state on surface in synchrotron radiation facilities using the XPS-technique) so solubility conditions could be determined. Experimental studies ofthe isotopic ratios in the interstitial sediment water and bottom water could showif corrosion of the transuranic elements in the Thule debris is of importance.
Investigations of radioactive particle transport through the ice have not beenreported. However, this could also be a subject of importance, as it took over amonth between the accident and the removal of contaminated snow on the ice. Asthe evaluation of the effect of the decontamination operation was performed withgamma and X-ray detectors, the result could easily be biased by the fact that icewas attenuating the radiation from activity in the ice. As an example the 59.54keV radiation intensity from 241Am is attenuated to 50% if the activity is situatedat a depth of 3.9 cm in the ice. An evaluation of hot particle transport in ice couldgive some interesting information.
My hope is that this report has highlighted some interesting subjects that canbe studied in further research in the Thule area, and that a more accurate source
34 Risø–R–1321(EN)

term has been provided. One can say, with some help from Churchill: This is notthe end of the investigation of the Thule accident, it is not even the beginning ofthe end, but perhaps it is the end of the beginning, and the start of some veryinteresting science.
Risø–R–1321(EN) 35

To be a scientist is to have doubts about everything and to have a childs curiosityof the unknown. If not, you are a scientific marionette.
Best Regards, Mats Eriksson
36 Risø–R–1321(EN)

References
[Paper I] Dahlgaard, H., Eriksson, M., Ilus, E., Ryan, T., McMahon, C.A.,Nielsen, S.P., (2001), Plutonium in the marine environment at Thule, NW-Greenland after a nuclear weapons accident,In: Plutonium in the environ-ment, Ed Kudo, A., Elsevier, Oxford, UK, 15–30
[Paper II] Eriksson, M., Holm, E., Roos, P., Dahlgaard, H., (2001), Flux of238,239,240Pu, 241Am, 137Cs and 210Pb to High Arctic Lakes in the ThuleDistrict (Greenland), Journal of Environmental Radioactivity, submitted (19pp)
[Paper III] Eriksson, M., (2002), Plutonium Inventory Calculations in Sedimentswhen Hot Particles are Present, Manuscript, (25 pp)
[Paper IV] Eriksson, M., Ljunggren, K., Hindorf, C., (2002), Plutonium hot par-ticle separation techniques using real-time digital image systems, Nuclear In-struments and Methods in Physics Research, A, in press (6 pp)
[Paper V] Eriksson M., Roos P., Dahlgaard H., Lindahl P., Holm E., (2002),Isotopic ratios in Thule hot particles, source term of the Thule debris,Manuscript, (18 pp)
[1] Silk, J. (1989), Origin of the heavy elements, In: The Big Bang, W. H. Free-man and company, New York, USA, 319–340
[2] Taylor, D.M. (2001), Environmental plutonium – creation of the universe totwenty-first century mankind, In: Plutonium in the environment, Ed. KudoA., Elsevier, Oxford, UK, 1–14
[3] Choppin, G.R. Liljenzin, J-O. Rydberg, J. (2001), Radiochemistry and Nu-clear Chemistry, Butterworth-Heinemann, Woburn, USA
[4] Cooper, L.W. Kelly, J.M. Bond, L.A. Orlandini, K.A. Grebmeier, J.M.(2000), Sources of the transuranic elements plutonium and neptunium inarctic marine sediments, Marine Chemistry, 69, 253–276
[5] USAF Nuclear Safety, Project Crested Ice, AFRP 122–1 Jan/Feb/Mar 1970,No.1 ,65,(1970)
[6] Pigford, T. H. and Ang, K. P. (1975), The plutonium fuel cycles, HealthPhysics, 29, 451-468
[7] U.S Response to Denmarks nine Questions, (2000), JP-Documentation, Offi-cialised: 15/8-2000
[8] Hanson, W. C. (1972). Plutonium in lichen communities of the Thule, Green-land region during the summer of 1968, Health Phys., 22, (Jan), 39–42.
[9] Hanson, W. C. (1980). Transuranic elements in arctic tundra ecosystems. InTransuranic elements in the Environment, Ed. Hanson W. C. 441–458.
[10] EML-(Environmental-Measurement-Laboratory) open data base SASPhttp://www.eml.doe.gov/Databases/sasp (1998)
[11] Aarkrog, A. (1971). Radioecological investigations of plutonium in an arcticmarine environment. Health Phys., 20, (Jan), 31–47.
[12] Aarkrog, A. (1977). Environmental behaviour of plutonium accidentally re-leased at Thule, Greenland. Health Phys., 32, 271–284.
Risø–R–1321(EN) 37

[13] Aarkrog, A. Dahlgaard, H. Holm, E. Lippert, J. & Nilsson, K. (1980). En-vironmental Radioactivity in Greenland in 1979. Risø-R-423, Risø NationalLaboratory, Roskilde, Denmark, 42 pp.
[14] Aarkrog, A. Dahlgaard, H. Holm, E. Hansen, H. Lippert, J. & Nilsson, K.,(1981). Environmental Radioactivity in Greenland in 1980. Risø-R-449, RisøNational Laboratory, Roskilde, Denmark, 55 pp.
[15] Aarkrog, A. Dahlgaard, H. & Nilsson, K., (1984). Further Studies of Pluto-nium and Americium at Thule, Greenland. Health Phys., 46, 29–44.
[16] Aarkrog, A. Boelskifte, S. Dahlgaard, H. Duniec, S. Holm, E. & Smith,J. N. (1987). Studies of Transuranics in an Arctic Marine Environment.J.Radioanal.Nucl.Chem.Article., 115, 39–50.
[17] Aarkrog, A. Buch, E. Chen, Q. J. Christensen, G. C. Dahlgaard, H. Hansen,H. Holm, E. & Nielsen, S. P. (1988). Environmental Radioactivity in theNorth Atlantic Region Including the Faroe Islands and Greenland. 1986. Risø-R-550, Risø National Laboratory, Roskilde, Denmark, 69 pp.
[18] Smith, J.N. Ellis, K. M. Aarkrog, A., Dahlgaard, H., and Holm, E.,(1994),J. Emviron. Radioactivity, 25, 135–159
[19] Aarkrog, A. Chen, Q. J. Clausen, J. Christensen, G. C. Dahlgaard, H. Ellis,K. Hansen, H. Holm, E. Joensen, H. P. Nielsen, S. P. & Strandberg, M.(1997). Environmental Radioactivity in the North Atlantic Region Includingthe Faroe Islands and Greenland. 1992 and 1993. Risø-R-757, Risø NationalLaboratory, Roskilde, Denmark, 132 pp.
[20] Strand, P., Balonov, M., Aarkrog, A. Bewers, M.J., Howard, B., Salo, A.,Tsaturov, Y.S., (1998), AMAP Assessment Report: Arctic Pollution IssuesRadioactivity, Arctic Monitoring and Assessment Programme (AMAP), Oslo,Norway, 542–578
[21] McMahon, C.A. Vintro, L.L. Mitchell, P.I. Dahlgaard, H. (2000), Oxidation-state distribution of plutonium in surface and subsurface waters at Thule,northwest Greenland, Appl. Radiat. Isot., 52, 697-703
[22] Ryan, T.P. Dahlgaard, H., Dowdall, A.M. Pollard, D., Ilus, E., Eriksson, M.,Cunningham, J.D. The uptake of plutonium by some marine invertebratesin a contaminated zone of Bylot Sound, Thule, northern Greenland. In: Ex-tended abstracts. 4. International conference on environmental radioactivityin the Arctic, Edinburgh (GB), 20-23 Sep 1999. Strand, P., Jølle, T. (eds.),(Norwegian Radiation Protection Authority, sters, 1999) p. 74-76
[23] Dahlgaard, H., Chen, Q.J., Strup, S., Eriksson, M., Nielsen, S.P., Aarkrog,A., (1999), Plutonium isotope ratios in environmental samples from Thule(Greenland) and the Techa River (Russia) measured by ICPMS and alpha-spectrometry., In: International symposium on marine pollution. Proceedings,Monaco (MC), 5-9 Oct 1998., IAEA-TECDOC-1094, pp. 254-259
[24] Ikaheimonen, T. K. Ilus, E. Klemola, S., Dahlgaard, H. Ryan, T. Eriksson,M. (2000) Plutonium and americium in the sediments off the Thule Air Base,Proceedings in 8th international conference of ”low level measurements of ac-tinides and long-lived radionuclides in biological and environmental samples”,Japan
[25] Eriksson, M., Dahlgaard, H., Ilus, E., Ryan, T., Chen, Q.J., Holm, E., Nielsen,S.P., (1999), Plutonium in the marine environment of Thule Air Base, N.W.
38 Risø–R–1321(EN)

Greenland. Inventories and distribution in sediments 29 years after the ac-cident, In: Extended abstracts. 4. International conference on environmentalradioactivity in the Arctic, Edinburgh (GB), 20-23 Sep 1999. Strand, P.; Jølle,T. (eds.), (Norwegian Radiation Protection Authority, Østeras, 1999) p. 60-62
[26] Roos, P. Holm, E. & Persson R. B. R. (1994). Comparison of AMP precipitatemethod and impregnated Cu2[Fe(CN)6] filters for determination of radioce-sium concentrations in natural waters, Nucl. Instr. and Meth. in Phys. Res.,A 339, 282–286.
[27] Talvitie, N. A., (1971), Radiochemical determination of plutonium in envi-ronmental and biological samples by ion exchange, Analytical chemistry, 43,13, 1827
[28] Holm, E. (1984), Review of alpha-particle spectrometric measurements ofactinides, Int. J. Appl. Rad. Isot., 35 285–290
[29] Keller, C. (1971), Book: The chemistry of the transuranic elements, VerlagChemie GmbH, Weinheim/Bergstr., Germany, 380–392.
[30] Smith, L.L. Markin, F. Kate, T.T. (1992), Comparison of acid leachhateand fusion methods to determine plutonium and americium in environmentalsamples, Argonne National Laboratory, Argonne Report ANL/ACL 92/2
[31] Horwitz, E.P. Chiarizia, R. Dietz, M.L. Diamond, H. Nelson, D.M. (1993),Separation and preconcentration of actinides from acidic media by extracionchromatography, Anal. Chim. Acta. 281, 361–372.
[32] Ham, G.J. (1995), Determination of actinides in environmental materialsusing an extraction chromatography column, Sci. Tot. Env. 173/174, 19–22.
[33] Hallstadius, L. A. (1984), A method for the electrodeposition of actinides.Nucl. Instrum. Meth. Phys. Res., 223, 382–385
[34] Vintro, L.L. Mitchell, P.I. Condren, O.M. Moran, M. Vives i Batlle, J.Sanchez-Cabeza, J.A. (1996), Determination of the 240Pu/239Pu atom ra-tio in low activity environmental samples by alpha spectrometry and spectraldeconvolution, Nucl. Instr. and Meth. in Phys. Res., 369, 597–602.
[35] LaMont, S. P. Glover, S. E. Filby, R. H. (1998), Determination ofplutonium-240/239 ratios in low activity samples using high resolution alpha-spectrometry, Journal of Radioanalytical and Nuclear Chemistry, 234, 1–2,195-199
[36] Bland, C. J. (1998), Choosing fitting functions to describe peak tails in alphaparticle spectrometry, Appl. Radiat. Isot., 49, 1225–1229
[37] Raab, W. Parus, J. L. (1994), The measurement of 240Pu/239Pu and238Pu/239Pu isotopic ratios by alpha-particle spectrometry, Nuclear Instru-ments and Methods in Physics Research Section A, 339, 116–121
[38] Mitchell, P.I. Vintro, L.L. Dahlgaard, H., Gansco, C. and Sanchez-Cabeza,J.A. (1997), The Science of the Total Environment, 202, 147–153
[39] Condren, O. M. Vintro, L.L. Mitchell, P.I. Ryan, T.P. (1996), A new ap-proach to quench correction when measuring 241Pu in the presence of Pu-alpha by supported disc liquid scintillation spectrometry, Appl. Radiat. Isot.,47, 875–878
[40] Arnold. D., and Kolb. W.,(1995), Determination of Plutonium Content andisotopic Ratios in Environmental Samples by L X-ray and α-Particle Mea-surements, Appl. Radiat. Isot., 46, 1151–1157
Risø–R–1321(EN) 39

[41] Komura, K.; Sakanoue, M.; Yamamoto, M.,(1984), Determination of240Pu/239Pu ratio in environmental samples based on the measurement ofLx/α-ray activity ratio, Health Physics, 46, 1213–1219
[42] Appleby, P.G. and Oldfield, F. (1978), The calculation of Lead-210 datesassuming a constant rate of supply of unsupported 210Pb to the sediment,Catena, 5, 1–9
[43] Pollanen, R., Ikaheimonen, T. K., Klemola S., Juhanoja, J., (1999), Identifi-cation and analysis of a radioactive particle in a marine sediment sample. J.Environ. Radioactivity, 45, 149–160
[44] Moring, M., Ikaheimonen, T. K., Pollanen, R., Ilus, E., Klemola, S., Juhanoja,J., Eriksson, M., (2001), Uranium and Plutonium containing particles in asea sediment sample from Thule, Greenland., Journal of Radioanalytical andNuclear Chemistry, 248, 3, 623–627
[45] Sajo-Bohus, L., Palfalvi, J., Greaves, E. D., (1998),Hot particle spectrumdetermination by track image analysis, Radiation Physics and Chemistry,51, 4–6, 467–468
[46] Bondarenko, O. A., Henshaw, D. L., Salmon, P. L., Ross, A. N., (1995), Themethod of simultaneous size and activity measurement of alpha emitting hotparticles using multiple track analysis of solid state nuclear track detectors,Radiation Measurements, 25, 1–4, 373–376
[47] Espinosa, G., Meyer, K., Gammage, R. B., (1995), Soil measurements bynuclear track detectors, Radiation Measurements, 25, 1-4, 401-404
[48] Dushin, V. N., Gedeonov, A. D., Petrov, B. F., Pleskachevsky, L. A., Shigaev,O. E., (1995), Application of polycarbonate track detectors for the techno-genic alpha-radioactive contamination analysis, Radiation Measurements, 25,1–4, 409–412
[49] Zhuk, I. V., Lomonosova, E. M., Yaroshevich, O. I., Kievetz, M. K., Boulyga,S. F., Tzekhanovich, I. A., Mironov, V. P., Kudryashov, V. P., Drugachonok,M. A., (1995), Application of solid state nuclear track detector method fordetermination of sizes and alpha-activity of ”hot” particles of Chernobyl fuelrelease, Radiation Measurements, 25, 1–4, 419–420
[50] Hamilton, E. I., (1999),The role of near-shore industrial waste releases in thedispersion of radionuclides in the NE Irish Sea, J. Environ. Radioactivity, 44,297–333
[51] Ljunggren, K., Strand, S.E., (1990), Beta Camera for Static and DynamicImaging of Charged-Particle Emitting Radionuclides in Biologic Samples, J.Nucl Med, 31, 2058–2063.
[52] Overdick, M., Czermak, A., Fischer P., Herzog, V., Kjensmo, A., Kugelmeier,T., Ljunggren, K., Nygard, E., Pietrizik, C., Schwan, T., Strand, S.–E.,Straver, J., Weilhammer, P., Wermes, N., Yoshioka, K., (1997), A ”Bioscope”system using double-sided silicon strip detectors and self-triggering read-outchips, Nuclear Instruments and Methods in Physics Research Section A: 392,173–177
[53] Hans Otterstrom, at Link Nordiska, Personal comunication (2002)
[54] Dai, M.H. Buesseler, K.O. Kelley, J.M. Andrews, J.E. Pike, S. Wacker,J.F. (2001), Size-fractionated plutonium isotopes in a coastal environment,Journal of Environmental Radioactivity, 53, 1, 9-25
40 Risø–R–1321(EN)

[55] McAninch, J.E. Hamilton, T.F. Brown, T.A. Jokela, T.A. Knezovich, J.P.Ognibene, T.J. Proctor, I.D. Roberts, M.L. Sideras-Haddad, E. Southon,J.R. Vogel, J.S. (2000), Plutonium measurements by accelerator mass spec-trometry at LLNL, Nuclear Instruments and Methods in Physics ResearchSection B, 172, 1-4, 711-716
[56] W. O. Forster, Transuranic Studies in the Marine Environment,in Environ-mental Toxicicity of Aqatic Radionuclides: Models and Mechanisms., EditorM. W. Miller and J. N. Stannard pp 11–27
[57] Lee, S. H. Gastaud, J. La Rosa, J. J. Kwong, L. Liong Wee Povinec, P.P. Wyse, E. Fifield, L. K. Hausladen, P. A. Di Tada, L. M. Santos, G.M. (2001), Analysis of plutonium isotopes in marine samples by radiomet-ric, ICP-MS and AMS techniques, Journal of Radioanalytical and NuclearChemistry, 248, 3, 757-764
[58] Sturup, S., Dahlgaard, H., Nielsen, S.C., (1998), High resolution inductivelycoupled plasma mass spectrometry for the trace determination of plutoniumisotopes and isotope ratios in environmental samples., J. Anal. Atom. Spec-trom., 13, 1321-1326
[59] De Pablo J., Casas I., Gimenez J., Molera M., Rovira M., Duro L., Bruno J.,(1999), The oxidative dissolution mechanics of uranium dioxide, 1. The effectof temperature in hydrogen carbonate medium. Geochim. et. Cosmochim.Acta, 63:19/20, 3097-3103.
[60] Rollin S., Spahiu K., Eklund U.-B., (2001), Determination of dissolution ratesof spent fuel in carbonate solutions under different redox conditions with aflow-through experiment. J. Nucl. Materials, 297, 231-243.
[61] Bunzl, K. (1997), Probability for Detecting Hot Particles in EnvironmentalSamples by Sample Splitting, The Analyst, (007), 653–656
[62] Kashparov, V. A., Yoshchenko, V. I., Levchuk, S. E. (2000), Tschiersch, J.,and Wagenpfeil, F., Journal of Radioanalytical and Nuclear Chemistry, 246,165–172
[63] Nagel, G., Flowers, A., Henry, B. and Postauk J. (1998), Hot particle detec-tion using uncertainties in activity measurements of soil , Health Physics, 74,4, 472–477
[64] Eriksson, M. Holm. E. Roos, P. Dahlgaard, H., (2001), Plutonium in Tem-perate and Arctic Lakes, In: Plutonium in the environment, Elsevier, Oxford,UK, Ed Kudo, A., 293–303
[65] Vibe, C., (1950), The marine mammals and the marine fauna in the Thuledistrict (Northwest Greenland) with obeservations on ice conditions in 1939–41. Meddelser om Grønland, 150, 1–117
Risø–R–1321(EN) 41

Paper IDahlgaard H, Eriksson M., Ilus E., Ryan T., McMahon C.A. and Nielsen S.P.:Plutonium in the marine environment at Thule,NW-Greenland after a nuclear weapons accidentIn book ”Plutonium in the environment”, Elsevier, 15-30, 2001.
Risø–R–1321(EN) 43


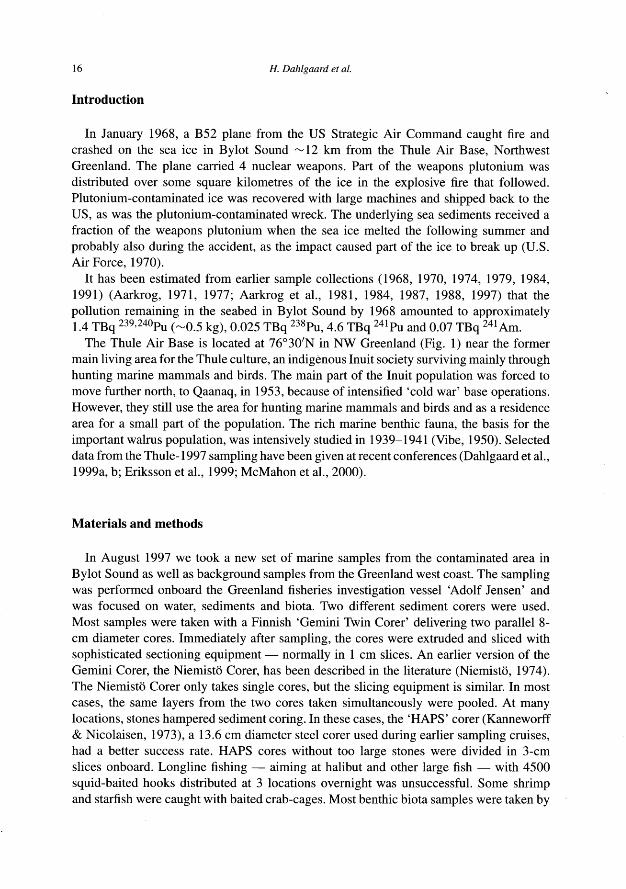
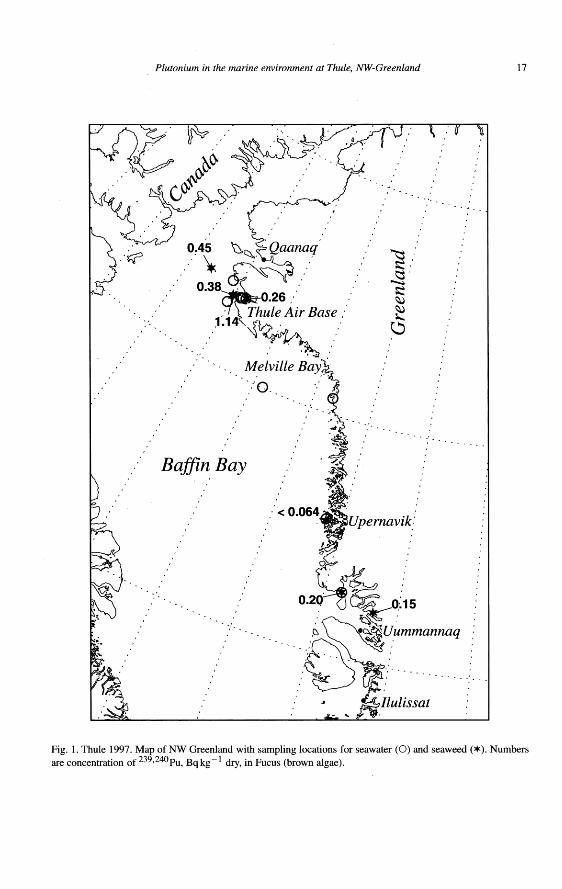
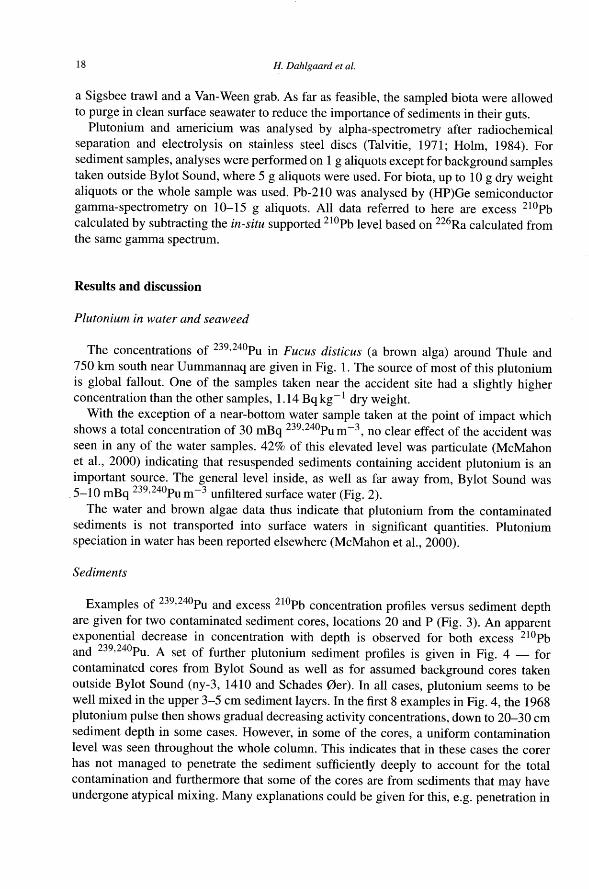

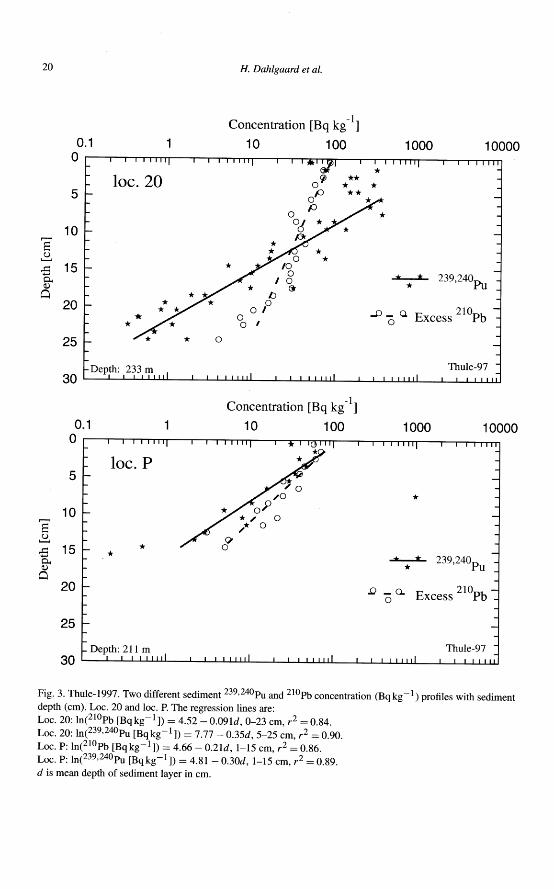
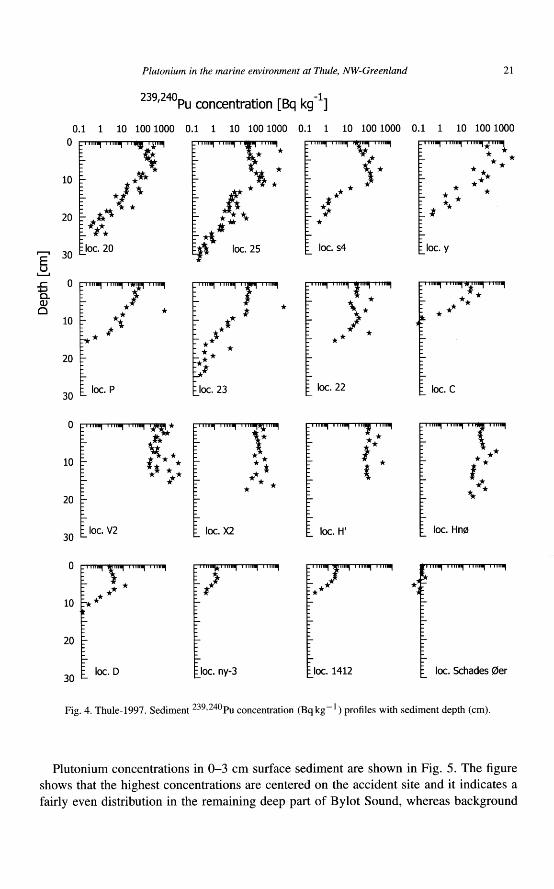

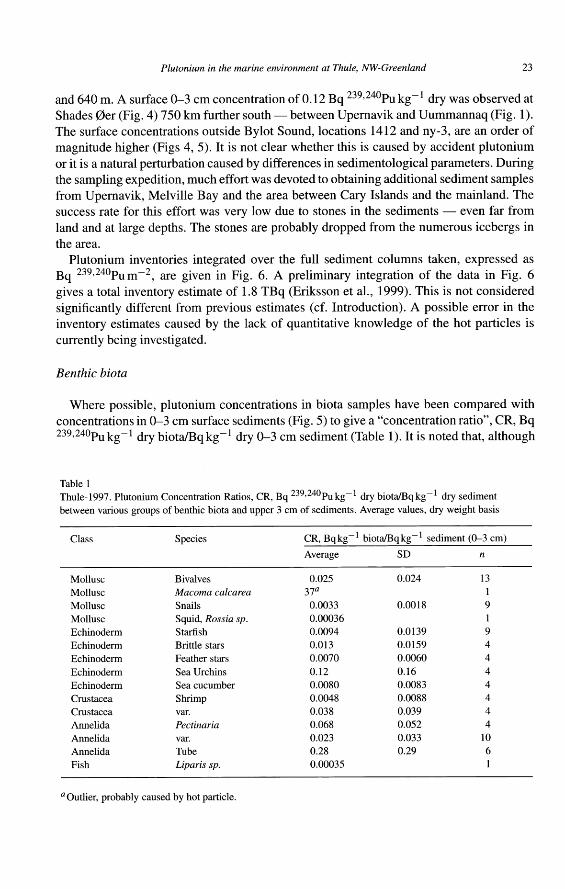

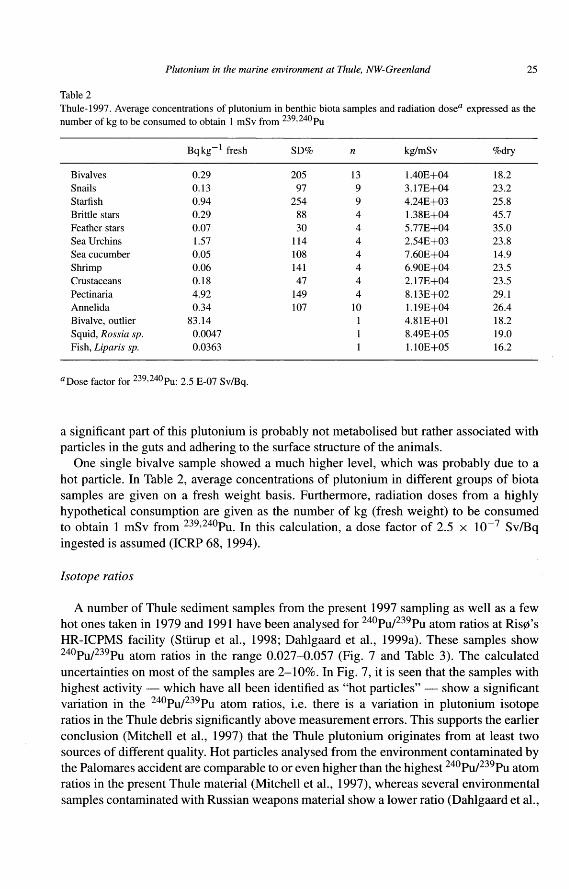


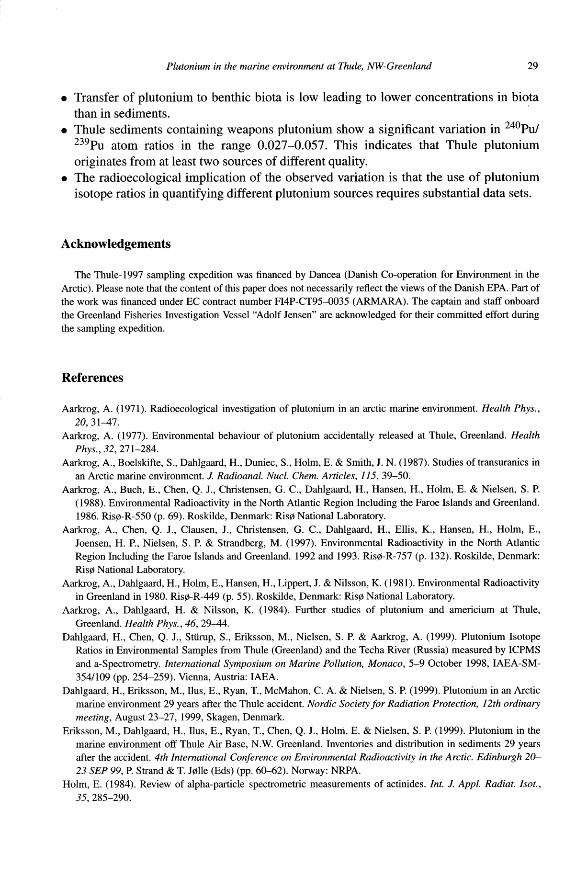


Paper IIEriksson M., Holm E., Roos P. and Dahlgaard H.:Flux of 238,239,240Pu, 241Am, 137Cs and 210Pb to High Arctic Lakes in the ThuleDistrict (Greenland)Journal of Environmental Radioactivity, submitted (19 pp) 2001.
Risø–R–1321(EN) 63


Flux of 238Pu, 239,240Pu, 241Am, 137Cs and 210Pb
to High Arctic Lakes in the Thule District
(Greenland)
M. Eriksson a,b,1, E. Holm a,b, P. Roos a,b, H. Dahlgaard a
aRisø National Laboratory, P.O. Box 49, DK–4000 Roskilde, DenmarkbDept. of Radiation Physics, Lund University Hospital, SE–221 85 Lund, Sweden
Abstract
Environmental samples (soil, sediment and lake water) in the Thule area (NWGreenland) have been studied to assess the contamination of radionuclides originat-ing from a nuclear weapons accident (the Thule accident in 1968).
Four lakes were chosen at different distances from the point of impact with theThule air base community situated in between.
The sedimentation rates in the lakes varied from 0.4 mm a−1 (5 mg cm−2 a−1) to1.6 mm a−1 (82 mg cm−2 a−1). With these sedimentation rates it is not possible toresolve the 239,240Pu global fallout peak from a possible 239,240Pu ”accident” peak inthe sediment depth profiles. However, the 239,240Pu to 137Cs ratio and the isotopicratio of 238Pu to 239,240Pu agreed well with the global fallout ratios, indicatingthat plutonium originating from the accident had not reached these lakes. This alsoindicates that the Thule air base community has probably only been exposed toradionuclides from the accident to a very limited extent.
A limited study showed that 210Pb could not be used as a normalizing nuclide forthe transport of transuranic elements from the catchment area to the lake, i.e. 210Pbhas a different transport mechanism from that of the transuranic elements studiedin this investigation. Our study also indicates that americium is more mobile in thecatchment area of the lake than plutonium.
Key words: Plutonium; Americium; Radiocesium; Radio-lead; Sediments; Lakes;Catchment; Thule; Thule accident; Remobilization; Fallout; Arctic; Radionuclides
1 Corresponding author.
Preprint submitted to Journal of Environmental Radioactivity 2 April 2002

1 Introduction
On January 21, 1968, a B-52 aircraft accident occurred in the Thule district,NW Greenland (76 33 N, 68 54 W). The accident started with a fire in theaircraft, and the pilot tried to make an emergency landing at the Thule airbase but failed, and the plane crashed about 11 km from the shore off thebase. The aircraft was carrying 4 nuclear fusion weapons, which underwenta chemical explosion on impact. An area of approximately 2.23×10⁵ m2 wascontaminated by about 3.5 ± 0.7 kg (8.8 TBq) of plutonium (Strand, Balonov,Aakrog, Bewers, Howard, Salo, et al., 1998), which can be compared with thefallout contamination of 2.1 MBq (Hanson, 1980) in this specific contaminatedarea. A few weeks after the accident, a clean-up operation, ”Crested Ice”, wasstarted to recover the debris and the contaminated ice. The operation lastedfor about 6 months. During this operation, about 85 % of the plutonium wasrecovered from the sea ice (USAF Nuclear Safety, 1970).
There was reason to believe that the Thule air base community could have beencontaminated with radionuclides originating from the accident, as it took someweeks before the clean-up operation started (USAF Nuclear Safety, 1970).During this time, the debris and the contaminated ice were exposed to severeweather with several storms that could have spread the contaminated materialaround the area. Air sampling measurements, performed by the Environmen-tal Measurement Laboratory (EML) at the Thule air base showed indicationsof higher air concentrations of 239,240Pu directly after, and up to some monthsafter, the accident (EML, 1999; Aarkrog, 1971). Hanson (1980) found pluto-nium originating from the accident on Saunders Island (west), WolstenholmeIsland (west) and in soil samples south of the point of impact. Another areathat was probably contaminated, is the so-called ”Tank farm” (USAF NuclearSafety, 1970). This was a large area on the seashore where the debris and thepeeled contaminated ice were loaded into tanks for further transport to theUSA. Under the hard working conditions, windy and cold in combination withrough equipment, spillage was possible which would have contaminated theground. Resuspension of radioactive elements from these contaminated areashas now been going on for 30 years and could be a possible source of radiationexposure for employees and Inuits at the Thule air base.
Since the Thule accident in 1968, there have been regular expeditions (1968,1970, 1974, 1979, 1984, 1991) to the area. Many investigations of the distri-bution and transfer of radionuclides in the surrounding environment, almostexclusively in the marine environment, have been performed (Aarkrog, 1971,1977; Aarkrog, Dahlgaard, Holm, Hanson, Lippert, & Nilsson, 1981; Aarkrog,Dahlgaard, & Nilsson, 1984; Aarkrog, Boelskifte, Dahlgaard, Duniec, Holm,& Smith, 1987; Aarkrog, Buch, Chen, Christensen, Dahlgaard, Hanson, et al.,1988; Aarkrog, Chen, Clausen, Christensen, Dahlgaard, Ellis, et al., 1997).
2
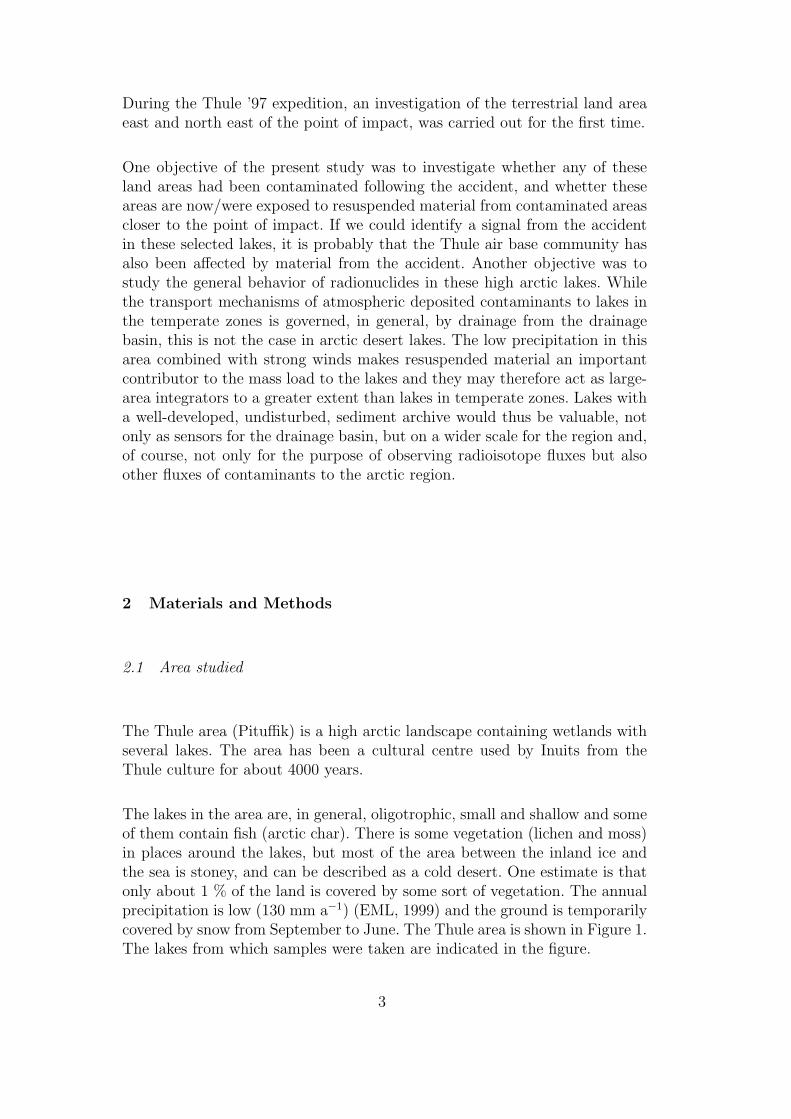
During the Thule ’97 expedition, an investigation of the terrestrial land areaeast and north east of the point of impact, was carried out for the first time.
One objective of the present study was to investigate whether any of theseland areas had been contaminated following the accident, and whetter theseareas are now/were exposed to resuspended material from contaminated areascloser to the point of impact. If we could identify a signal from the accidentin these selected lakes, it is probably that the Thule air base community hasalso been affected by material from the accident. Another objective was tostudy the general behavior of radionuclides in these high arctic lakes. Whilethe transport mechanisms of atmospheric deposited contaminants to lakes inthe temperate zones is governed, in general, by drainage from the drainagebasin, this is not the case in arctic desert lakes. The low precipitation in thisarea combined with strong winds makes resuspended material an importantcontributor to the mass load to the lakes and they may therefore act as large-area integrators to a greater extent than lakes in temperate zones. Lakes witha well-developed, undisturbed, sediment archive would thus be valuable, notonly as sensors for the drainage basin, but on a wider scale for the region and,of course, not only for the purpose of observing radioisotope fluxes but alsoother fluxes of contaminants to the arctic region.
2 Materials and Methods
2.1 Area studied
The Thule area (Pituffik) is a high arctic landscape containing wetlands withseveral lakes. The area has been a cultural centre used by Inuits from theThule culture for about 4000 years.
The lakes in the area are, in general, oligotrophic, small and shallow and someof them contain fish (arctic char). There is some vegetation (lichen and moss)in places around the lakes, but most of the area between the inland ice andthe sea is stoney, and can be described as a cold desert. One estimate is thatonly about 1 % of the land is covered by some sort of vegetation. The annualprecipitation is low (130 mm a−1) (EML, 1999) and the ground is temporarilycovered by snow from September to June. The Thule area is shown in Figure 1.The lakes from which samples were taken are indicated in the figure.
3

Fig. 1. Aerial photograph of the Thule air base. The sampling stations are shown inthe figure. The point of impact is located about 15 km west of the base. The runway(the white strip) is 3.1 km long. The white patch on lake V2 is an unmelted ice floeand the white spots on the Wolstenholme Fjord (North) are icebergs. c©Kort &Martikelstyrelsen (A. 23–99)
2.2 Field sampling
Samples from 4 lakes, denoted V1 to V4, and soil samples were collectedduring the (land-based) Thule ’97 expedition. The lakes were partly chosenso there were different distance to the B-52 impact point, but the depth ofthe lake was also considered important due to the need to obtain undisturbedsediment profiles. At the start of the expedition the lakes were open, but thewinter came early in 1997 and the lakes froze over during the expedition. Whensamples were due to be taken from lake V4, the ice was too thin to walk onand too thick to use a boat as a sampling platform, so only near-shore watersamples were collected from this lake. Three days after the first ice formation,the lakes were covered with 7 cm of crystal-clear ice. For sampling from lakeV3 we used the ice as a working platform. In lakes V1 and V2 a small boatwas used.
Sediment samples were collected from three of the four lakes using a kayaksediment sampler with a tube diameter of 64 mm. Two sediment cores weretaken from lake V1 and three sediment cores each from lakes V2 and V3.The maximum depth was found with an echo sounder, and from the deepestarea of the lake the sediment cores were collected. The sediment cores were
4

immediately sliced into 1 cm sections at the sampling stations and packed insmall plastic bags. On arrival at the laboratory, the sediment sections wereweighed and dried at 80C for 48 hours.
The soil was extremely difficult to sample, firstly because most of the areahas no vegetation, and consists only of gravel and stones, secondly becauseof the permafrost. During these conditions we were only able to sample soilcores from the catchment area of lake V1. The soil sampler used has an innerdiameter of 70 mm. The soil cores were stored in plastic tubes. On arrival atthe laboratory, the soil cores were sliced into 1 cm sections and treated in thesame way as the sediment samples.
Two-hundred litres of filtered water (filter pore size of 1 µm) were collectedfrom each lake for the determination of 137Cs, 238,239,240Pu and 241Am con-centrations. 137Cs was collected in two ways. For two of the samples, Cs wasabsorbed onto copper ferrocyanide (Cu2[Fe(CN)6]) formed in situ upon the ad-dition of K4[Fe(CN)6] and Cu(NO3)2 solutions. The precipitate was collectedin plastic carboys for further gamma spectrometric analysis in the laboratory.The other two Cs samples were passed, at a low flow rate (approximately 5litres per minute), through a copper-ferrocyanide-impregnated cotton woundcartridge filter (Roos, Holm, & Persson, 1994). In the laboratory the filterswere incinerated and prepared for gamma spectrometric analysis. In both theseprocedures, 134Cs was used as a yield determinant. To determine the possiblepresence of 134Cs originating from the Chernobyl accident, the 134Cs/137Cs ra-tio was determined by pumping large volumes of water, greater than 900 litres,through a copper-ferrocyanide-impregnated cotton wound cartridge filter. Thefilters were treated in the way described above.
Plutonium and americium were coprecipitated as hydroxides at pH > 10,achieved by adding sufficient NaOH to the sample after adding 100 mg ofFeCl3 and about 5 g reducing agent (Na2S2O5), together with the chemicalyield determinants. As the lake water concentration of free ions was verylow, the addition of Ca, Mg and Al ions was necessary to make hydroxideprecipitation possible. The precipitates were collected in plastic carboys forfurther chemical separation and alpha spectrometry in the laboratory. Theisotopes 242Pu and 243Am were used as radiochemical yield determinants forPu and Am.
2.3 Laboratory treatment
All the analysis were carried out at the Dept. of Radiation Physics in Lund,Sweden and at Risø National Laboratory in Roskilde, Denmark. High puritygermanium (HPGe) detectors with low background were used for gamma anal-
5

ysis in order to detect the low-energy gamma-emitting nuclide 210Pb, usedto date the sediment cores. To be able to determine the supported 210Pb,which were performed by measurements on the short-lived 226Ra daughters,214Pb and 214Bi, the samples were left for 3 weeks before being analysed inthe counting geometry to ensure radioactive equilibrium. This is necessary asthe packing procedure causes the radon to be exhaled from the sample andthe determination of 214Pb and 214Bi activity will thus be underestimated.The final 210Pb data include corrections for different densities of the sedimentsamples. The copper-ferrocyanide-impregnated filters were incinerated beforebeing analysed in a well-calibrated geometry. The Cs precipitates were driedbefore gamma counting. The analytical procedures used for Pu and Am aredescribed by Talvitie (1971) and Holm (1984), although with small modifica-tions. For Pu and Am analysis about 5 g (d.w.) of sediment were incineratedovernight at 550C to determine the organic content. To ensure that any PuO2
particles, originating from the accident in 1968, would be dissolved we usedHF/HNO3 (1:10) repeatedly. The hydroxide precipitates of filtered lake waterwere dissolved in HNO3 and coprecipitated with iron hydroxide by addingammonia to pH ≈ 10. The precipitates were dried overnight, dissolved in 8 MHNO3, followed by the methods mentioned above (Talvitie, 1971; Holm, 1984).Alpha-particle spectroscopy was performed using solid state silicon detectors.
3 Results and Discussion
3.1 Caesium, plutonium and americium concentrations in the high arcticlakes
The lakes (V1, V2, V3 and V4) are small and shallow with small depth gra-dients. The maximum depths of lakes V1, V2 and V3 are 4, 9 and 2 metresrespectively. Lake V1 has the largest catchment area and the lake area is equalin size to that of lake V2. Lake V2 is a dammed lake which was influencedby anthropogenic activity during construction of the dam, so that gravel andstones are present in the sediment. This lake also serves as a drinking waterreservoir for the Thule air base.
Sediments
The area activity concentrations (Bq m−2) of caesium, plutonium and ameri-cium for the sediment profiles are shown in Figure 2 for each lake (the con-centrations are decay corrected to the reference date 1997–09–01). It can beseen that the isotopes exhibit maximum at the same depth, and this corre-sponds to the global fallout peak (assumed to represent the year 1963). Therather well shaped sediment profiles of fallout activity and the chronological
6
Tab
le1.
The
inve
ntor
yin
the
sedi
men
tco
res
from
the
lake
sst
udie
d.V
inco
mbi
nati
onw
ith
anu
mbe
rre
pres
ents
the
lake
and
Sin
com
bina
tion
wit
hnu
mbe
rre
pres
ents
the
sedi
men
tco
re.T
hefin
alro
wof
num
bers
give
sth
ein
vent
ory
for
the
soil
sam
ple
take
nin
the
catc
hmen
tar
eaof
lake
V1.
Lak
ean
dC
ore
137C
sin
vento
ry239,2
40P
uin
vento
ry238P
uin
vento
ry241A
min
vento
ry
[Bq
m−2
][B
qm
−2]
[Bq
m−2
][B
qm
−2]
V1S
111
93±
2731
.6±
0.8
1.80
±0.
06–
V1S
210
91±
2728
.3±
1.5
1.14
±0.
1511
.3±
0.5
V2S
1–
5.14
±0.
35–
3.18
±0.
23
V2S
236
3±
98.
72±
0.26
0.25
±0.
013.
98±
0.25
V2S
349
6±
1811
.6±
0.54
0.33
±0.
04–
V3S
157
8±
1621
.8±
1.1
0.51
±0.
046.
86±
0.34
V3S
210
85±
1425
.6±
0.8
0.58
±0.
0410
.8±
0.1
V3S
3a
343±
95.
51±
0.37
0.12
±0.
033.
54±
0.19
Soi
l
V1M
247
4.5±
1317
.5±
0.8
0.18
±0.
034.
89±
0.25
aTop
(0∼1
cm)
sedi
men
tlo
stdu
ring
sam
plin
g
7
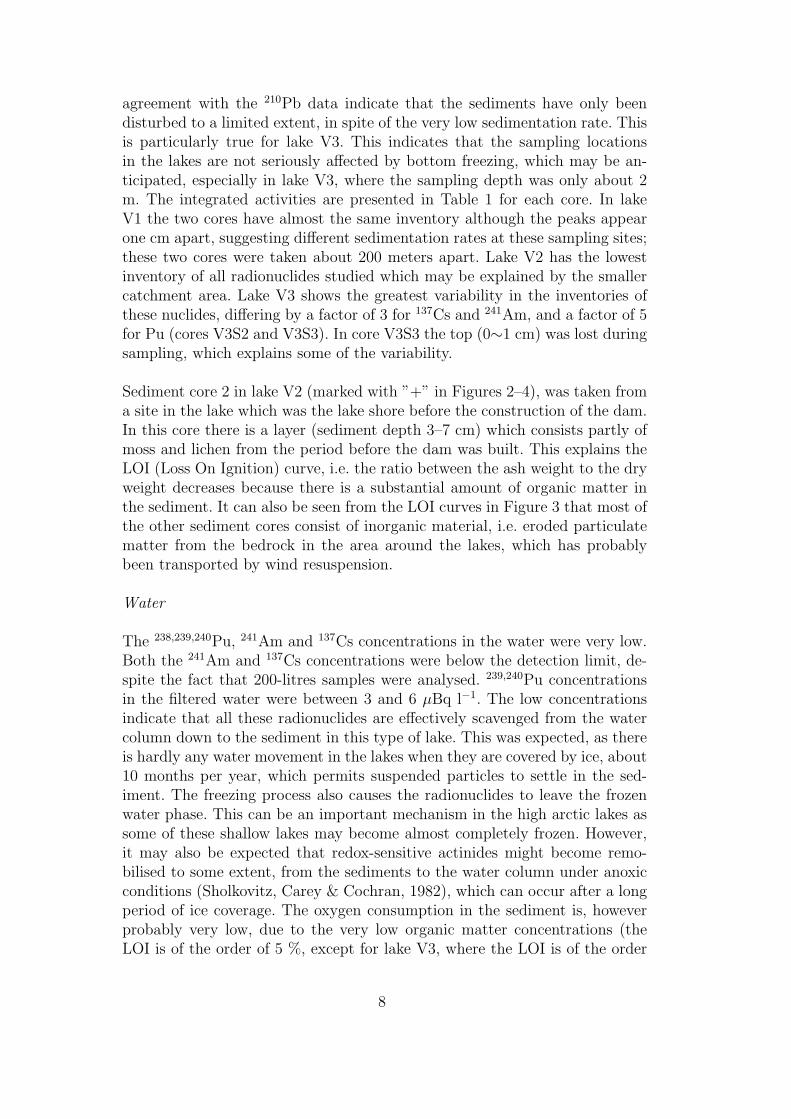
agreement with the 210Pb data indicate that the sediments have only beendisturbed to a limited extent, in spite of the very low sedimentation rate. Thisis particularly true for lake V3. This indicates that the sampling locationsin the lakes are not seriously affected by bottom freezing, which may be an-ticipated, especially in lake V3, where the sampling depth was only about 2m. The integrated activities are presented in Table 1 for each core. In lakeV1 the two cores have almost the same inventory although the peaks appearone cm apart, suggesting different sedimentation rates at these sampling sites;these two cores were taken about 200 meters apart. Lake V2 has the lowestinventory of all radionuclides studied which may be explained by the smallercatchment area. Lake V3 shows the greatest variability in the inventories ofthese nuclides, differing by a factor of 3 for 137Cs and 241Am, and a factor of 5for Pu (cores V3S2 and V3S3). In core V3S3 the top (0∼1 cm) was lost duringsampling, which explains some of the variability.
Sediment core 2 in lake V2 (marked with ”+” in Figures 2–4), was taken froma site in the lake which was the lake shore before the construction of the dam.In this core there is a layer (sediment depth 3–7 cm) which consists partly ofmoss and lichen from the period before the dam was built. This explains theLOI (Loss On Ignition) curve, i.e. the ratio between the ash weight to the dryweight decreases because there is a substantial amount of organic matter inthe sediment. It can also be seen from the LOI curves in Figure 3 that most ofthe other sediment cores consist of inorganic material, i.e. eroded particulatematter from the bedrock in the area around the lakes, which has probablybeen transported by wind resuspension.
Water
The 238,239,240Pu, 241Am and 137Cs concentrations in the water were very low.Both the 241Am and 137Cs concentrations were below the detection limit, de-spite the fact that 200-litres samples were analysed. 239,240Pu concentrationsin the filtered water were between 3 and 6 µBq l−1. The low concentrationsindicate that all these radionuclides are effectively scavenged from the watercolumn down to the sediment in this type of lake. This was expected, as thereis hardly any water movement in the lakes when they are covered by ice, about10 months per year, which permits suspended particles to settle in the sed-iment. The freezing process also causes the radionuclides to leave the frozenwater phase. This can be an important mechanism in the high arctic lakes assome of these shallow lakes may become almost completely frozen. However,it may also be expected that redox-sensitive actinides might become remo-bilised to some extent, from the sediments to the water column under anoxicconditions (Sholkovitz, Carey & Cochran, 1982), which can occur after a longperiod of ice coverage. The oxygen consumption in the sediment is, howeverprobably very low, due to the very low organic matter concentrations (theLOI is of the order of 5 %, except for lake V3, where the LOI is of the order
8

of 20-30 % for the upper 5 cm). Also, the dissolved Fe and Mn concentrationsare probably low, so even if reducing conditions would occur the carrier phaseswould not become affected. However, to see such effects, sampling should becarried out shortly before the ice breaks up. In this particular case, samplingwas performed at the end of the open-water season.
As the 137Cs was not detectable in 200-litres water samples, it would requirewater samples of at least some 12,000-litres to be able to detect 134Cs frompure Chernobyl fallout, assuming a 134Cs/137Cs ratio of 0.017 in 1997. Thelarge water samples (900–1200 litres) filtered through a Cu2[Fe(CN)6] filterthus contained no detectable 134Cs.
Soil
The soil core (Figure 2, bottom row) was sampled from the catchment area oflake V1. The inventories of the nuclides can be seen in Table 1. The inventoriesin the soil are lower than the inventories in lake V1, which is an indication thatthe catchment area is a source of radionuclides to the lake. The inventories of137Cs and 241Am in the soil are 42 % and 43 %, respectively, of the inventoriesin the lake, while for 239,240Pu the difference in the inventory is less (58 % ofthe inventory in the lake). The integrated (Bq m−2) 241Am/239,240Pu ratios inthe lake sediments are generally higher than in the soil, although the spreadis rather large. There are, however, indications that Am is somewhat moremobile than Pu. The integrated 241Am/239,240Pu ratio in global fallout shouldbe around 0.35 by 1997. However, as these conclusions are only based on asingle core they should be treated with caution. These indications are, however,interesting and further studies are in progress on samples collected in similarareas in the Canadian high arctic.
3.2 210Pb data and sediment chronology
We used the Constant Rate of Supply (CRS) model (Appleby & Oldfield,1978) to determine the sediment chronology. The choice of the CRS model isbased on the following arguments:-The CRS model is more flexible than the Constant Initial Concentration(CIC) model, and will give the same results as the CIC model if the initialconcentration is constant over time.-The atmospheric input of 210Pb is assumed to be constant from year to yearand the 210Pb in these inorganic sediments is considered to be immobile.
There is no reasons to believe that the flux of 210Pb would have changedsignificantly over time during the past decades. Such changes would require achange in the amount of precipitation or in the general air mass transport inthe region. Such drastic regional changes have not been reported. The large
9

Fig. 2. Depth profiles. The first row of figures represents lake V1, the second row lakeV2 and the third row lake V3. The columns represent individual nuclides with theactivity concentrations plotted versus depth. In each graph the individual sedimentcores can be distinguished, ”” represents core 1, ”+” represents core 2 and ”•”represents core 3 in each lake. The top (0∼1 cm) sediment in core V3S3 was lostduring the sampling procedure. Uncertainties have been omitted from the figure tomake it legible, and are for 137Cs ∼ 3 %, for 239,240Pu ∼ 8 %, 238Pu ∼ 15 % (butat low activity levels up to 100 %) and for 241Am ∼ 10 %.
variation in 210Pb flux during each year, which is due to the long period of icecover, does not affect the CRS model as long as the overall yearly flux is thesame. Since some construction work has obviously occurred around lake V2there is reason to believe that the suspended matter concentrations and thusthe mass flux to the sediment has changed over time. Due to this, the CRSmodel was used, rather than the CIC model. To be consistent the CRS modelwas used for all sediment cores collected.
Air concentrations of 210Pb were taken from the EML-database EML (1999).The data show air concentration maxima of 210Pb in the winter and minimain the summer, although the exhalation of 222Rn from the ground is assumedto reach a maximum in the summer. The same annual cyclic 210Pb air concen-
10
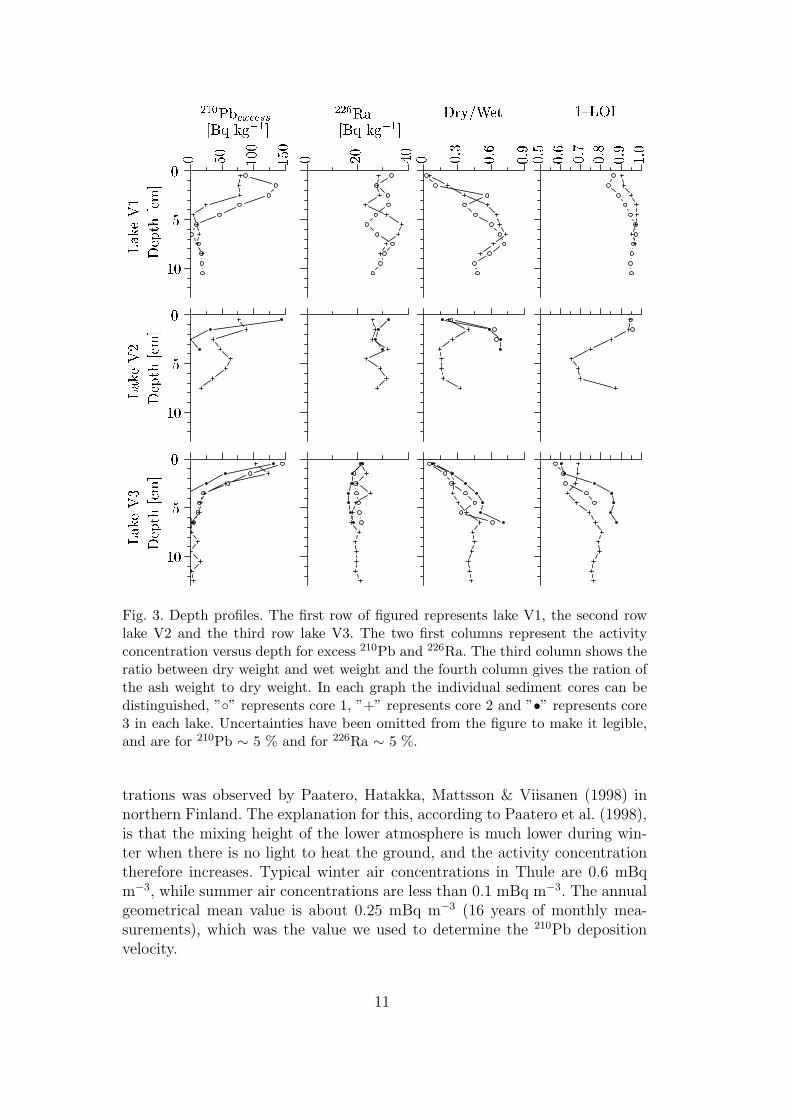
!
!
!
"#$%
"#$%
"#$%
Fig. 3. Depth profiles. The first row of figured represents lake V1, the second rowlake V2 and the third row lake V3. The two first columns represent the activityconcentration versus depth for excess 210Pb and 226Ra. The third column shows theratio between dry weight and wet weight and the fourth column gives the ration ofthe ash weight to dry weight. In each graph the individual sediment cores can bedistinguished, ”” represents core 1, ”+” represents core 2 and ”•” represents core3 in each lake. Uncertainties have been omitted from the figure to make it legible,and are for 210Pb ∼ 5 % and for 226Ra ∼ 5 %.
trations was observed by Paatero, Hatakka, Mattsson & Viisanen (1998) innorthern Finland. The explanation for this, according to Paatero et al. (1998),is that the mixing height of the lower atmosphere is much lower during win-ter when there is no light to heat the ground, and the activity concentrationtherefore increases. Typical winter air concentrations in Thule are 0.6 mBqm−3, while summer air concentrations are less than 0.1 mBq m−3. The annualgeometrical mean value is about 0.25 mBq m−3 (16 years of monthly mea-surements), which was the value we used to determine the 210Pb depositionvelocity.
11

Fig. 4. Depth profiles. The first row of figures represents lake V1, the second row lakeV2 and the third row lake V3. The columns represent the nuclide ratios versus depth.In each graph the individual sediment cores can be distinguished, ”” represents core1, ”+” represents core 2 and ”•” represents core 3 in each lake. Uncertainties havebeen omitted from the figure to make it legible, and are for 239,240Pu/137Cs ∼ 10%, for 238Pu/239,240Pu ∼ 25 % (but at low activity levels up to 100 %) and for241Am/239,240Pu ∼ 15 %.
Determination of unsupported 210Pb was performed using gamma spectrom-etry. Supported 210Pb was assumed to be in equilibrium with 226Ra and theshort lived daughters, 214Pb and 214Bi, after the sample had been stored for 3weeks. The activity of these nuclides were also measured using gamma spec-trometry and the geometrical mean value represents the supported level. Thecounting jars used in the gamma spectroscopy measurements were not com-pletely gas-tight, so there may have been some loss of radon. If this was thecase, the supported level would be underestimated and the slices would bedetermined to be younger than they actually are. It seems that we did loosesome 222Rn, as the excess 210Pb tails do not reach zero at great depths in the
12
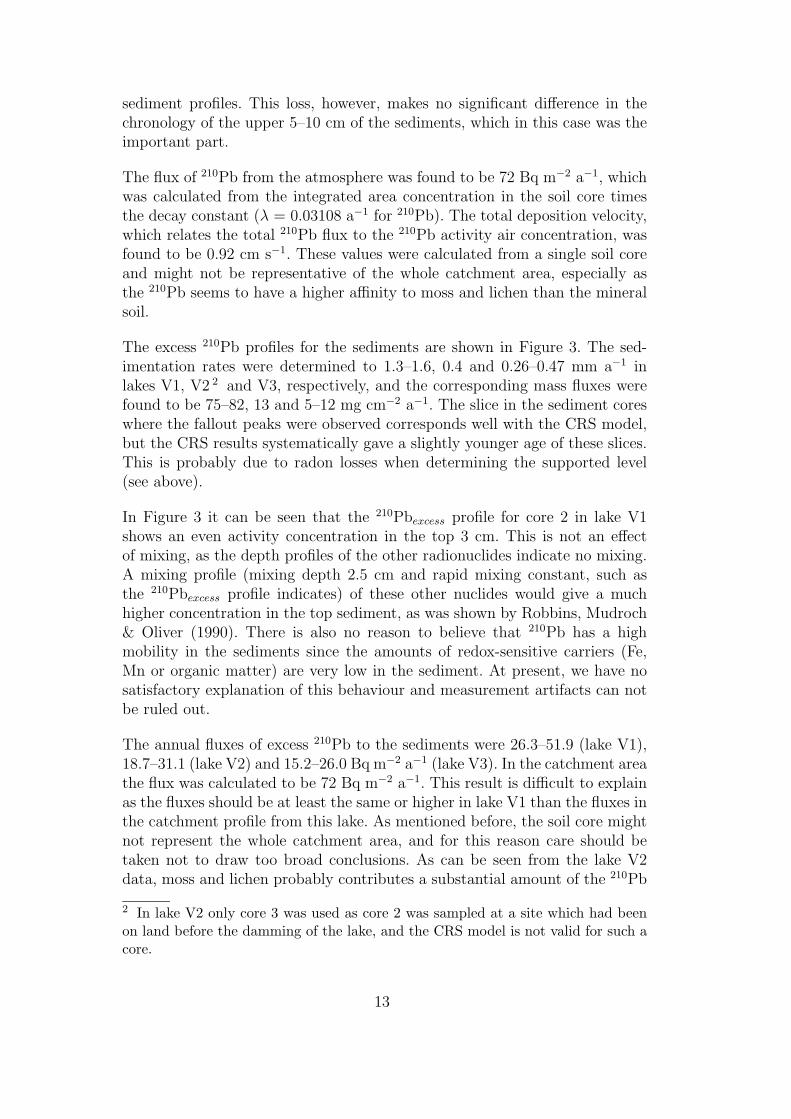
sediment profiles. This loss, however, makes no significant difference in thechronology of the upper 5–10 cm of the sediments, which in this case was theimportant part.
The flux of 210Pb from the atmosphere was found to be 72 Bq m−2 a−1, whichwas calculated from the integrated area concentration in the soil core timesthe decay constant (λ = 0.03108 a−1 for 210Pb). The total deposition velocity,which relates the total 210Pb flux to the 210Pb activity air concentration, wasfound to be 0.92 cm s−1. These values were calculated from a single soil coreand might not be representative of the whole catchment area, especially asthe 210Pb seems to have a higher affinity to moss and lichen than the mineralsoil.
The excess 210Pb profiles for the sediments are shown in Figure 3. The sed-imentation rates were determined to 1.3–1.6, 0.4 and 0.26–0.47 mm a−1 inlakes V1, V2 2 and V3, respectively, and the corresponding mass fluxes werefound to be 75–82, 13 and 5–12 mg cm−2 a−1. The slice in the sediment coreswhere the fallout peaks were observed corresponds well with the CRS model,but the CRS results systematically gave a slightly younger age of these slices.This is probably due to radon losses when determining the supported level(see above).
In Figure 3 it can be seen that the 210Pbexcess profile for core 2 in lake V1shows an even activity concentration in the top 3 cm. This is not an effectof mixing, as the depth profiles of the other radionuclides indicate no mixing.A mixing profile (mixing depth 2.5 cm and rapid mixing constant, such asthe 210Pbexcess profile indicates) of these other nuclides would give a muchhigher concentration in the top sediment, as was shown by Robbins, Mudroch& Oliver (1990). There is also no reason to believe that 210Pb has a highmobility in the sediments since the amounts of redox-sensitive carriers (Fe,Mn or organic matter) are very low in the sediment. At present, we have nosatisfactory explanation of this behaviour and measurement artifacts can notbe ruled out.
The annual fluxes of excess 210Pb to the sediments were 26.3–51.9 (lake V1),18.7–31.1 (lake V2) and 15.2–26.0 Bq m−2 a−1 (lake V3). In the catchment areathe flux was calculated to be 72 Bq m−2 a−1. This result is difficult to explainas the fluxes should be at least the same or higher in lake V1 than the fluxes inthe catchment profile from this lake. As mentioned before, the soil core mightnot represent the whole catchment area, and for this reason care should betaken not to draw too broad conclusions. As can be seen from the lake V2data, moss and lichen probably contributes a substantial amount of the 210Pb
2 In lake V2 only core 3 was used as core 2 was sampled at a site which had beenon land before the damming of the lake, and the CRS model is not valid for such acore.
13

to these lakes; the more organic matter transported to the lake, the more 210Pbwill also be transported. It is important to keep in mind that the lakes aredeposition zones for areas not necessarily represented by their drainage basins,but for a much wider area. Wind-blown dust and moss and lichen are carriedfar beyond the drainage basin borders, and therefore sediment inventories andratios may very well differ from what is found in the soil profiles in the closevicinity of the lake.
The results for the lake V1-area are interesting, as there are higher inventoriesof anthropogenic nuclides in the lake V1 than in the catchment area (a factorof 2 higher). This means that 210Pb can not be used as a normalising nuclidefor transport of transuranic elements from the catchment area to the lake,i.e. 210Pb has a different transport mechanism than the transuranic elementsstudied in this investigation. 210Pb probably has an active uptake mechanismin vegetation, which the transuranic elements do not have, which prevents210Pb from leaving the catchment area. Alternatively, the difference may bedue to the fact that we are comparing a transient input with a steady stateinput. Perhaps the 210Pb flux may be used to normalize the inputs for eachyear, if they could be measured (e.g. by sediment traps). Or perhaps by now(some 30–35 years after the fallout period) the main part of the anthropogenicfallout isotopes are residing in a different compartment than the main part ofthe 210Pb and, therefore, there has been a gradual shift in isotope ratios (e.g.210Pb to 239,240Pu ratios) transported to the lakes.
3.3 Indications of radionuclides originating from the Thule accident and iso-topic ratios
The EML air concentration measurements of 239,240Pu shown in Figure 5 indi-cate that in January 1968 there was an increase in concentration that remainedreasonably constant (∼ 2 µBq m−3) until September. This may be due to earlyannual mixing of the stratosphere and the troposphere, but it is also apparentfrom Figure 5 that the annual mixing reaches maximum levels in March andApril during the 9 years of monitoring 239,240Pu. The 239,240Pu/90Sr ratio in-creased in the air sample in January at Thule (ratio = 0.056) compared withthe other northern sampling stations (ratio = 0.021) during the same timeperiod (Aarkrog, 1971), and this again is an indication of plutonium from theaccident. Kudo, Zheng, Koerner, Fisher, Santry, Mahara et al. (1998) per-formed radioisotope measurements on ice cores from the Agassiz ice cap ofEllesmere Island (some one hundred kilometres north-west of the Thule airbase). They found a Pu peak in these depth profiles, which they dated to1968. This peak is probably from the People’s Republic of China’s nucleartest programme during which, an atmospheric test detonation of fission yieldequivalent to 3 Mton TNT was performed in June 1967 (Perkins & Thomas,
14
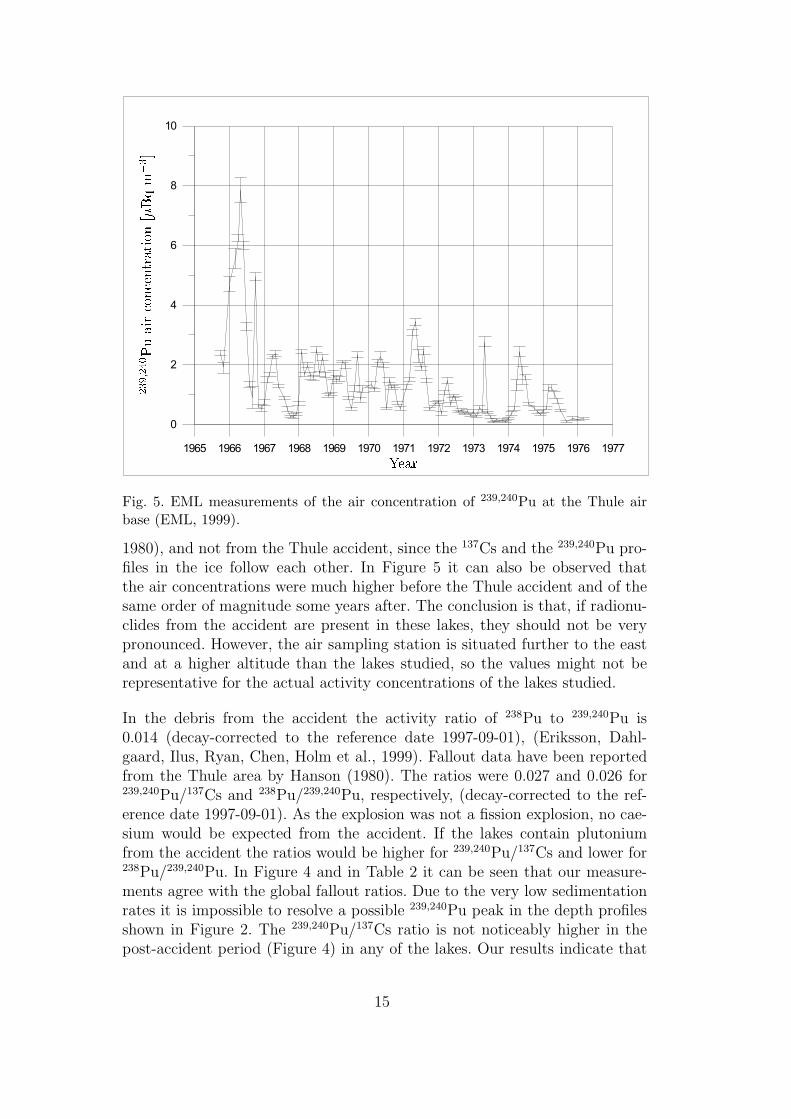
Fig. 5. EML measurements of the air concentration of 239,240Pu at the Thule airbase (EML, 1999).
1980), and not from the Thule accident, since the 137Cs and the 239,240Pu pro-files in the ice follow each other. In Figure 5 it can also be observed thatthe air concentrations were much higher before the Thule accident and of thesame order of magnitude some years after. The conclusion is that, if radionu-clides from the accident are present in these lakes, they should not be verypronounced. However, the air sampling station is situated further to the eastand at a higher altitude than the lakes studied, so the values might not berepresentative for the actual activity concentrations of the lakes studied.
In the debris from the accident the activity ratio of 238Pu to 239,240Pu is0.014 (decay-corrected to the reference date 1997-09-01), (Eriksson, Dahl-gaard, Ilus, Ryan, Chen, Holm et al., 1999). Fallout data have been reportedfrom the Thule area by Hanson (1980). The ratios were 0.027 and 0.026 for239,240Pu/137Cs and 238Pu/239,240Pu, respectively, (decay-corrected to the ref-erence date 1997-09-01). As the explosion was not a fission explosion, no cae-sium would be expected from the accident. If the lakes contain plutoniumfrom the accident the ratios would be higher for 239,240Pu/137Cs and lower for238Pu/239,240Pu. In Figure 4 and in Table 2 it can be seen that our measure-ments agree with the global fallout ratios. Due to the very low sedimentationrates it is impossible to resolve a possible 239,240Pu peak in the depth profilesshown in Figure 2. The 239,240Pu/137Cs ratio is not noticeably higher in thepost-accident period (Figure 4) in any of the lakes. Our results indicate that
15
resuspension in the eastern direction from the location of the accident pointof impact and the contaminated areas have been minute. This is an importantresult as this means that the population at the Thule air base has not been ex-posed to any great extent to resuspended debris from the accident during thepast 29 years. The 241Am/239,240Pu ratios vary between 0.40 and 0.61 (meanvalues for the sediment cores in the lakes). In the soil the ratio is lower (0.28)and this may indicate that americium is more mobile than plutonium, and istherefore transported to the lake more quackery. Data reported by Sokolik,Ivanova, Leinova, Ovsiannikova & Kimlenko (2001), showed that in all threesoil types investigated (two mineral and one organic soil type) there was amuch higher fraction of Am than Pu in the pore solution. The distributioncoefficient, Kd, for Am in the solid phase-pore solution of the soil was morethan twice as high as the Kd for Pu. In Figure 2 it can be seen that 241Am hasa broader peak than the other nuclides in the soil profile. This also gives anindication that Am is more mobile in the soil than the other nuclides studied.
4 Conclusions
No remobilization of radionuclides from the accident to the lakes has beenobserved. This indicates that the inhabitants of the Thule air base have beenonly very slightly exposed to resuspended nuclides originating from the acci-dent, if at all. The sedimentation rates were too low to resolve a possible Thuleaccident peak from the global fallout peak in the sediments. However, therewas no detectable plutonium contamination originating from the accident inthe lake sediments, as the 239,240Pu/137Cs, 238Pu/239,240Pu and 241Am/239,240Puratios agreed with the global fallout values. Plutonium, americium and cae-sium are effectively scavenged from the water to the sediment. In this studyit was observed that americium is more mobile in soil than plutonium, whichis in agreement with the findings of Sokolik et al. (2001), however, our obser-vation is based on one single soil core. The CRS dating agreed well with thefallout peaks in the sediment. In this study, it was also observed that 210Pb inthis area cannot be used as a normalised nuclide for the transport of actinidesfrom the catchment area to the lake sediments.
5 Acknowledgements
The authors would like to thank Claus Andersen at Risø National Labora-tory for his help in visualizing the data. We would also like to thank thetechnicians at the laboratories for providing skillful assistance. The projectwas funded by Nordic Nuclear Safety Research within the framework of the
16

Table 2The isotopic ratios in lake sediments and the soil core. The mean values are thegeometrical mean of each slice in the cores. V in combination with a number rep-resents the lake and S in combination with a number represents the sediment core.
Lake and Core 239,240Pu / 137Cs 238Pu / 239,240Pu 241Am / 239,240Pu
V1S1 0.0265 ± 0.0009 0.0571 ± 0.0024 –
V1S2 0.0259 ± 0.0015 0.0403 ± 0.0058 0.400 ± 0.028
Mean 0.0262 ± 0.0018 0.0487 ± 0.0063 0.400 ± 0.028
V2S1 – – 0.619 ± 0.061
V2S2 0.0240 ± 0.0009 0.0284 ± 0.0014 0.456 ± 0.031
V2S3 0.0234 ± 0.0014 0.0287 ± 0.0037 –
Mean 0.0237 ± 0.0017 0.0286 ± 0.0040 0.538 ± 0.068
V3S1 0.0376 ± 0.0021 0.0234 ± 0.0021 0.315 ± 0.022
V3S2 0.0236 ± 0.0008 0.0226 ± 0.0016 0.419 ± 0.014
V3S3 0.0160 ± 0.0011 0.0223 ± 0.0052 0.642 ± 0.055
Mean 0.0258 ± 0.0025 0.0228 ± 0.0059 0.459 ± 0.061
Total Mean 0.0253 ± 0.0035 0.0318 ± 0.0095 0.475 ± 0.096
Soil
V1M1 0.0369 ± 0.0020 0.0100 ± 0.0016 0.279 ± 0.019
BOK–2 programme.
References
Aarkrog, A. (1971). Radioecological investigations of plutonium in an arcticmarine environment. Health Phys., 20, (Jan), 31–47.
Aarkrog, A. (1977). Environmental behaviour of plutonium accidentally re-leased at Thule, Greenland. Health Phys., 32, 271–284.
Aarkrog, A. Dahlgaard, H. Holm, E. Hanson, H. Lippert, J. & Nilsson, K.(1981). Environmental Radioactivity in Greenland in 1980. Risø-R-449, RisøNational Laboratory, Roskilde, Denmark, 55 pp.
17
Aarkrog, A. Dahlgaard, H. & Nilsson, K. (1984). Further Studies of Plutoniumand Americium at Thule, Greenland. Health Phys., 46, 29–44.
Aarkrog, A. Boelskifte, S. Dahlgaard, H. Duniec, S. Holm, E. & Smith,J. N. (1987). Studies of Transuranics in an Arctic Marine Environment.J.Radioanal.Nucl.Chem.Article., 115, 39–50.
Aarkrog, A. Buch, E. Chen, Q. J. Christensen, G. C. Dahlgaard, H. Hanson,H. Holm, E. & Nielsen, S. P. (1988). Environmental Radioactivity in theNorth Atlantic Region Including the Faroe Islands and Greenland. 1986.Risø-R-550, Risø National Laboratory, Roskilde, Denmark, 69 pp.
Aarkrog, A. Chen, Q. J. Clausen, J. Christensen, G. C. Dahlgaard, H. Ellis, K.Hanson, H. Holm, E. Joensen, H. P. Nielsen, S. P. & Strandberg, M. (1997).Environmental Radioactivity in the North Atlantic Region Including theFaroe Islands and Greenland. 1992 and 1993. Risø-R-757, Risø NationalLaboratory, Roskilde, Denmark, 132 pp.
Appleby, P. G. & Oldfield, F. (1978). The calculation of Lead-210 dates as-suming a constant rate of supply of unsupported 210Pb to the sediment.Catena, 5, 1–8.
EML-(Environmental-Measurement-Laboratory) open data base SASPhttp://www.eml.doe.gov/Databases/sasp (1998)
Eriksson, M. Dahlgaard, H. Ilus, E. Ryan, T. Chen, Q. J. Holm, E. & NielsenS. P. (1999). Plutonium in the marine environment off Thule Air Base, N.W. Greenland. Inventories and distribution in sediments 29 years after theaccident., 4th International conference on Environmental Radioactivity inthe Arctic. Edinburgh 20-23 Sep. 99 , (Strand, P. and Jølle, T. Ed.), NRPA,Norway, 60-62.
Hanson, W. C. (1980). Transuranic elements in arctic tundra ecosystems. InW. C. Hanson Transuranic elements in the Environment 9, 441–458.
Holm, E. (1984). Review of Alpha-Particle Spectrometric Measurements ofActinides. Int. J. Appl. Rad. Isot., 35, 285–290.
Kudo, A. Zheng, J. Koerner, R. M. Fisher, D. A. Santry, D. C. Mahara,Y. & Sugahara M. (1998). Global Transport Rate of 137Cs and 239+240PuOriginating from the Nagasaki A-bomb in 1945 as Determined from Analysisof Canadian Arctic Ice Cores. J. Environ. Radioactivity, 40, No. 3, 289–298.
Paatero, J. Hatakka, J. Mattsson R. & Viisanen Y. (1998). Analysis ofdaily 210Pb air concentrations in Finland, 1967-1996. Radiation ProtectionDosimetry, 77, No. 3, 191–198.
Perkins, R. W. & Thomas, C. W. (1980). Worldwide Fallout. In W. C. HansonTransuranic elements in the Environment, 53–82.
Robbins, J. A. Mudroch, A. & Oliver B. G. (1990). Transport and Storage of137Cs and 210Pb in sediments of Lake St. Clair. Can. J. Fish. Aquat. Sci.,47, 572–587.
Roos, P. Holm, E. & Persson R. B. R. (1994). Comparison of AMP precipitatemethod and impregnated Cu2[Fe(CN)6] filters for determination of radio-cesium concentrations in natural waters. Nucl. Instr. and Meth. in Phys.Res., A 339, 282–286.
18
Sholkovitz, E. R. Carey, A. E. & Cochran J. K. (1982). Aquatic chemistry ofplutonium in seasonally anoxic lake waters. Nature, 300, 159–161.
Sokolik, G. A. Ivanova, T. G. Leinova, S. L. Ovsiannikova, S. V. & KimlenkoI. M. (2001). Migration ability of radionuclides in soil-vegetation cover ofBelarus after Chernobyl accident. Environment International, 26, 183–187.
Strand, P. Balonov, M. Aarkrog, A. Bewers, M. J. Howard, B. Salo, A. &Tsaturov, Y. S. (1998). AMAP Assessment Report: Arctic Pollution Is-sues, Arctic Monitoring and Assessment Programme (AMAP), Oslo, Nor-way, 525–619.
Talvitie, N. A. (1971). Radiochemical Determination of Plutonium in Envi-ronmental and Biological Samples by Ion Exchange. Analytical chemistry,43: 1827.
USAF Nuclear Safety. (1970). Project Crested Ice, AFRP 122–1 Jan/Feb/Mar1970, 65, No.1.
19


Paper IIIEriksson M.:Plutonium Inventory Calculations in Sediments when Hot Particles are PresentManuscript, (25 pp), 2002.
Risø–R–1321(EN) 85


Plutonium Inventory Calculations in Sediments
when Hot Particles are present
Mats Eriksson1,2
1Risø National Laboratory, P.O. Box 49, DK-4000 Roskilde, Denmark2Dept. of Radiation Physics, Lund University Hospital, S-221 85 Lund, Sweden
Abstract
The inventory of plutonium in marine sediments, originating from theaircraft accident in 1968, in Thule (Greenland) has been calculated. Twodifferent methods have been used for estimating the plutonium inventoryin these activity heterogenous sediments containing hot particles. Oneof the methods assumes homogenous activity distribution and the activ-ity is determined based on radiochemical separation followed by alphaspectrometry (conventional method). The other method is based on anon destructive technique, measuring the gamma emitting 241Pu daugh-ter 241Am for the determination of 239,240Pu. The design of the methodmakes it possible to evaluate how hot particles effect the inventory.
Plutonium from the accident has been dispersed to a distance of 99.3km from the point of impact with a dispersion rate of 3.4 km y−1. The Puactivity concentration in the sediment is best described by a bi-exponentiallydecreasing function of the distance from the point of impact.
The differences between the two total 239,240Pu inventory estimationmethods are significant, 9.6 TBq compared to 3.9 TBq. The lower esti-mate can be partly explained by the method assuming homogenous activ-ity distribution, not using a representative sub-sample and also using aninadequate dissolution method not totally dissolving PuO2-complexes.
1 Introduction
It is difficult to calculate an accurate inventory of plutonium in sedimentswhen hot particles are present, as samples are heterogeneous and cannot behomogenised in terms of their activity concentrations. The main problems areoutlined below.
1.1 Sampling treatment used previously for Thule sedi-ments
There are several problems when determining activity concentrations of radionu-clides in samples containing Pu hot particles. Due to poor resolution in the alphaspectra, the 239,240Pu low energy tail will grow into the yield determinant peak(242Pu) if a hot particle is included in the analyzed sub-sample, which preventedactivity determination. In such cases in past studies, replicate samples were
1

taken until a resolvable spectrum was obtained. Often only one such replicatesample was needed. This procedure inevitably results in an underestimation ofthe total activity.
Another problem (uncertainty) is that small sub-samples are used becausethe sediments are highly contaminated. Typically 0.5–1 g of ∼ 140 g has beenused in determining the activity concentration in the Thule sediment samples.Such a small sub-sample is not representative of the whole sample when theactivity is heterogeneously distributed in the slice, which is the case when Pu-hot particles are present.
A third problem is that the particles in the Thule sediments are present asPuO2 [1]. Plutonium in this chemical form is difficult to dissolve using commonchemical dissolution techniques, such as leaching with Aqua Regia [2]. Testshave shown that up to 40 % of the Pu activity remains undissolved when theplutonium is in this form [3]. The method used at Risø National Laboratory hasbeen the one described by Talvitie [4], using Aqua Regia for leaching plutoniumfrom samples. Therefore we know that the Pu activity in the Thule samples hasbeen underestimated and for that reason the inventory is higher than published.Two of the problems described above (poor alpha resolution and leaching insteadof using a total destruction technique) give a maximum measurable activity levelof about 0.8 Bq 239,240Pu per sub-sample. The hot particles therefore give riseto an uncertainty when the inventory is calculated.
There is also a fourth problem; sediment mixing caused by bioturbation,which has buried the plutonium deep down in the sediment [5]. The sedimentcorers used, Gemini and Haps, do not sample to depths below the mixing depth,and so will also result in an underestimate of the inventory. This is mainly aproblem in close vicinity to the point of impact, where the plutonium originatingfrom the accident is buried to depths greater than 20 cm. In Figure 2, data fromDahlgaard et al. (2001) [6], show depth profiles from the Thule-97 expeditionwhere this effect can be seen.
To avoid the problem of small sub-samples, all of the sediment in each sectioncould be totally dissolved and a small aliquot from the homogeneous activitysolution could be used to determine the activity by ordinary alpha-spectrometryor by ICP-MS. However, this can be difficult as the dissolution problem ofthe PuO2-complexes still remains and there are no radiochemical proceduresreported of how to totally dissolve 140 g of sediment. It is important to keepin mind that the chemical yield determinant is in another chemical form, oftenPu-nitrate. The chemical yield can therefore be very good even though somefractions from the PuO2 particles may remain undissolved, for that reason thechemical yield calculated can be misleading.
There are relatively few hot particles in the Thule sediments, however, theycarry most of the activity, as will be shown later. A method to get a moreaccurate estimate of the Pu-inventory could be to focus on measuring these. Thiscould be done by gamma-measurement on the gamma emitting 241Pu daughter241Am in the whole sediment slice sample. By this method the dissolutionproblem of the PuO2-particle is excluded, and fairly large sub-samples couldbe used to determine the activity, which gives a more representive sub-sample.However, applying this technique to determine the plutonium activity requiresthat the activity ratios (241Am/Pu and 241Pu/Pu) are known in the wholesampling area. In addition, precautions must be taken as the 241Am gammaenergy is fairly low (Eγ = 59.6 keV) and self attenuation in the sample can
2
be a problem. There are methods describing activity determinations when γ-emitting hot particles are present, i.e. Bunzl [7] and Kashparov et al. [8]. Theystress the importance of measure the samples several times, mixing the samplebetween the different measurements, when hot-particles are present and a planarmeasurement geometry is used. As, if a hot-particle has a geometrically closeposition to the detector in the measurement geometry, it would overestimatethe activity in the sample, and if the particle has a position ”far away” onewould underestimate the activity. Bunzl [7] also defines that a sample containsa hot particle if the different measurements of the same sample exceed a certaindeviation. The magnitude of the deviation depends on the number of mixingsperformed and on the precision of the activity measurement. A similar studyis also presented by Kashparov et al. [8]. Nageldinger et al. [9] define a hotparticle as a material particle of any chemical and radionuclide compositionwith a size of up to 100 µm and an activity of not less than 4 Bq per particle.Nageldinger et al.’s [9] definition is less appropriate for Pu-alpha emitting hotparticles as, in any environmental sample 4 Bq Pu would be considered a veryhigh activity. Usually activity levels are 3–6 orders of magnitude lower (mBq–µBq) per sample. The most convenient definition of Pu hot particles in sedimentis the one described by Bunzl [7].
1.2 Brief overview of the Thule accident
In January 1968 an aircraft accident involving four nuclear weapons took placein N.W. Greenland. A B-52 bomber, HOBO 28, caught fire and crashed on thesea ice in Bylot Sound, 11 km west of Thule Air Base. Both the aircraft andthe four unarmed weapons disintegrated on impact and caused contaminationof the surroundings. The non-nuclear explosions were due to the conventionalexplosive material in the detonators of the weapons. The fissile materials in theweapons were pulverized in the explosion, forming PuO2 particles. Most of theplutonium was recovered during the clean up program ”Crested Ice”. However,approximately 3 kg of plutonium was not recovered according to USAF NuclearSafety report [1] and Strand et al. [11]. More detailed descriptions of theaccident are published elsewhere, [3, 6, 10].
On the Thule-97 expedition, which is the latest of a series of expeditions,a comprehensive sampling program was performed involving taking 56 doublesediment cores, 30 water samples and 134 biota samples. Some of the resultsare reported elsewhere [6, 13, 14, 15].
Earlier studies in the Thule marine environment have assumed that the fewhot particles observed in the sediment do not contribute significantly to the totalinventory in the Bylot sound. In this paper, the influence of the hot particles onthe plutonium inventory has been studied, based on samples from the Thule-97expedition, using two different methods. One method assumes a homogenousactivity distribution and uses high resolution alpha spectrometry and the otheris based on a non destructive screening technique.
3

2 Material and Methods
2.1 Area studied
The Bylot Sound is located outside the Thule air base, 7633N and 6840W(NW Greenland). The sound is ice covered for about 10 months of the year.The maximum water depth is about 250 meters. The current in the Bylot Soundis predominately tidal [1] and there are two depressions, where fine grainedsediments accumulate. The studied area and the sampling stations are indicatedin Figure 1. The point of impact is denoted by V2 in the figure.
2.2 Field sampling
A 5 week international sampling cruise to the Thule area took place in Augustand September 1997.The sediments were mostly sampled by a Gemini corerfrom the research vessel Adolf-Jensen, but at locations with stony sediment theHAPS sediment corer was used. The sediment cores sampled by the Geminiwere sliced into 1 cm slices and the cores sampled by the HAPS into 3 cm thicksections. The slices were frozen and stored in a cold room (-18C) on the shipin plastic boxes. At some locations it was hard to sample the sea floor becauseof stones, most likely dropped from passing icebergs and/or because the finesediment had been washed away by tidal bottom water currents.
2.3 Laboratory treatment
2.3.1 Preparation for alpha spectrometry
In the laboratory, the samples were weighed before freeze drying. The dryweight to wet weight ratios were determined. A one gram sub-sample was takenfrom every slice for Pu and Am determination. Plutonium and americium wereseparated using a method described by Talvitie and Holm [4, 16]. The sub-samples were ashed at 700C for 2 hours, followed by wet ashing with AquaRegia, ion-exchange was then used (AG 1×4, 100–200 mesh, BIO RAD). 242Puand 243Am were used as yield determinants. The samples were electrodepositedonto stainless steel discs and measured by passivated implanted planar silicon(PIPS)-detectors. Discs with an activity higher than ∼ 0.8 Bq were measuredby a special high resolution setup (FWHM < 20 keV) in order to resolve thespike-peak (242Pu) from the 239,240Pu-peak.
Twenty of the samples were wet ashed in a microwave-oven with HF andHNO3 in order to ensure that the Pu-oxide particles were totally dissolved.These samples were used for absolute calibration of the gamma measurementsused in the screening experiment, which is described below.
2.3.2 Preparation for gamma spectroscopy
For the gamma screening experiment, sediment cores from 6 sites were selected.The sites were chosen on the basis that the activity concentration in Bylot Sounddecreases exponentially with distance from the point of impact, [17, 18, 19]. Thedepth of the sediment cores varied between 7 and 20 cm, and they were splitinto one centimeter slices on board the research vessel Adolf-Jensen. Fromevery sediment slice five aliquots were taken. In order to compare the results
4

Figure 1: Sampling locations visited at the Thule-97 used in the present paper.Further information of the locations in Table 2. Point of impact is denoted V2.
5

with earlier expeditions, where the plutonium activity concentrations were basedupon 1 g aliquots, and to be able to get an estimate of the variance of theactivity concentration, 1 g sub-samples were taken. In total 440 samples weremeasured. The measurements were performed on a High Purity Germanium(HPGe) well-type detector and the acquisition time was about 3600 seconds.This gives a detection limit of ∼ 0.01 Bq 241Am or 0.05 Bq 239,240Pu, assuming241Am/239,240Pu = 0.17. Advantages of using a small cylindrical geometry (Ø =9 mm) are that self attenuation is small and that the count-rate is only slightlydependent on the position of the particle in the measured geometry.
The concentrations of 137Cs and 210Pb were determined on large sub-samples(10–15 g). Determination of 210Pb was only performed for cores sampled by theGemini corer. The measurements were done on HPGe-detectors with efficienciesbetween 25–40% and a low backgrounds.
2.4 Particle size distribution
The particle size distributions was investigated by autoradiography soon afterthe accident and the results are presented in the report ”Crested Ice” [1]. In thesnow sample the geometric mean diameter was 5.6 µm and for the ice samplethe geometric mean diameter was 2 µm. The distributions were log-normal1.As the activity of a particle is proportional to the volume of the particle wehave calculated the activity distribution of these particles, by the relationshipdescribed in Equation 1.
Aparticle =(
d
2
)3
× k (1)
where d is the diameter and k is a constant of proportionality.
2.5 Calculations of activity concentrations in the sediment
2.5.1 Conventional determination of Pu activity concentrations inthe Thule sediments
For every sediment slice in a core the activity concentration was determinedusing a 1 g sub-sample from the well-mixed dry powder of the slices, i.e. :
Aslice =Asub-samplemsub-sample
[Bq kg−1] (2)
where Aslice is the activity concentration, Asub-sample is the activity of the sub-sample and msub-sample is the mass of the sub-sample. This activity concentrationis then converted to activity per unit area. All the slices are then summed toobtain the inventory at the location:
AInventory, core =N∑
i=1
Aactivity in slice i [Bq m−2] (3)
Here, Aactivity in slice i is the activity per unit area of slice i, and N is thenumber of slices in the core.
1The notation ”log” is in this paper refers to the natural logarithm
6

Figure 2: 239,240Pu sediment profiles in sediment cores collected on the Thule-97expedition. Figure from Dahlgaard et al. [6]
7
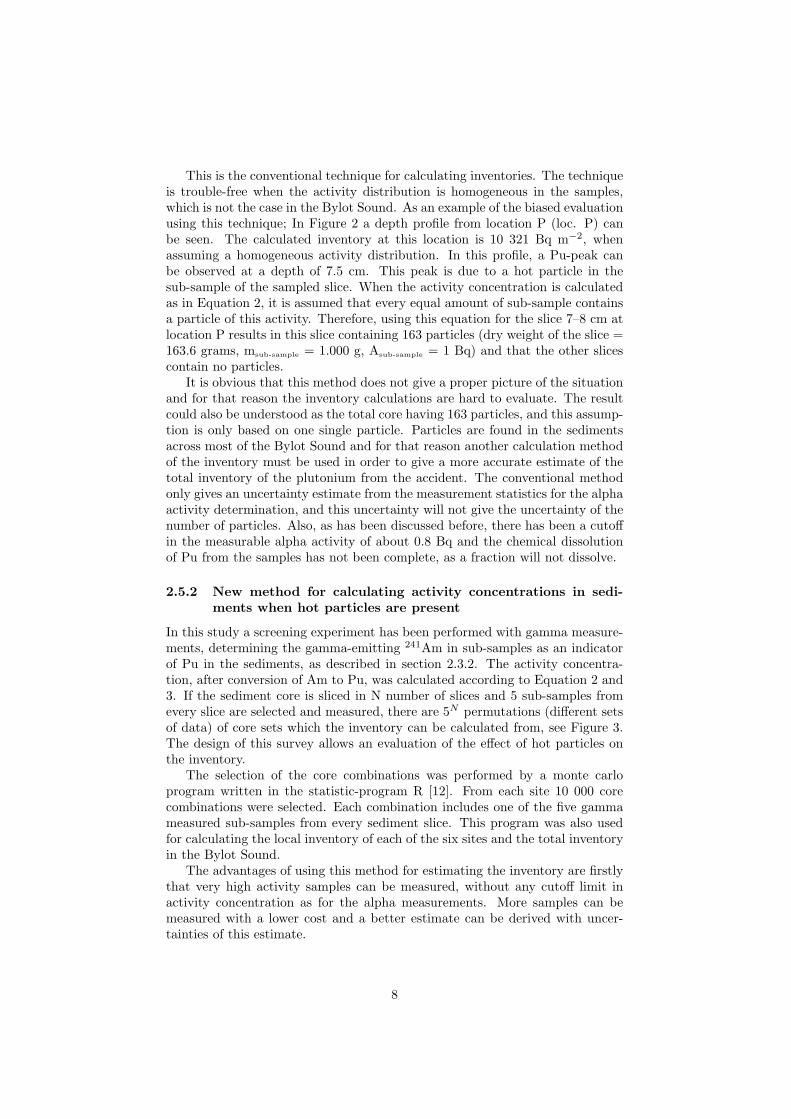
This is the conventional technique for calculating inventories. The techniqueis trouble-free when the activity distribution is homogeneous in the samples,which is not the case in the Bylot Sound. As an example of the biased evaluationusing this technique; In Figure 2 a depth profile from location P (loc. P) canbe seen. The calculated inventory at this location is 10 321 Bq m−2, whenassuming a homogeneous activity distribution. In this profile, a Pu-peak canbe observed at a depth of 7.5 cm. This peak is due to a hot particle in thesub-sample of the sampled slice. When the activity concentration is calculatedas in Equation 2, it is assumed that every equal amount of sub-sample containsa particle of this activity. Therefore, using this equation for the slice 7–8 cm atlocation P results in this slice containing 163 particles (dry weight of the slice =163.6 grams, msub-sample = 1.000 g, Asub-sample = 1 Bq) and that the other slicescontain no particles.
It is obvious that this method does not give a proper picture of the situationand for that reason the inventory calculations are hard to evaluate. The resultcould also be understood as the total core having 163 particles, and this assump-tion is only based on one single particle. Particles are found in the sedimentsacross most of the Bylot Sound and for that reason another calculation methodof the inventory must be used in order to give a more accurate estimate of thetotal inventory of the plutonium from the accident. The conventional methodonly gives an uncertainty estimate from the measurement statistics for the alphaactivity determination, and this uncertainty will not give the uncertainty of thenumber of particles. Also, as has been discussed before, there has been a cutoffin the measurable alpha activity of about 0.8 Bq and the chemical dissolutionof Pu from the samples has not been complete, as a fraction will not dissolve.
2.5.2 New method for calculating activity concentrations in sedi-ments when hot particles are present
In this study a screening experiment has been performed with gamma measure-ments, determining the gamma-emitting 241Am in sub-samples as an indicatorof Pu in the sediments, as described in section 2.3.2. The activity concentra-tion, after conversion of Am to Pu, was calculated according to Equation 2 and3. If the sediment core is sliced in N number of slices and 5 sub-samples fromevery slice are selected and measured, there are 5N permutations (different setsof data) of core sets which the inventory can be calculated from, see Figure 3.The design of this survey allows an evaluation of the effect of hot particles onthe inventory.
The selection of the core combinations was performed by a monte carloprogram written in the statistic-program R [12]. From each site 10 000 corecombinations were selected. Each combination includes one of the five gammameasured sub-samples from every sediment slice. This program was also usedfor calculating the local inventory of each of the six sites and the total inventoryin the Bylot Sound.
The advantages of using this method for estimating the inventory are firstlythat very high activity samples can be measured, without any cutoff limit inactivity concentration as for the alpha measurements. More samples can bemeasured with a lower cost and a better estimate can be derived with uncer-tainties of this estimate.
8

section=1
section=2
section=3
section=N
Combinations = 5; 51
Combinations = 5*5; 52
Combinations = 5*5*5; 53
Combinations = 5*…*5; 5N
Figure 3: Illustration of the number of core combinations (permutations) thatcan be derived from a sediment core with N sections which have five measuredsub-samples in every section.
9

0 20 40 60 80 100
05
1015
2025
30
Distance, r [km]
log(
I), I
[Bq/
km^2
]
+++++++++++
+
++
+ +
xxxxxxxxxxxx xx x x
+++x
Pu−dataexp−fitbiexp−fitCs−fit
+
+
+
++
+
+
++++
+++ + + +
0 20 40 60 80 100
0 e
+00
2 e
+10
4 e
+10
6 e
+10
Distance, r [km]
I [B
q/km
^2]
++
Pu−datalinear−interp.
Figure 4: Illustration of the three different fits that have been applied to thelocal inventories, I [Bq/km2], versus the distance, r [km]. 239,240Pu data aresymbolized with + and the 137Cs data with ×. In the left diagram, whichshows the natural logarithm of I, the bi-exponential and exponential fits areshown. To the right the discreet linear interpolated fit is shown.
10

2.5.3 Calculation of the total Inventory
Total inventory has been calculated using both methods described above. Thetotal accidental plutonium inventory in the sediment has been calculated byintegrating a fitted function, A(r, θ), to the local inventory, see Equation 4. Itis assumed that we have equal dispersion of plutonium in all directions. Thefunction, A(r, θ), is therefore independent of the direction, θ, and depends onlyon the distance, or radius r, from the point of impact. This assumption hasalso been applied to earlier estimates of the total inventory, [17, 18]. Whenthe radius, r, is greater than 7.5 km it is estimated that the integrating area,Ω
r>7.5km, is covered by 60 % land, resulting in 40 % of seafloor to integrateover.
Inventory =∫∫Ω
A(x, y)dxdy =∫∫Ω
A(r, θ)rdrdθ (4)
The upper integration limit, rlimit, is determined by the ratio 239,240Pu/137Csequaling the global fallout ratio. In these high arctic sea sediments, a falloutratio of 0.18 has been applied. This is the decay corrected value, to 1997, asAarkrog et al. [18] have applied in earlier estimates. The integration limit, ordispersion distance, rlimit, was derived from the exponentially fitted functionsfor 239,240Pu to 137Cs. This means that Equation 4 can be written as:
Inventory = 2π
7.5km∫r=0
A(r)rdr + 0.4 · 2π
rlimit∫r>7.5km
A(r)rdr (5)
3 Results and Discussion
3.1 Particle size distribution
In Figure 5 the particle activity distributions can be seen in the peak to theleft. This is the distribution that occurs if a log-normal distribution of theparticle diameter with a mean of 2 µm and with a log standard deviation of oneis applied. The constant, k, is set to 0.001 Bq µm−3. The calculation of k isderived from studies on single hot particles which will be published elsewhere.From the distributions it can be derived that only 1.3 % of the particles havean activity over the cutoff activity level of 0.8 Bq (equal to a diameter of about18.5 µm), however these particles carry about 79 % of the total activity.
These distributions were only valid for the particles found in the contami-nated ice area after the accident in 1968. Therefore, they can not simply beapplied to all the sediment in this area. It is not clear from the cited referencesif these particle size distributions were measured before or after the clean upprogram. If the distributions were valid after the clean up program, it still cannot simply be applied to the sediments, as the particle transport through the icemay depend on the size and activity. Also, the sedimentation rate through thewater column depends on the size and density of the particles. It is expected
11

−20 −15 −10 −5 0 5
0.0
0.1
0.2
0.3
0.4
Log−transformed particle size and activity distributionsD
ensi
ty
Size distributionActivity distrirbution
Figure 5: Particle distribution. The solid line shows the log-normal distributionfunction of the particle diameter (deduced from Project Crested Ice [1]), in µm,of the particles, mean diameter of 2 µm and with an log standard deviation ofone. The dashed line is the particle activity distribution derived from the sizedistribution by Equation 1. The mean activity is 0.001 Bq with a log standarddeviation of 3. The two distributions are log-transformed.
though, that the largest particles would have settled fastest and thereby alsosettled closest to the point of impact. Smaller size fractions may have beentransported further away by the tidal current and settle to the sediment atgreater distances. Therefore, it may be expected that the particle size distribu-tion would be a function of distance from the point of impact and probably thesize distribution may have a higher mean value at the point of impact comparedwith the distribution on the ice. These considerations are important becausethe few large hot particles carry most of the activity, and for that reason theyare very important when inventory estimations are carried out. It is clear, fromthe results from the Thule-97 expedition as well as earlier expeditions, that thehot particles are mostly found within a 6 km radius from the point of impact.
3.2 Results from the conventional method of calculatingthe total plutonium inventory in the Bylot Sound,based on alpha spectroscopy.
Table 2 gives inventories of 239,240Pu, based on alpha spectroscopy measure-ments, and of 137Cs determined by γ-spectroscopy. The excess 239,240Pu is de-rived by subtraction of the expected global fallout plutonium calculated from the137Cs data and the global fallout ratio. The global fallout ratio 239,240Pu/137Cswas set to 0.18. It is assumed that Pu has a similar transport mechanism to Csin the sedimentation process, i.e. near shore sediments have the same global fall-out ratio as sediments far from the shore. The 137Cs concentration seems, as hasalso been observed in earlier investigations [18, 19], to decrease exponentially
12

as a function of distance from the point of impact. This can be explained bythe fact that the crash occurred over one of the depressions in the Bylot Soundwhere the sedimentation rate may be higher. The fitted exponential function tothe 137Cs data in Table 2 is:
A(r, θ) = 567.16 · 106 · e−0.0308·r.The excess Pu data is best fitted to a decreasing bi-exponential function of
the distance from the point of impact, instead of a mono-exponential function ashave been used in earlier studies. This can be seen in the left diagram in Figure4, where the excess 239,240Pu is plotted against the distance in a log-diagram. Ina study of bioturbation, mixing and resuspension using a bioturbation model,which will be published elsewhere, it is shown that the sampling stations D,1412 and Ny–3 have mainly been contaminated by recent input of plutoniumwhich originated from the accident. For the other stations it seems as the maincontamination occurred soon (until the ice broke up) after the accident. It wasobserved that when the ice broke up in the summer following the accident, theice drifted to the north and out of Bylot Sound [1, 10].
These observations may explain the bi-exponential decrease in concentrationas a function of distance from the point of impact. The fast decreasing com-ponent in the function would then reflect the ice drift where the contaminatedice melted, resulting in the release of particles which sank to the seafloor duringthe ice drift. The slow component could represent the resuspension from theinitially contaminated areas. There is also another compartment, which canbe considered to be included in the fast component. This was the very firstmoment at impact (4:39 p.m. Atlantic Standard Time, 21 January 1968) wherean area of about 2500 m2 was broken up by the momentum of the impact of theaircraft on the ice and the exploding weapons. Through this hole, which wasrefrozen quickly, debris from the aircraft and an unknown amount of plutoniumwere transported to the seawater and the seafloor. The plutonium particlescould at this moment have been transported some kilometers away from theimpact site as there is a tidal current with a maximum speed of 0.40 knots tothe south-south-west and at spring tide, 0.10 knots to the north-north-east.
One explanation that no such bi-exponential function has been observedin earlier studies could be that there has been limited sediment investigationsof sites outside the Bylot Sound and that the 239,240Pu and 137Cs data fromsampling stations outside the Bylot Sound could not be compared as the nuclideswere measured in different sections of the core. As an example, on the Thule-91 expedition measurements were performed to a distance of 8.7 km from thepoint of impact [19], resulting in one fast decreasing mono-exponential function.There were measurements further away, but the 239,240Pu/137Cs ratios could notbe determined as measurements were performed on different sections of the core.
The first investigations performed in 1968 on accidental plutonium in theBylot Sound sediments, used a somewhat different method for estimating thetotal Pu inventory. In that study it was assumed that most of the activity wasdispersed within a 30 km2 elliptical area centered around the point of impact[10]. From the mean 239,240Pu concentration in this area the total inventory wascalculated. The result from this calculation was 3 Ci (0.15 TBq). In addition,the 239,240Pu concentration was based on the uppermost centimeter (0–2 cm)of the sediment. In the second reported investigation [17], the activity concen-tration was assumed to follow either a mono-exponential function or a powerfunction of distance, i.e. A(r, θ) = A0 · r−k. These functions were integrated
13

out to a radius of 45 km. The calculated inventory from these two integratedfunctions were 29 and 32 Ci (1.4 and 1.5 TBq) respectively.
Eriksson et al. (1999) [15] reported an inventory of 1.7 TBq. This estimatewas based on some of the Thule-97 data. However, there were fewer samplingstations included and the electroplated Pu disks with an activity higher than0.8 Bq had not yet been analyzed in the high resolution alpha spectrometricdevice. Also, the upper integration limit, rlimit, was less than the limit used inthe present study as the global fallout ratio used was higher. The inventory cal-culation was based on a exponential function (A(r, θ) = 20.813 · 109 · e−0.2296·r),which will be shown later in this article to give an under estimation of the totalinventory.
As mentioned before, in the present investigation three different functionshave been fitted to the 239,240Pu concentration data. Firstly a bi-exponentialfunction, which is assumed to be the most correct, where the 239,240Pu concen-tration at different distances is given by:
A(r, θ) = 25.945 · 109 · e−0.2303·r + 0.616 · 109 · e−0.0489·r
Secondly a single exponential function, to be able to compare the total in-ventory with earlier estimates, where the 239,240Pu concentration is given by:
A(r, θ) = 14.035 · 109 · e−0.109·r
In addition, one discreet function that assumes that the concentration varieslinearly between two neighbouring (referring to the distance from the point ofimpact) sampling stations as:
A(r, θ) =15∑
i=1
Ai + kiri
The values of Ai, ki and ri can be seen in Table 1. The reason for includingsuch a function is that the local inventories at the sampling stations close tothe point of impact, r < 5 km, do not follow an exponential nor a perfectbiexponential curve. This is because of the heterogenous activity concentrationsthe data shows. Therefore, in this inner area, the activity concentration can beexplained just as well by a linear variation between sampling stations.
The upper integration limit, rlimit, was determined from the slowly decreas-ing component (...0.616 · 109 · e−0.0489·r) from the bi-exponential function de-scribing the 239,240Pu concentration and the function describing the 137Cs con-centration. Using the global fallout ratio of 0.18 results in that rlimit equals to99.3 km, i.e. the dispersion rate may be estimated to 3.4 km y−1 (99.3 km/29y).
The inventory derived by the alpha measurements can be seen in Table 2and the inventory integrated to different distances from the point of impact canbe seen in Table 5. The three different integrated functions turn out to about3.9 TBq. This is considerably higher than the inventory reported earlier. Thisis because the sampling stations Loc 1412 and Ny–3 are included in the calcula-tions, as they have excess plutonium originating from the accident, resulting inthat the fitted functions decrease much more slowly. Another explanation of thishigher estimate is that a high resolution alpha spectrometry was used, so thatre-sampling was not needed. It can be seen in the table that the older estimatesof about 1.5 TBq are obtained somewhere between 6.4–7.5 km from the point ofimpact. The 3.9 TBq estimate could be considered an underestimate for threereasons. Firstly, the radiochemical technique used is insufficient to completelydissolve the Pu-oxide matrices, resulting in that hot particles to a great extent
14

Tab
le1:
The
coeffi
cien
tsA
ian
dk i
valid
indi
ffere
ntin
terv
als
r ii
12
34
56
78
r i[k
m]
0–0.
580.
58–0
.94
0.94
–1.0
71.
07–1
.36
1.36
–2.2
12.
21–2
.33
2.33
–2.8
92.
89–4
.01
Ai[B
q]5.
88E
+07
2.46
E+
074.
90E
+07
1.28
E+
071.
13E
+07
3.52
E+
062.
33E
+07
7.35
E+
06k i
[Bq/
km
]-5
.91E
+07
6.79
E+
07-2
.78E
+08
-5.2
0E+
06-9
.19E
+06
1.65
E+
08-2
.85E
+07
2.59
E+
06i
910
1112
1314
1516
r i[k
m]
4.01
–4.7
14.
71–6
.40
6.4–
8.6
8.6–
16.3
16.3
–17
17–5
6.4
56.4
–66.
666
.6–9
9.3
Ai[B
q]1.
03E
+07
1.43
E+
071.
14E
+07
2.58
E+
062.
23E
+05
1.10
E+
062.
11E
+04
9.78
E+
03k i
[Bq/
km
]5.
80E
+06
-1.7
1E+
06-4
.02E
+06
-3.0
6E+
051.
25E
+06
-2.7
4E+
04-1
.11E
+03
-2.9
9E+
02
15

are excluded. Secondly, as can be seen in Dahlgaard et al. [6] Figure 4 of Pudepth profiles, that the sediment sampled at stations V2, X2, H’ and Hnø donot reach zero activity by the deepest sediment section. In fact these profilesshow a constant concentration all throughout the sampled sediment core, i.e.the inventory is underestimated. The third reason is that only one aliquot wasused and that this single 1 g aliquot cannot be considered as a representativesub-sample in these activity heterogenous sediments.
3.3 A new calculation of the total plutonium inventory inthe Bylot Sound, based on γ-spectrometry.
To be able to compare the γ-screening experiment with earlier estimates andto confirm that hot particles play an important role for the total inventory, twocalculations were performed. The first was when all the data obtained wereincluded, and secondly, the sub-samples with an activity concentration over 1.8Bq/sample (which was the highest activity measurable by the alpha spectro-metric measurements) were set to this value, i.e. exclusion of hot particles. Bydoing this, the inventory result would be in the same order as the data obtainedfrom the alpha spectrometric measurements.
In Figure 6 the results from the 10 000 calculations of the local inventoryfrom each of the selected 6 sites can be seen.
One would expect to see a log-normal type distribution as several sub-samples were measured which would be expected to include most of the particlesizes. However, as can be seen for the inventory distributions for location V2(the point of impact) and location P (4.01 km from the point of impact), theinventory distribution is very dependent on the hot particle. Location V2 hasseveral hot particles, 9 of the 70 sub-samples measured have an activity over 1Bq, but the calculated inventory distribution is dominated by two of these hotparticles. One particle is of 50 Bq in slice 10–11 cm and the other is of 153 Bqin slice 4–5 cm depth. In Figure 6 where the inventory distribution at locationV2 can be seen, the first peak in the histogram is the distribution when neitherof these large hot particles is included in the calculation and the second peak iswhen the 50 Bq particle is included but not the 153 Bq particle. The third iswhen the 153 Bq particle is included but not the 50 Bq particle, and the fourthpeak is the distribution with both particles included. The probability that oneof the particles is included is 1/5, as there are 5 sub-samples in each sedimentslice, and the probability of including both is 1/25. The inventory distributionat location P is somewhat more difficult to explain. There are 4 particles thatdominate the inventory distribution. Three of these are located in the sedimentslice 5–6 cm (1.61, 1.62 and 2.79 Bq respectively) and there is one hot particlein the slice 10–11 cm of 2.37 Bq. The first peak is for combinations excludingall of these particles. The second peak is when one of the two particles withactivities of 1.61 and 1.62 Bq is included. The third peak is when one of thehigher activity particles (2.79 and 2.37 Bq) is included. As three of the particlesare in the same sediment slice none of these can be combined and summarizedin the inventory calculations but all of them can be combined with the hotparticle in slice 10–11 cm and the fourth and fifth peak are representing thesecombinations, i.e. the forth peak is if either of the 1.61 and 1.62 Bq particlesare combined with the 2.37 Bq particle and the fifth peak is the combination ofthe 2.79 and 2.37 Bq particles.
16

Tab
le2:
Inve
ntor
yof
239,2
40P
ude
term
ined
byal
pha
spec
tros
copy
.Loc
atio
nTot
alE
xces
sIn
tegr
ated
137C
sLoc
atio
nD
ista
nce
Wat
erde
pth
Pu
Pu
Exc
ess
Pu
Lat
itud
efr
omim
pact
[Bq/
m2]
[Bq/
m2]
[%]
[Bq/
m2]
Lon
gitu
de[k
m]
[m]
V2
5893
858
834
-57
576
31.
366’
N69
17.
035’
W0
185
X2
2473
824
560
0.9
768
76 3
1.50
5’N
69 1
5.84
1’W
0.58
181
Y49
072
4902
02.
628
976
30.
997’
N69
18.
518’
W0.
9421
6
2012
973
1284
13.
273
576
30.
789’
N69
17.
121’
W1.
0723
3
H’
1141
911
332
3.9
482
76 3
1.96
2’N
69 1
5.17
6’W
1.36
183
2235
9135
185.
640
676
30.
137’
N69
16.
167’
W2.
2119
6
2523
445
2329
46.
283
976
30.
424’
N69
13.
876’
W2.
3323
7
s474
8173
549.
770
576
30.
117’
N69
13.
068’
W2.
8924
1
P10
321
1025
315
378
76 2
9.86
9’N
69 2
5.86
4’W
4.01
211
2314
397
1431
221
470
76 3
1.76
1’N
69 0
7.76
0’W
4.71
207
Hnø
1154
811
414
4074
776
34.
688’
N69
12.
855’
W6.
4019
9
G26
5425
7948
415
76 3
5.03
2’N
69 0
5.01
4’W
8.60
195
D27
722
355
302
76 3
9.11
5’N
68 5
9.65
2’W
16.3
89
C11
3810
9956
215
76 3
9.99
3’N
69 3
0.17
9’W
1712
0
1412
4021
.198
105
76 1
0.48
8’N
70 5
0.68
7’W
56.4
640
Ny-
324
9.78
9979
76 3
9.48
5’N
71 4
7.95
5’W
66.6
505
17
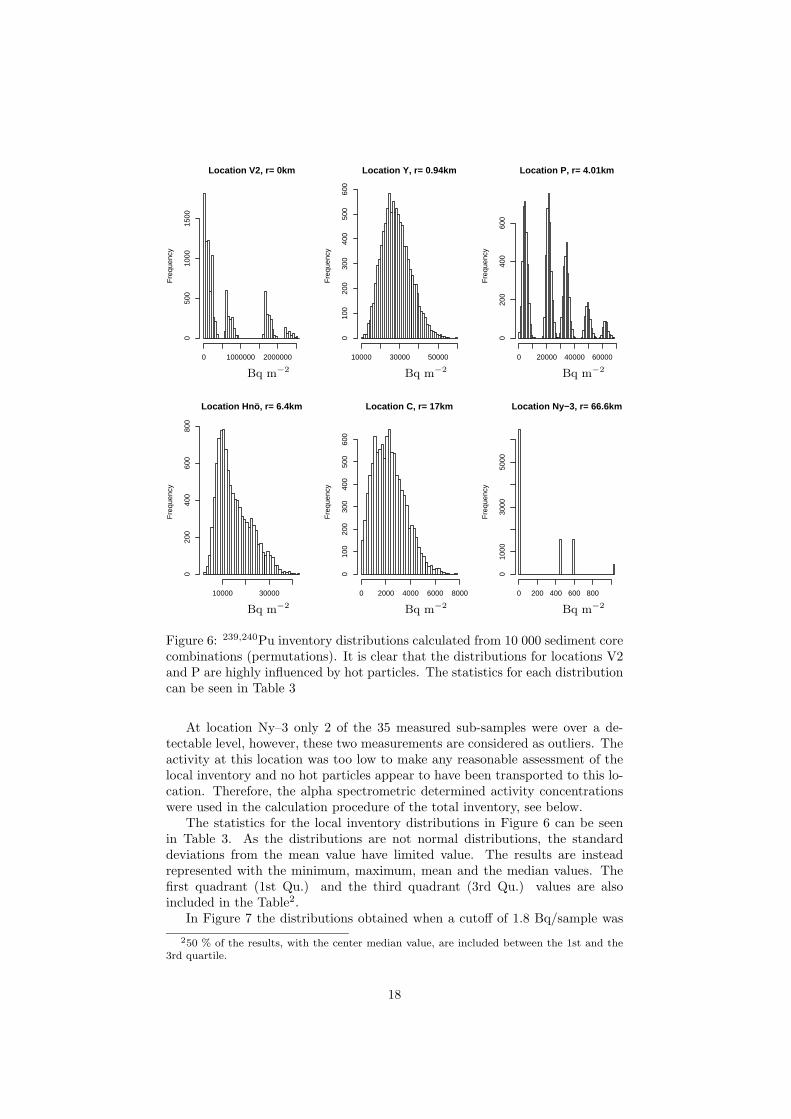
Location V2, r= 0kmF
requ
ency
0 1000000 2000000
050
010
0015
00
Location Y, r= 0.94km
Fre
quen
cy
10000 30000 50000
010
020
030
040
050
060
0
Location P, r= 4.01km
Fre
quen
cy
0 20000 40000 60000
020
040
060
0
Location Hnö, r= 6.4km
Fre
quen
cy
10000 30000
020
040
060
080
0
Location C, r= 17km
Fre
quen
cy
0 2000 4000 6000 8000
010
020
030
040
050
060
0
Location Ny−3, r= 66.6km
Fre
quen
cy
0 200 400 600 800
010
0030
0050
00
Bq m−2Bq m−2Bq m−2
Bq m−2Bq m−2Bq m−2
Figure 6: 239,240Pu inventory distributions calculated from 10 000 sediment corecombinations (permutations). It is clear that the distributions for locations V2and P are highly influenced by hot particles. The statistics for each distributioncan be seen in Table 3
At location Ny–3 only 2 of the 35 measured sub-samples were over a de-tectable level, however, these two measurements are considered as outliers. Theactivity at this location was too low to make any reasonable assessment of thelocal inventory and no hot particles appear to have been transported to this lo-cation. Therefore, the alpha spectrometric determined activity concentrationswere used in the calculation procedure of the total inventory, see below.
The statistics for the local inventory distributions in Figure 6 can be seenin Table 3. As the distributions are not normal distributions, the standarddeviations from the mean value have limited value. The results are insteadrepresented with the minimum, maximum, mean and the median values. Thefirst quadrant (1st Qu.) and the third quadrant (3rd Qu.) values are alsoincluded in the Table2.
In Figure 7 the distributions obtained when a cutoff of 1.8 Bq/sample was250 % of the results, with the center median value, are included between the 1st and the
3rd quartile.
18

Location V2, r= 0 kmF
requ
ency
20000 60000 100000
010
020
030
040
050
0
Location Y, r= 0.94 km
Fre
quen
cy
10000 30000 50000
010
020
030
040
050
0
Location P, r= 4.01 km
Fre
quen
cy
0 10000 30000
020
040
060
080
010
00
Location Hnö, r= 6.4 km
Fre
quen
cy
0 10000 30000
020
040
060
080
0
Location C, r= 17 km
Fre
quen
cy
0 2000 4000 6000
010
020
030
040
050
060
0
Location Ny−3, r= 66.6 km
Fre
quen
cy
0 200 400 600 800
010
0020
0030
0040
0050
0060
00
Bq m−2Bq m−2Bq m−2
Bq m−2Bq m−2Bq m−2
Figure 7: 239,240Pu inventory distributions calculated as in Figure 6, but witha cutoff of 1.8 Bq/sample. The vertical lines indicate the inventory determinedby alpha spectrometry. The statistics for each distribution can be seen in Table4
applied. The vertical line in each distribution is the local inventory obtainedfrom the alpha spectrometric measurements. The gamma screening results,when the cutoff is applied, is in accordance with the alpha spectrometric results,which support the hypotheses that the earlier estimates of local inventory haveunderestimated the amount of plutonium. It is also clear that the hot particlesplay an important role at the locations close to the point of impact. For thatreason, when determinations of Pu inventory are to be done closed to the point ofimpact, the gamma screening technique should be used instead of the commonlyused alpha spectrometric technique, whereas at locations Hnø and C eithermethod of estimating the inventory can be used. At location Ny–3 the gammascreening technique of the sediment core is of no use and alpha spectrometricmethods must be used to derive the activity concentrations.
A synthesis of the calculated total accidental inventories of 239,240Pu is givenin Figure 8. The different Pu inventory distributions are derived from 10 000integrations of the 10 000 fitted curves for each of the different fitted functions.
19

Table 3: 239,240Pu inventories [Bq m−2] statistic summary of the distributionsfrom Figure 6.
Min 1st Qu. Median Mean 3rd Qu. Max.Location
V2 15270 68930 212200 561100 722800 2561000Y 10090 22920 27640 28250 32980 59940P 356.1 5942 21820 23040 33860 68870
Hnø 2247 9456 13120 14940 19520 42600C 0 1277 2167 2290 3110 7630
Ny-3 0 0 0 205.5 446.4 1028
Table 4: 239,240Pu inventories [Bq m−2] statistic summary of the distributionsfrom the Figure 7, when a cutoff of 1.8 Bq is applyed. The figures are in Bqm−2.
Min 1st Qu. Median Mean 3rd Qu. Max.Location
V2 17420.0 49860 61010 62170.0 73170.0 125500Y 11190.0 22960 27240 28010.0 32360.0 53450P 356.1 5490 20670 17940.0 23130.0 45940
Hnø 2826.0 9466 13000 14780.0 19220.0 39370C 0.0 1292 2179 2313.0 3152.0 7593
Ny-3 0.0 0 0 202.9 446.4 1028
The histograms A (bi-exponential fit), B (exponential fit) and C (discrete func-tion fit) are the real distributions when the data do not have any cutoff limitand D, E and F are the corresponding inventory distributions obtained whena cutoff of 1.8 Bq/sample is applied. In Tables 6 and 7 the statistics for eachdistribution can be seen. The tables also represent inventories out to differentradiuses from the point of impact. The total estimated inventory statistics canbe seen in the column with the header 0–99.6 km in each table. The medianvalues for the total inventory is 9.5 TBq (1st Qu. = 6.7 TBq and 3rd Qu. =13.2 TBq) for the bi-exponential fitted functions and 8.7 TBq (1st Qu. = 6.9TBq and 3rd Qu. = 11.2 TBq) for the exponential fitted functions. In Table6 it can be seen that the exponential fitted integration gives the lower valueclose to the point of impact and that the bi-exponential and the linear fittedintegrations give equal amount of plutonium. The linear fitted integration prob-ably overestimates the amount of plutonium at distances over 17 km as no realphysical explanation for such dispersion can be given.
One criticism of these inventory estimations could be that only 6 sites are in-cluded. When a cutoff of 1.8 Bq/sample has been applied, the inventory agreeswell with the data obtained from the alpha spectrometric measurements. How-ever, the total inventory for the alpha spectrometric measurements is about 1.7times higher when only the 6 sampling sites used in the gamma screening ex-periment are considered in the integration (”Exp-fit,6p” in Table 5), comparedto if all sites are included (”Exp-fit” in Table 5). For that reason the total in-ventory calculated from the gamma screening experiment may be overestimatedby a factor of 1.7. However, 2 of the 6 sites (V2 and Hnø) have underestimated
20
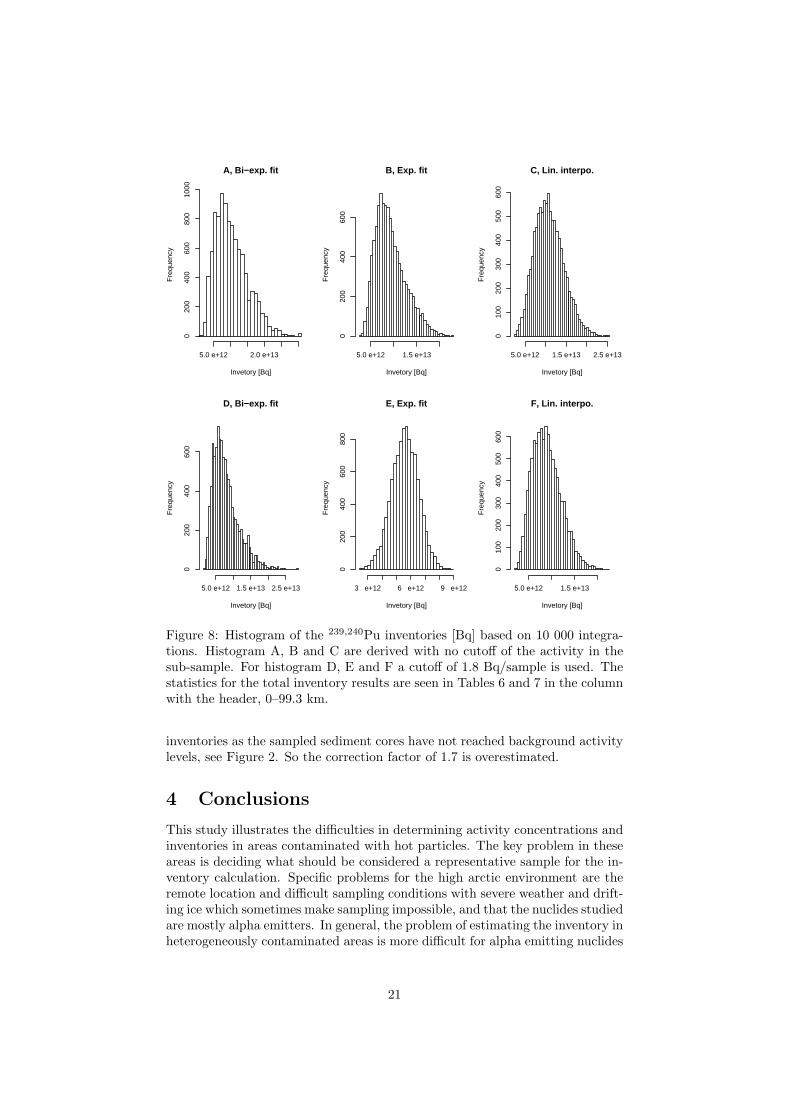
A, Bi−exp. fit
Invetory [Bq]
Fre
quen
cy
5.0 e+12 2.0 e+13
020
040
060
080
010
00
B, Exp. fit
Invetory [Bq]
Fre
quen
cy
5.0 e+12 1.5 e+13
020
040
060
0
C, Lin. interpo.
Invetory [Bq]
Fre
quen
cy
5.0 e+12 1.5 e+13 2.5 e+13
010
020
030
040
050
060
0
D, Bi−exp. fit
Invetory [Bq]
Fre
quen
cy
5.0 e+12 1.5 e+13 2.5 e+13
020
040
060
0
E, Exp. fit
Invetory [Bq]
Fre
quen
cy
3 e+12 6 e+12 9 e+12
020
040
060
080
0
F, Lin. interpo.
Invetory [Bq]
Fre
quen
cy
5.0 e+12 1.5 e+13
010
020
030
040
050
060
0
Figure 8: Histogram of the 239,240Pu inventories [Bq] based on 10 000 integra-tions. Histogram A, B and C are derived with no cutoff of the activity in thesub-sample. For histogram D, E and F a cutoff of 1.8 Bq/sample is used. Thestatistics for the total inventory results are seen in Tables 6 and 7 in the columnwith the header, 0–99.3 km.
inventories as the sampled sediment cores have not reached background activitylevels, see Figure 2. So the correction factor of 1.7 is overestimated.
4 Conclusions
This study illustrates the difficulties in determining activity concentrations andinventories in areas contaminated with hot particles. The key problem in theseareas is deciding what should be considered a representative sample for the in-ventory calculation. Specific problems for the high arctic environment are theremote location and difficult sampling conditions with severe weather and drift-ing ice which sometimes make sampling impossible, and that the nuclides studiedare mostly alpha emitters. In general, the problem of estimating the inventory inheterogeneously contaminated areas is more difficult for alpha emitting nuclides
21

Tab
le5:
239,2
40P
uin
vent
ory
[Bq]
calc
ulat
edfr
omal
pha
mea
sure
men
tsat
diffe
rent
dist
ance
sde
rive
dby
thre
edi
ffere
ntfit
met
hods
.E
xp-fi
t,6p
isth
eIn
tegr
ated
func
tion
A(r
,θ)
=28
.028
·109
·e−
0.1
243·r
From
Alp
ha0–
0.94
km0–
4.01
km0–
6.4
km0–
7.5
km0–
17km
0–66
.6km
0–99
.3km
Bie
xp-fi
t8.
966e
+10
7.02
3e+
111.
365e
+12
1.69
7e+
122.
748e
+12
3.84
8e+
123.
856e
+12
Exp-fi
t4.
030e
+10
5.77
2e+
111.
227e
+12
1.55
3e+
122.
583e
+12
3.65
3e+
123.
661e
+12
Lin
ear-
fit
1.02
9e+
115.
994e
+11
1.59
0e+
122.
030e
+12
2.46
3e+
124.
172e
+12
4.20
3e+
12
Exp-fi
t,6p
7.20
0e+
101.
023e
+12
2.16
1e+
122.
728e
+12
4.48
1e+
126.
185e
+12
6.19
6e+
12
Tab
le6:
239,2
40P
uin
vent
ory
[Bq]
stat
isti
csat
diffe
rent
dist
ance
sde
rive
dby
thre
edi
ffere
ntfit
met
hods
wit
hout
cut
ofof
the
acti
vity
leve
l.0–
0.94
km0–
4.01
km0–
6.4
km0–
7.5
km0–
17km
0–66
.6km
0–99
.3km
Bie
xp-fi
tM
in.
3.67
7e+
103.
669e
+11
6.51
0e+
118.
024e
+11
1.34
6e+
121.
846e
+12
1.84
7e+
121s
tQ
u.1.
243e
+11
6.77
5e+
111.
220e
+12
1.50
4e+
122.
716e
+12
6.38
5e+
126.
729e
+12
Med
ian
1.83
7e+
118.
225e
+11
1.48
9e+
121.
834e
+12
3.38
5e+
128.
689e
+12
9.55
3e+
12M
ean
2.52
2e+
118.
965e
+11
1.65
8e+
122.
066e
+12
3.72
7e+
129.
273e
+12
1.03
1e+
133r
dQ
u.3.
428e
+11
1.02
9e+
121.
859e
+12
2.35
6e+
124.
511e
+12
1.16
1e+
131.
318e
+13
Max
.7.
789e
+11
2.08
4e+
123.
996e
+12
5.01
5e+
129.
570e
+12
2.61
2e+
133.
051e
+13
Exp-fi
tM
in.
2.60
1e+
103.
774e
+11
8.09
7e+
111.
029e
+12
1.74
5e+
122.
572e
+12
2.58
0e+
121s
tQ
u.8.
042e
+10
1.14
2e+
122.
412e
+12
3.04
2e+
124.
998e
+12
6.90
4e+
126.
914e
+12
Med
ian
1.08
9e+
111.
529e
+12
3.20
5e+
124.
031e
+12
6.50
5e+
128.
731e
+12
8.74
1e+
12M
ean
1.19
9e+
111.
673e
+12
3.49
2e+
124.
384e
+12
7.02
8e+
129.
312e
+12
9.32
3e+
123r
dQ
u.1.
496e
+11
2.07
8e+
124.
318e
+12
5.41
1e+
128.
594e
+12
1.12
2e+
131.
123e
+13
Max
.3.
441e
+11
4.67
1e+
129.
550e
+12
1.18
8e+
131.
831e
+13
2.27
4e+
132.
275e
+13
Lin
ear-
fit
Min
.4.
283e
+10
4.13
4e+
118.
034e
+11
1.04
1e+
121.
791e
+12
2.51
4e+
122.
545e
+12
1st
Qu.
1.19
8e+
111.
176e
+12
2.30
2e+
122.
911e
+12
4.59
9e+
128.
261e
+12
8.29
2e+
12M
edia
n2.
436e
+11
1.59
8e+
123.
137e
+12
3.79
2e+
125.
864e
+12
1.05
6e+
131.
059e
+13
Mea
n5.
715e
+11
1.77
0e+
123.
231e
+12
3.91
6e+
126.
030e
+12
1.08
5e+
131.
088e
+13
3rd
Qu.
7.25
1e+
112.
268e
+12
4.05
3e+
124.
821e
+12
7.25
3e+
121.
310e
+13
1.31
3e+
13M
ax.
2.41
0e+
124.
788e
+12
7.97
6e+
129.
149e
+12
1.34
8e+
132.
540e
+13
2.54
3e+
13
22

Tab
le7:
239,2
40P
uin
vent
ory
[Bq]
atdi
ffere
ntdi
stan
ces
deri
ved
byth
ree
diffe
rent
fitm
etho
dsw
ith
acu
toff
of1.
8B
q/sa
mpl
e.0–
0.94
km0–
4.01
km0–
6.4
km0–
7.5
km0–
17km
0–66
.6km
0–99
.3km
Bie
xp-fi
tM
in.
3.95
8e+
103.
314e
+11
6.28
8e+
118.
034e
+11
1.33
1e+
121.
650e
+12
1.65
0e+
121s
tQ
u.7.
363e
+10
6.70
2e+
111.
298e
+12
1.62
2e+
122.
794e
+12
5.13
0e+
125.
253e
+12
Med
ian
8.25
4e+
107.
728e
+11
1.52
4e+
121.
906e
+12
3.31
4e+
126.
762e
+12
7.12
6e+
12M
ean
8.28
1e+
107.
792e
+11
1.53
0e+
121.
914e
+12
3.35
5e+
127.
278e
+12
7.92
4e+
123r
dQ
u.9.
158e
+10
8.78
0e+
111.
738e
+12
2.17
7e+
123.
846e
+12
8.95
6e+
129.
710e
+12
Max
.1.
585e
+11
1.51
1e+
123.
096e
+12
3.87
6e+
126.
208e
+12
2.15
6e+
132.
825e
+13
Exp-fi
tM
in.
2.28
7e+
103.
355e
+11
7.25
7e+
119.
256e
+11
1.59
2e+
122.
421e
+12
2.43
2e+
121s
tQ
u.5.
287e
+10
7.61
6e+
111.
625e
+12
2.05
9e+
123.
448e
+12
4.94
9e+
124.
961e
+12
Med
ian
6.08
0e+
108.
724e
+11
1.85
5e+
122.
350e
+12
3.92
6e+
125.
592e
+12
5.60
5e+
12M
ean
6.08
1e+
108.
725e
+11
1.85
7e+
122.
352e
+12
3.92
1e+
125.
579e
+12
5.59
2e+
123r
dQ
u.6.
873e
+10
9.83
9e+
112.
091e
+12
2.64
6e+
124.
402e
+12
6.22
6e+
126.
239e
+12
Max
.1.
044e
+11
1.47
9e+
123.
119e
+12
3.93
5e+
126.
439e
+12
8.82
8e+
128.
842e
+12
Lin
ear-
fit
Min
.4.
553e
+10
3.52
8e+
116.
791e
+11
9.76
1e+
111.
725e
+12
2.31
8e+
122.
349e
+12
1st
Qu.
7.83
6e+
107.
335e
+11
1.46
7e+
121.
938e
+12
3.41
3e+
126.
566e
+12
6.59
8e+
12M
edia
n8.
662e
+10
8.49
3e+
111.
706e
+12
2.24
8e+
123.
980e
+12
8.61
4e+
128.
645e
+12
Mea
n8.
701e
+10
8.57
5e+
111.
719e
+12
2.27
0e+
124.
049e
+12
8.91
3e+
128.
944e
+12
3rd
Qu.
9.53
5e+
109.
744e
+11
1.95
3e+
122.
575e
+12
4.61
9e+
121.
091e
+13
1.09
4e+
13M
ax.
1.34
7e+
111.
595e
+12
3.17
5e+
124.
120e
+12
7.40
1e+
122.
205e
+13
2.20
8e+
13
23
than for other types of radiation. Another problem is that, in close vicinity tothe point of impact, the activity distribution of the hot particles, which play animportant role for the inventory, is unknown.
This study shows that earlier estimates have underestimated the total in-ventory in sediments in the Bylot Sound. The main reason for this is that theexponential curve fitted has been based on too few data points far away fromthe point of impact, resulting in that the slow component has not been consid-ered. Earlier studies have also underestimated the importance of hot particlesand treated the samples as if the activity distribution was homogeneous.
A general conclusion is that it is very important to know the amount andcomposition of hot particles in the sediment, i.e. number of particles, particlesize distribution and chemical composition, in order to perform an adequate in-ventory estimation. Having a true log-normal activity distribution, by samplingfrom this distribution the calculated mean, used for such area, is most likelyunderestimated compared with the true mean, as the probability to sample thevery few large hot particles is very low.
This study therefore concludes that the inventory is within the range of 5–15 TBq, probably close to 10 TBq, i.e. about 3.8 kg 239,240Pu. This is close tothe earlier estimated missed amount of 3 kg [1, 11]. Furthermore, in upcominginvestigations in the Bylot Sound sediments, the activity determination shouldbe based on a gamma screening technique out to a distance of 17 km from thepoint of impact and, at distances over 17 km, alpha spectroscopy should beused.
References
[1] USAF Nuclear Safety, (1970), Project Crested Ice, AFRP 122–1Jan/Feb/Mar 1970, No.1 65
[2] Keller, C. (1971), Book: The chemistry of the transuranic elements, VerlagChemie GmbH, Weinheim/Bergstr., Germany, 380–392.
[3] Eriksson, M., (2002), On weapons plutonium in the arctic environment,Risø-R-1321(EN).
[4] Talvitie, N. A., (1971), Radiochemical determination of plutonium in envi-ronmental and biological samples by ion exchange, Analytical chemistry, 43,13, 1827
[5] J. N. Smith, K.M. Ellis, A. Aarkrog, H. Dahlgaard and E. Holm, (1994), J.Emviron. Radioactivity, 25, 135–159
[6] Dahlgaard, H., Eriksson, M., Ilus, E., Ryan, T., McMahon, C.A., andNielsen, S.P., (2001), Plutonium in the marine environment at Thule, NW-Greenland after a nuclear weapons accident,In book: Plutonium in the en-vironment, Ed Kudo, A., Elsevier science, Oxford, UK, 15–30
[7] K. Bunzl, (1997), Probability for Detecting Hot Particles in EnvironmentalSamples by Sample Splitting, The Analyst, (007), 653–656
24
[8] Kashparov, V. A., Yoshchenko, V. I., Levchuk, S. E., Tschiersch, J., andWagenpfeil, F., (2000), Journal of Radioanalytical and Nuclear Chemistry246, 165–172
[9] G. Nageldinger, A. Flowers, B. Henry and J. Postak, (1998), Hot particle de-tection using uncertainties in activity measurements of soil , Health Physics,74, 4, 472–477
[10] Aarkrog, A. (1971). Radioecological investigations of plutonium in an arc-tic marine environment. Health Phys., 20, 31–47.
[11] Strand, P., Balonov, M., Aarkrog, A. Bewers, M.J., Howard, B., Salo,A., Tsaturov, Y.S., (1998), AMAP Assessment Report: Arctic Pollution Is-sues Radioactivity, Arctic Monitoring and Assessment Programme (AMAP),Oslo, Norway, 542–578
[12] Ihaka, R., Gentleman, R., (1996), R: A Language for Data Analysis andGraphics, Journal of Computational and Graphical Statistics, 5, 3, 299–314
[13] McMahon, C.A. Vintr, L.L. Mitchell, P.I. Dahlgaard, H., (2000),Oxidation-state distribution of plutonium in surface and subsurface watersat Thule, northwest Greenland. Appl. Radiat. Isot. 52, 697-703
[14] Ryan, T.P. Dahlgaard, H. Dowdall, A.M. Pollard, D. Ilus, E. Eriksson, M.Cunningham, J.D. The uptake of plutonium by some marine invertebratesin a contaminated zone of Bylot Sound, Thule, northern Greenland. In: Ex-tended abstracts. 4. International conference on environmental radioactivityin the Arctic, Edinburgh (GB), 20-23 Sep 1999. Strand, P.; Jlle, T. (eds.),(Norwegian Radiation Protection Authority, sters, 1999) p. 74-76
[15] Eriksson, M.; Dahlgaard, H.; Ilus, E.; Ryan, T.; Chen, Q.J.; Holm, E.;Nielsen, S.P., Plutonium in the marine environment of Thule Air Base, N.W.Greenland. Inventories and distribution in sediments 29 years after the acci-dent. In: Extended abstracts. 4. International conference on environmentalradioactivity in the Arctic, Edinburgh (GB), 20-23 Sep 1999. Strand, P.;Jlle, T. (eds.), (Norwegian Radiation Protection Authority, sters, 1999) p.60-62
[16] Holm, E. (1984), Review of alpha-particle spectrometric measurements ofactinides, Int. J. Appl. Rad. Isot., 35 285–290
[17] Aarkrog, A. (1977), Environmental behaviour of plutonium accidentallyreleased at Thule, Greenland., Health Phys. 32, 271–284.
[18] Aarkrog, A. Dahlgaard, H. & Nilsson, K., (1984), Further Studies of Plu-tonium and Americium at Thule, Greenland., Health Phys., 46, 29–44.
[19] Risø–R–757(EN), (1997), Environmental radioactivity in the North At-lantic Regions including the Faroe Islands and Greenland, 1992 and 1993.,Risø National Laboratory, Roskilde, Denmark
[20] EML-(Environmental-Measurement-Laboratory) open data base SASPhttp://www.eml.doe.gov/Databases/SASP (1998)
25

Paper IVEriksson M., Ljunggren K. and Hindorf C.:Plutonium hot particle separation techniques using real-time digital image systemsNuclear Instruments and Methods in Physics Research, A, in press (6 pp), 2002.
Risø–R–1321(EN) 113


UNCORRECTED PROOF
Nuclear Instruments and Methods in Physics Research A ] (]]]]) ]]]–]]]
Plutonium hot particle separation techniques using real-timedigital image systems
M. Erikssona,b,*, K. Ljunggrena, C. Hindorfa
a Department of Radiation Physics, University Hospital, SE-221 85 Lund, Swedenb Ris National Laboratory, P.O. Box 49, DK-400 Roskilde, Denmark
Received 2 November 2001; received in revised form 3 January 2002; accepted 11 January 2002
Abstract
Two real-time digital imaging systems, able to replace conventional autoradiography for radioactive hot particle
separation and identification, are presented in this paper.
The hot plutonium particles used for the study originate from the Thule nuclear weapon accident. Both of the real-
time imaging techniques are initiated with sample splitting and measurements with a HPGe detector, in order to detect
the gamma-emitting 241Pu daughter 241Am; which is an indicator of plutonium hot particle in the sample. The time
required for the whole process of separation and identification of one single particle from a bulk sediment sample (150 g
dry weight) is of the order of 1–2 days, and is highly dependent on its activity.
The real-time digital imaging systems presented in this paper are preferable, compared to conventional
autoradiography and the CR-39 technique, when separation and identification of hot particles are needed as they
are much faster and in addition give a real-time image of the particle. r 2002 Published by Elsevier Science B.V.
PACS: 27.90.+b; 42.79.Pw; 28.41.T
Keywords: Hot particle; Thule accident; Real-time digital image system; Separation technique; Plutonium; Sediment
1. Introduction
Interest in detection of radioactive particles hasincreased during recent years. Thus, the IAEA hasstarted a co-ordinated research project on radio-active particles, ‘‘Radiochemical, Chemical andPhysical Characterization of Radioactive Particlesin the Environment’’. This project is focused onradioactive particles released to the environment
and part of the project is concerned with methodsof localizing and separating these particles.
The study of these particles deals mainly withthe physical–chemical form and solvability of theparticles. The separation techniques most com-monly used to date have been film autoradiogra-phy [1–3] and the so-called CR-39 detector [4–9]based on etching radioactive induced weakenedareas away from a plastic sheet. These twomethods are time consuming (exposure time upto 30 days) and both require analysis/visualizationin a microscope. These two detectors are sensitive
ARTICLE IN PRESS
1
3
5
7
9
11
13
15
17
19
21
23
25
27
29
31
33
35
37
39
41
43
45
47
49
51
53
55
57
59
61
3B2v7:51cGML4:3:1 NIMA : 41497 Prod:Type:COM
pp:126ðcol:fig::NILÞED:VijayaT
PAGN: manju SCAN: VIJAYALAKSHMI:S
*Corresponding author. Riso National Laboratory, P.O. Box
49, DK-400 Roskilde, Denmark. Tel.: +46-46-173-146; fax:
+46-46-127-249.
E-mail address: [email protected] (M. Eriksson).
0168-9002/02/$ - see front matter r 2002 Published by Elsevier Science B.V.
PII: S 0 1 6 8 - 9 0 0 2 ( 0 2 ) 0 0 4 3 8 - 2

UNCORRECTED PROOF
to ionizing radiation and, in addition, the film issensitive to light.
In this paper two real-time digital imagingsystems have been used to detect hot particlesfrom sediment samples originating from the Thuleaccident. The accident and the area are describedin detail elsewhere [3,10,11]. These two detectorsystems are mainly used in nuclear medicine tostudy the uptake of beta- and Auger-electron-radiating nuclides in tissues [12].
2. Materials and methods
Sediment samples from the Thule accident area(Bylot Sound), NW Greenland, were used in thisstudy. The sediment samples were taken with aFinnish Gemini Twin Corer delivering two parallel8 cm diameter cores. An earlier version of theGemini Twin Corer, the Niemist .o Corer, has beendescribed in the literature [13]. The sediment inpart of the Bylot Sound is highly contaminatedwith unfissioned plutonium from this accident. Atthe point of impact, the activity concentration of239;240Pu is about 60 kBq m2 and the contamina-tion is measurable up to 56 km from this site [10].The activity concentration in the sediment is veryheterogeneous due to the presence of hot particles.There are several reasons for the separation andstudy of hot particles. To improve the basis formodelling the long-term environmental fate ofparticulate removal and further, to improveinventory estimates, it is necessary to study thechemical composition as well as the activitydistribution and physico-chemical form of the Puparticles. To be able to study these aspects, theparticles must be identified as single particles andfor that reason a separation method is needed.
2.1. Sample splitting
The sediment cores were divided into 1 cmsections at the sampling stations and stored frozenð201CÞ onboard the research ship Adolf Jensen.At Ris National Laboratory, Denmark, thesections were freeze dried. Each section containedabout 150 g dry sediment. Measurements wereperformed using a high-purity germanium, HPGe,
detector, using the 59:54 keV ðng ¼ 35:9%Þ gam-ma-line from the daughter of 241Pu; i.e. 241Am; asan indicator of hot plutonium particles. Allsections ðN ¼ 88Þ from six different samplingstations were screened for radioactive particlecontent. If an 241Am peak appeared, the samplewas divided into two equal parts and analysedagain. This halving process continued until a fewmg were left, which is equivalent to halving thesamples about 25 times. Depending on the activityand the amount of material, the acquisition timevaried from 30 s up to a few minutes. Including thetime required to divide the samples, the wholeprocess could be performed in a maximum of 6 h(the lowest activity of the particles studied wasB1 Bq239;240Pu). The residual part of the samplecontaining the particle was then spread homo-geneous and attached on adhesive carbon tape,with a diameter of 25 mm: The carbon tape used,is of the same type as that used for sample fixing ina scanning electron microscope. A thin plastic orMylar foil was then placed over the adhesive tapeto cover the sample. These samples were analysedin the real-time digital imaging systems fordetermination of the particle position.
2.2. The IDE Bioscope
The real-time digital imaging system IDEBioscope 3250 [14] is manufactured by theIntegrated Detector & Electronics AS (IDE AS)in Norway. The detector is a 300 mm thick double-side silicon strip sensor. The strips are located onboth the p- and n-sides and have a width of 50 mm:The sensitive area is 32 32 mm2; and there are640 strips on each side. The strips on one side areplaced perpendicular to the strips on the otherside. The energy deposited by an ionizing particletravelling through the detector is proportional tothe kinetic energy of the particle (disintegratingenergy). The advantage of this is that the detectorsystem can measure the activity distribution,followed by calculation to obtain the absorbeddose rate. The signal is processed by a self-triggering read-out data chip, XA1.2 [15]. Thedetector system has 409,600 pixels and a systemresolution better than 50 mm: In Fig. 1, a sche-matic illustration of the detector can be seen.
ARTICLE IN PRESS
1
3
5
7
9
11
13
15
17
19
21
23
25
27
29
31
33
35
37
39
41
43
45
47
49
51
53
55
57
59
61
63
65
67
69
71
73
75
77
79
81
83
85
87
89
91
93
95
M. Eriksson et al. / Nuclear Instruments and Methods in Physics Research A ] (]]]]) ]]]–]]]2
NIMA : 41497
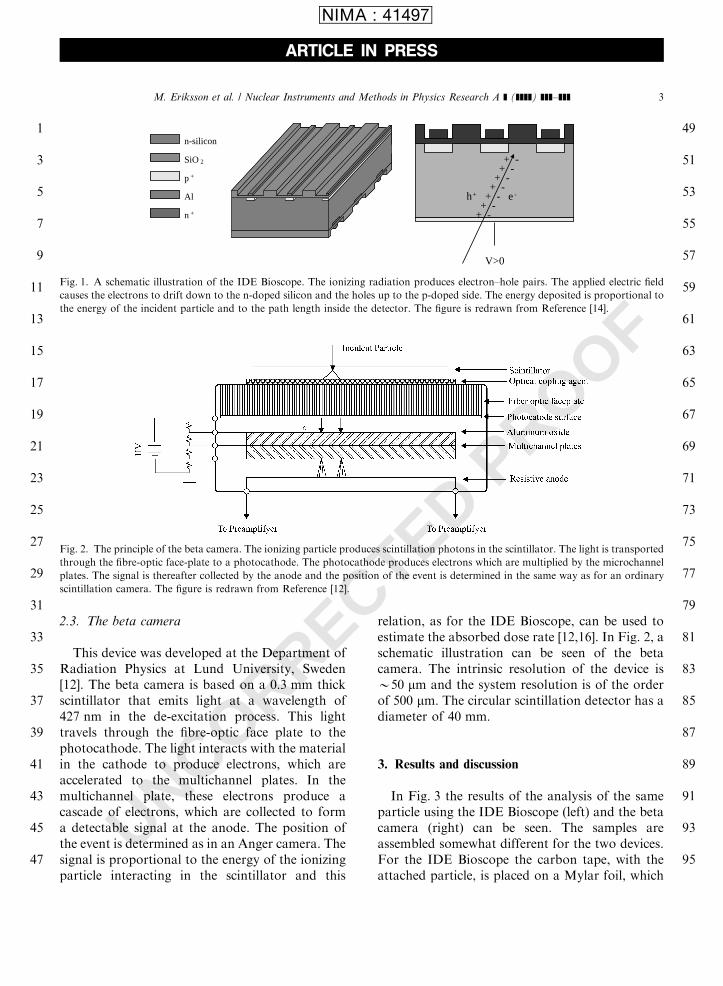
UNCORRECTED PROOF
2.3. The beta camera
This device was developed at the Department ofRadiation Physics at Lund University, Sweden[12]. The beta camera is based on a 0:3 mm thickscintillator that emits light at a wavelength of427 nm in the de-excitation process. This lighttravels through the fibre-optic face plate to thephotocathode. The light interacts with the materialin the cathode to produce electrons, which areaccelerated to the multichannel plates. In themultichannel plate, these electrons produce acascade of electrons, which are collected to forma detectable signal at the anode. The position ofthe event is determined as in an Anger camera. Thesignal is proportional to the energy of the ionizingparticle interacting in the scintillator and this
relation, as for the IDE Bioscope, can be used toestimate the absorbed dose rate [12,16]. In Fig. 2, aschematic illustration can be seen of the betacamera. The intrinsic resolution of the device isB50 mm and the system resolution is of the orderof 500 mm: The circular scintillation detector has adiameter of 40 mm:
3. Results and discussion
In Fig. 3 the results of the analysis of the sameparticle using the IDE Bioscope (left) and the betacamera (right) can be seen. The samples areassembled somewhat different for the two devices.For the IDE Bioscope the carbon tape, with theattached particle, is placed on a Mylar foil, which
ARTICLE IN PRESS
1
3
5
7
9
11
13
15
17
19
21
23
25
27
29
31
33
35
37
39
41
43
45
47
49
51
53
55
57
59
61
63
65
67
69
71
73
75
77
79
81
83
85
87
89
91
93
95
n-siliconn-silicon
n-silicon
SiO 2
p +
Al
n +
+ -
+ -+ -
+ -
+ -
+ -
+ -h+ e -
V>0
Fig. 1. A schematic illustration of the IDE Bioscope. The ionizing radiation produces electron–hole pairs. The applied electric field
causes the electrons to drift down to the n-doped silicon and the holes up to the p-doped side. The energy deposited is proportional to
the energy of the incident particle and to the path length inside the detector. The figure is redrawn from Reference [14].
Fig. 2. The principle of the beta camera. The ionizing particle produces scintillation photons in the scintillator. The light is transported
through the fibre-optic face-plate to a photocathode. The photocathode produces electrons which are multiplied by the microchannel
plates. The signal is thereafter collected by the anode and the position of the event is determined in the same way as for an ordinary
scintillation camera. The figure is redrawn from Reference [12].
M. Eriksson et al. / Nuclear Instruments and Methods in Physics Research A ] (]]]]) ]]]–]]] 3
NIMA : 41497
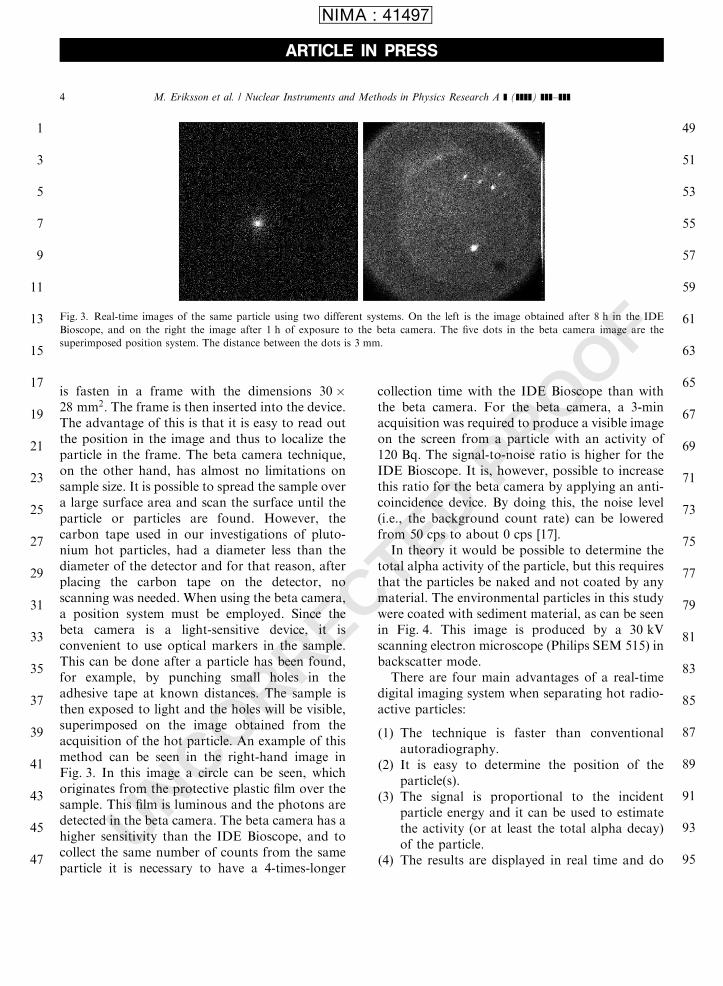
UNCORRECTED PROOF
is fasten in a frame with the dimensions 30 28 mm2: The frame is then inserted into the device.The advantage of this is that it is easy to read outthe position in the image and thus to localize theparticle in the frame. The beta camera technique,on the other hand, has almost no limitations onsample size. It is possible to spread the sample overa large surface area and scan the surface until theparticle or particles are found. However, thecarbon tape used in our investigations of pluto-nium hot particles, had a diameter less than thediameter of the detector and for that reason, afterplacing the carbon tape on the detector, noscanning was needed. When using the beta camera,a position system must be employed. Since thebeta camera is a light-sensitive device, it isconvenient to use optical markers in the sample.This can be done after a particle has been found,for example, by punching small holes in theadhesive tape at known distances. The sample isthen exposed to light and the holes will be visible,superimposed on the image obtained from theacquisition of the hot particle. An example of thismethod can be seen in the right-hand image inFig. 3. In this image a circle can be seen, whichoriginates from the protective plastic film over thesample. This film is luminous and the photons aredetected in the beta camera. The beta camera has ahigher sensitivity than the IDE Bioscope, and tocollect the same number of counts from the sameparticle it is necessary to have a 4-times-longer
collection time with the IDE Bioscope than withthe beta camera. For the beta camera, a 3-minacquisition was required to produce a visible imageon the screen from a particle with an activity of120 Bq: The signal-to-noise ratio is higher for theIDE Bioscope. It is, however, possible to increasethis ratio for the beta camera by applying an anti-coincidence device. By doing this, the noise level(i.e., the background count rate) can be loweredfrom 50 cps to about 0 cps [17].
In theory it would be possible to determine thetotal alpha activity of the particle, but this requiresthat the particles be naked and not coated by anymaterial. The environmental particles in this studywere coated with sediment material, as can be seenin Fig. 4. This image is produced by a 30 kVscanning electron microscope (Philips SEM 515) inbackscatter mode.
There are four main advantages of a real-timedigital imaging system when separating hot radio-active particles:
(1) The technique is faster than conventionalautoradiography.
(2) It is easy to determine the position of theparticle(s).
(3) The signal is proportional to the incidentparticle energy and it can be used to estimatethe activity (or at least the total alpha decay)of the particle.
(4) The results are displayed in real time and do
ARTICLE IN PRESS
1
3
5
7
9
11
13
15
17
19
21
23
25
27
29
31
33
35
37
39
41
43
45
47
49
51
53
55
57
59
61
63
65
67
69
71
73
75
77
79
81
83
85
87
89
91
93
95
Fig. 3. Real-time images of the same particle using two different systems. On the left is the image obtained after 8 h in the IDE
Bioscope, and on the right the image after 1 h of exposure to the beta camera. The five dots in the beta camera image are the
superimposed position system. The distance between the dots is 3 mm:
M. Eriksson et al. / Nuclear Instruments and Methods in Physics Research A ] (]]]]) ]]]–]]]4
NIMA : 41497

UNCORRECTED PROOF
not require processing after exposure, as theresults from the CR-39 and film autoradio-graphy.
Reports of electronic autoradiographs havebeen published by Zeissler [18]. In Zeisslers paperthree different techniques are compared; semicon-ductor pixel array, phosphor plate and track-etchdetectors. The semiconductor pixel array detectoris similar to the IDE Bioscope described in thispaper but has a smaller detector area, 7 9 mm2
compared with 32 32 mm2 for the IDE Bio-scope. Zeissler pointed out the advantages of real-time display of the sample, but the small detectorarea is a disadvantage.
4. Conclusions
The use of real-time digital image systems is ofgreat advantage for localizing plutonium-hotparticles compared to film autoradiography andCR-39 techniques, as it is faster and it is easilyprocessed. The beta camera was found to be thebest device of the two detector systems we used, asit had a higher sensitivity, resulting in a shorteracquisition time, with good precision. However,
the IDE Bioscope gives the position without theneed for position markers and has a betterresolution.
References
[1] R. P .oll.anen, T.K. Ik.aheimonen, S. Klemola, J. Juhanoja,
J. Environ. Radioactivity 45 (1999) 149.
[2] M. Moring, T.K. Ik.aheimonen, R. P .oll.anen, E. Ilus, S.
Klemola, J. Juhanoja, M. Eriksson, J. Radioanal. Nucl.
Chem. 248 (3) (2001) 623.
[3] USAF Nuclear Safety, Project Crested Ice, AFRP 122-1
January/February/March 1970, No. 1, Vol. 65, 1970.
[4] L. Sajo-Bohus, J. Palfalvi, E.D. Greaves, Radiat. Phys.
Chem. 51 (4–6) (1998) 467.
[5] O.A. Bondarenko, D.L. Henshaw, P.L. Salmon, A.N.
Ross, Radiat. Meas. 25 (1–4) (1995) 373.
[6] G. Espinosa, K. Meyer, R.B. Gammage, Radiat. Meas. 25
(1–4) (1995) 401.
[7] V.N. Dushin, A.D. Gedeonov, B.F. Petrov, L.A. Pleska-
chevsky, O.E. Shigaev, Radiat. Meas. 25 (1–4) (1995) 409.
[8] I.V. Zhuk, E.M. Lomonosova, O.I. Yaroshevich, M.K.
Kievetz, S.F. Boulyga, I.A. Tzekhanovich, V.P. Mironov,
V.P. Kudryashov, M.A. Drugachonok, Radiat. Meas. 25
(1–4) (1995) 419.
[9] E.I. Hamilton, J. Environ. Radioactivity 44 (1999) 297.
[10] M. Eriksson, H. Dahlgaard, E. Ilus, T.P. Ryan, Q.J. Chen,
S.P. Nielsen, A. Aarkrog, Plutonium in the marine
environment off Thule Air Base, N.W. Greenland, in: P.
Strand, T. Jlle (Eds.), Inventories and Distribution in
ARTICLE IN PRESS
1
3
5
7
9
11
13
15
17
19
21
23
25
27
29
31
33
35
37
39
41
43
45
47
49
51
53
55
57
59
61
63
65
67
69
71
73
75
77
79
81
83
85
87
89
91
93
95
Fig. 4. An image produced by a 30 kV scanning electron microscope (Philips SEM 515) in backscatter mode. The light areas are the
high-density plutonium and the dark areas are low-density sediment material. This is the particle that produced the real-time images
shown in Fig. 3. The bar at the upper left indicates 100 mm:
M. Eriksson et al. / Nuclear Instruments and Methods in Physics Research A ] (]]]]) ]]]–]]] 5
NIMA : 41497
UNCORRECTED PROOF
Sediments 29 years after the Accident, Proceedings of the
Fourth International Conference on Environmental
Radioactivity in the Arctic, Edinburgh, Scotland, 20–23
September 1999, NRPA, Norway, pp. 60–62.
[11] H. Dahlgaard, M. Eriksson, E. Ilus, T. Ryan, C.A.
McMahon, S.P. Nielsen, Plutonium in the marine envir-
onment at Thule, NW-Greenland after a nuclear weaponds
accident, in: A. Kudo (Ed.), Environmental Radioactivity
Series 1. Second International Symposium on Plutonium in
the Environment, 2001, pp. 15–30.
[12] K. Ljunggren, S.E. Strand, J. Nucl. Med. 31 (1990) 2058.
[13] L. Niemist .o, Merentutkimuslait. Julk./Havsforskninginst.
Skr. 238 (1974) 33.
[14] IDE, The IDE Bioscope 3250, User Manual, 1998.
[15] M. Overdick, A. Czermak, P. Fischer, V. Herzog, A.
Kjensmo, T. Kugelmeier, K. Ljunggren, E. Nyg(ard, C.
Pietrizik, T. Schwan, S.-E. Strand, J. Straver, P. Weilham-
mer, N. Wermes, K. Yoshioka, Nucl. Instr. and Meth. A
392 (1997) 173.
[16] K. Ljunggren, X. Liu, L.G. Salford, M. Ljungberg, S.E.
Strand, Absorbed dose distribution in glioma tumors in rat
brain after therapeutic intratumoral injection of 201Tl-
chloride, Med. Phys. 2001, submitted for publication.
[17] K. Ljunggren, S.E. Strand, IEEE Trans. Nucl. Sci. NS-41
(4) (1994) 1666.
[18] C.J. Zeissler, Nucl. Instr. and Meth. A 392 (1–3) (1997)
249.
ARTICLE IN PRESS
1
3
5
7
9
11
13
15
17
19
21
23
M. Eriksson et al. / Nuclear Instruments and Methods in Physics Research A ] (]]]]) ]]]–]]]6
NIMA : 41497


Paper VEriksson M., Roos P., Dahlgaard H., Lindahl P. and Holm E.:Isotopic ratios in Thule hot particles, source term of the Thule debrisManuscript, (18 pp), 2002.
Risø–R–1321(EN) 123


Isotopic ratios in Thule hot particles, source
term of the Thule debris
Mats Eriksson a,b,∗ Per Roos a Henning Dahlgaard a
Patric Lindahl b Elis Holm a,b
aRisø National Laboratory, P.O. Box 49, DK-4000 Roskilde, DenmarkbDepartment of Radiation Physics, Lund University, SE-221 85 Lund, Sweden
Abstract
This paper presents the first investigation of enriched uranium in the debris fromthe nuclear weapon accident in Thule, N.W. Greenland, using samples collected onseveral expeditions. Discussions over the past 34 years have focused on plutoniumand, wrongly, it has been understood that the fusion weapons were of a plutoniumtype.
Our measurements on single, isolated hot particles from Thule sediments belowthe impact point, show that the weapons contained very significant quantities of235U. Furthermore, particles in the marine sediments have lost uranium to the sed-iment interstitial water and to the sea-water by leaching. There is a relationshipbetween the amount of leached 235U and the time spent in the sediments. Pluto-nium and americium on the other hand have not measurably left the particle latticein the same rate. Moreover, we conclude that the Thule debris consists of more thanone source, most probably two.
Key words: Hot-Particles, Plutonium, Uranium, Thule accident, alphaspectroscopy, ICP-MS, SEM, X-ray, source terms
1 Introduction
In January 1968, a B52 aeroplane crashed on the sea ice about 12 km west ofthe Thule air base. The aircraft was carrying four hydrogen nuclear weapons.The impact triggered the conventional explosive material within the weapons
∗ Corresponding author.Email address: [email protected] (Mats Eriksson).
Preprint submitted to Elsevier Science 2 April 2002

and the explosion pulverized the fissile material in the bombs. The debris wasscattered around and beneath the point of impact.
The source terms (isotopic ratios) of the debris have been investigated byothers (1; 2; 3; 4; 5; 6). Some investigations suggest that the debris consistsof different sources (1; 4). However, since the ratios were determined on bulksediment samples, the ratios could represent a mixed ratio of different sources.Therefore single isolated particles, which most probably consist of nuclidesfrom one single source, should be used to determine the different source terms.
In the first preliminary study of a hot particle from the Thule area (7), itwas clear that the weapons consisted partly of uranium. This had never beenreported before. Later, in 2001, another study of an isolated particle from theThule sediment confirmed that the weapons consisted partly of uranium (8).However, in the official answers given by the U.S. Government to the Dan-ish Government in 2000 on the question regarding the radionuclides involvedin the debris (Question 4), uranium was not mentioned (9). Therefore, thissubject requires more detailed investigation.
2 Material and Methods
The particles studied here were separated from bulk sediment samples, whichhad been collected during expeditions to Thule in 1979, 1984 and 1997, seeTable 1. The separation technique has been described in detail elsewhere (10).Briefly, the technique is based on sample splitting, using the gamma emitting(59.54 keV, nγ = 35.9 %) 241Pu daughter 241Am, as an indicator of hot par-ticles. The particles were identified using real-time digital imaging systems.After separation, the single particles were measured on a High Purity Germa-nium (HPGe) detector in order to determine the activity of 241Am (pulse-rate).Dissolution of hot particles is notoriously difficult and so by comparing thegamma activity with the alpha-activity of 241Am after dissolution and chemicalseparation (described below) we were able to check that complete dissolutionhad occurred.
Different analytical methods were used to determine the elemental composi-tion, activity and mass of U, Pu and Am in each particle. Some of the particleswere analyzed on a 30 keV scanning electron microscope (SEM), Philips SEM515, with an energy dispersive X-ray analyzer (EDX). The elemental composi-tions were derived from the X-ray spectra and the element ratios were derivedfrom the M and L-shell X-ray lines of U and Pu. Inductively coupled plasmamass spectrometry (ICP-MS) and alpha spectroscopy were used to determinethe isotopic and element ratios and the masses and activities of U, Pu andAm in the particles. Two different ICP-MS instruments were used. At the
2

Table 1Sample data
Particle id. Station Sediment corer Sediment slice Sampling date
TPA Thule-V HAPS 0–3 cm 23–8–1979
TPB Thule-V HAPS 6–9 cm 11–8–1984
TPC Thule-V HAPS 3–6 cm 11–8–1984
TPD Thule-V HAPS 0–3 cm 23–8–1979
TPE V2 Gemini 6–7 cm 25–8–1997
Agricultural University, NHL, Norway, an ELAN 6100 quadrupole instrumentwas used with the x-flow and an ultra-sonic nebulizer and at Risø NationalLaboratory, Denmark, a PlasmaTrace2 high resolution-ICP-MS was used withthe x-flow nebulizer. Alpha measurements were made on passivated implantedplanar silicon (PIPS) alpha-detectors.
The particles which would be analyzed by ICP-MS and alpha spectroscopywere dissolved in a mixture of hydrofluoric acid and nitric acid (ratio 1:3) inhigh pressure teflon bombs. The dissolution procedure began with 0.1 ml HFand 0.3 ml HNO3 which was evaporated to dryness, and this was repeated30 times. Finally, 1 ml HF and 3 ml HNO3 were added to the closed teflonbomb and placed on a hot-plate so that the mixture was under pressure for 24hours. The solution was then evaporated to dryness. In addition, one particle(later refered to as TPE) was dissolved in a microwave oven, MARS 5. Amixture of 7 ml HF, 7 ml HNO3 and 1.5 ml HCl was added to the particle ina teflon bomb and heated for 20 min in the microwave oven at a maximumpressure of 250 PSI (17.2 Bar) and a maximum temperature of 200 C. 25 mlsaturated boric acid was then added and the mixture was heated for another20 minutes in the microwave oven. The last step was necessary to dissolvethe Pu-fluoride complexes formed in the previous step. The solutions wereevaporated to dryness and 3 times 0.3 ml HNO3 were added and evaporatedto dryness, this also to ensure that all the fluoride complexes were destroyed.The dissolved particles were thereafter diluted in 5 % HNO3 (Ultra Pure SeaStar quality) to 50 ml with ultra pure H2O (>18 MΩ cm). The analysis ofPu and U were done on un-separated aliquots of the sample solution as wellas on radiochemically separated aliquots. The size of the aliquots were 0.2–1.5 ml, depending on the activity of the particle. The aliquots which wereradiochemically separated, used ion exchange (AG 1×4, 100–200 mesh, BIORAD). To minimize the use of acid, 1.5 ml columns with 0.7 ml resin wereused. All acid used were of Ultra Pure Sea Star quality, except HF which wasof pro analysis Merck quality. Unused teflon cells were acid washed in boiling12 M HCl before use. These precautions were taken to reduce contaminationby naturally occurring uranium isotopes.
3

The yield determinants used were 233U, 242Pu and 243Am. Sub-samples of eachdissolved particle solution were analysed with yield determinants as well aswithout. The sub-samples analysed without yield determinants were used todetermine the isotopic ratios and the mass and activity of each nuclide in theparticle were determined from the spiked solutions. In addition, proceduraland machine blank samples were prepared to assess the background levels.
2.1 U, Pu and Am separation
The sub-samples were evaporated to dryness and thereafter dissolved in 8 MHNO3. The solutions were absorbed onto the columns. The eluate was col-lected for Am and U, which were then separated using the method describedby Holm (11). Thorium was then eluted with 9 M HCl, followed by the elutionof Pu with NH4I + 9 M HCl. The samples were then evaporated to dryness andthe samples intended for ICP-MS analysis were diluted to 3 % HNO3 solutions(10 ml). The samples measured by alpha particle spectrometry were electrode-posited onto stainless steel discs in accordance with the method described byHalstadius (12).
The sample preparation was performed in environmental laboratories whichare also used for trace level uranium analysis. Therefore one set of sampleswas prepared in a clean lab at Risø National Laboratory to minimize uraniumcontamination.
In total, 5 hot particles were analyzed which were all collected in close vicin-ity to the point of impact. 5 sub-samples of each hot particle solution wereanalyzed by ICP-MS together with procedural blank samples.
2.2 Uncertainty estimation
The uncertainty limits reported in the present paper have been determinedusing the error propagation hypotheses where the standard deviation is cal-culated by Equation 1.
σ2y =
(∂y
∂a
)2
σ2a +
(∂y
∂b
)2
σ2b +
(∂y
∂c
)2
σ2c + ... (1)
where a, b and c are the variables of the determined quantity, y (mass, activityor ratio). Typical variables are: sub sample size, tracer concentration andcounts in the peak. The uncertainties for the isotopic ratios are only dependenton the counting statistics when the ratio is determined from the same spectra,
4

as in theses cases the isotopic ratios are independent of the tracer and thesample size. For mean values, the standard deviation (SD) and number ofsamples (n) are reported.
3 Results
3.1 Particle destruction
As mentioned before, PuO2 is difficult to dissolve. Experiments performedat Risø National Laboratory (13) have shown that 8–40 % of the Pu remainsundissolved in bulk Thule sediment samples when using the Aqua Regia leach-ing technique described by Talvitie (14). To ensure that the particles in thepresent study were dissolved, the gamma measurements of 241Am on the undis-solved particle and the determined alpha activity (determined from an aliquotof the dissolved particle solution) were compared. The results can be seenin Figure 1, with an almost perfect agreement (correlation coefficient, R2 =0.9991) between the two different methods. The gamma measurements arerepresented as the total count-rate (i.e. includes the background counts whichhowever was insignificant in this context) of the 241Am gamma line (59.54keV) in counts per minute (CPM). The graph shows that, for this particularHPGe detector, the 241Am activity of a particle can be calculated from thegamma measurements as:
Aparticle =1
4.956(CPM − 1.6372) [Bq] (2)
The good agreement between measurements indicates that the particles weretotally dissolved. The alpha spectrometry results (Table 3) show an almostidentical 241Am/239+240Pu ratio for all 5 particles. This means that the Puactivity could be determined in the Thule sediments, by indirect measurementson 241Am.
3.2 Plutonium content
The results from ICP-MS can be seen in Table 2 and from alpha spectrometryin Table 3. Since the ICP-MS used in Norway was unstable at the time ofthe measurements combined with that a peak jumping mode (obvious risk tomiss peaks) were used for evaluation, only the results from the PlasmaTrace2machine at Risø are presented. However, the deviations between the Pu resultsfrom the two instruments were less than 2 % for the Pu measurements. The
5

0 5 10 15
Alpha [Bq]
0
20
40
60
80
Gam
ma
[CP
M]
Fig. 1. Comparison of the 241Am content in the particles, derived by two differentmethods. The count-rate, CPM, is derived from the measurements of the wholeparticles on an HPGe detector and the activity is derived by alpha spectrometricmeasurements of aliquots from the dissolved particle solution. The graph showsan almost perfect fit between the two different methods, which indicates that theparticles are totally dissolved using the radiochemical method described in thisarticle. The correlation coefficient, R2, between the two data sets is 0.9991.
results from an UKAEA Pu reference material solution (sample number: UKPu 5/92138) were in good agreement with the reported values (the mass ratiosagreed within 0.01 %). The mean mass ratio, 240Pu/239Pu, for the 5 particlesis 0.0551 ± 0.0008 (1 SD, n = 5) and the corresponding activity ratio is 0.2057± 0.0011 (1 SD, n = 5).
There is also a good agreement between the two different analytical techniques,i.e. the ICP-MS and alpha spectrometry for the 239+240Pu measurements. 238Puis difficult to measure by ICP-MS because it has a short half life and 238U as anisobaric interference, and so it could only be measured by alpha spectrometry.The mean activity ratio of 238Pu/239+240Pu is 0.0161 ± 0.0005 (1 SD, n = 5)and the mean activity ratio 241Am/239+240Pu is 0.169 ± 0.005 (1 SD, n = 5),reference date: 2001–10–01.
6
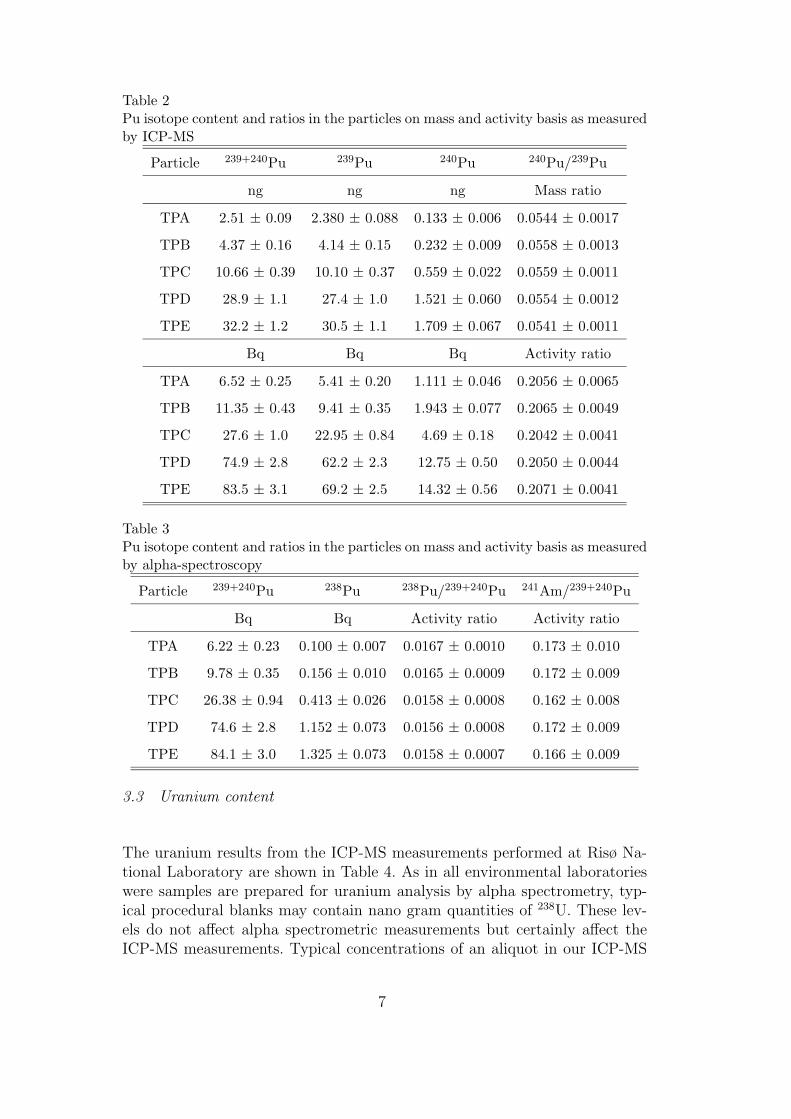
Table 2Pu isotope content and ratios in the particles on mass and activity basis as measuredby ICP-MS
Particle 239+240Pu 239Pu 240Pu 240Pu/239Pu
ng ng ng Mass ratio
TPA 2.51 ± 0.09 2.380 ± 0.088 0.133 ± 0.006 0.0544 ± 0.0017
TPB 4.37 ± 0.16 4.14 ± 0.15 0.232 ± 0.009 0.0558 ± 0.0013
TPC 10.66 ± 0.39 10.10 ± 0.37 0.559 ± 0.022 0.0559 ± 0.0011
TPD 28.9 ± 1.1 27.4 ± 1.0 1.521 ± 0.060 0.0554 ± 0.0012
TPE 32.2 ± 1.2 30.5 ± 1.1 1.709 ± 0.067 0.0541 ± 0.0011
Bq Bq Bq Activity ratio
TPA 6.52 ± 0.25 5.41 ± 0.20 1.111 ± 0.046 0.2056 ± 0.0065
TPB 11.35 ± 0.43 9.41 ± 0.35 1.943 ± 0.077 0.2065 ± 0.0049
TPC 27.6 ± 1.0 22.95 ± 0.84 4.69 ± 0.18 0.2042 ± 0.0041
TPD 74.9 ± 2.8 62.2 ± 2.3 12.75 ± 0.50 0.2050 ± 0.0044
TPE 83.5 ± 3.1 69.2 ± 2.5 14.32 ± 0.56 0.2071 ± 0.0041
Table 3Pu isotope content and ratios in the particles on mass and activity basis as measuredby alpha-spectroscopy
Particle 239+240Pu 238Pu 238Pu/239+240Pu 241Am/239+240Pu
Bq Bq Activity ratio Activity ratio
TPA 6.22 ± 0.23 0.100 ± 0.007 0.0167 ± 0.0010 0.173 ± 0.010
TPB 9.78 ± 0.35 0.156 ± 0.010 0.0165 ± 0.0009 0.172 ± 0.009
TPC 26.38 ± 0.94 0.413 ± 0.026 0.0158 ± 0.0008 0.162 ± 0.008
TPD 74.6 ± 2.8 1.152 ± 0.073 0.0156 ± 0.0008 0.172 ± 0.009
TPE 84.1 ± 3.0 1.325 ± 0.073 0.0158 ± 0.0007 0.166 ± 0.009
3.3 Uranium content
The uranium results from the ICP-MS measurements performed at Risø Na-tional Laboratory are shown in Table 4. As in all environmental laboratorieswere samples are prepared for uranium analysis by alpha spectrometry, typ-ical procedural blanks may contain nano gram quantities of 238U. These lev-els do not affect alpha spectrometric measurements but certainly affect theICP-MS measurements. Typical concentrations of an aliquot in our ICP-MS
7

Table 4Uranium in the particles measured by ICP-MS
Particle 235U 238U 235U/235+238U 235U/239Pu
ng ng Mass ratio Mass ratio
TPA 9.28 ± 0.63 8.34 ± 0.57 0.527 ± 0.002 3.90 ± 0.30
TPB 10.00 ± 0.68 12.02 ± 0.82 0.454 ± 0.002 2.41 ± 0.19
TPC 13.98 ± 0.95 16.29 ± 1.11 0.462 ± 0.002 1.38 ± 0.11
TPD 74.65 ± 5.06 65.34 ± 4.44 0.533 ± 0.002 2.73 ± 0.21
TPE 34.75 ± 2.36 30.27 ± 2.07 0.534 ± 0.003 1.14 ± 0.09
studies were 25 pg/ml of total uranium. The samples which were measuredin Norway show a large variation in the 235U/235+238U mass ratio (3–23 %).All these samples were radiochemically separated and prepared in a standardenvironmental laboratory where high level (kBq) uranium samples were alsooccasionally analyzed, which could introduce a contamination with naturalmass ratios to the samples. Laboratory contamination was indeed confirmedwhen the unseparated sub-samples were measured unseparated and more careabout the laboratory contamination risk was taken, involving new and cleanedequipment. The mass ratios, 235U/235+238U, presented in Table 4 are from thesamples that were prepared in a clean lab. These results show almost iden-tical isotopic ratios for the 5 particles. Moreover, the 235U measured in theparticles on both ICP-MS machines were in reasonably agreement. Due to therelatively high 235U concentration in the samples these measurements are lesssensitive to contamination with respect to this nuclide. The mass ratio of thefissile material in the particles, 235U/239Pu is less affected by natural uraniumcontamination than the TotU/239+240Pu ratio. Therefore this ratio is presentedin Table 4. It appears that the ratio decreases with the time that the particlehas been exposed to the aquatic sediment. In Figure 2 the ratio as a functionof time can be seen. We believe that the result reflects preferential leaching ofthe uranium from the particles.
3.4 SEM study of the particles
In Figure 3 a hot particle with a diameter of about 120 µm is shown. The SEMimage was produced in back scatter mode. It is clear that the particle is coatedwith sediment material, which appears grey in the image. It is not verified ifthe particle has been coated in the sediment or if the coating occurred duringthe freeze drying of the sediment sample. The acceleration voltage of theelectrons was 30 kV. These electrons do not have sufficient energy to penetratethe particle deeply. Some high density areas are however visible, represented
8

1970 1975 1980 1985 1990 1995Year
0.0
1.0
2.0
3.0
4.0
0.5
1.5
2.5
3.5
4.5
Rat
io
Fig. 2. The mean ratio, 235U/239Pu (± 1 SD), in particles collected during a specificyear. There is a tendency that the uranium content is lower in the particles exposedto the sediment for a longer time, which would mean that there is preferentialleaching of uranium from the particle in the sediment. The standard deviation forthe ratio in 1997 is the square rote of the ratio, as only one particle have beenanalyzed from this year, the standard deviation from the ICP-MS measurement ismuch less than the shown, see Table 4.
by light areas in the image. When the acceleration voltage was lowered theseareas decreased, meaning that the whole particle was coated with sedimentmaterial of different thicknesses.
Several spots on the particle were analyzed with the EDX analyzer. The twospots visible in Figure 3 are representive of the different density areas. Spot1, is sediment material and spot 2 the high density material. The dominantpeaks in the X-ray spectra (shown below the particle in Figure 3) at spot 1are the K X-ray lines originating from Mg, Al, Si and Fe, which are majorcomponents of marine sediment. The X-ray spectra from spot 2 shows somelarge peaks around 3.3 keV which originate from the U and Pu M X-ray lines.The Mβ1 peaks of uranium are however overlapped by the Mα peaks of pluto-nium and for that reason M-line profiles are required for the SEM to be ableto determine the element ratio (U/Pu) of these two elements. These profileswere not available for the present SEM. Although the L X-ray lines are sepa-rated for the two elements, it is not possible to do quantitative measurementsof these elements as their electron binding energies are close to the energyof the accelerated incident electrons. As a rule of thumb, about three timeshigher accelerating energy is required (accelerating voltage) to do quantitative
9
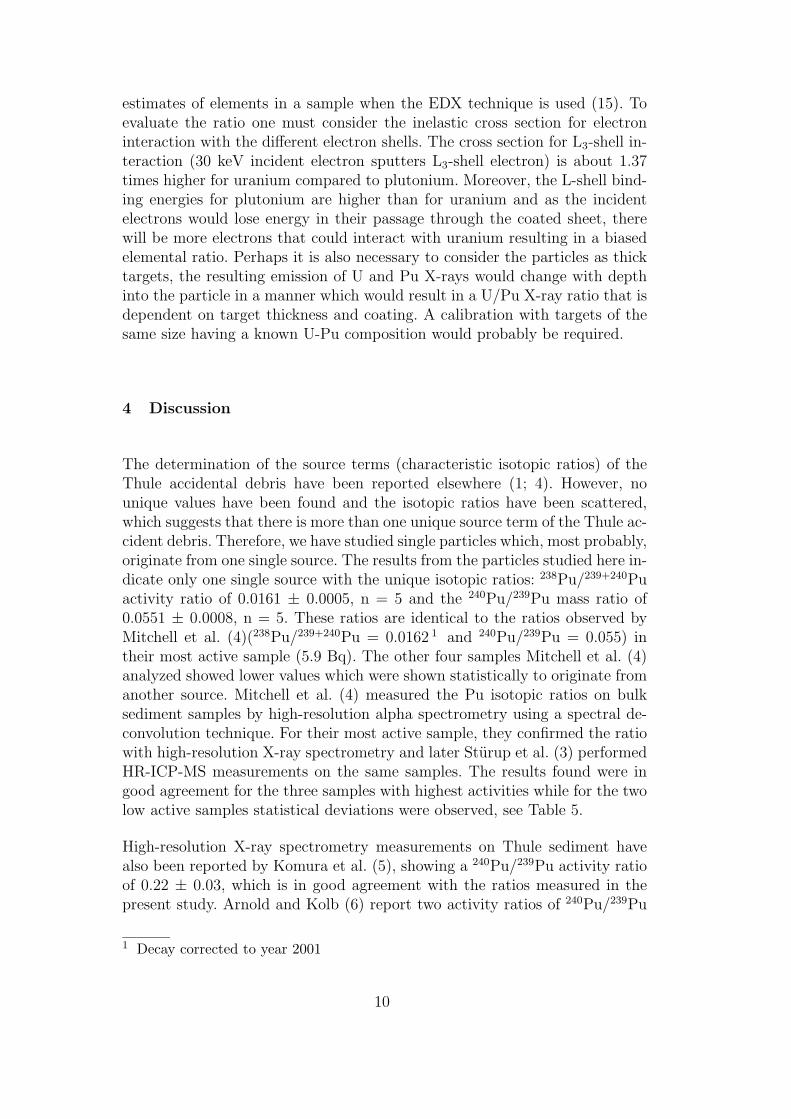
estimates of elements in a sample when the EDX technique is used (15). Toevaluate the ratio one must consider the inelastic cross section for electroninteraction with the different electron shells. The cross section for L3-shell in-teraction (30 keV incident electron sputters L3-shell electron) is about 1.37times higher for uranium compared to plutonium. Moreover, the L-shell bind-ing energies for plutonium are higher than for uranium and as the incidentelectrons would lose energy in their passage through the coated sheet, therewill be more electrons that could interact with uranium resulting in a biasedelemental ratio. Perhaps it is also necessary to consider the particles as thicktargets, the resulting emission of U and Pu X-rays would change with depthinto the particle in a manner which would result in a U/Pu X-ray ratio that isdependent on target thickness and coating. A calibration with targets of thesame size having a known U-Pu composition would probably be required.
4 Discussion
The determination of the source terms (characteristic isotopic ratios) of theThule accidental debris have been reported elsewhere (1; 4). However, nounique values have been found and the isotopic ratios have been scattered,which suggests that there is more than one unique source term of the Thule ac-cident debris. Therefore, we have studied single particles which, most probably,originate from one single source. The results from the particles studied here in-dicate only one single source with the unique isotopic ratios: 238Pu/239+240Puactivity ratio of 0.0161 ± 0.0005, n = 5 and the 240Pu/239Pu mass ratio of0.0551 ± 0.0008, n = 5. These ratios are identical to the ratios observed byMitchell et al. (4)(238Pu/239+240Pu = 0.0162 1 and 240Pu/239Pu = 0.055) intheir most active sample (5.9 Bq). The other four samples Mitchell et al. (4)analyzed showed lower values which were shown statistically to originate fromanother source. Mitchell et al. (4) measured the Pu isotopic ratios on bulksediment samples by high-resolution alpha spectrometry using a spectral de-convolution technique. For their most active sample, they confirmed the ratiowith high-resolution X-ray spectrometry and later Sturup et al. (3) performedHR-ICP-MS measurements on the same samples. The results found were ingood agreement for the three samples with highest activities while for the twolow active samples statistical deviations were observed, see Table 5.
High-resolution X-ray spectrometry measurements on Thule sediment havealso been reported by Komura et al. (5), showing a 240Pu/239Pu activity ratioof 0.22 ± 0.03, which is in good agreement with the ratios measured in thepresent study. Arnold and Kolb (6) report two activity ratios of 240Pu/239Pu
1 Decay corrected to year 2001
10

Fig. 3. A backscatter SEM image of a hot particle from the Thule sediments collectedat the Thule-97 expedition. The particle is coated with sediment material (greyisharea), but at some spots high density areas (light areas) can be seen. The elementalcomposition were analyzed by EDX at several spots on the particle. Two of the spotspectras can be seen. Spectra from spot 1 shows typical sediment material i.e. Al,Si, Mg and Fe. The spectra from spot 2 shows M and L X-ray from U and Pu.
for the Thule sediment, 0.10 ± 30% and 0.08 ± 110 %, which are in agreementwith sample Thule-3 in Table 5.
If the sediment contains more than one unique source, the isotopic ratios
11
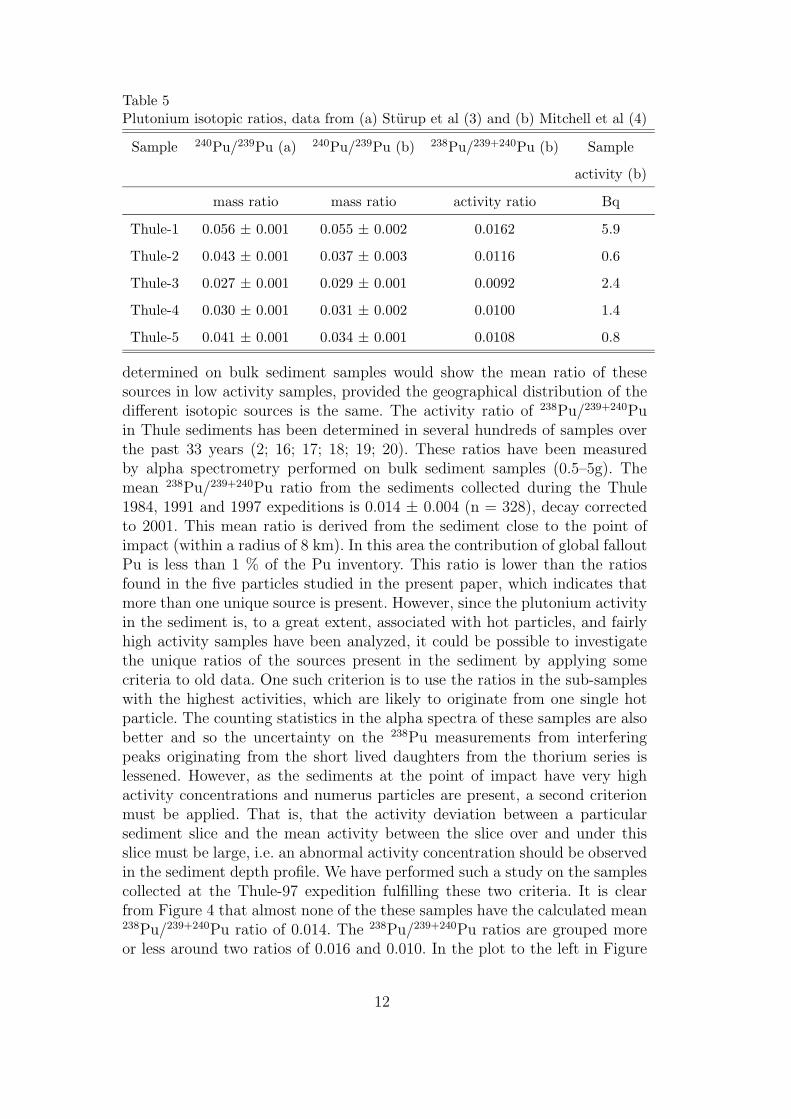
Table 5Plutonium isotopic ratios, data from (a) Sturup et al (3) and (b) Mitchell et al (4)
Sample 240Pu/239Pu (a) 240Pu/239Pu (b) 238Pu/239+240Pu (b) Sample
activity (b)
mass ratio mass ratio activity ratio Bq
Thule-1 0.056 ± 0.001 0.055 ± 0.002 0.0162 5.9
Thule-2 0.043 ± 0.001 0.037 ± 0.003 0.0116 0.6
Thule-3 0.027 ± 0.001 0.029 ± 0.001 0.0092 2.4
Thule-4 0.030 ± 0.001 0.031 ± 0.002 0.0100 1.4
Thule-5 0.041 ± 0.001 0.034 ± 0.001 0.0108 0.8
determined on bulk sediment samples would show the mean ratio of thesesources in low activity samples, provided the geographical distribution of thedifferent isotopic sources is the same. The activity ratio of 238Pu/239+240Puin Thule sediments has been determined in several hundreds of samples overthe past 33 years (2; 16; 17; 18; 19; 20). These ratios have been measuredby alpha spectrometry performed on bulk sediment samples (0.5–5g). Themean 238Pu/239+240Pu ratio from the sediments collected during the Thule1984, 1991 and 1997 expeditions is 0.014 ± 0.004 (n = 328), decay correctedto 2001. This mean ratio is derived from the sediment close to the point ofimpact (within a radius of 8 km). In this area the contribution of global falloutPu is less than 1 % of the Pu inventory. This ratio is lower than the ratiosfound in the five particles studied in the present paper, which indicates thatmore than one unique source is present. However, since the plutonium activityin the sediment is, to a great extent, associated with hot particles, and fairlyhigh activity samples have been analyzed, it could be possible to investigatethe unique ratios of the sources present in the sediment by applying somecriteria to old data. One such criterion is to use the ratios in the sub-sampleswith the highest activities, which are likely to originate from one single hotparticle. The counting statistics in the alpha spectra of these samples are alsobetter and so the uncertainty on the 238Pu measurements from interferingpeaks originating from the short lived daughters from the thorium series islessened. However, as the sediments at the point of impact have very highactivity concentrations and numerus particles are present, a second criterionmust be applied. That is, that the activity deviation between a particularsediment slice and the mean activity between the slice over and under thisslice must be large, i.e. an abnormal activity concentration should be observedin the sediment depth profile. We have performed such a study on the samplescollected at the Thule-97 expedition fulfilling these two criteria. It is clearfrom Figure 4 that almost none of the these samples have the calculated mean238Pu/239+240Pu ratio of 0.014. The 238Pu/239+240Pu ratios are grouped moreor less around two ratios of 0.016 and 0.010. In the plot to the left in Figure
12

100 101 1022 3 4 5 6 7 2 3 4 5 6 70.005
0.008
0.011
0.014
0.017
Difference
238Pu/239+
240Pu
rati
o
102 103 1043 4 5 67 2 3 4 5 67 2 3 4 5 6 70.005
0.008
0.011
0.014
0.017
Activity [mBq kg−1]
238Pu/239+
240Pu
rati
o
Fig. 4. The two plots show the 238Pu/239+240Pu activity ratios in bulk sedimentsamples. To the left are the ratios plotted against the deviation from the meanactivity of the activity concentration above and under the slice and to the right arethe ratios plotted against the activity concentration in the sub-sample. The ratiosare grouped in two groups around 0.016 and 0.010, and it is very few observationsclose to the mean ratio of 0.014.
4, the ratios are plotted against the activity concentration deviation, i.e. thesecond criteria. The two samples with the largest deviation most probablyoriginates from one single source (hot particle) and they have activity ratiosof 0.0102 and 0.0163. In the right hand plot of Figure 4 the ratios are plottedagainst the activity concentration and it is clear that the samples with highestactivity concentrations lie towards the 0.016 ratio group. Assuming that onlythese two unique ratios are present and the mean ratio observed is 0.014,this would mean that 2/3 of the debris originates from the source with the238Pu/239+240Pu activity ratio of 0.016. The high 238Pu/239+240Pu ratio is ingood agreement with the 5 hot particles studied in the present paper. Theseparticles have all higher activity (6–84 Bq 239+240Pu) than the analyzed bulksediment samples, where the highest activities of the samples were about 2.5Bq 239+240Pu.
Dahlgaard et al. (1) have grouped the 240Pu/239Pu mass ratios data, deter-mined by (HR)-ICP-MS measurement of 40 bulk sediment samples collectedon the Thule-97 expedition, and plotted the ratio against the activity in theanalyzed sample. It is clear from Figure 5 (redrawn from Dahlgaard et al.(2)) that the high activity samples are split into two groups, with mass ra-tios of 0.057 and 0.027. However, the data do not satisfy the second criteriondescribed above. The mean ratio of these measurements is 0.0442 ± 0.0073.The most active sample has a ratio of 0.056 which is similar to the particlesstudied in this paper. This is an indication of a group around the mass ratio of0.043, however these are samples from locations close to the point of impact,less than 1 km, and they are considered as low active for these locations. Forthat reason these bulk samples should be considered as a mix of all the sourcesand reflect the mean ratio between the sources.
13
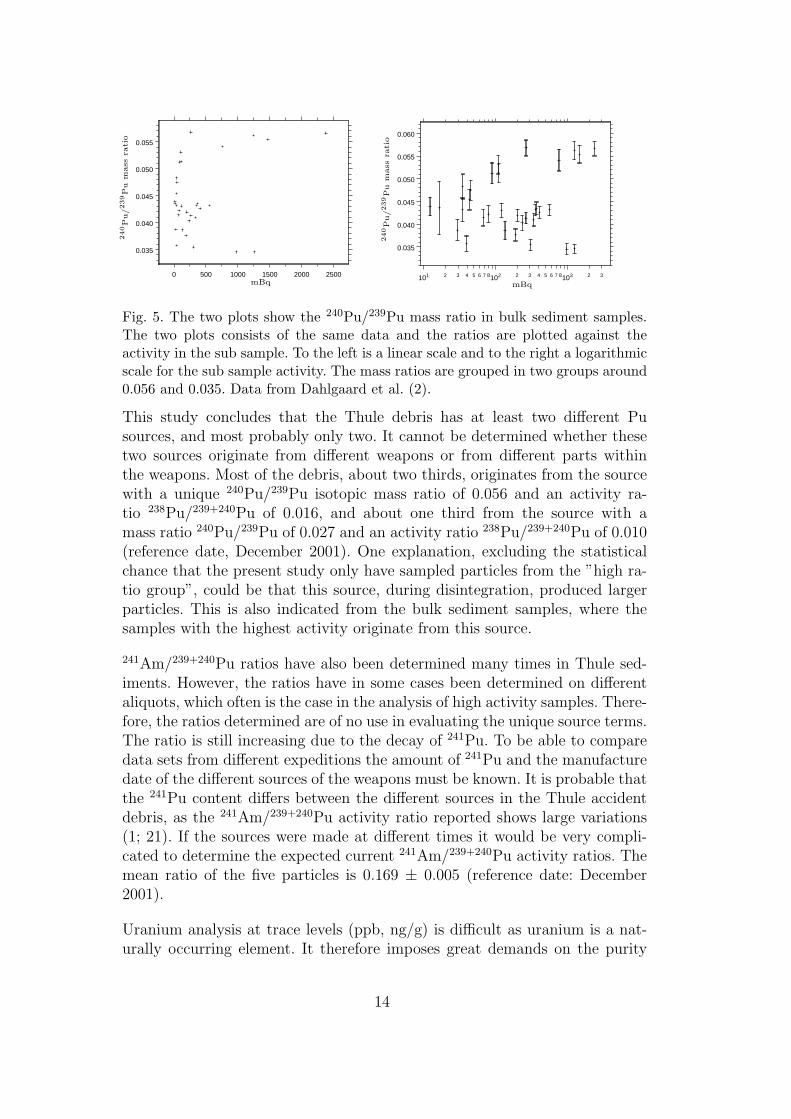
0 500 1000 1500 2000 2500
0.035
0.040
0.045
0.050
0.055
mBq
240Pu/239Pu
mass
rati
o
101 102 1032 3 4 5 6 7 8 2 3 4 5 6 7 8 2 3
0.035
0.040
0.045
0.050
0.055
0.060
mBq
240Pu/239Pu
mass
rati
o
Fig. 5. The two plots show the 240Pu/239Pu mass ratio in bulk sediment samples.The two plots consists of the same data and the ratios are plotted against theactivity in the sub sample. To the left is a linear scale and to the right a logarithmicscale for the sub sample activity. The mass ratios are grouped in two groups around0.056 and 0.035. Data from Dahlgaard et al. (2).
This study concludes that the Thule debris has at least two different Pusources, and most probably only two. It cannot be determined whether thesetwo sources originate from different weapons or from different parts withinthe weapons. Most of the debris, about two thirds, originates from the sourcewith a unique 240Pu/239Pu isotopic mass ratio of 0.056 and an activity ra-tio 238Pu/239+240Pu of 0.016, and about one third from the source with amass ratio 240Pu/239Pu of 0.027 and an activity ratio 238Pu/239+240Pu of 0.010(reference date, December 2001). One explanation, excluding the statisticalchance that the present study only have sampled particles from the ”high ra-tio group”, could be that this source, during disintegration, produced largerparticles. This is also indicated from the bulk sediment samples, where thesamples with the highest activity originate from this source.
241Am/239+240Pu ratios have also been determined many times in Thule sed-iments. However, the ratios have in some cases been determined on differentaliquots, which often is the case in the analysis of high activity samples. There-fore, the ratios determined are of no use in evaluating the unique source terms.The ratio is still increasing due to the decay of 241Pu. To be able to comparedata sets from different expeditions the amount of 241Pu and the manufacturedate of the different sources of the weapons must be known. It is probable thatthe 241Pu content differs between the different sources in the Thule accidentdebris, as the 241Am/239+240Pu activity ratio reported shows large variations(1; 21). If the sources were made at different times it would be very compli-cated to determine the expected current 241Am/239+240Pu activity ratios. Themean ratio of the five particles is 0.169 ± 0.005 (reference date: December2001).
Uranium analysis at trace levels (ppb, ng/g) is difficult as uranium is a nat-urally occurring element. It therefore imposes great demands on the purity
14

of the reagents and equipment employed during the course of the analysis.In this study the 235U/238U ratio could easily have been biased by naturallyoccurring uranium contamination from the walls of the beakers, laboratoryequipment used and from the reagents. A pure 235U sample would be almostimpossible to measure as the natural ratio of 235U/238U is 0.00727, thus onlya slight contamination by natural U would seriously alter the 235U/238U ratio.For example, if 235U should be analyzed in a one gram sediment sample fromthe Bylot Sound, containing one single Pu/U hot particle (example particleTPE in the present study), assuming that 100 % of the uranium was 235U, the235U/238U ratio would be about 0.0249 mass ratio (0.158, activity ratio) sincein marine sediments a typical concentration is about 6.19 mg/g (77 Bq/g) ofnaturally occurring 238U. The most robust ratio to use is therefore 235U/239Pu,as the total uranium to plutonium is easily biased by internal contaminationof 238U.
This study proves that the nuclear-weapons involved in the Thule accidentwere not, as has been said before, pure Pu-weapons, instead it is clear thatthe weapons are a mixture of Pu and U. As only particles originating fromone unique source have been analyzed, this is at least true for these. The massof 235U was around 4 times the mass of 239Pu in the fresh accidental debris.
As discussed earlier, the 235U/239Pu mass ratios in samples sampled at differentyears, indicate that uranium is leaving the particle lattice over time, see Figure2. The variations are large, and for the the ratio at year 1997 only one particlehave been analysed. The variations can be explained to some extent by thatthe leaching rate is probably a function of sediment depth.
The most probable sea water constituent responsible for potential disssolu-tion of a uranium-plutonium oxide particle would be carbonate since it formsvery stable complexes with actinides and lanthanides (22). It is well knownthat the strong uranium carbonate complex (UO2(CO3)
2−2 / UO2(CO3)
4−3 ) is
the major reason for the long residence time in the oceans. In sea water thecarbonate/bicarbonate concentrations depend on the partial pressure of CO2
in the atmosphere. In normal sea water with a pH of around 8, bicarbonatedominates by about a factor of ten over carbonate, typical bicarbonate con-centrations are in the mM range. In the sediment interstitial waters howeverthe concentrations are often higher than in the overlying sea water due to thedegradation of sediment organic matter.
There are several experiments conducted in laboratories where the leach-ing/corrosion of UO2 from nuclear fuel has been studied in attempts to deter-mine the breakdown of the initial barriers for the release of fission products.In these experiments (conducted in alkaline as well as acid salt solutions ofdifferent types) most data indicate a stronger release of uranium than pluto-nium. Rollin et al. (23) observed a ten-fold higher dissolution rate of uranium
15

than plutonium from spent UO2 fuel when exposed to bicarbonate solutions atmillimolar concentrations. De Pablo et al. (24) proposed a model for uraniumdissolution from UO2 when exposed to bicarbonate solutions in oxic media.The model suggested an initial oxidation to U(VI) followed by binding of thebicarbonate to the U(VI) sites of the oxidised layer and later detachment ofthe U(VI)-carbonato surface complex. In their experiments they found dissolu-tion rates in the order of 1.4 µmoles m−2 d−1 of uranium in 1 mM bicarbonatesolutions at 10 C. This means only some 0.1-1 ng of uranium over a 29 yearperiod for particles with sizes found in this investigation (∼ 100 ng). Theparticles formed during the Thule accident are however likely to be ratherdifferent to the spent UO2 fuel, which is of concern in nearly all the publishedreports on UO2 dissolution. The specific surface area (porosity of particles)is probably different (fast cooling after fire at Thule) and also the (U,Pu)O2
chemical structure. Certainly, the particles formed at Thule should be treatedas site-specific particles and be regarded as a unit of their own. Knowledge ontheir dissolution and corrosion rates may only be derived from experimentsconducted with the very same material.
When considering particle dissolution and potential release of weapons plu-tonium, it also has to be considered that over time most of the particles willreach sediment depths where oxic dissolution kinetics may not be applied (eg.the UO2 model by De Pablo et.al. (24) described above), during oxygen de-ficient or anoxic conditions uranium may not become oxidised and thus theparticle dissolution rates may be significantly reduced. Rollin et.al. (23) ob-served UO2 dissolution rates which were a factor of 1000 less under reducingconditions than in oxic conditions with the same bicarbonate concentrationsfor both cases. On the other hand, dissolution rates of plutonium were onlyreduced by a factor of ten in the same experiment.
The leaching of the uranium should be investigated on future expeditions,using the uranium ratios as a water body tracer and try to determined theU/Pu ratio at bottom water at the point of impact to confirm the observationof uranium leaching. However, it could be difficult as sea water contains largeamounts of natural uranium.
5 Conclusions
The source term for the Thule debris consists of more than one source, prob-ably two. In at least one of the sources the main fissile material was 235U(about 4 times more than 239Pu). The study of the hot particles indicates arelationship between leached uranium and the time these particles have beenpresent in the sediments.
16
6 Acknowledgment
The authors would like to acknowledge NKS framework program BOK-2 andthe Royal Physiographic Society for financial support. We will also acknowl-edge Dr. D. H. Oughton and L. Skipperud, M.Sc. at the Agricultural Universityof Norway.
References
[1] Dahlgaard, H., Chen, Q.J., Strup, S., Eriksson, M., Nielsen, S.P., Aarkrog,A., (1999), Plutonium isotope ratios in environmental samples from Thule(Greenland) and the Techa River (Russia) measured by ICPMS andalpha-spectrometry., In: International symposium on marine pollution.Proceedings, Monaco (MC), 5-9 Oct 1998., IAEA-TECDOC-1094, 254-259
[2] Dahlgaard, H., Eriksson, M., Ilus, E., Ryan, T., McMahon, C.A., andNielsen, S.P., (2001), Plutonium in the marine environment at Thule,NW-Greenland after a nuclear weapons accident,In book: Plutonium inthe environment, Ed Kudo, A., Elsevier science, Oxford, UK, 15–30
[3] Sturup, S., Dahlgaard, H., Nielsen, S.C., (1998), High resolution induc-tively coupled plasma mass spectrometry for the trace determination ofplutonium isotopes and isotope ratios in environmental samples., J. Anal.Atom. Spectrom., 13, 1321-1326
[4] Mitchell, P.I.; Len Vintr, L.; Dahlgaard, H.; Gasc, C.; Snchez-Cabeza,J.A., (1997), Pertubation in the 240Pu/239Pu global fallout ratio in lo-cal sediments following the nuclear accidents at Thule (Greenland) andPalomares (Spain)., Sci. Total Environ., 202, 147-153
[5] Komura, K.; Sakanoue, M.; Yamamoto, M.,(1984), Determination of240Pu/239Pu ratio in environmental samples based on the measurementof Lx/α-ray activity ratio, Health Physics, 46, 1213–1219
[6] Arnold. D., and Kolb. W.,(1995), Determination of Plutonium Contentand isotopic Ratios in Environmental Samples by L X-ray and α-ParticleMeasurements, Appl. Radiat. Isot., 46, 1151–1157
[7] Eriksson, M., Dahlgaard, H., Ilus, E., Ryan, T., Chen, Q.J., Holm, E.,Nielsen, S.P., (1999), Plutonium in the marine environment of Thule AirBase, N.W. Greenland. Inventories and distribution in sediments 29 yearsafter the accident. In: Extended abstracts. 4. International conference onenvironmental radioactivity in the Arctic, Edinburgh (GB), 20-23 Sep1999. Strand, P.; Jlle, T. (eds.), (Norwegian Radiation Protection Au-thority, sters, 1999) 60-62
[8] Moring, M., Ikheimonen, T.K., Pllnen, R., Ilus, E., Klemola, S., Juhanoja,J., Eriksson, M., (2001), Uranium and plutonium containing particles in a
17

sea sediment sample from Thule, Greenland. J. Radioanal. Nucl. Chem.,248, 623-627
[9] U.S Response to Denmarks nine Questions, (2000), JP-Documentation,Officialised: 15/8-2000
[10] Eriksson, M., Ljunggren, K., Hindorf, C., (2002), Plutonium Hot ParticleSeparation Techniques using Real-Time Digital Image Systems. In press:Nuclear Instriuments and Methods in Physics Reaserch, Section A.
[11] Holm, E., (1984), Review of alpha-particle spectrometric measurementsof actinides, Int. J. Appl. Rad. Isot., 35 285–290
[12] Hallstadius, L. A.,(1984), A method for the electrodeposition of actinides.Nucl. Instrum. Meth. Phys. Res., 223, 382–385
[13] Eriksson, M., (2002), On weapons plutonium in the arctic environment,Risoe-R-1321(EN).
[14] Talvitie, N. A., (1971), Radiochemical determination of plutonium in en-vironmental and biological samples by ion exchange, Analytical chem-istry, 43, 13, 1827
[15] Hans Otterstrom, at Link Nordiska, Personal comunication (2002)[16] Aarkrog, A., (1971), Radioecological investigation of plutonium in an
arctic marine environment, Health Physics 20 31–47[17] Aarkrog, A., (1977), Environmental behaviour of plutonium accidentally
released at Thule, Greenland, Health Physics 32 271–284[18] Aarkrog, A., (1984), Dahlgaard, H., Nilsson, K., and Holm, E., Further
studies of plutonium and americium at Thule, Greenland, Health Physics46 29-44
[19] Risø-R-550, (1988), Environmental Radioactivity in the North AtlanticRegion Including the Faroe Islands and Greenland. 1986, Risø NationalLaboratory, Denmark
[20] Risø-R-757(EN), (1997), Environmental Radioactivity in the North At-lantic Region Including the Faroe Islands and Greenland. 1992 and 1993,Risø National Laboratory, Denmark
[21] Ikaheimonen, T. K. Ilus, E. Klemola, S., Dahlgaard, H. Ryan, T. Eriks-son, M. (2000) Plutonium and americium in the sediments off the ThuleAir Base, Proceedings in 8th international conference of ”low level mea-surements of actinides and long-lived radionuclides in biological and en-vironmental samples”, Japan
[22] Newton T.W., Sullivan J.C.,(1985) Actinide carbonate complexes inaqueous solutions. In: Handbook on the Physics and Chemistry of theActinides. Eds. Freeman A.J., Keller C., Elsevier
[23] Rollin S., Spahiu K., Eklund U.-B., (2001), Determination of dissolutionrates of spent fuel in carbonate solutions under different redox conditionswith a flow-through experiment. J. Nucl. Materials, 297, 231-243.
[24] De Pablo J., Casas I., Gimenez J., Molera M., Rovira M., Duro L., BrunoJ., (1999), The oxidative dissolution mechanics of uranium dioxide, 1.The effect of temperature in hydrogen carbonate medium. Geochim. et.Cosmochim. Acta, 63:19/20, 3097-3103.
18

Publications not included in the thesis
1. Soaking foodstuff with lye as a countermeasurement to reduce ra-diocaesium, potassium and poloniumM. Eriksson, E. Holm, A. Ravila and P. RoosProceedings at the Den Sjunde Nordiska Radioekologi Konferensen, Reyk-javik, Island, 26 - 29 augusti 1996.
2. Remobilization of plutonium and americium from the sediments inan anoxic fjord: Framvaren fjord, southern NorwayP. Roos, E. Holm, D. Josefsson, M. Eriksson,Published in Per Roos doctoral thesis Studies of actinides in a superanoxicfjord, 4 April 1997
3. A radioanalytical study of radionuclide in a dysoligotrophic lake inSouthern SwedenM. Eriksson, G. Peck, P. Roos, and E. HolmProceedings at the The 5th South Pacific Environmental Radioactivity Asso-ciation Workshop, Christchurch, New Zeeland, 16 - 18 feb 1998.
4. Distribution and circulation of Chernobyl and reprocessing radioac-tivity in the central Arctic OceanD. Josefsson, E. Holm, P. Roos, M. Eriksson, B. Persson, J. SmithPublished in Dan Josefssons doctoral thesis Anthropogenic Radionuclides inthe Arctic Ocean; Distribution and Pathways, 5 June 1998
5. Transuranic elements in the waters of the arctic ocean shelf andinteriorD. Josefsson, E. Holm, P. Roos, M. Eriksson, B. Persson, A. AarkrogPublished in Dan Josefssons doctoral thesis Anthropogenic Radionuclides inthe Arctic Ocean; Distribution and Pathways, 5 June 1998
6. Radionuclides in Mechanical and Chemical (Sulphite) PulpingA. Ravila, M. Eriksson, E. Holm,Published in Aaro Ravilas doctoral thesis Radiocesium in the forest and for-est industry; Studies on the flow, occurrence and technological enhancementof radionuclides in the forest industry with emphasis on the behavior of ra-diocesium, 10 September 1998
7. Radiocaesium in Fucus vesiculosis along the Swedish Coast be-tween 1986-95E. Holm, D. Josefsson, P. Roos, M. ErikssonIn: International Symposium on Marine Pollution, Monaco, 5-9 October 1998,IAEA-TECDOC–1094 (1999), p. 497–499
8. Time-trend in the Deposition of Sellafield Derived Plutonium in theNorth-eastern Skagerrak High Sediment Accumulation Rate AreaP. Roos, E. Holm, P. Hall, M. ErikssonIn: International Symposium on Marine Pollution, Monaco, 5-9 October 1998,IAEA-TECDOC–1094 (1999), p. 557–559
9. Plutonium Isotope Ratios in Environmental Samples from Thule(Greenland) and the Techa River (Russia) measured by ICPMSand α-spectrometryH. Dahlgaard, Q. J. Chen, S. Sturup, M. Eriksson, S. P. Nielsen, A. AarkrogIn: International Symposium on Marine Pollution, Monaco, 5-9 October 1998,IAEA-TECDOC–1094 (1999), p. 254–259
144 Risø–R–1321(EN)

10. Radon and Radium as Tracers for Submarine GroundwaterH. Dahlgaard, C.E. Andersen, M. ErikssonPoster presentation at the 2nd Nordic Marine Sciences Meeting, Hirtshals,Denmark, 2-4 Mars 1999
11. Plutonium in an Arctic marine environment 29 years after theThule accidentH. Dahlgaard, M. Eriksson, E. Ilus, T. Ryan, C. A. McMahon S.P. NielsenIn: Proceedings. Nordic Society for Radiation Protection, 12. Ordinary meet-ing, Skagen (DK), 23-27 Aug 1999. Søgaard-Hansen, J.; Damkjær, A. (eds.),(Risø National Laboratory, Roskilde, 1999) p. 135-138
12. Plutonium contamination of high arctic lakesM. Eriksson, E. Holm, P. Roos, H. DahlgaardProceedings at the The 4th international Conference on environmental ra-dioactivity in the arctic i Edinburgh, Scotland, 20-23 September 1999
13. Plutonium in the marine environment off Thule Air Base, N.W.Greenland. Inventories and distribution in sediments 29 years afterthe accidenet.M. Eriksson, H. Dahlgaard, E. Ilus, T.P Ryan, Q. J. Chen, S. P. Nielsen andA. AarkrogProceedings at the The 4th international Conference on environmental ra-dioactivity in the arctic i Edinburgh, Scotland, 20-23 September 1999
14. The uptake of plutonium by some marine invertebrates in a con-taminated zone of Bylot Sound, Thule, northen GreenlandT.P Ryan, H. Dahlgaard, A.M. Donwdall, D. Pollard, E. Ilus, M. Erikssonand J.D. CunninghamProceedings at the The 4th international Conference on environmental ra-dioactivity in the arctic i Edinburgh, Scotland, 20-23 September 1999
15. Radon and Radium as Tracers for Submarine GroundwaterH. Dahlgaard, C.E. Andersen, M. ErikssonIn: Book of abstracts. ELOISE - European Land-Ocean Interaction Studies3. Open science meeting, Noordwijkerhout (NL), 1-4 Dec 1999. (OrganizingCommittee of the meeting, Noordwijkerhout, 1999) p. 74
16. Radiological Consequence Analysis; for OKG-Project MLA (NewDeposit for Low-Level Radioactive Waste)S.P. Nielsen, K. Brodersen, M. Eriksson and B. LauritzenRisø internal report,(2000)
17. Coastal marine sediment sampling for radionuclide analysisH. Dahlgaard, M. Eriksson, E. Ilusin: Collection and preparation of bottom sediment samples for analysis of ra-dionuclides and trace elements. IAEA TEKDOC xxxx,. Vienna, IAEA. (2000)
18. Radioactivity on the Canadian tundraM. Eriksson and E. HolmCruise report in the ”Svenska Polarforskningssekretariatets arsbok 1999”,2000, p. 172–173
19. Uranium and plutonium containing particles in a sea sediment sam-ple from Thule, GreenlandM. Moring, T. K. Ikaheimonen, R. Pollanen, E. Ilus, S. Klemola, J. Juhanoja,M. ErikssonProceedings at the Marc V Meeting in Kailua-KonaHawaii, 10-14 April 2000
Risø–R–1321(EN) 145

20. Plutonium and americium in the sediments off the Thule Air BaseT.K. Ikaheimonen, E. Ilus, S. Klemola, H. Dahlgaard, T. Ryan and M. Eriks-sonProceedings to 8th international conference of ”low level measurements of ac-tinides and long-lived radionuclides in biological and environmental samples”in Japan, October 2000
21. A Study of Plutonium in different fresh water systemsM. Eriksson, E. Holm, P. Roos and H. DahlgaardNKS technical report, 2000
22. Process-diagnostic patterns of chlorobiphenyl congeners in two ra-diochronologically characterized sediment cores from the northernBaffin BayO. Gustafsson, J. Axelman, D. Broman, M. Eriksson, H. DahlgaardChemosphere, (2001), 45, 759-766
23. Uranium and plutonium containing particles in a sea sediment sam-ple from Thule, GreenlandM. Moring, T.K. Ikaheimonen, R. Pollanen, E. Ilus, S. Klemola, J. Juhanoja,M. ErikssonJ. Radioanal. Nucl. Chem., (2001), 248 , 623-627
24. Plutonium in Temperate and Arctic LakesM. Eriksson, E. Holm, P. Roos and H. DahlgaardIn: Plutonium in the EnvironmentKudo, A (Ed). Environmental Radioactivity Series 1. 2000. UK, Elsevier Sci-ence Ltd. 2nd International Symposium, 2001, 293–303
146 Risø–R–1321(EN)


Bibliographic Data Sheet Risø–R–1321(EN)
Title and author(s)
On Weapons Plutonium in the Arctic Environment(Thule, Greenland)
Mats Eriksson
ISBN
87–550–3006–8;87–550–3007–6 (Internet)
ISSN
0106–2840
Dept. or group
Radiation Research Department
Date
April, 2002
Groups own reg. number(s) Project/contract No.
Sponsorship
Pages
148
Tables
20
Illustrations
39
References
173Abstract (Max. 2000 char.)
This thesis concerns a nuclear accident that occurred in the Thule (Pituffik) area, NW Greenland
in 1968, called the Thule accident. Results are based on different analytical techniques, i.e.
gamma spectrometry, alpha spectrometry, ICP-MS, SEM with EDX and different models, i.e.
(CRS, CIC). The scope of the thesis is the study of hot particles. Studies on these have shown
several interesting features, e.g. that they carry most of the activity dispersed from the accident,
moreover, they have been very useful in the determination of the source term for the Thule
accident debris.
Paper I, is an overview of the results from the Thule-97 expedition. This paper concerns the
marine environment, i.e. water, sediment and benthic animals in the Bylot Sound. The main
conclusions are; that plutonium is not transported from the contaminated sediments into the
surface water in this shelf sea, the debris has been efficiently buried in the sediment to great
depth as a result of biological activity and transfer of the plutonium to benthic biota is low.
Paper II, concludes that the resuspension of accident debris on land has been limited and indi-
cations were, that americium has a faster transport mechanism from the catchment area to lakes
than plutonium and radio lead.
Paper III, is a method description of inventory calculation techniques in sediment with hetero-
geneous activity concentration, i.e. hot particles are present in the samples. It is concluded that
earlier inventory estimates have been under estimated and that the new inventory is about 3.8
kg (10 TBq) of 239,240Pu.
Paper IV, describes hot particle separation/identification techniques using real-time digital image
systems. These techniques are much faster than conventionally used auto radiography and give
the results in real time.
Paper V, is a study of single isolated hot particles. The most interesting result is that the fission
material in the weapons involved in the accident mostly consisted of 235U (about 4 times more
in mass than 239Pu). This paper concludes that there are at least two different source terms for
the Thule accident debris. Another interesting feature is that it seems like uranium is leaching
from the particles faster than plutonium and americium.
Descriptors
Environmental radioactivity, nuclear accident, Thule, Greenland, Bylot Sound, radionuclide, plu-
tonium, uranium, americium, fallout, source term, inventory, isotopic ratio, separation technique,
hot particle, heterogeneous activity concentration, gamma spectrometry, alpha spectrometry,
ICP-MS, SEM, realtime digital image systems
Available on request from:Information Service Department, Risø National Laboratory(Afdelingen for Informationsservice, Forskningscenter Risø)P.O. Box 49, DK–4000 Roskilde, DenmarkPhone (+45) 46 77 46 77, ext. 4004/4005 · Fax (+45) 46 77 40 13E-mail: [email protected]

Mission To promote an innovative and environmentally sustainable technological development within the areas of energy, industrial technology and bioproduction through research, innovation and advisory services.
Vision Risøs research shall extend the boundaries for the understanding of natures processes and interactions right down to the molecular nanoscale. The results obtained shall set new trends for the development of sustainable technologies within the fields of energy, industrial technology and biotechnology. The efforts made shall benefit Danish society and lead to the development of new multi-billion industries. ISBN 87-550-3006-8 ISBN 87-550-3007-6 (Internet) ISSN 0106-2840 Copies of this publication are available from Risø National Laboratory Information Service Department P.O. Box 49 DK-4000 Roskilde Denmark Telephone +45 4677 4004 [email protected] Fax +45 4677 4013 Website www.risoe.dk