once in a blue moon: detection of ‘bluing’ during debris...
TRANSCRIPT

This is a repository copy of Once in a blue moon: detection of ‘bluing’ during debris transitsin the white dwarf WD 1145+017.
White Rose Research Online URL for this paper:http://eprints.whiterose.ac.uk/117697/
Version: Accepted Version
Article:
Hallakoun, N., Xu, S., Maoz, D. et al. (16 more authors) (2017) Once in a blue moon: detection of ‘bluing’ during debris transits in the white dwarf WD 1145+017. Monthly Notices of the Royal Astronomical Society, 469 (3). pp. 3213-3224. ISSN 0035-8711
https://doi.org/10.1093/mnras/stx924
[email protected]://eprints.whiterose.ac.uk/
Reuse
Unless indicated otherwise, fulltext items are protected by copyright with all rights reserved. The copyright exception in section 29 of the Copyright, Designs and Patents Act 1988 allows the making of a single copy solely for the purpose of non-commercial research or private study within the limits of fair dealing. The publisher or other rights-holder may allow further reproduction and re-use of this version - refer to the White Rose Research Online record for this item. Where records identify the publisher as the copyright holder, users can verify any specific terms of use on the publisher’s website.
Takedown
If you consider content in White Rose Research Online to be in breach of UK law, please notify us by emailing [email protected] including the URL of the record and the reason for the withdrawal request.

MNRAS 000, 1–12 (2017) Preprint 14 April 2017 Compiled using MNRAS LATEX style file v3.0
Once in a blue moon: detection of ‘bluing’ during debris transits in
the white dwarf WD 1145+017
N. Hallakoun,1,2⋆ S. Xu (许偲艺),2 D. Maoz,1 T. R. Marsh,3 V. D. Ivanov,4,2
V. S. Dhillon,5,6 M. C. P. Bours,7 S. G. Parsons,5 P. Kerry,5 S. Sharma,8 K. Su,9
S. Rengaswamy,10 P. Pravec,11 P. Kušnirák,11 H. Kučáková,12 J. D. Armstrong,13,14
C. Arnold,13 N. Gerard13 and L. Vanzi15
1School of Physics and Astronomy, Tel-Aviv University, Tel-Aviv 6997801, Israel2European Southern Observatory, Karl-Schwarzschild-Straße 2, D-85748 Garching, Germany3Department of Physics, University of Warwick, Coventry CV4 7AL, UK4European Southern Observatory, Ave. Alonso de Córdova 3107, Vitacura, Santiago, Chile5Department of Physics and Astronomy, University of Sheffield, Sheffield S3 7RH, UK6Instituto de Astrofísica de Canarias, E-38205 La Laguna, Santa Cruz de Tenerife, Spain7Departmento de Físico y Astronomía, Universidad de Valparaíso, Avenida Gran Bretaña 1111, Valparaíso, Chile8Aryabhatta Research Institute of Observational Sciences, Nainital 263001, India9Steward Observatory, University of Arizona, 933 North Cherry Avenue, Tucson, AZ 85721, USA10Indian Institute of Astrophysics, Koramangala 2nd Block, Bengaluru 560034, India11Astronomical Institute, Academy of Sciences of the Czech Republic, Fričova 1, 25165 Ondřejov, Czech Republic12Astronomical Institute of the Charles University, Faculty of Mathemathics and Physics, V Holešovičkách 2, 180 00 Praha 8, Czech Republic13University of Hawaii, Institute for Astronomy, 34 Ohia Ku Street, Pukalani, Hawaii 96768, USA14Las Cumbres Observatory Global Telescope Network, Inc. 6740 Cortona Drive Suite 102, Goleta, CA 93117, USA15Department of Electrical Engineering and Center of Astro Engineering, Pontificia Universidad Católica de Chile, Av. Vicuña Mackenna 4860,
Santiago 7820436, Chile
Accepted XXX. Received YYY; in original form ZZZ
ABSTRACT
The first transiting planetesimal orbiting a white dwarf was recently detected in K2 data ofWD 1145+017 and has been followed up intensively. The multiple, long, and variable transitssuggest the transiting objects are dust clouds, probably produced by a disintegrating asteroid.In addition, the system contains circumstellar gas, evident by broad absorption lines, mostlyin the u’-band, and a dust disc, indicated by an infrared excess. Here we present the firstdetection of a change in colour of WD 1145+017 during transits, using simultaneous multi-band fast-photometry ULTRACAM measurements over the u’g’r’i’-bands. The observationsreveal what appears to be ‘bluing’ during transits; transits are deeper in the redder bands, witha u′ − r′ colour difference of up to ∼ −0.05 mag. We explore various possible explanations forthe bluing. ‘Spectral’ photometry obtained by integrating over bandpasses in the spectroscopicdata in- and out-of-transit, compared to the photometric data, shows that the observed colourdifference is most likely the result of reduced circumstellar absorption in the spectrum duringtransits. This indicates that the transiting objects and the gas share the same line-of-sight,and that the gas covers the white dwarf only partially, as would be expected if the gas, thetransiting debris, and the dust emitting the infrared excess, are part of the same general discstructure (although possibly at different radii). In addition, we present the results of a week-longmonitoring campaign of the system.
Key words: stars: individual: WD 1145+017 – white dwarfs – minor planets, asteroids: general– techniques: photometric – eclipses
⋆ E-mail: [email protected]
1 INTRODUCTION
Over 95 per cent of all stars will end their lives as white dwarfs(WDs; Althaus et al. 2010). As the majority of Sun-like stars host
© 2017 The Authors
arX
iv:1
702.
0548
3v2
[as
tro-
ph.E
P] 1
3 A
pr 2
017

2 N. Hallakoun et al.
planets (e.g. Winn & Fabrycky 2015; Shvartzvald et al. 2016), thefate of planetary systems can be studied by examining the immediatesurroundings of WDs (Veras 2016). Recent studies show that about25-50 per cent of all WDs exhibit ‘pollution’ – traces of heavy ele-ments in their atmospheres (Zuckerman et al. 2003, 2010; Koesteret al. 2014). The most heavily polluted WDs also have dust discswithin their tidal radii, indicated by excess infrared (IR) radiationemitted by the dust, which feed the host WD with heavy elements(e.g. Kilic et al. 2006). Since the strong surface gravity of a WDcauses all heavy elements to settle quickly below the photosphere,pollution in WDs cooler than ∼ 20, 000 K is a strong indication forexternal accretion, likely from planetary debris (Jura 2003; Koesteret al. 2014). However, the object (or objects) supplying the accretingmaterial, until recently, had not been directly observed.
Recently, the first direct evidence of a planetary-mass body or-biting a WD was found using data from the Kepler extended mission(K2) (Vanderburg et al. 2015). The light curves of WD 1145+017 ac-quired from K2 and from follow-up observations revealed multipletransit events with varying durations, depths, and shapes, interpretedto indicate the presence of a disintegrating asteroid orbiting the WD(Vanderburg et al. 2015; Croll et al. 2017; Gänsicke et al. 2016; Rap-paport et al. 2016; Alonso et al. 2016; Zhou et al. 2016; Gary et al.2017). The transits exhibit several features which suggest that theyare caused by dust clouds emitted by the asteroidal fragments, ratherthan by the fragments themselves: The transit durations (3−50 min)are longer than expected for a solid object (∼ 1 min); the shape ofthe transits is asymmetric; and the transit depths are variable andlarge (∼ 10 − 60 per cent). Although the K2 light curve has shownsix stable periods, ranging from 4.5 to 5.0 hours, the follow-up ob-servations have detected only the shortest, ∼ 4.5 h, period (with theexception of Gary et al. 2017, see Appendix B). Recent simulationssuggest a differentiated parent asteroid orbiting within the tidal dis-ruption radius for mantle-density material (Veras et al. 2017). Thelight curve changes on a daily basis, completely altering its appear-ance after a few months, indicating the system is rapidly evolving.
High-resolution spectroscopic observations of the system re-vealed photospheric absorption lines from 11 heavy elements (Xuet al. 2016), showing that the WD belongs to the ‘polluted’ class thatis actively accreting circumstellar material. The composition of theaccreted material is similar to that of rocky objects within the solarsystem. Consistent with its heavily polluted atmosphere, this systemalso shows near-IR (NIR) excess from a dust disc (Vanderburg et al.2015). In addition, WD 1145+017 is surrounded by circumstellargas, evident by numerous, unusually broad (∼ 300 km s−1), absorp-tion lines in its spectrum (Xu et al. 2016). The overall shape of thecircumstellar lines changes on a monthly timescale and their depthscan also change during transits (Redfield et al. 2016, Xu et al., inpreparation).
Since the transiting debris1 may consist of particles smallenough to be called ‘dust’, and dust extinction depends on the grain-size to wavelength ratio and on the grain composition (Bohren &Huffman 1983), simultaneous monitoring in different bands mightreveal its properties. Previous studies have not found a significantdependence of transit depth on wavelength, thus constraining thegrain size to & 0.8 µm (Croll et al. 2017; Alonso et al. 2016; Zhouet al. 2016). In this paper we present the first detection of colour
1 By ‘debris’ we mean the solid material, whether planetesimals or largedust grains, that produces the transits. The relation is still not clear betweenthis material and the ‘dust disc’ whose presence has been deduced from theNIR excess in this object (Vanderburg et al. 2015).
changes during transit in the light curve of WD 1145+017, usingmulti-band fast-photometry obtained simultaneously in the u’- g’-and r’/i’-bands. Surprisingly, the light curves feature ‘bluing’, ratherthan reddening, during transits (i.e. transits are deeper in the redderbands than in the u’-band). The ULTRACAM observations are pre-sented in Section 2. In Section 3 we explore possible explanationsfor this phenomenon, and in Section 4 we discuss the implicationson the configuration of the system. Appendix A provides more de-tails regarding the observing conditions during the ULTRACAMrun. Appendix B presents the light curve evolution, as observedduring our week-long observing campaign by a collection of tele-scopes around the globe, combined with the months-long light curveprovided by Gary et al. (2017).
2 ULTRACAM OBSERVATIONS AND DATA ANALYSIS
We obtained multi-band fast photometry using ULTRACAM(Dhillon et al. 2007), a visitor instrument mounted on the Euro-pean Southern Observatory (ESO) 3.6 m New Technology Tele-scope (NTT) at the La Silla Observatory, Chile, under Programme097.C-0829 (PI: Hallakoun). Due to the weather conditions we wereable to observe only on two of our six awarded nights (2016 April21 and 26), covering almost 1.5 cycles (∼ 6.7 h) each night. Al-though there were some passing clouds during the observations,they were mostly out-of-transit and did not have a significant ef-fect on the shape of the light curve due to the relative nature ofthe observations (see Appendix A, which also describes the obser-vational errors, for details). ULTRACAM is a high-speed cameracapable of obtaining fast photometry of faint objects in three bandssimultaneously with a negligible dead time (∼ 25 ms) between ex-posures. We used SDSS u’, g’, and r’ filters on the first night, andu’, g’, and i’ filters on the second night. The CCD was windowed toachieve 5 s exposure times in the slow readout mode (except in theu’-band, where 10 s exposures were obtained). The data were biasand flat-field corrected using the UTLRACAM pipeline (Dhillonet al. 2007), which was then used to obtain aperture photometryof the target, using a nearby star as a reference. The light curve ineach band was divided by a parabolic fit to its out-of-transit parts, toeliminate any systematics due to atmospheric extinction in the pres-ence of colour differences between the WD and the reference star.Only the most featureless parts of the light curves were chosen asthe out-of-transit intervals (see Figs A1 and A2). The same intervalswere used in all bands. The aperture size was scaled according tothe varying full width at half-maximum of the stellar profile. Figs 1and 2 show the reduced differential photometry from the two nights.
Table 1 lists the mean transit depths of the main features inthe ULTRACAM light curves. The observed mean transit depth, D,was measured by integrating over the in-transit light curve:
D = 1 −1∆t
∑
i∈ transit
fidti (1)
where ∆t is the transit duration, f is the normalised flux, and dt
is the sample interval. As seen in Figs 1 and 2, our ULTRACAMobservations reveal a clear colour difference between the in- andout-of-transit photometry (u′ − r′ ∼ −0.05 mag). Although this isonly a 2-3σ detection, the fact that it occurred only during transitsreinforces its significance. Surprisingly, the observed colour differ-ence indicates ‘bluing’, manifested by deeper transits in the redderbands, and not the usual reddening observed in dusty environments.
MNRAS 000, 1–12 (2017)

WD 1145+017: Bluing 3
0.6
0.8
1A2 A1 A2
Rela
tiv
e f
lux
u'
g'
r'
0 50 100 150 200 250 300 350
t [min]
-0.2
-0.1
0
0.1
u'-r'
-0.2
-0.1
0
0.1
u'-g'
-0.2
-0.1
0
0.1
g'-r'
Figure 1. Top: ULTRACAM light curve from 2016 April 21, in u’- (blue), g’- (green), and r’-band (red), binned to an effective exposure time of 20 s. Bottom:colour indices, as marked (black solid line). The dashed lines indicate the 1σ (red) and 3σ (green) levels. The labels above the dips denote dips which share acommon period. Note the 2-3σ detection of bluing during transits only, as evidenced by negative values of u′ − g′ and u′ − r′.
0.6
0.7
0.8
0.9
1A1 A2 B A1
Rela
tive f
lux
u'
g'
i'
0 50 100 150 200 250 300 350
t [min]
-0.1-0.05
00.05
u'-i'
-0.1-0.05
00.05
u'-g'
-0.1-0.05
00.05
g'-i'
Figure 2. Same as Fig. 1, for 2016 April 26, with i’-band instead of r’-band. Note the significant evolution of the light curve in merely five nights: the changein the shape of the ‘A1’ and ‘A2’ dips, and the appearance of the ‘B’-dip (see Appendix B).
Table 1. Mean transit depth of the dip-features that appear in the ULTRACAM light curves, in the u’g’r’i’-bands, calculated using equation 1. The transit depthwas averaged over the entire dip-group transit duration, ∆t.
Dip Transit time (UT) ∆t [min] Du′ Dg′ Dr′ Di′
A12016-04-22 02:59:44-04:08:55 69.2 12.07% ± 0.26% 12.277% ± 0.091% 12.95% ± 0.11% —
2016-04-26/27 23:49:59-00:50:47 60.8 8.81% ± 0.17% 9.724% ± 0.057% — 9.79% ± 0.11%2016-04-27 04:21:27-05:19:08 57.7 10.50% ± 0.21% 9.936% ± 0.069% — 10.38% ± 0.12%
A22016-04-22 00:28:03-00:55:05 27.0 13.72% ± 0.41% 14.77% ± 0.14% 15.32% ± 0.18% —2016-04-22 04:58:25-05:20:54 22.5 17.93% ± 0.48% 18.62% ± 0.17% 18.90% ± 0.21% —2016-04-27 01:49:55-02:28:42 38.8 14.54% ± 0.20% 15.221% ± 0.069% — 15.90% ± 0.12%
B 2016-04-27 03:14:25-03:28:04 13.6 9.14% ± 0.38% 9.85% ± 0.13% — 10.60% ± 0.22%
MNRAS 000, 1–12 (2017)

4 N. Hallakoun et al.
Figure 3. Transit configurations, using R2/R1 = 2. Left: the minimal impactparameter required for bluing, b = R2/R1; right: the configuration yieldingthe maximal amount of bluing, b = R2/R1 + 0.5. The illustrations use theu’-band limb-darkening profile.
Figure 4. Limb-darkening simulation. From top to bottom: u’-band transitdepth, i’-band transit depth, i’-band to u’-band transit depth ratio, and u’-i’-band colour index, as a function of the projected distance of the WD centrefrom the edge of the occulting disc at the time of mid-transit. The solidlines corresponds to different R2/R1 values (see legend). The blue-shadedareas in the top two plots mark the approximate observed transit depth range(20-50 per cent), while in the bottom plot it marks the 1 to 3σ range of thecolour detection (−0.06 ≤ u′ − i′ ≤ −0.02 mag). The dashed red lines markthe bluing threshold (Di′/Du′ > 1, u′ − i′ < 0). The maximal amount ofbluing produced by limb darkening is much smaller than observed, and itsrequired transit configuration cannot explain the observed transit depths.
3 POSSIBLE BLUING MECHANISMS
The cause of the blue flux excess during transit could be some prop-erty of the surface of the WD itself, some property of the obscuringmaterial, or some other component or configuration of the circum-stellar environment. We investigate below several possibilities.
3.1 Bluing: limb darkening?
Since the limb of a WD is cooler and redder than its centre, a tran-siting object that obscures mainly the limb might explain the deepertransits observed in the redder bands. To test this assumption, wecalculated the expected transit depths in the u’- and i’-band, over agrid of R2/R1 and b values, where R2/R1 is the ratio of the radius
of the occulting object (assumed, for simplicity, to be of circularcross section) to the radius of the WD, and b = (a/R1) cos i is theimpact parameter, where i is the orbital plane’s inclination to theline of sight, and a is the orbital separation between the centres ofthe WD and the transiting object. We estimated the limb-darkeningprofiles for WD 1145+017’s effective temperature and surface grav-ity (Teff = 15900 K, log g = 8, see Vanderburg et al. 2015) usingClaret’s limb-darkening coefficients for hydrogen-dominated DA-type WDs, as calculated by Gianninas et al. (2013). The coefficientsused were 0.73, −0.53, 0.67, and −0.27 for the u’-band, and 0.61,−0.40, 0.34, and −0.12 for the i’-band. Fig. 3 illustrates two simu-lated configurations. Fig. 4 shows the calculated i’- to u’-band transitdepth ratio, Di′/Du′ , and the u’-i’-band colour index during transit,all as a function of the projected distance of the WD centre fromthe edge of the occulting disc, b− R2/R1, at the time of mid-transit.The WD was modelled as a disc divided into 1000 concentric an-nuli, while the occulting object was modelled as a uniformly opaquedisc. The results indicate a small amount of bluing for b & R2/R1,with a maximum at b = R2/R1 + 0.5. The expected u’-i’-bandcolour index for the system configuration with the maximal amountof bluing (∼ −0.006 mag), misses the observed amount of bluing(∼ −0.05 mag) by an order of magnitude. Thus, while some bluingcan be achieved with a grazing transit, covering only the limb of theWD, it is not sufficient. In addition, the ∼ 0.4 transit depth requiresthe occulting object to cover a significant portion of the more centralparts of the WD disc, in contrast to the grazing scenario. Replacingthe opaque disc used to model the occulting object by a disc withvarying opacity will further reduce the amount of bluing, aggravat-ing the problem. We should note that the limb-darkening profilesused here are for DA-type WDs, while WD 1145+017 is a metal-polluted helium-dominated DBAZ-type WD. Although the effectthis difference might have on the limb-darkening profiles requiresfurther investigation, it seems unlikely to provide a limb-darkeningsolution to the problem.
3.2 Bluing: peculiar dust properties?
Although bluing by dust is rare, it is possible. After the 1883 eruptionof the Krakatoa volcano there were reports of a blue moon and aviolet sun (Bohren & Huffman 1983). Bluing by dust is common onMars, where blue sunsets have been captured by NASA’s Curiosityrover camera2. Bluing by dust is possible only for specific andnarrow distributions of grain sizes, such as the one observed onMars (Fedorova et al. 2014).
Following Hansen (1971) and Hansen & Travis (1974), wedefine the effective radius of a distribution of dust grains, reff, whichis the mean grain radius weighted by its geometrical cross section,
reff =
∫ ∞
0 rπr2n (r) dr∫ ∞
0 πr2n (r) dr
, (2)
and the dimensionless effective variance, veff,
veff =
∫ ∞
0 (r − reff)2 πr2n (r) dr
r2eff
∫ ∞
0 πr2n (r) dr
, (3)
where n (r) is the grain-size distribution. Grain-size distributionssharing the same effective radius and variance display the same scat-tering characteristics (Hansen 1971). We use the ‘standard’ grain
2 http://www.jpl.nasa.gov/spaceimages/details.php?id=
pia19400
MNRAS 000, 1–12 (2017)

WD 1145+017: Bluing 5
size distribution of Hansen (1971),
n (r) ∝ r(1−3veff)
veff e− r
reffveff , (4)
which is characterised by the effective radius and variance. Themean extinction cross-section of the grain-size distribution is then(Croll et al. 2014, eq. 3):
σext (rmin, rmax, λ) =
∫rmax
rminn (r ′)σext (r
′, λ) dr ′
∫rmax
rminn (r ′) dr ′
, (5)
where σext (r′, λ) is the extinction cross-section as a function of the
grain size and the wavelength.We calculated the mean extinction cross-section as a function
of wavelength for grain-size distributions of effective radii rangingbetween 0.5 and 10 µm, with effective variance of 0.1. The extinc-tion cross-sections were calculated using a Matlab implementationof the Mie scattering code of Bohren & Huffman (1983, appendixA). We used the ‘astronomical silicate’ refractive index of Draine(2003)3. In the wavelength range λ = 3000 − 9000 , n, the realcomponent of this refractive index, varies between 1.69 and 1.73,while the imaginary part, k, varies between 0.029 and 0.031. Theeffective radius serves as a good characterising parameter for thegrain-size distribution, as long as πreff (n − 1) & λ (Hansen 1971),i.e. for reff & 0.4 µm. Figs 5 and 6 compare the mean transit depthas measured in the various bandpasses for the two ‘A2’ transits ontwo nights (see Figs 1 and 2, and Table 1), with extinction cross-section curves for various effective radii. The extinction curves werescaled to match the g’-band measurement. Different appearances ofdifferent dip-groups have different mean transit depth slopes. Thetwo ‘A2’ dips chosen here both have a significant transit depth(hence a good signal-to-noise ratio) and were measured at relativelylow airmasses (minimizing possible systematics due to atmosphericextinction; see Figs A1 and A2).
We see that the observed level of inter-band bluing can, inprinciple, be achieved by invoking particular narrow grain-size dis-tributions, such as the calculated ∼ 0.8−2 µm-grain-size extinctioncurves. These curves can simultaneously match the mean transitdepth measured in all bands, but with a rather poor fit that deviatesat the 1 − 2σ level. Other possible compositions have refractiveindices similar to that of the silicate, except iron (Croll et al. 2014).Replacing the ‘astronomical silicate’ dust with a pure iron compo-sition (1.67 ≤ n ≤ 2.96, 1.99 ≤ k ≤ 3.58, see Johnson & Christy1974)4 results in an even worse match. Thus, although they cannotbe completely ruled out, peculiar dust properties appear unlikelyto be the explanation for the observed bluing during transits inWD 1145+017, especially considering that at least some of the blu-ing must be the result of circumstellar absorption lines, as detailedbelow. A wider wavelength coverage, that includes the IR, mightbetter constrain the particle size.
3.3 Bluing: circumstellar lines?
WD 1145+017 displays unique broad absorption lines induced bycircumstellar gas (Xu et al. 2016). When observed spectroscopicallyduring transits, these lines occasionally appear shallower (Redfield
3 See https://www.astro.princeton.edu/~draine/dust/dust.
diel.html and ftp://ftp.astro.princeton.edu/draine/dust/
diel/callindex.out_silD03.4 M. N. Polyanskiy, “Refractive index database”, http:
//refractiveindex.info
3000 4000 5000 6000 7000 8000 9000Wavelength [Å]
0.125
0.13
0.135
0.14
0.145
0.15
0.155
Mea
n tr
ansi
t dep
th
r'g'u'
0.5 µm0.8 µm1.0 µm2.0 µm5.0 µm
Figure 5. The mean transit depth in u’-, g’-, and r’-bands (black errror bars)for the first ‘A2’ dip in the ULTRACAM light curve from 2016 April 21.The filter bandpasses are shown below each errorbar. The coloured curvescorrespond to the extinction cross-section curves of ‘astronomical silicate’for various effective grain radii (see legend), all scaled to fit the g’-bandmeasurement. The curves for ∼ 0.8 − 2µm-sized grains can match theobserved bluing, but rather marginally.
3000 4000 5000 6000 7000 8000 9000Wavelength [Å]
0.135
0.14
0.145
0.15
0.155
0.16
Mea
n tr
ansi
t dep
th
i'g'u'
0.5 µm0.8 µm1.0 µm2.0 µm5.0 µm
Figure 6. Same as Fig 5, for the ‘A2’ dip in the ULTRACAM night from2016 April 26, and with i’-band instead of r’-band.
et al. 2016, Xu et al., in preparation). Interestingly, most of theselines populate the u’-band range (∼ 3257−3857 , see Fig. 7). Hence,the u’-band excess during transits might be explained by the reducedcircumstellar absorption along the line-of-sight.
To test this assumption, we have used in- and out-of-transitspectra, integrated over the various photometric bandpasses, to cal-culate ‘spectral’ photometry measurements in the u’-, g’-, r’-, andi’-bands. The spectra were obtained using X-SHOOTER on theESO Very Large Telescope (VLT) on 2016 March 29, under Di-rector’s Discretionary Time Programmes 296.C-5024 (PI: Xu) and296.C-5014 (PI: Farihi; see Redfield et al. 2016 for details). Thewide wavelength range of X-SHOOTER (3000 to 10,000 ) providessimultaneous coverage of the u’-i’-bands in a single exposure. The
MNRAS 000, 1–12 (2017)

6 N. Hallakoun et al.
3200 3300 3400 3500 3600 3700 3800Wavelength [Å]
0.20.40.60.8
11.2
Nor
mal
ised
flu
x
5600 5800 6000 6200 6400 6600 6800Wavelength [Å]
0.20.40.60.8
11.2
Nor
mal
ised
flu
x
Figure 7. Top: Normalised averaged Keck/HIRES spectrum from 2015 April 11 over the u’-band range (Xu et al. 2016). Note the increasing density ofcircumstellar absorption lines toward the UV side of the spectrum. Bottom: Normalised averaged VLT/X-SHOOTER spectrum from 2016 March 29, over ther’-band range. The blue ticks mark the photospheric absorption lines (other features are telluric).
out-of-transit spectrum used here was taken at 03:37 (UT), while thein-transit spectrum is from 04:37 (UT), both with 280 s and 314 sexposures in the UVB and VIS arms, respectively. The spectra weresmoothed using 5-point span robust local regression (RLOWESS)to get rid of spurious outlier points resulting from imperfect skysubtraction. Since we are interested in the spectral changes result-ing solely from the circumstellar lines, the in-transit spectrum wasscaled to fit the out-of-transit spectrum’s continuum level. Finally,both spectra were integrated over the various ULTRACAM band-passes and the colours were calculated (indicated by the star-shapesymbols in Fig. 8).
For a comparison, we integrated the various colour measure-ments of the ULTRACAM light curves over 314 s intervals centredaround the main transit features. From the light curves publishedby Gary et al. (2017, see Appendix B below), we can associate thetransit detected in the X-SHOOTER data with the ‘A1’ dips seenin the ULTRACAM light curves (see Appendix B). However, as isevident from the significant changes that this group of dips under-goes within a few hours, we do not expect that the transit detectedby X-SHOOTER about a month earlier will match exactly our Aprilobservations. A deeper transit implies a larger obscured area, whichis likely to induce a more significant colour change. This is hintedat in Fig. 8, where there appears to be a correlation between themean transit depth (indicated by the colour-code) and the observedcolour difference.
Taking all of these considerations into account, there seemsto be a relatively good agreement between the photometric and‘spectral’ colour differences. Moreover, repeating the spectral pho-tometry calculation for two out-of-transit epochs (as well as twoin-transit epochs) revealed no significant colour difference betweenthe epochs, as expected.
To investigate more directly whether the change in absorptiondepth is responsible for the bluing seen in the spectral photometry,we have estimated whether the total absorption equivalent width(EW) over the u’-band range is indeed significant. Fig. 7 (top) showsthe u’-band range of the WD 1145+017 spectrum taken by Xu et al.(2016) using the HIgh-Resolution Echelle Spectrometer (HIRES)on the Keck 10 m telescope (Vogt et al. 1994). This spectrum isthe average of three 2400 s exposures taken on 2015 April 11 (seeXu et al. 2016 for further details). The spectrum has been dividedby a parabolic fit to line-free regions in the redder parts of the u’-
band in the spectrum. The total u’-bandpass-weighted absorptionequivalent width (EW) is& 34 , with a relative absorption of& 8 percent over the u’-bandpass. This is a lower limit on the EW, as it isclear that, as one approaches the ultraviolet, line blanketing setsin, the absorptions overlap, and the true continuum level couldbe significantly above the observed flux levels. The true total EWcould easily be a factor 2 higher. However, this possibility cannotbe tested directly using the HIRES spectra because the wavelengthresponse calibration of the spectra is not accurate to the few-percentlevels required for such a comparison. Furthermore, the activitylevel of the system has increased significantly during the year thathas passed between the HIRES observations of Xu et al. (2016)and our ULTRACAM run, both in terms of transit depth (see fig.10 of Gary et al. 2017) and circumstellar line strength (Redfieldet al. 2016, Xu et al., in preparation). Indeed, a similar Keck/HIRESspectrum from April 2016 (Xu et al., in preparation) shows that thetotal u’-bandpass-weighted EW has grown to at least 50 , with arelative absorption of & 11 per cent.
In addition, a preliminary analysis of line strength variationsin- and out-of-transit of a single, strong, visual-band circumstellarabsorption line, Fe ii 5169 , shows that during the deepest transits,the line depth can decrease by up to ∼ 30 per cent (Xu et al., inpreparation). If the relative absorption by circumstellar lines in theu’-band is, say, 12 per cent, then a 30 per cent reduction in EWduring transit could yield the observed 0.04 mag change in colourbetween the u’-band and some other band (e.g. the r’-band, seeFig. 7, bottom) that has relatively few absorptions.
The above tests argue that reduced circumstellar absorptionduring transits is the most plausible explanation for the observedbluing. The fact that previous studies (Croll et al. 2017; Alonsoet al. 2016; Zhou et al. 2016) did not observe wavelengths shorterthan 4800 , could explain why they did not detect bluing. However,this conclusion is not definitive because of the various compli-cations: the difficulty in establishing the continuum level in theu’-band and hence the total absorption EW, and the variance of theline strength change during transits. Future colour measurements inbands having a high density of circumstellar absorption lines shouldtake this into account. Simultaneous photometric and spectroscopicmeasurements would provide a clearer understanding of the bluingmechanism.
MNRAS 000, 1–12 (2017)

WD 1145+017: Bluing 7
Figure 8. Demonstration of the circumstellar gas-induced bluing us-ing VLT/X-SHOOTER spectra: Photometric (error bars) and ‘spectral’(star-shape symbols) colour differences in- and out-of-transit, for variouscolour indices. The ‘spectral’ colour measurements were performed on X-SHOOTER spectra obtained on 2016 March 29 (see Section 3.3 for details).The error bars are colour-coded by the corresponding mean transit depth (thebluer the deeper). The lower panels show the g’-band ULTRACAM lightcurves from 2016 April 21 (middle) and 2016 April 26 (bottom), binnedto an effective exposure time of 20 s. The highlighted areas correspond tothe integrated time intervals, with colours matching those of the top panelerror bars. The photometry derived from the spectra broadly reproduces thebluing and the trends seen in the photometric transit data.
4 DISCUSSION
Assuming that the bluing that we have observed during transitsin WD 1145+017 is the result of a reduced absorption by the cir-cumstellar gas during transit, we can constrain the possible config-urations of the components of the system. First, the fact that thecircumstellar absorption is affected by the transits implies that atleast part of the absorbing gas shares the same plane as the transitingobjects. Second, we can constrain the location of the gas relative tothe WD and the transiting objects. Based on the observed bluingalone, without taking into account further constraints (see below),the circumstellar absorbing gas could be between the WD and thetransiting objects, in front of both the WD and the debris, or a com-bination of the two (e.g. if the WD and the debris are embedded inthe gas).
In the case that the gas is between the transiting objects andthe WD, the gas cannot cover the WD uniformly; the reduction inthe relative absorption depth during transit means that the debris
is occulting more of the WD’s line-absorbed light than the unab-sorbed WD continuum emission (e.g. as in the geometry of a flatdisc around the WD). Alternatively, the gas could be outside thedebris’ orbit, i.e. in front of both the debris and the WD. If theabsorption lines are in the linear regime of their curve of growth,then no change in relative absorption depth would be expected un-less, again, the gas does not cover the WD uniformly. In the third,‘embedded’, possibility, at least some of the gas, whether in frontor between the WD and the debris, must again cover the WD non-uniformly. One configuration satisfying all of these constraints is acircumstellar gas disc, coplanar with the debris orbit. The transits,the circumstellar lines, and the NIR excess, could be manifesta-tions of the same general disc structure consisting of gas, dust, andplanetesimal debris, although not necessarily all at the same radii.
If we take into account the spectroscopic and NIR observationsas well, we can further constrain the possible configurations of thesystem. The out-of-transit depth of the circumstellar absorptionlines is consistent with the non-uniform coverage constraint. Thesignificant broadening of the circumstellar lines (Xu et al. 2016;Redfield et al. 2016, Xu et al., in preparation) could be the resultof the line-of-sight velocities of gas in a mildly-eccentric edge-ondisc, in a close-in orbit between the WD and the transiting objects(Redfield et al. 2016). Rappaport et al. (2016) have suggested thatthe fragments causing the transits come from an asteroid that isfilling its critical potential surface at a relatively stable orbit aroundthe ‘A’-period. When the asteroid passes near its L1 point, fragmentsoccasionally break off and drift into a slightly inner orbit. The dustdisc is not well-constrained by the observations so far. Vanderburget al. (2015) argued that the detected amount of NIR excess indicatesthat an optically-thick dust disc could not be observed edge-on (i.e.it is misaligned with the transiting objects). However, Gary et al.(2017) counter that an edge-on optically-thick dust disc could yieldthe observed amount of NIR excess if it extends from the transitingobjects’ ‘A’-period orbit (∼ 94 RWD) to about 140 RWD. Zhou et al.(2016) argue for an edge-on optically-thin dust ring, located withinthe transiting objects’ orbital range (∼ 90− 100 RWD), based on thelack of optical reddening in the WD’s spectral energy distribution(SED). Our proposed configuration is consistent with such an edge-on dust ring scenario.
5 CONCLUSIONS
Using simultaneous multi-band fast photometry of the debris tran-sits around WD 1145+017, we have detected ‘bluing’ – deeper tran-sits in the redder bands – and not reddening, as commonly detectedin dusty environments. This bluing cannot be the result of limb dark-ening, since there seems to be no configuration that simultaneouslyyields the observed transit depth and the required amount of bluing.Bluing as a result of peculiar dust properties is a possible expla-nation, but marginally so, as it seems hard to find the fine-tunedgrain-size distribution that will simultaneously and precisely repro-duce the bluing observed between the various bands. The fact thatmost of the circumstellar absorption lines, which can be shallowerduring transits, are in the u’-band, appears to provide a plausibleexplanation for the excess blue flux. The bluing by the circumstellarlines, which can explain most or all of the observed photometriceffect, furthermore means that little or none of the effect remainsto be explained by peculiar dust or, in other words, peculiar dustwould predict bluing even larger than observed. In the circumstel-lar gas explanation, the requirements that the gas shares the debrisorbit’s inclination and that the gas only partly covers the lines of
MNRAS 000, 1–12 (2017)

8 N. Hallakoun et al.
sight to the WD surface, both suggest that the circumstellar gas isin a disc. This could be, in principle, the same disc in which residesthe debris (which produces the transits) or the dust (which producesa NIR excess). However, it is more likely to be a distinct disc, at asmaller orbital radius, based on the broadening of the circumstellarlines.
Our results indicate that the circumstellar gas affects the pho-tometric light curve, at least to some degree. Future simultaneousphotometric and spectroscopic observations of the system wouldclear up much of the uncertainty regarding the interpretation of thebluing.
The combined light curve of WD 1145+017, using our week-long monitoring campaign and the months-long light curve of Garyet al. (2017), reveals several intriguing features (most of them al-ready mentioned by Gary et al. 2017), described in Appendix B.These include the breaking up of the ‘A2’ group, the first detectionof the ‘B’-period, and the detection of smaller transits in the highsignal-to-noise ULTRACAM light curve. Our light curves are avail-able for further study upon request, in the hope that they will helpto constrain future dynamical models of the system.
ACKNOWLEDGEMENTS
We are indebted to Bruce L. Gary, Saul Rappaport, Tom Kaye,Roi Alonso, and Josch Hambsch for providing their WD 1145+017light curves and dip fit results. We thank the PIs, Michael Jura(U019), John Debes (U124D), and Ben Zuckerman (U067E), forproviding the Keck spectra of WD 1145+017 and sharing the re-sults of the preliminary analysis. We thank the anonymous refereefor valuable comments that improved this paper. We thank Bruce L.Gary, Saul Rappaport, Ferdinando Patat, Tsevi Mazeh, AlexandrosGianninas, Sahar Shahaf, Yakov Faerman, Stefan Jordan, and An-dreas Quirrenbach for useful discussions, the members of the VBOSteering Committee and the Time Allocation Committee (TAC),and the observing assistants: Mr G. Selvakumar, Mr S. Venkatesh,Mr S. Parthiban and Mr R. Rajini Rao. NH thanks Tamar Faran formoral support. This work was supported in part by Grant 1829/12 ofthe Israeli Centers for Research Excellence (I-CORE) programmeof the Planning and Budgeting Committee (PBC) and the IsraelScience Foundation (ISF) and by Grant 648/12 by the ISF (DM).The ULTRACAM team acknowledges the support of the Scienceand Technology Facilities Council (STFC). Based on observationsmade with ESO Telescopes at the La Silla Paranal Observatory un-der programme IDs 097.C-0829, 296.C-5024 and 296.C-5014. Thiswork makes use of observations from the LCO global telescope net-work. UKIRT is supported by NASA and operated under an agree-ment among the University of Hawaii, the University of Arizona,and Lockheed Martin Advanced Technology Center; operations areenabled through the cooperation of the East Asian Observatory.The UC Observatory Santa Martina was part of the photometricmonitoring campaign presented in this work. This work used theastronomy & astrophysics package for Matlab (Ofek 2014).
REFERENCES
Alonso R., Rappaport S., Deeg H. J., Palle E., 2016, A&A, 589, L6Althaus L. G., Córsico A. H., Isern J., García-Berro E., 2010, A&ARv, 18,
471Bohren C. F., Huffman D. R., 1983, Absorption and scattering of light by
small particles
Brogi M., Keller C. U., de Juan Ovelar M., Kenworthy M. A., de Kok R. J.,Min M., Snellen I. A. G., 2012, A&A, 545, L5
Croll B., et al., 2014, ApJ, 786, 100Croll B., et al., 2017, ApJ, 836, 82Dhillon V. S., et al., 2007, MNRAS, 378, 825Draine B. T., 2003, ApJ, 598, 1026Eastman J., Siverd R., Gaudi B. S., 2010, PASP, 122, 935Fedorova A. A., Montmessin F., Rodin A. V., Korablev O. I., Määttänen A.,
Maltagliati L., Bertaux J.-L., 2014, Icarus, 231, 239Gänsicke B. T., et al., 2016, ApJ, 818, L7Gary B. L., Rappaport S., Kaye T. G., Alonso R., Hambschs F.-J., 2017,
MNRAS, 465, 3267Gianninas A., Strickland B. D., Kilic M., Bergeron P., 2013, ApJ, 766, 3Hansen J. E., 1971, Journal of Atmospheric Sciences, 28, 1400Hansen J. E., Travis L. D., 1974, Space Sci. Rev., 16, 527Johnson P. B., Christy R. W., 1974, Phys. Rev. B, 9, 5056Jura M., 2003, ApJ, 584, L91Kilic M., von Hippel T., Leggett S. K., Winget D. E., 2006, ApJ, 646, 474Koester D., Gänsicke B. T., Farihi J., 2014, A&A, 566, A34Rappaport S., Gary B. L., Kaye T., Vanderburg A., Croll B., Benni P., Foote
J., 2016, MNRAS, 458, 3904Redfield S., Farihi J., Cauley P. W., Parsons S. G., Gaensicke B. T., Duvvuri
G., 2016, preprint, (arXiv:1608.00549)Shvartzvald Y., et al., 2016, MNRAS, 457, 4089Vanderburg A., et al., 2015, Nature, 526, 546Veras D., 2016, Royal Society Open Science, 3, 150571Veras D., Carter P. J., Leinhardt Z. M., Gänsicke B. T., 2017, MNRAS, 465,
1008Vogt S. S., et al., 1994, in Crawford D. L., Craine E. R., eds,
Proc. SPIEVol. 2198, Instrumentation in Astronomy VIII. p. 362,doi:10.1117/12.176725
Winn J. N., Fabrycky D. C., 2015, ARA&A, 53, 409Xu S., Jura M., Dufour P., Zuckerman B., 2016, ApJ, 816, L22Zhou G., et al., 2016, MNRAS,Zuckerman B., Koester D., Reid I. N., Hünsch M., 2003, ApJ, 596, 477Zuckerman B., Melis C., Klein B., Koester D., Jura M., 2010, ApJ, 722, 725
APPENDIX A: OBSERVING CONDITIONS DURING THE
ULTRACAM RUN AND THE REDUCTION PROCESS
Figs A1 and A2 show the observing conditions during the UL-TRACAM run, on 2016 April 21 and 26, as well as the reductionprocess described in Section 2. The sky transmission, reflected inthe light curve of the reference star, SDSS J114825.30+013342.2,shows some variable transmission (presumably passing clouds) onthe second night, although mostly not during transits. We estimatethe flux error as 1.48 times the median absolute deviation aroundthe median, using points outside of both the transits and the pass-ing clouds. On 2016 April 21 the errors were ∼ 4.2, ∼ 1.9, and∼ 2.5 per cent in the u’-, g’-, and r’-bands, respectively, while on2016 April 26 the errors were ∼ 2.5 per cent (u’-band), ∼ 1.5 percent (g’-band), and ∼ 2.3 per cent (i’-band). The target was ∼ 33◦
from the full Moon on the first night, and ∼ 93◦ on the second,contributing to the better signal-to-noise ratio on the second night.The improved signal-to-noise, which reveals finer details, explainsthe ‘wiggles’ seen in the out-of-transit parts of the 2016 April 26light curve. In addition, the passing clouds contributed to the scatterin some parts of the light curve, mostly out-of-transit.
APPENDIX B: LIGHT CURVE EVOLUTION
In parallel to our ULTRACAM observations we organised a mon-itoring campaign using various telescopes around the globe, in an
MNRAS 000, 1–12 (2017)

WD 1145+017: Bluing 9
Figure A1. Reduction process and observing conditions during the2016 April 21 ULTRACAM g’-band observations. From top to bot-tom: airmass; the point-source full width at half maximum; raw uncal-ibrated light curve of WD 1145+017; raw light curve of the referencestar, SDSS J114825.30+013342.2, showing the atmospheric transmission;WD 1145+017 light curve calibrated using the reference star (black),and the out-of-transit intervals (yellow) used for the parabolic fit (red);WD 1145+017 normalised light curve.
attempt to obtain the longest continuous time coverage possible inorder to follow the evolution of the light curve. A full list of theacquired light curves appears in Table B1. We used the observingfacilities listed below. Unless otherwise mentioned, the image re-duction and aperture photometry were done using the ULTRACAMpipeline (Dhillon et al. 2007), as described in Section 2.
Mauna Kea Observatory NIR J- and K-band fast photometrywas obtained using the WFCAM on the 3.8 m United KingdomInfra-Red Telescope (UKIRT) at the Mauna Kea Observatory,Hawai’i. The data were processed with pipelines from CambridgeAstronomical Survey Unit (CASU).ARIES Devasthal Observatory r’-band photometry was ob-
tained using the ANDOR 512 EMCCD on the 1.3 m DevasthalFast Optical telescope (DFOT) at the Aryabhatta Research Insti-tute of Observational Sciences (ARIES) Devasthal Observatory inNainital, India.Vainu Bappu Observatory R-band photometry was obtained us-
ing the Princeton Pro EM CCD on the 1.3 m J. C. BhattacharyyaTelescope (JCBT) at the Vainu Bappu Observatory (VBO) inKavalur, India.Wise Observatory We used the FLI camera on the 0.71 m C28
Jay Baum Rich telescope of the Wise Observatory in Israel. Thephotometry was obtained using the ExoP filter, a high-pass filterwith a cutoff around 5000 Å. The images were bias, dark and flatcorrected using iraf.
Figure A2. Same as Fig. A1, for 2016 April 26. Note the sharply fallingatmospheric transmission at several times (generally outside of transits, e.g.at MJDs ∼ 57505.05, 57505.11, and 57505.19), indicating passing clouds.
Ondřejov Observatory R-band photometry was obtained usingthe 0.65 m D65 telescope at the Ondřejov Observatory in the CzechRepublic. The image reduction (dark subtraction and sky flat cor-rection) and aperture photometry were done using the Ondřejovcustom-made software Aphot. A fixed aperture-size of 7 pixels(7.3 arcsec) was used. The light curves were calibrated using thethree brightest non-variable stars in the field.LCO global network We used the 1 m and 0.4 m Las Cumbres
Observatory (LCO) global telescope network to obtain unfilteredphotometry. The 1 m observations were performed using the kb70and kb78 SBIG CCDs on the cpt1m010 and lsc1m005 telescopesin Sutherland (CPT), South Africa, and in Cerro Tololo (LSC),Chile. The images were reduced by the BANZAI pipeline. The 0.4 mobservations were performed using the kb27 and kb84 SBIG CCDson the ogg0m406 and coj0m405 telescopes in Haleakala (OGG),Hawai’i, and in Siding Spring (COJ), Australia. The images werereduced by the ORAC-DR pipeline.UC Observatory We obtained i’-band photometry using the
SBIG STL-1001 3 CCD Camera on the 0.4 m Tololo 40 telescopeat the Pontificia Universidad Católica de Chile Observatory (UCO)in Lo Barnechea, Chile.
Combining all our light curves with those kindly provided byGary et al. (2017) results in a long-baseline light curve of about halfa year, with denser temporal coverage during our week-long moni-toring campaign. We converted the UT timestamps to Barycentric
MNRAS 000, 1–12 (2017)

10 N. Hallakoun et al.
Table B1. List of observations
Observatory Telescope size [m] Date [UT] Time [UT] Filter Exposure time [s] Cadence [s]
UKIRT 3.80 2016-04-16 06:14-08:36, 08:46-10:47, 11:00-11:12 J 10 12ARIES 1.30 2016-04-21 14:04-14:37, 15:38-18:32, 18:55-20:04 r’ 180 180Ondřejov 0.65 2016-04-21/22 19:07-00:16 R 180 186La Silla 3.58 2016-04-21/22 23:39-06:10 u’, g’, r’ 10, 5, 5 10, 5, 5
UKIRT 3.80 2016-04-22 06:19-10:47 J 10 12UKIRT 3.80 2016-04-23 06:11-07:59, 08:06-09:54 J 10 12ARIES 1.30 2016-04-23 13:56-14:00, 14:59-20:04 r’ 180 180ARIES 1.30 2016-04-23 14:08-14:10, 14:34-14:54 r’ 120 120ARIES 1.30 2016-04-23 14:16-14:32 r’ 90 90LCO CPT 1.00 2016-04-23 17:31-23:43 clear 60 80Wise 0.71 2016-04-23 19:39-22:47 ExoP 60 83ARIES 1.30 2016-04-24 13:51-18:41 r’ 90 90Wise 0.71 2016-04-24 17:23-21:50 ExoP 60 83ARIES 1.30 2016-04-24 18:44-20:12 r’ 180 180LCO OGG 0.40 2016-04-25 06:02-08:53 clear 270 280UKIRT 3.80 2016-04-25 06:04-08:17, 08:27-10:41 J 10 12LCO COJ 0.40 2016-04-25 09:02-09:35 clear 270 279ARIES 1.30 2016-04-25 13:52-18:23 r’ 60 60VBO 1.30 2016-04-25 15:18-17:50 R 600 600Wise 0.71 2016-04-25 17:30-21:40, 21:55-23:35 ExoP 60 83ARIES 1.30 2016-04-25 18:26-20:00 r’ 120 120Ondřejov 0.65 2016-04-25 19:18-23:19 R 180 186VBO 1.30 2016-04-26 14:01-19:37 R 900 900ARIES 1.30 2016-04-26 14:05-19:27, 19:33-20:17 r’ 60 60Ondřejov 0.65 2016-04-26 19:37-23:11 R 180 186La Silla 3.58 2016-04-26/27 23:15-05:55 u’, g’, i’ 10, 5, 5 10, 5, 5
LCO LSC 1.00 2016-04-26/27 23:45-23:59, 00:08-00:38, 00:54-00:56,01:12-01:22, 01:33-01:53, 02:13-03:26,03:35-04:44, 04:56-05:16
clear 60 84
UCO 0.40 2016-04-27 00:22-01:16 i’ 180 196UCO 0.40 2016-04-27 01:18-02:57 i’ 120 134LCO OGG 0.40 2016-04-27 06:02-08:53 clear 270 280LCO COJ 0.40 2016-04-27 09:02-10:53, 12:07-12:53 clear 270 279VBO 1.30 2016-04-27 14:23-16:56, 19:13-19:43 R 900 900Ondřejov 0.65 2016-04-27 19:46-20:54, 21:20-23:11, 23:45-23:55 R 180 186VBO 1.30 2016-04-28 13:54-19:17 R 600 600LCO OGG 0.40 2016-04-29 07:02-07:54, 10:02-10:54 clear 270 281UKIRT 3.80 2016-05-02 05:42-08:10, 08:18-10:45 K 10 34
Julian Dates (BJD) in Barycentric Dynamical Time (TDB) usingthe tool provided by Eastman et al. (2010)5.
Although the original K2 observations showed six stable peri-ods between ∼ 4.5 − 5 h, denoted ‘A’-‘F’ (Vanderburg et al. 2015),only the shortest, ‘A’-period (∼ 4.5 h), was detected in ground-basedfollow-up observations. Gary et al. (2017) reported the first ground-based detection of a longer-period dip feature, corresponding to the‘B’-period (∼ 4.6 h) of Vanderburg et al. (2015), starting on 2016April 26. During our own monitoring campaign, three distinctivedip groups were identified, each sharing a common period and aclose location in phase. Two of these groups, denoted ‘A1’ and ‘A2’in Figs 1 and 2, share a period close to the original K2 ‘A’-period:269.470 ± 0.005 min and 269.9 ± 0.3 min, respectively. These arethe groups denoted as ‘G6121’ and ‘G6420’ in Gary et al. (2017),indicating their first detection date (2016 January 21 and 2016 April20, respectively). The third group, denoted as ‘B’ in Fig. 2, corre-sponds to the ‘B-dip’ group of Gary et al. (2017), with a period
5 http://astroutils.astronomy.ohio-state.edu/time/
utc2bjd.html
of 276.40 ± 0.03 min, close to the original K2 ‘B’-period. Com-bining the light curves from our monitoring campaign with thoseprovided by Gary et al. (2017), we were able to further constrainthe appearance of the ‘B’ dip to 2016 April 24 (see Fig. B1). Sincethe light curve coverage was not complete on this date, we cannotidentify the exact appearance time of the ‘B’ dip. It was first de-tected around 2016 April 24 15:36 (BJD TDB), and might havebeen present already on 2016 April 24 06:22 (BJD TDB).
Figs B2, B3, and B4 present a ‘raw waterfall’ plot of thecombined light curve, for the ‘A1’, ‘A2’, and ‘B’ period, respectively.In a ‘raw waterfall’ the light curve is folded over the period, plottedagainst the actual timing of its sample points, and coloured by thenormalised flux (the bluer the lower). Thus, a raw waterfall plotof a dip feature with a constant period would appear as a straightvertical blue line. A non-vertical straight line pointing to the right(left) would imply that the plot is folded over a period shorter(longer) than the actual period of the dip. A curved line pointingto the right (left) would imply a gradually increasing (decreasing)period. The periods mentioned above were measured manually ‘byeye’ using the raw waterfall plots. The period uncertainty represents
MNRAS 000, 1–12 (2017)
WD 1145+017: Bluing 11
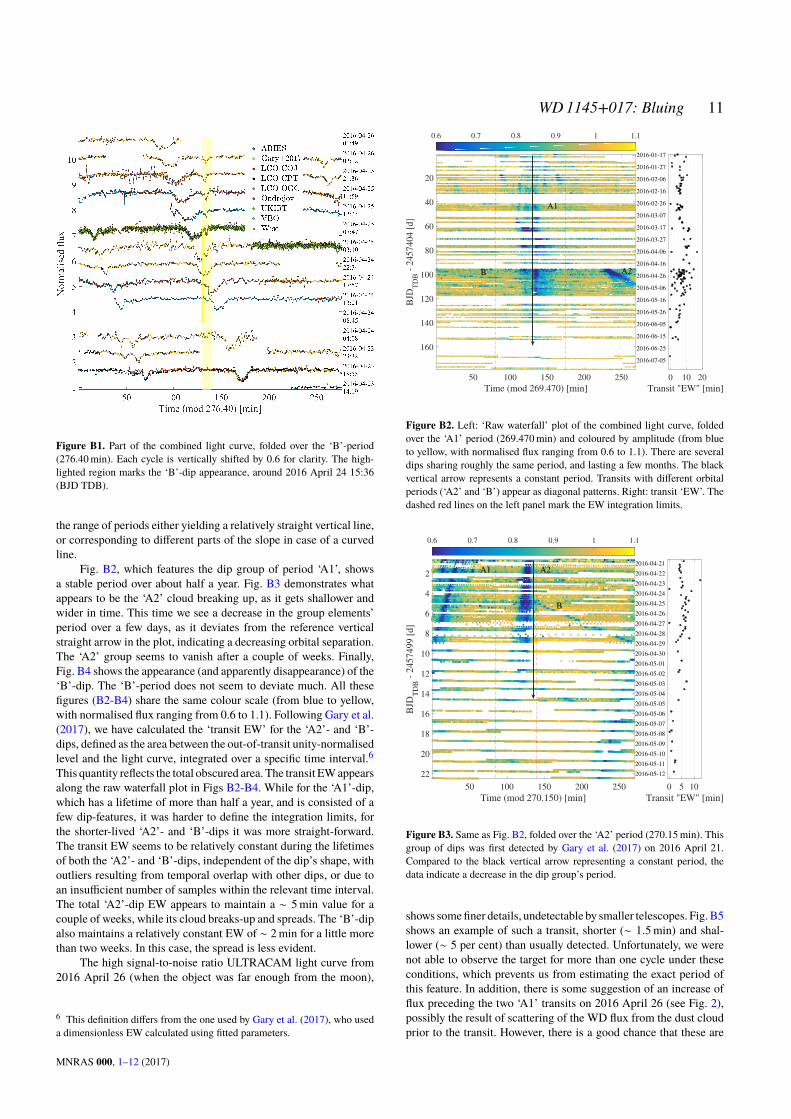
Figure B1. Part of the combined light curve, folded over the ‘B’-period(276.40 min). Each cycle is vertically shifted by 0.6 for clarity. The high-lighted region marks the ‘B’-dip appearance, around 2016 April 24 15:36(BJD TDB).
the range of periods either yielding a relatively straight vertical line,or corresponding to different parts of the slope in case of a curvedline.
Fig. B2, which features the dip group of period ‘A1’, showsa stable period over about half a year. Fig. B3 demonstrates whatappears to be the ‘A2’ cloud breaking up, as it gets shallower andwider in time. This time we see a decrease in the group elements’period over a few days, as it deviates from the reference verticalstraight arrow in the plot, indicating a decreasing orbital separation.The ‘A2’ group seems to vanish after a couple of weeks. Finally,Fig. B4 shows the appearance (and apparently disappearance) of the‘B’-dip. The ‘B’-period does not seem to deviate much. All thesefigures (B2-B4) share the same colour scale (from blue to yellow,with normalised flux ranging from 0.6 to 1.1). Following Gary et al.(2017), we have calculated the ‘transit EW’ for the ‘A2’- and ‘B’-dips, defined as the area between the out-of-transit unity-normalisedlevel and the light curve, integrated over a specific time interval.6
This quantity reflects the total obscured area. The transit EW appearsalong the raw waterfall plot in Figs B2-B4. While for the ‘A1’-dip,which has a lifetime of more than half a year, and is consisted of afew dip-features, it was harder to define the integration limits, forthe shorter-lived ‘A2’- and ‘B’-dips it was more straight-forward.The transit EW seems to be relatively constant during the lifetimesof both the ‘A2’- and ‘B’-dips, independent of the dip’s shape, withoutliers resulting from temporal overlap with other dips, or due toan insufficient number of samples within the relevant time interval.The total ‘A2’-dip EW appears to maintain a ∼ 5 min value for acouple of weeks, while its cloud breaks-up and spreads. The ‘B’-dipalso maintains a relatively constant EW of ∼ 2 min for a little morethan two weeks. In this case, the spread is less evident.
The high signal-to-noise ratio ULTRACAM light curve from2016 April 26 (when the object was far enough from the moon),
6 This definition differs from the one used by Gary et al. (2017), who useda dimensionless EW calculated using fitted parameters.
50 100 150 200 250
Time (mod 269.470) [min]
20
40
60
80
100
120
140
160
BJD
TD
B -
2457404 [
d]
2016-01-17
2016-01-27
2016-02-06
2016-02-16
2016-02-26
2016-03-07
2016-03-17
2016-03-27
2016-04-06
2016-04-16
2016-04-26
2016-05-06
2016-05-16
2016-05-26
2016-06-05
2016-06-15
2016-06-25
2016-07-05
A1
A2B
0.6 0.7 0.8 0.9 1 1.1
0 10 20
Transit "EW" [min]
Figure B2. Left: ‘Raw waterfall’ plot of the combined light curve, foldedover the ‘A1’ period (269.470 min) and coloured by amplitude (from blueto yellow, with normalised flux ranging from 0.6 to 1.1). There are severaldips sharing roughly the same period, and lasting a few months. The blackvertical arrow represents a constant period. Transits with different orbitalperiods (‘A2’ and ‘B’) appear as diagonal patterns. Right: transit ‘EW’. Thedashed red lines on the left panel mark the EW integration limits.
50 100 150 200 250
Time (mod 270.150) [min]
2
4
6
8
10
12
14
16
18
20
22
BJD
TD
B -
24
57
49
9 [
d]
2016-04-21
2016-04-22
2016-04-23
2016-04-24
2016-04-25
2016-04-26
2016-04-27
2016-04-28
2016-04-29
2016-04-30
2016-05-01
2016-05-02
2016-05-03
2016-05-04
2016-05-05
2016-05-06
2016-05-07
2016-05-08
2016-05-09
2016-05-10
2016-05-11
2016-05-12
A1 A2
B
0.6 0.7 0.8 0.9 1 1.1
0 5 10
Transit "EW" [min]
Figure B3. Same as Fig. B2, folded over the ‘A2’ period (270.15 min). Thisgroup of dips was first detected by Gary et al. (2017) on 2016 April 21.Compared to the black vertical arrow representing a constant period, thedata indicate a decrease in the dip group’s period.
shows some finer details, undetectable by smaller telescopes. Fig. B5shows an example of such a transit, shorter (∼ 1.5 min) and shal-lower (∼ 5 per cent) than usually detected. Unfortunately, we werenot able to observe the target for more than one cycle under theseconditions, which prevents us from estimating the exact period ofthis feature. In addition, there is some suggestion of an increase offlux preceding the two ‘A1’ transits on 2016 April 26 (see Fig. 2),possibly the result of scattering of the WD flux from the dust cloudprior to the transit. However, there is a good chance that these are
MNRAS 000, 1–12 (2017)

12 N. Hallakoun et al.
50 100 150 200 250
Time (mod 276.400) [min]
2
4
6
8
10
12
14
16
18
20
22
BJD
TD
B -
2457499 [
d]
2016-04-21
2016-04-22
2016-04-23
2016-04-24
2016-04-25
2016-04-26
2016-04-27
2016-04-28
2016-04-29
2016-04-30
2016-05-01
2016-05-02
2016-05-03
2016-05-04
2016-05-05
2016-05-06
2016-05-07
2016-05-08
2016-05-09
2016-05-10
2016-05-11
2016-05-12
A1 A2
B
0.6 0.7 0.8 0.9 1 1.1
0 2 4 6
Transit "EW" [min]
Figure B4. Same as Fig. B2, folded over the ‘B’ period (276.40 min).
0.568 0.569 0.57 0.571 0.572 0.573 0.574 0.575 0.576
BJDTDB
- 2457505
0.93
0.94
0.95
0.96
0.97
0.98
0.99
1
1.01
1.02
No
rmali
sed
flu
x
Figure B5. Part of our 2016 April 26 unbinned g’-band ULTRACAM lightcurve, showing an example of a smaller dip feature.
calibration artefacts resulting from the difficulty in defining theout-of-transit parts of the light curve, and they require further in-vestigation. If this flux excess is real, it might help to constrainthe dust grain-size distribution (e.g Brogi et al. 2012). As can beseen in Fig. 2, the out-of-transit area around the ‘A1’ group is quiteambiguous, indicating the presence of obscuring material, probablyoriginating from the same group. This is also evident in Fig. B2 bythe light blue regions surrounding the darker, deeper, transits of the‘A1’ group.
This paper has been typeset from a TEX/LATEX file prepared by the author.
MNRAS 000, 1–12 (2017)